DeepIEP: a Peptide Sequence Model of Isoelectric Point (IEP/pI) using Recurrent Neural Networks (RNNs)
Introduction
The isoelectric point (pI/IEP) of peptides and proteins is the pH value where the net charge on the molecular ensemble is zero. It is of practical interest in work involving peptide and proteins with regard to solubility/precipitation[1], separation for proteomics and elution in ion exchange chromatography[2, 3], in peptide drug design[4] and for understanding protein function[5]. Good models has long been available[6], as the pI can be obtained by merely counting the number of each type of amino acid, and knowing their pKa values, solve the Henderson-Hasselbalch equation to determine the pH where the overall charge is zero. The prediction is dependent on the pKa values chosen for the amino acid side chains and these are not the same in a peptide or protein as in bulk solution.[7] It has been a popular exercise to fine-tune these pKa-sets to obtain better pI models, and benchmarks of different pKa sets has been conducted[8, 9]. However, these models do not take sequence dependent and position effects into account. As examples, it is known that the clustering of e.g. acidic residues will lower their apparent pKa as their close proximity to each others charges will affect the deprotonation and hence calculation of pI values.[10] Additionally, it has been found that pKa values should be adjusted for amino acids at the C- or N- terminal, as the close proximity to the amino- or carboxylic acid from the ends of the main chain will affect the deprotonation and apparent pKa value. Although it is unclear if this is due to proximity to the terminal charge[10] or formation of artifacts such as pyroglutamate and pyroaspartate[11, 12]. To potentially solve these effects, specific pKa values for the terminal amino acids have been employed[10] as well as more advanced machine learning modes using SVMs[13] and including descriptors calculated with cheminformatics toolkits[14].
Having previously good experience with employing recurrent neural networks (RNNs) with long short-term memory cells (LSTM) to make regression models of serialized small molecules[15], it was obvious to try and employ the same model architecture to the natural sequences of amino acids in peptides. Previous work has been done with using artificial neural networks or recurrent neural networks to model protein and peptide properties and functions [16, 17, 18], but it is to my knowledge the first time this has been tried for prediction of pI. The model is trained directly from a database of sequences and their corresponding pI value, without any knowledge about pKa values of amino acids or the Henderson-Hasselbalch equation.
Methods
Datasets
The dataset was combined from two datasets[19, 20] derived from proteomics and a dataset extracted from Reaxys[21] as previously described[22], using the plain peptide sequences without modifications. The peptides in the proteomics studies[19, 20] were reacted with iodoacetamide and the cysteine characters C was substituted with Z. The pIs from the proteomics studies were set to the average of the gel fractions where the peptide was identified. After combination the datasets were randomly divided into a 90% train and 10% test set.
Vectorization
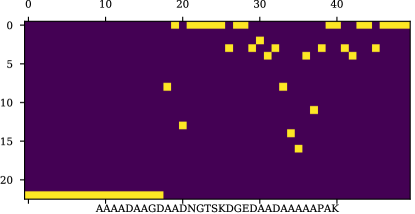
The amino acid sequences were converted to one-hot encoded vectors, where each row corresponded to an amino acid. The vectors were expanded to similar dimensions by padding with ones in a separate row. Before training the vectors were flipped along the sequence axis, so that the padding characters were the first and the encoded sequences the last. The amino acid sequence was thus flipped in the same operation, and the RNN network read the sequence from the C-terminal to the N-terminal.
Neural Network Modeling
An RNN model was constructed using Keras v. 2.1.1[23] and Tensorflow v. 1.4[24]. The first layer consisted of 200 LSTM cells[25], with a recurrent dropout of 0.3 and used in batch mode. The final internal C state was used as input to a dense layer of 100 neurons with the rectified linear unit activation function[26]. The output from the dense layer was connected to a single output neuron with a linear activation function.
The network was trained with mini-batches of 256 sequences for 300 epochs using the mean square error loss function and the Adam optimizer [27] with an initial learning rate of 0.005. The loss was followed on the test set and the learning rate lowered by a factor of two when no improvement in the test set loss had been observed for 15 epochs. Training took approximately a quarter of an hour.
After training in batch mode, a stateful model was constructed by creating a model with the exact same architecture but the LSTM states set to stateful and the input vector reduced to a size of one in the sequence dimension. After creation of the stateful model, the weights for the networks were copied from the batch model.
All computations and training were done on a Linux workstation (Ubuntu Mate 16.04) with 32 GB of ram, i5-2405S CPU @ 2.50GHz and an Nvidia Geforce GTX 1060 graphics card with 6 GB of ram.
Results
Loading and vectorization of the pI dataset resulted in vectors with the shapes and (7364, 50, 23) and (734, 50, 23) for the train and test set. The shape is Samples, Sequence, Features (amino acids + padding). An example of a one-hot encoded peptide is shown in Figure 1.
The training loss and validation loss improved and plateaued out over the course of training as shown in Figure 2.

There is no sign of over training as there is no rise in the validation loss function towards the end of training. The final losses were 0.029 and 0.078, for the training and test (validation) loss, respectively. The spatial difference between the final loss on the test and training sets appear enlarged due to the logarithmic Y-axis, but makes it easier to visually see that the training have fully converged.
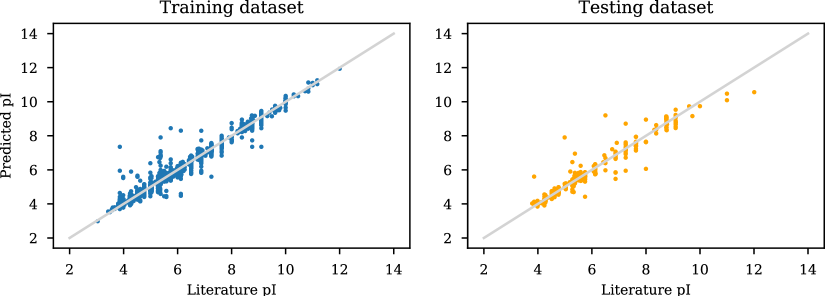
The pIs of the training and test sequences were predicted with the final model and used in scatter plots and for calculating the root mean square error (RMSE) and correlation coefficient (R2). (Figure 3 and Table 1).
| Dataset | RMSE | R2 |
|---|---|---|
| Train | 0.17 | 0.98 |
| Test | 0.28 | 0.95 |
Challenging with constructed sequences
The model was challenged with designed peptide sequences in the hope to elucidate the effects of amino acid type, position and neighbor sequence. The normal acidic and basic amino acids was put in the middle of an alanine peptide sequence and the pI predicted. The predicted pI is compared to the side chains pKa value in Table 2.
| Sequence | pKa[28] | predicted pI |
|---|---|---|
| AAAAADAAAAA | 4 | 4.23 |
| AAAAAEAAAAA | 4.4 | 4.35 |
| AAAAAHAAAAA | 6.8 | 7.05 |
| AAAAACAAAAA | 8.3 | 6.08 |
| AAAAAKAAAAA | 10.4 | 8.35 |
| AAAAARAAAAA | 13.5 | 8.82 |
Standard one-letter amino acid codes are used. The predicted pI should be a balance between the N- and C- terminal groups and the acidic and basic side chains. The changes in pI observed, largely follows the ranking observed for the pKa values, with cysteine (C) as an outlier.
Table 3 shows the effect of placing the amino acids in the N and C-terminal respectively, using glutamate (E) and lysine (K) as examples of an acidic or basic amino acid respectively.
| Sequence | predicted pI |
|---|---|
| AAAAAEAAAAA | 4.35 |
| EAAAAAAAAAA | 4.11 |
| AAAAAAAAAAE | 4.52 |
| AAAAAKAAAAA | 8.35 |
| KAAAAAAAAAA | 8.65 |
| AAAAAAAAAAK | 8.46 |
The expectation is that the proximity to the N terminal amino group or C terminal carboxylic acid moiety, would affect the observed pKa and thus charge of the side chain either up and down with subsequent adjustments of the predicted pI. For the glutamate the pI is lowered when placed in the N-terminal end and higher when placed in the C-terminal end (to the right). The proximity between the carboxylic acid moiety of the and the N-terminal ammonium groups positive charge, should make deprotonation more likely at lower pH, and thus lower the pI as also observed. The effect is opposite in the other end as also expected. For the ammonium group of lysine, the effect is reversed.
Some examples of the effect of clustering charged amino acids on the predicted pI is shown in Table 4.
| Sequence | predicted pI |
|---|---|
| AAAADDDAAAA | 3.66 |
| AADAADAADAA | 3.68 |
| AAAAKKKAAAA | 8.57 |
| AAKAAKAAKAA | 9.22 |
| AAAARRRAAAA | 10.78 |
| AARAARAARAA | 10.92 |
| AEAEAAAAKAA | 4.58 |
| AEAAAEKAAAA | 4.56 |
The argumentation is as above, that the proximity of the same charged amino acids will diminish their acid/base strength. Clustering the aspartate (D) side chains make the predicted pH slightly higher, where the lowering of the predicted pI for the basic amino acids (K and R) is more pronounced. Placing opposite charged side chains besides each other, enhances the effect of the one closest to the predicted pI as also observed in the two bottom rows of Table 4.
Prediction in stateful mode
The batch trained model was converted into a stateful model, which do not predict on a sequence, but rather predicts the pI by being presented one amino acid at a time, with the current prediction being affected by the previous predictions via the internal states of the LSTM cells. This allows a prediction profile to be obtained by iterating over the amino acids in a sequence and following the predicted pI. An example of such a prediction profile is shown in Figure 4.
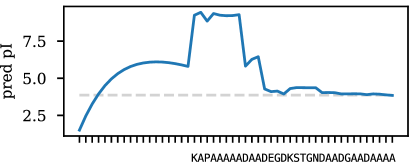
An initial adjustment is observed in the padding phase, but as soon as an amino acid is encountered (here lysine, K), the pI jumps up. The pI is largely kept until an acidic aspartate (D) is encountered. The next aspartate leads to a further drop in pI, but not as pronounced. After this adjustment the pI is largely unaffected by the remainder of the encountered acidic aspartates or amino acids without pronounced acid/base properties.
The initial changes observed during the padding phase, suggests that the prediction could be influences by the length of the padding (first part of Figure 4). The model was used for prediction of the same peptide sequence with varying lengths of padding. The result is shown in Figure 5.
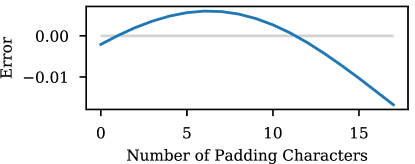
It has a clear effect on the prediction, suggesting that the model has fine-tuned the prediction based on the size of the peptide, although for this example, it would have been beneficial to remove the padding sequence. The error is however in the low range on the second decimal of the pI prediction.
Discussion
Benchmarks of pI calculation pKa sets and pI prediction algorithms find RMSEs in the range 0.21 to 2.0[8, 9]. However, comparison of the datasets published used by Koslowski[9] on the website[29], with the original data[19, 20], show that he used the predicted pI from the supplementary information and not the experimentally related average of the gel fractions, which invalidates the hard work with the benchmark and the tuning of pKa values. An advanced SVM model obtains RMSE on a test set of 0.21[8], but the SVM model had originally[14] been tuned on part of the dataset that comprised the benchmark, and the performance is likely overestimated. The originally RMSE found was 0.32[14]. It thus appears that the approach using RNNs with LSTM cells reach a performance at least on par with previous methods.
The effect on apparent pKa of glutamate placed at the termini was studied by Cargile and coworkers, who used a genetic algorithm to adjust pKa values based on proximity to the terminals and other charged residues. They found corrections in the range -0.414 for the N-terminus and 0.014 for the C-terminus. However, this can’t be directly compared to the pI shift of -0.24 and 0.17 observed with the RNN (c.f. Table 3), as one is calculated on the pKa level and the other directly on the predicted pI. The trend is nevertheless the same and it appears that the neural network has implicitly incorporated the same necessary correction due to the position of the glutamate residue.
A problem with the use of data driven approach could be that the experimental values in databases are not of relevance. An example could be that iodoacetamide peptide sequences are reported and stored as if they had free cysteine side chains[10, 19, 20, 9]. Another common problem, seem to be that the databases gets polluted by predicted values from existing models, as it is not always clear in scientific literature if the pI is predicted or measured. This could likely pose a problem for a data driven approach as employed here. However, the model obtained from the data driven approach would then represent a consensus model of several different models and tuned pKa sets employed, which could lead to an overall better performance of the new model due to meta-effects. If only one method had been employed to derive the pIs for the data driven approach, the new model would surely regress towards the existing model entirely. Some of the dataset is also derived from proteomics studies[19, 2, 20], where the data has also been filtered with regard to the position in the isoelectric focusing gel and its deviance from the theoretically predicted value. This also introduces a bias towards the existing models, which could likely improve the results, as this filtering will affect both the training and test set. If the dataset is polluted by predicted pI values and/or filtered based on predicted values real world performance of the algorithm would likely be lower than here observed.
Being a data driven approach, rather than a model based approach, the method could likely be sensitive to peptide sequence distributions and unusual local sequences. The database consists of peptides measured with isoelectric focusing and results from proteomics, which are probably mostly of eukaryotic and procariotic origin. If peptides following a different amino acid distribution or being of very low homology to the ones in the training set (such as from Archea or constructed peptides) the prediction error could likely be higher. However, as the model seem mostly influenced by the amino acids with known acid-base properties (c.f. Figure 4), the rise in error could possibly be low. This error could maybe be estimated by division of the whole peptide dataset into a training and test set based on clusters found by clustering by sequence homology and redoing the training and testing.
A better curated or un-biased dataset could likely lead to an increase in model accuracy and maybe precision. Other improvements could be the inclusion of modifications if enough data could be collected. For pIs of peptides with phosphorylated threonines/serines and acetylated/amidated terminals, this data seems available[19].
Conclusion
The feasibility of data driven modeling of peptide isoelectric point with RNNs has been demonstrated. The model obtained seems on par with literature sources, illustrating the promise of the approach. However, the performance of the model is likely overestimated due to shortcomings of the underlying dataset. The model is mostly influenced by the existence of amino acids with known acidic and basic properties with minor corrections due to position in the chain and nearby amino acids. Running the model in a stateful mode gives a minor error when removing the padding sequence. A release of the source code and trained weights on the authors GitHub profile is planned.
Conflict of interests
E. J. Bjerrum is the owner of Wildcard Pharmaceutical Consulting. The company is usually contracted by biotechnology/pharmaceutical companies to provide third party services.
References
- [1] J. V. Olsen, M. Mann, Status of large-scale analysis of post-translational modifications by mass spectrometry., Mol. Cell. Proteomics 12 (2013) 3444–3452. doi:10.1074/mcp.O113.034181.
-
[2]
J. Krijgsveld, S. Gauci, W. Dormeyer, A. J. R. Heck,
In-gel isoelectric focusing of
peptides as a tool for improved protein identification., J. Proteome Res.
5 (7) (2006) 1721–1730.
doi:10.1021/pr0601180.
URL http://dx.doi.org/10.1021/pr0601180 - [3] R. Millioni, C. Franchin, P. Tessari, R. Polati, D. Cecconi, G. Arrigoni, Pros and cons of peptide isolectric focusing in shotgun proteomics., J. Chromatogr. A 1293 (2013) 1–9. doi:10.1016/j.chroma.2013.03.073.
- [4] K. Fosgerau, T. Hoffmann, Peptide therapeutics: Current status and future directions., Drug Discovery Today 20 (2015) 122–128. doi:10.1016/j.drudis.2014.10.003.
- [5] F. M. A. H. Schuurmans Stekhoven, M. H. A. G. Gorissen, G. Flik, The isoelectric point, a key to understanding a variety of biochemical problems: a minireview., Fish Physiol. Biochem. 34 (2008) 1–8. doi:10.1007/s10695-007-9145-6.
- [6] B. Bjellqvist, G. J. Hughes, C. Pasquali, N. Paquet, F. Ravier, J. C. Sanchez, S. Frutiger, D. Hochstrasser, The focusing positions of polypeptides in immobilized ph gradients can be predicted from their amino acid sequences., Electrophoresis 14 (1993) 1023–1031.
- [7] G. R. Grimsley, J. M. Scholtz, C. N. Pace, A summary of the measured pk values of the ionizable groups in folded proteins., Protein Sci. 18 (2009) 247–251. doi:10.1002/pro.19.
-
[8]
E. Audain, Y. Ramos, H. Hermjakob, D. R. Flower, Y. Perez-Riverol,
Accurate estimation of
isoelectric point of protein and peptide based on amino acid sequences.,
Bioinformatics 32 (6) (2016) 821–827.
doi:10.1093/bioinformatics/btv674.
URL http://dx.doi.org/10.1093/bioinformatics/btv674 - [9] L. P. Kozlowski, Ipc - isoelectric point calculator., Biol. Direct 11 (2016) 55. doi:10.1186/s13062-016-0159-9.
- [10] B. J. Cargile, J. R. Sevinsky, A. S. Essader, J. P. Eu, J. L. Stephenson, Calculation of the isoelectric point of tryptic peptides in the ph 3.5-4.5 range based on adjacent amino acid effects., Electrophoresis 29 (2008) 2768–2778. doi:10.1002/elps.200700701.
- [11] J. Lengqvist, H. Eriksson, M. Gry, K. Uhlén, C. Björklund, B. Bjellqvist, P.-J. Jakobsson, J. Lehtiö, Observed peptide pi and retention time shifts as a result of post-translational modifications in multidimensional separations using narrow-range ipg-ief., Amino Acids 40 (2011) 697–711. doi:10.1007/s00726-010-0704-2.
- [12] X. Zhang, P. Højrup, Cyclization of the n-terminal x-asn-gly motif during sample preparation for bottom-up proteomics., Anal. Chem. 82 (2010) 8680–8685. doi:10.1021/ac1019478.
-
[13]
R. M. M. Branca, L. M. Orre, H. J. Johansson, V. Granholm, M. Huss,
A. Pérez-Bercoff, J. Forshed, L. Käll, J. Lehtiö,
Hirief LC-ms enables deep
proteome coverage and unbiased proteogenomics, Nat. Methods 11 (1) (2013)
59–62.
doi:10.1038/nmeth.2732.
URL http://dx.doi.org/10.1038/nmeth.2732 - [14] Y. Perez-Riverol, E. Audain, A. Millan, Y. Ramos, A. Sanchez, J. A. Vizcaíno, R. Wang, M. Müller, Y. J. Machado, L. H. Betancourt, et al., Isoelectric point optimization using peptide descriptors and support vector machines, Journal of proteomics 75 (7) (2012) 2269–2274.
- [15] E. J. Bjerrum, Smiles enumeration as data augmentation for neural network modeling of molecules, arXiv preprint arXiv:1703.07076.
- [16] X. Liu, Deep recurrent neural network for protein function prediction from sequence, arXiv preprint arXiv:1701.08318.
- [17] S. Mittermayr, M. Olajos, T. Chovan, G. Bonn, A. Guttman, Mobility modeling of peptides in capillary electrophoresis, TrAC Trends in Analytical Chemistry 27 (5) (2008) 407–417.
- [18] S. Wang, J. Peng, J. Ma, J. Xu, Protein secondary structure prediction using deep convolutional neural fields, Scientific reports 6.
-
[19]
S. Gauci, B. van Breukelen, S. M. Lemeer, J. Krijgsveld, A. J. R. Heck,
A versatile peptide pi
calculator for phosphorylated and n-terminal acetylated peptides
experimentally tested using peptide isoelectric focusing., Proteomics
8 (23-24) (2008) 4898–4906.
doi:10.1002/pmic.200800295.
URL http://dx.doi.org/10.1002/pmic.200800295 -
[20]
M. Heller, M. Ye, P. E. Michel, P. Morier, D. Stalder, M. A. Jünger,
R. Aebersold, F. Reymond, J. S. Rossier,
Added value for tandem mass
spectrometry shotgun proteomics data validation through isoelectric focusing
of peptides., J. Proteome Res. 4 (6) (2005) 2273–2282.
doi:10.1021/pr050193v.
URL http://dx.doi.org/10.1021/pr050193v -
[21]
Reaxys, version 2.20770.1 (2016).
URL http://www.reaxys.com - [22] E. J. Bjerrum, J. H. Jensen, J. L. Tolborg, picalculax: Improved prediction of isoelectric point for modified peptides, Journal of chemical information and modeling 57 (8) (2017) 1723–1727.
- [23] F. Chollet, keras, https://github.com/fchollet/keras (2015).
- [24] M. Abadi, A. Agarwal, P. Barham, E. Brevdo, Z. Chen, C. Citro, G. Corrado, A. Davis, J. Dean, M. Devin, et al., Tensorflow: Large-scale machine learning on heterogeneous distributed systems. 2016, arXiv preprint arXiv:1603.04467.
- [25] S. Hochreiter, J. Schmidhuber, Long short-term memory, Neural computation 9 (8) (1997) 1735–1780.
- [26] V. Nair, G. E. Hinton, Rectified linear units improve restricted boltzmann machines, in: Proceedings of the 27th international conference on machine learning (ICML-10), 2010, pp. 807–814.
- [27] D. Kingma, J. Ba, Adam: A method for stochastic optimization, arXiv preprint arXiv:1412.6980.
- [28] M. A. Hass, F. A. Mulder, Contemporary nmr studies of protein electrostatics, Annual review of biophysics 44 (2015) 53–75.
- [29] Protein isoelectric point calculator, http://isoelectric.ovh.org/datasets.html (Dec. 2017).