An experimental water line list at 1950 K in the 6250 – 6670 cm-1 region
Abstract
An absorption spectrum of H216O at 1950 K is recorded in a premixed methane/air flat flame using a cavity-enhanced optical frequency comb-based Fourier transform spectrometer. 2417 absorption lines are identified in the 6250 – 6670 cm-1 region with an accuracy of about 0.01 cm-1. Absolute line intensities are retrieved using temperature and concentration values obtained by tunable diode laser absorption spectroscopy. Line assignments are made using a combination of empirically known energy levels and predictions from the new POKAZATEL variational line list. 2030 of the observed lines are assigned to 2937 transitions, once blends are taken into account. 126 new energy levels of H216O are identified. The assigned transitions belong to 136 bands and span rotational states up to .
keywords:
water , absorption , Fourier transform spectroscopy, optical cavity , frequency comb , ab initio calculations1 Introduction
Water is ubiquitous and its spectrum is important for a whole range of terrestrial and astronomical applications. Serious attempts have been made to characterize the spectrum of hot water both experimentally by observation of spectra [1, 2, 3, 4, 5, 6, 7, 8, 9, 10, 11, 12, 13, 14, 15, 16, 17] and theoretically by the computation of extensive line lists [18, 19, 20, 21, 22, 23, 24]. These line lists are used to inform databases concerned with models of hot bodies such as HITEMP [25] and ExoMol [26, 27]. A comprehensive assessment of water spectroscopy was undertaken by an IUPAC task group [28, 29] whose work is currently being updated [30].
The ubiquity of water means that understanding its spectrum at all wavelengths and temperatures is always important. The spectrum of hot water is of particular interest in regions were absorption by room temperature water is weak. The present work concentrates on one such region as it probes the spectrum of hot water in the conventional telecom window (1.53 – 1.565 m) as well as the astronomers H-band (1.5 – 1.8 m). These regions are useful for remote sensing of hot water spectra due to the reduced atmospheric absorption. Previous high-temperature water spectra analyzed for this region [31, 32, 33, 34, 35, 10, 12, 13] were recorded in emission in flames at atmospheric pressure at moderate spectral resolution; in addition, due to the lack of thermal stability, these spectra did not provide usable information on the line intensities.
This paper presents a high temperature water absorption spectrum measured at Umeå University. The spectrum is measured in a premixed methane/air flat flame at atmospheric pressure using a cavity-enhanced optical frequency comb-based Fourier transform spectrometer (FTS) [36]. The combination of an FTS with a frequency comb allows the measurement of broadband and high resolution molecular spectra in short acquisition times and without visible influence of the instrumental line shape [37, 38], while the cavity provides high sensitivity to absorption [39]. The ability to measure the present spectrum simultaneously over a broad bandwidth reduces systematic errors and the influence of fluctuations of the environmental conditions. The spectrum is recorded at high resolution (0.033 cm-1) in the near-infrared 6250 – 6670 cm-1 region, and line positions are identified with an accuracy of 0.01 cm-1. Knowledge of the temperature and water concentration, which have previously been measured for that specific burner by Qu et al. [40] using tunable diode laser absorption spectroscopy, as well as the thermally stable conditions, allow absolute line intensities to be determined.
The measured absorption spectrum is compared to the newly computed POKAZATEL hot line list [24] augmented by the inclusion of empirical energy levels [28]. This comparison allows us to assess both the contents of the measured spectrum and the reliability of the computed line list. The POKAZATEL line list is then used to make assignments to the spectrum resulting in a significant number of newly identified transitions and energy levels.
The following two sections of the paper describe the experimental set-up and results. Section 4 presents the experimental water line list. Comparisons with the computed line lists, particularly the most recent one [24], are given in section 5, followed by conclusions in section 6.
2 Experimental setup
The experimental setup is described in detail in references [36, 41] and is therefore only briefly summarized here. The spectrometer consists of an Er:fiber femtosecond laser with a repetition rate of 250 MHz (0.0083 cm-1), a 60 cm long enhancement cavity with a finesse of around 150, and a fast-scanning Fourier transform spectrometer (FTS). The comb is locked to the cavity using the two-point Pound-Drever-Hall method [39, 42] with locking points at 6330 and 6450 cm-1. The cavity is open to air, and a flat flame burner [43] is placed in its center. The burner is operated on premixed methane/air at stoichiometric ratio with a total flow rate of 10 L/min. The comb beam probes the line of sight in the flame (flame diameter of 3.8 cm) at atmospheric pressure and at a height above the burner (HAB) of 2.5 mm. At this HAB the temperature and species are rather homogeneously distributed along the line of sight [40, 43], the average flame temperature is K, the average water concentration is % (both characterized using tunable diode laser absorption spectroscopy [40]), and the average hydroxide (OH) concentration is 0.28% [41].
The light transmitted through the cavity is coupled into an optical fiber connected to the input of a fast-scanning FTS with an auto-balancing detector that acquires a spectrum with 0.033 cm-1 resolution in 0.4 s. The optical path difference is calibrated using a stabilized HeNe laser whose beam is co-propagating with the comb beam in the FTS. The wavelength of the HeNe laser is calibrated by comparing the positions of the OH lines in the spectrum to the line positions in the 2012 edition of the HITRAN database [44]. The standard deviation of the relative difference between the experimental and HITRAN OH line positions is 0.0076 cm-1. Since HITRAN does not contain data on the pressure shift of the OH lines, we estimate the shift to be 10% of the pressure broadening at atmospheric pressure, i.e. 0.007 cm-1. Thus we estimate the frequency accuracy of the spectrum is 0.01 cm-1. The high-temperature spectrum is averaged 20 times and normalized to a background spectrum measured when the flame is off. The baseline is additionally corrected for slowly varying etalons fringes.
We note that the influence of broadband flame emission can be neglected since the probablity of emission into the cavity mode is low and the cavity thus acts as an effective filter. Moreover, the collimator for coupling the cavity transmitted light into the fiber does not face the flame and is placed few tens of cm away from the flame, where the intensity of emission is already very low.
3 Cavity-enhanced absorption spectrum
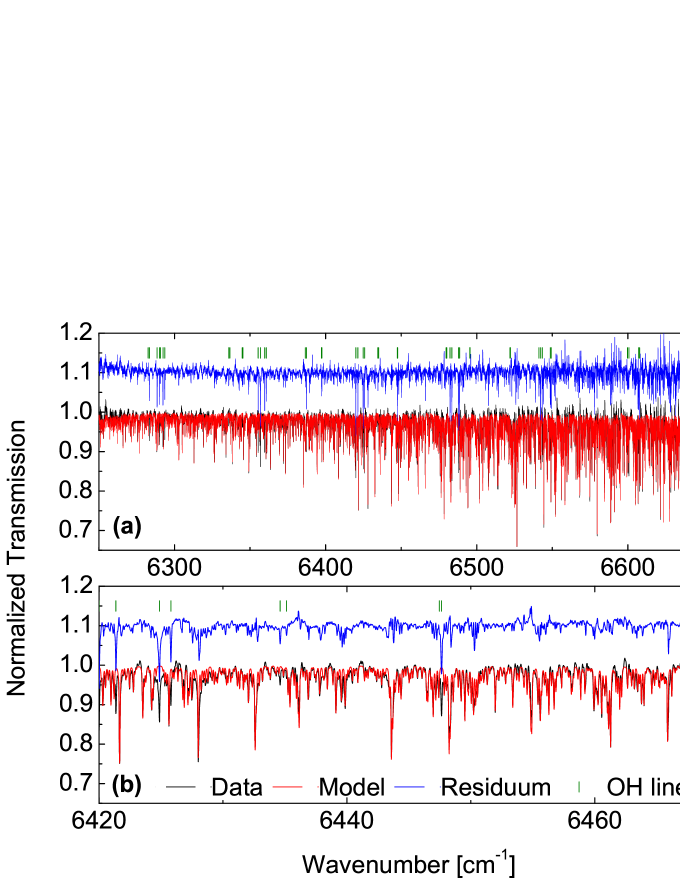
The normalized transmission spectrum measured in the flame is shown in Fig. 1(a). To extract the absorption coefficient from this spectrum, we use the model for the transmission, , given by Foltynowicz et al. [42]
| (1) |
where is the interaction length between the light and the sample (i.e. the flame diameter), is the frequency-dependent intensity reflection coefficient of the cavity mirrors, determined experimentally by cavity ringdown, and are the molecular absorption and dispersion coefficients, respectively, and is the round-trip phase shift in the cavity. The round-trip intracavity phase shift is equal to a multiple of for comb lines locked to the centers of the corresponding cavity modes. Because of the intracavity dispersion, caused by the cavity mirror coatings as well as the gas sample inside the cavity, the cavity modes are not equally spaced and only the comb lines around the locking points are exactly on resonance with their corresponding cavity modes [42]. However, because of the low cavity finesse, the relative comb-cavity offset is small in the entire spectral range of the comb, and the intracavity phase shift can be set to , or zero. To extract the absorption coefficient from Eq. (1) we also neglect the molecular dispersion, since then the equation can be solved analytically. This approximation gives correct values for on-resonance absorption coefficients, since molecular dispersion is equal to zero at these frequencies.
The absorption spectrum obtained using the analytical solution to Eq. (1) with molecular and cavity dispersion put to zero is plotted in Fig. 1(b). The noise on the baseline is cm-1, which translates into a signal-to-noise ratio (SNR) of 2400 for the strongest lines. The negative absorption values and the slight line asymmetry at frequencies above 6550 cm-1 are caused by the neglected comb-cavity offset, which increases away from the locking points [42].

4 Experimental water line list
The center frequencies of absorption lines are found by taking the first derivative of the absorption spectrum [Fig. 1(b)] and finding the points where it crosses zero. Most of the absorption lines are water transitions but the spectrum contains also several OH transitions [41]. The OH transition frequencies, identified using the 2012 edition of the HITRAN database [44], as well as water lines less than 0.02 cm-1 away from an OH line, are removed from the list. The precision of the center frequencies is below 0.0005 cm-1 for most lines, limited by the line width of the molecular lines (0.7 cm-1) and the SNR of up to 2400. The accuracy is limited to 0.01 cm-1 by the HeNe wavelength calibration. It should be emphasized that positions of overlapping water lines, i.e. those separated by less than the line width, cannot be identified using this method. Note also that the transition frequencies are at atmospheric pressure.
The experimental line intensities, , are calculated from the value of absorption corresponding to each center frequency, using
| (2) |
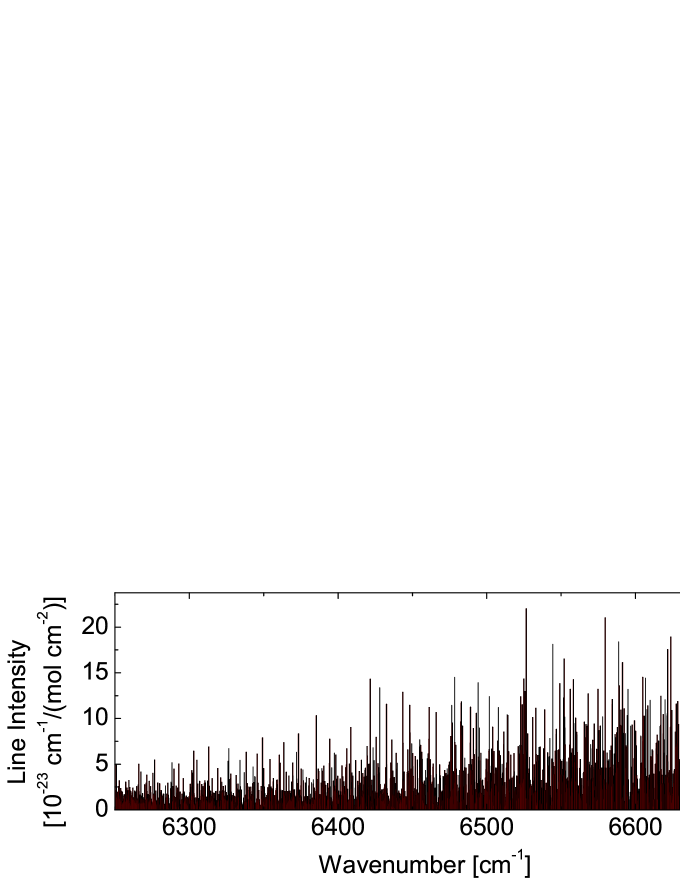
where is the peak (on-resonance) value of the Voigt profile (in cm), and is water density at the temperature (equal to molecule/cm3 for K and [H2O]=17%). Since no data exists for the pressure broadening parameter of water at these temperatures, we assume a Lorentzian half width of 0.027 cm-1for all lines, as it matches relatively well to the data. The Doppler half width varies from 0.0237 to 0.0253 cm-1across the spectrum. The experimental line list contains 2417 lines; it is plotted in Fig. 2 and given in the supplementary information. The lowest line intensity that can be identified is cm/molecule, limited by the SNR in the spectrum. The uncertainty in the intensity is 6% for the strongest lines, limited mainly by the uncertainty in the water concentration, and increases for weaker lines because of the lower SNR.
To illustrate the accuracy of the experimental line list, Fig. 3(a) shows a comparison between the experimental transmission spectrum (black) and a spectrum simulated using Eq. (1) with the experimental line list, Voigt profiles with a Lorentzian half width of 0.027 cm-1and the intracavity round-trip phase shift put to zero (red). The difference between the measurement and the model is plotted in blue (vertically offset for clarity). The green vertical lines mark the positions of OH lines. Figure 3(b) shows a zoom of the spectrum around one of the locking points, i.e. where the comb-cavity offset is zero. The structure in the residuum at the frequencies marked in green comes from the OH lines that are removed from the line list. The discrepancies visible at other frequencies are caused mainly by an incorrect Lorentzian width and by the remaining water lines that could not be taken into account in the line list because of their strong overlap with other lines. The amplitude of the residual increases for higher wavenumbers since the comb-cavity offset increases away from the locking points.
5 Line assignment
The spectral analysis of the experimental line list was performed using the recently computed POKAZATEL hot line list [24] with energies replaced by empirical energy levels [28]. These empirical levels come from the recent IUPAC-sponsored study of water spectra [29] in which the MARVEL (measured active vibration-rotation energy levels) [45, 46] procedure was used to invert measured line frequencies to obtain empirical energy levels; below, this line list is refered to as MARVEL-POKAZATEL. Using the MARVEL-POKAZATEL line list to generate a water absorption spectrum at 1950 K in the experimental wavelength range leads to about 20 000 lines with intensities between 10-22 and 10-25 cm/molecule, which corresponds to the experimental intensity range.
The first step in the spectral analysis involved making a so-called trivial assignment, that is identifying lines for which both upper and lower state energy levels as well as frequencies are already known empirically. We assumed a match between MARVEL and experimental frequencies if they differ by less than about 0.03 cm-1, which reflects the average line width at atmospheric pressure of about 0.07 cm-1and the accuracy of hot MARVEL levels which is about 0.02 cm-1. About 1900 lines were trivially assigned by this method with about half of them being identified as blends, that is two or more MARVEL transitions associated with one experimental line.
The second step in the spectral analysis was assignment of the remaining stronger lines that were not trivially using the POKAZATEL line list. The trivially-assigned lines were also considered to be unassigned during this second step if their calculated intensity was less than half of the measured one. We only considered stronger theoretical lines with calculated intensities higher than 10-23 cm/molecule. We concentrated on identifying those transitions which involved upper levels with quantum numbers close to MARVEL levels. This allowed us to estimate the expected observed minus calculated residue for the upper level using the difference between known MARVEL levels and levels predicted by the original POKAZATEL line list. This method of tracking states with nearby quantum numbers is sometimes known as the method of branches [4, 47]; it works best for the relatively rare, stronger experimental lines. Use of this method led to the assignment of about 300 further lines, providing information on 126 new energy levels. We note that this method also implicitly provides the vibrational quantum numbers for the newly assigned levels. As a result 2030 lines out of the observed 2417 lines from the experimental line list, i.e. almost 84%, are assigned. When blends are considered, the total number of assigned lines is 2937. Some of the unassigned lines may be attributable to other species present in the flame, such as CO or CO2. For example the spectrum covers the region of the CO second overtone. However, attempts to model CO and CO2 lines in this region did not produce clear matches.
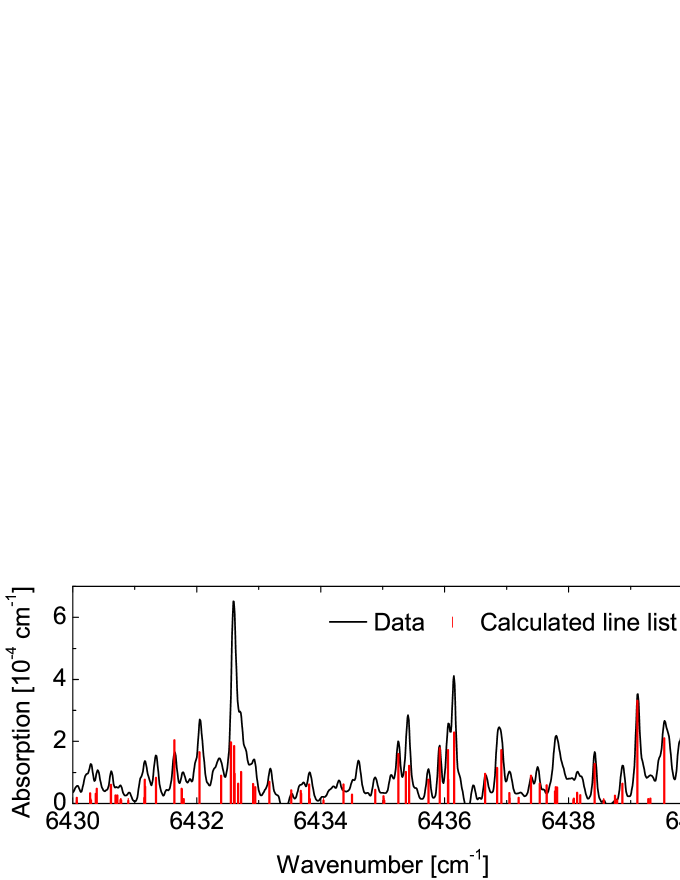
Figure 4 shows 10 cm-1 of the measured spectrum around 6435 cm-1 compared to the calculated line list and illustrates situations when multiple lines are associated with a single observed feature. For example, the strong, broad feature at 6432.6 cm-1 consists of at least three actual transitions, however in the experimental line list these transitions are represented by a single line at the strongest peak at 6432.595 cm-1. We assigned 3 MARVEL lines to this feature; these lines have a summed intensity about 65% of the measured integral intensity of the feature, meaning it could be hiding further lines. The line at 6439.858 cm-1 appears to be isolated but in fact has a double assignment with the difference between the two MARVEL frequencies of 0.05 cm-1; these lines model essentially the whole intensity of this feature. Single MARVEL assignment means that any other nearby lines are at least about an order-of-magnitude weaker.
The calculated line list contains many more weak lines than the experimental line list. These weak lines overlap with more intense water lines and therefore cannot be identified from the experimental spectrum. However, the contribution of these weak lines does not explain many apparent line strength discrepancies between the two line lists. The task of predicting line intensities for water using ab initio procedures is under constant review [48] and work is currently in progress at UCL to further improve the water dipole surface. Progress on this will be reported elsewhere.
A full list of the experimental lines with assignments are given in the supplementary data. This list specifies whether the line was trivially assigned using MARVEL or is associated with a new energy level. We note that the short spectral range and density of lines meant that these new energy levels are not generally confirmed by combination differences.
The spectrum contains transitions from 136 bands, of which 45 contain only a single transition. Table 1 shows a summary of the main bands observed in this spectrum. Only about 20% of the observed lines involve transitions from the vibrational ground state with most corresponding to hot bands. Transitions involve a large number of rotational states with up to 27.
Table 2 presents our newly determined energy levels. Differences between these and the values predicted by the POKAZATEL line list are also given. The small value of these differences and their smooth behavior within a given vibrational state lends confidence to our new assignments. Note that these energy levels are derived from measurements made at atmosheric pressure and therefore will include small contributions due to the pressure shift. For comparison, Zobov et al [15] analyzed a hot emission spectrum recorded using an oxy-acetylene welding torch and a Fourier transform spectrometer. In the 6250 – 6670 cm-1 region considered here that spectrum contains a similar number of lines to the current one, albeit line positions were only determined to about 0.02 cm-1. Zobov et al give 840 line assignments in this region which can be compated with 2937 here. This means that more than 70% of the line assignments given here are actually new.
| band | band | |||
|---|---|---|---|---|
| 021-000 | 187 | 032-011 | 40 | |
| 101-000 | 182 | 141-120 | 31 | |
| 200-000 | 142 | 400-200 | 29 | |
| 120-000 | 75 | 310-110 | 28 | |
| 002-000 | 36 | 211-011 | 27 | |
| 011-000 | 27 | 220-001 | 27 | |
| 040-000 | 10 | 042-021 | 23 | |
| 111-010 | 93 | 022-100 | 20 | |
| 301-200 | 68 | 121-001 | 19 | |
| 102-100 | 65 | 103-002 | 19 | |
| 211-110 | 65 | 301-101 | 19 | |
| 102-001 | 64 | 140-020 | 18 | |
| 400-101 | 56 | 230-011 | 17 | |
| 310-011 | 55 | 410-111 | 17 | |
| 210-010 | 49 | 221-120 | 15 | |
| 061-040 | 46 | 221-200 | 15 | |
| 131-110 | 43 | 021-010 | 13 | |
| 022-001 | 42 | 220-100 | 12 | |
| 130-010 | 41 | 311-210 | 12 | |
| 121-100 | 40 | 220-020 | 11 |
| KaKc | E / cm-1 | o-c | KaKc | E / cm-1 | o-c | KaKc | E / cm-1 | o-c | |||||
|---|---|---|---|---|---|---|---|---|---|---|---|---|---|
| 14 1 13 | 061 | 15196.170 | -0.044 | 8 3 5 | 061 | 13975.084 | -0.021 | 16 7 9 | 201 | 14398.683 | -0.037 | ||
| 15 12 3 | 002 | 11944.059 | -0.038 | 9 3 7 | 061 | 14184.268 | -0.033 | 17 0 17 | 201 | 13436.679 | -0.104 | ||
| 19 9 10 | 002 | 12947.908 | -0.044 | 6 2 4 | 071 | 14768.262 | -0.013 | 18 4 14 | 201 | 14817.74 | -0.064 | ||
| 8 1 8 | 004 | 15233.158 | -0.02 | 15 9 6 | 101 | 11077.237 | -0.145 | 18 7 11 | 201 | 15211.965 | -0.168 | ||
| 16 2 15 | 021 | 9813.798 | -0.028 | 17 8 9 | 101 | 11645.203 | -0.068 | 10 9 2 | 210 | 11277.802 | -0.033 | ||
| 16 2 15 | 022 | 13412.179 | -0.057 | 18 9 10 | 101 | 12258.106 | -0.048 | 11 11 0 | 210 | 11991.199 | 0.063 | ||
| 9 4 6 | 031 | 9852.648 | -0.099 | 23 5 19 | 101 | 13720.971 | -0.034 | 12 9 4 | 210 | 11831.292 | -0.027 | ||
| 12 5 7 | 031 | 10861.193 | 0.169 | 26 6 20 | 101 | 15782.146 | -0.074 | 12 10 3 | 210 | 12013.462 | 0.018 | ||
| 19 7 13 | 031 | 13925.583 | -0.04 | 15 6 9 | 102 | 14189.387 | -0.084 | 12 12 1 | 210 | 12543.449 | 0.067 | ||
| 13 7 6 | 032 | 15168.281 | -0.035 | 14 8 7 | 111 | 12198.087 | -0.113 | 13 10 3 | 210 | 12320.932 | 0.011 | ||
| 12 10 3 | 040 | 10359.146 | -0.046 | 15 8 7 | 111 | 12549.411 | -0.138 | 13 11 2 | 210 | 12587.499 | 0.035 | ||
| 11 5 6 | 041 | 12161.521 | 0.007 | 16 8 9 | 111 | 12922.244 | -0.065 | 13 12 1 | 210 | 12854.881 | -0.059 | ||
| 11 6 6 | 041 | 12401.372 | -0.056 | 20 6 14 | 111 | 14382.203 | -0.028 | 15 5 10 | 210 | 12071.533 | -0.053 | ||
| 12 5 7 | 041 | 12442.132 | -0.024 | 21 8 14 | 111 | 15088.616 | -0.031 | 16 4 13 | 210 | 12132.162 | -0.06 | ||
| 12 8 4 | 041 | 13250.26 | 0.007 | 13 4 9 | 112 | 14878.042 | 0.042 | 17 4 13 | 210 | 12698.242 | -0.004 | ||
| 13 7 7 | 041 | 13263.805 | -0.121 | 16 9 8 | 120 | 11396.542 | -0.012 | 17 5 12 | 210 | 12867.315 | -0.027 | ||
| 14 7 7 | 041 | 13594.493 | -0.036 | 20 8 13 | 120 | 12913.391 | 0.015 | 18 2 17 | 210 | 12287.241 | -0.051 | ||
| 16 2 14 | 041 | 13214.275 | 0.081 | 17 3 15 | 121 | 13851.555 | -0.026 | 18 3 16 | 210 | 12598.021 | -0.041 | ||
| 19 3 17 | 041 | 14350.205 | -0.006 | 19 2 18 | 121 | 14244.954 | 0.012 | 18 4 15 | 210 | 12871.799 | -0.078 | ||
| 5 3 3 | 051 | 11980.727 | -0.009 | 20 1 19 | 121 | 14622.29 | -0.126 | 19 1 18 | 210 | 12646.72 | -0.057 | ||
| 6 3 3 | 051 | 12129.054 | 0.0 | 9 8 1 | 130 | 10759.505 | -0.006 | 19 2 17 | 210 | 12974.57 | -0.05 | ||
| 6 4 2 | 051 | 12366.269 | -0.082 | 10 8 3 | 130 | 11001.243 | -0.029 | 19 3 16 | 210 | 13264.616 | -0.067 | ||
| 7 2 5 | 051 | 12135.336 | -0.024 | 10 9 2 | 130 | 11185.909 | 0.003 | 20 1 20 | 210 | 12624.253 | -0.056 | ||
| 7 5 3 | 051 | 12805.967 | -0.004 | 11 8 3 | 130 | 11265.526 | -0.018 | 20 2 19 | 210 | 13022.745 | -0.067 | ||
| 8 1 8 | 051 | 11996.135 | 0.018 | 12 8 5 | 130 | 11551.968 | -0.016 | 21 0 21 | 210 | 12996.448 | -0.028 | ||
| 8 4 4 | 051 | 12730.885 | -0.023 | 12 9 4 | 130 | 11736.443 | -0.006 | 21 1 20 | 210 | 13415.475 | -0.061 | ||
| 9 0 9 | 051 | 12164.81 | -0.022 | 13 8 5 | 130 | 11860.261 | -0.03 | 16 9 7 | 211 | 16439.527 | -0.053 | ||
| 9 5 5 | 051 | 13215.983 | -0.035 | 13 9 4 | 130 | 12044.351 | -0.024 | 13 4 9 | 220 | 12824.952 | -0.043 | ||
| 11 2 10 | 051 | 12914.709 | -0.02 | 14 6 9 | 130 | 11643.342 | -0.05 | 10 9 2 | 300 | 12856.023 | 0.029 | ||
| 11 7 5 | 051 | 14302.282 | 0.044 | 14 8 7 | 130 | 12189.994 | -0.019 | 13 8 5 | 300 | 13510.443 | -0.045 | ||
| 12 1 11 | 051 | 13157.177 | 0.015 | 12 2 11 | 140 | 11582.593 | -0.011 | 15 3 12 | 300 | 13515.85 | -0.053 | ||
| 12 7 5 | 051 | 14586.049 | -0.016 | 11 3 9 | 141 | 15061.568 | -0.033 | 16 2 15 | 300 | 13390.283 | 0.132 | ||
| 13 3 11 | 051 | 13756.382 | -0.046 | 12 11 1 | 200 | 10531.411 | -0.094 | 16 4 13 | 300 | 13856.623 | -0.069 | ||
| 2 0 2 | 061 | 12656.003 | -0.004 | 15 9 6 | 200 | 11086.936 | -0.033 | 16 4 13 | 300 | 13856.632 | -0.059 | ||
| 2 2 0 | 061 | 12923.88 | 0.007 | 16 6 10 | 200 | 10935.016 | -0.037 | 16 5 12 | 300 | 14057.023 | -0.068 | ||
| 3 1 3 | 061 | 12787.646 | 0.035 | 16 10 6 | 200 | 11651.177 | -0.035 | 18 3 15 | 300 | 14581.009 | -0.093 | ||
| 3 3 1 | 061 | 13245.215 | 0.01 | 16 13 4 | 200 | 12398.076 | 0.03 | 18 7 12 | 300 | 15158.842 | -0.051 | ||
| 4 0 4 | 061 | 12813.251 | -0.015 | 18 5 13 | 200 | 11650.563 | -0.006 | 19 5 14 | 300 | 15399.793 | -0.111 | ||
| 4 1 3 | 061 | 12933.841 | -0.036 | 18 9 10 | 200 | 12267.551 | 0.049 | 12 10 3 | 310 | 15298.892 | -0.026 | ||
| 4 2 2 | 061 | 13095.518 | 0.001 | 13 4 9 | 201 | 13052.721 | -0.041 | 14 3 12 | 310 | 14588.529 | -0.015 | ||
| 4 3 2 | 061 | 13342.05 | -0.009 | 15 7 9 | 201 | 14005.593 | -0.075 | 17 3 14 | 310 | 15807.947 | -0.034 |
6 Conclusion
A near-infrared absorption spectrum of water recorded in a flame at 1950 K using cavity-enhanced optical frequency comb-based Fourier transform spectrometer is shown to be a rich source of information on water transitions. About 85% of the lines observed in the spectral region 6250 – 6670 cm-1are assigned using both previous information on empirical energy levels and by comparison with a new, variational line list. Many of the experimental lines are assigned to multiple transitions. The majority of the assigned lines are actually associated with hot bands. These new data will form part of the input for the update of MARVEL energy levels for H216O, which is currently in progress [30].
Acknowledgements
This work was supported by NERC under various grants. A.F. acknowledges support from the Swedish Research Council (2016-03593), the Knut and Alice Wallenberg Foundation (2015.0159), and the Swedish Foundation for Strategic Research (ICA12-0031). F.M.S. acknowledges financial support by the Swedish Energy Agency (36160-1), the Kempe Foundations (JCK-1316) and the Swedish strategic research program Bio4Energy. A.A.K and N.F.Z. acknowledge support by State Project IAP RAS No. 0035-2014-009.
References
- [1] A. S. Pine, M. J. Coulombe, C. Camy-Peyret, J.-M. Flaud, Atlas of the high-temperature water vapor spectrum in the 3000 to 4000 cm-1 region, J. Phys. Chem. Ref. Data 12 (1983) 413–465.
- [2] J. C. Pearson, T. Anderson, E. Herbst, F. C. De Lucia, P. Helminger, Millimeter- and submillimeter-wave spectrum of highly excited states of water, Astrophys. J. 379 (1991) L41–L43.
- [3] O. L. Polyansky, N. F. Zobov, J. Tennyson, J. A. Lotoski, P. F. Bernath, Hot bands of water in the manifold up to , J. Mol. Spectrosc. 184 (1997) 35–50.
- [4] O. L. Polyansky, N. F. Zobov, S. Viti, J. Tennyson, P. F. Bernath, L. Wallace, K band spectrum of water in sunspots, Astrophys. J. 489 (1997) L205–L208.
- [5] O. L. Polyansky, J. Tennyson, P. F. Bernath, The spectrum of hot water: rotational transitions and difference bands in the (020), (100) and (001), J. Mol. Spectrosc. 186 (1997) 213–221.
- [6] O. L. Polyansky, N. F. Zobov, S. Viti, J. Tennyson, P. F. Bernath, L. Wallace, High temperature rotational transitions of water in sunspot and laboratory spectra, J. Mol. Spectrosc. 186 (1997) 422–447.
- [7] M. P. Esplin, R. B. Wattson, L. B. Hoke, L. S. Rothman, High-temperature spectrum of H2O in the 720-1400 cm-1 region, J. Quant. Spectrosc. Radiat. Transf. 60 (1998) 711–739.
- [8] N. F. Zobov, O. L. Polyansky, J. Tennyson, J. A. Lotoski, P. Colarusso, K.-Q. Zhang, P. F. Bernath, Hot bands of water up to in the 933 - 2500 cm-1 region, J. Mol. Spectrosc. 193 (1999) 118–136.
- [9] N. F. Zobov, O. L. Polyansky, J. Tennyson, S. V. Shirin, R. Nassar, T. Hirao, T. Imajo, P. F. Bernath, L. Wallace, Using laboratory spectroscopy to identify lines in the K and L-band spectrum of water in a sunspot, Astrophys. J. 530 (2000) 994–998.
- [10] K. Tereszchuk, P. F. Bernath, N. F. Zobov, S. V. Shirin, O. L. Polyansky, N. I. Libeskind, J. Tennyson, L. Wallace, Laboratory spectroscopy of hot water near 2-microns and sunspot spectroscopy in the H-band region, Astrophys. J. 577 (2002) 496–500.
- [11] L. H. Coudert, O. Pirali, M. Vervloet, R. Lanquetin, C. Camy-Peyret, The eight first vibrational states of the water molecule: measurements and analysis, J. Mol. Spectrosc. 228 (2004) 471–498.
- [12] P.-F. Coheur, P. F. Bernath, M. Carleer, R. Colin, O. L. Polyansky, N. F. Zobov, S. V. Shirin, R. J. Barber, J. Tennyson, 3200 K laboratory emission spectrum of water, J. Chem. Phys. 122 (2005) 074307.
- [13] N. F. Zobov, S. V. Shirin, O. L. Polyansky, J. Tennyson, P.-F. Coheur, P. F. Bernath, M. Carleer, R. Colin, Monodromy in the water molecules, Chem. Phys. Lett. 414 (2005) 193–197.
- [14] N. F. Zobov, S. V. Shirin, O. L. Polyansky, R. J. Barber, J. Tennyson, P.-F. Coheur, P. F. Bernath, M. Carleer, R. Colin, Spectrum of hot water in the 2000 – 4750 cm-1 frequency range, J. Mol. Spectrosc. 237 (2006) 115–122.
- [15] N. F. Zobov, S. V. Shirin, R. I. Ovsyannikov, O. L. Polyansky, R. J. Barber, J. Tennyson, P. F. Bernath, M. Carleer, R. Colin, P.-F. Coheur, Spectrum of hot water in the 4750 – 13000 cm-1 frequency range (0.769–-2.1 m), Mon. Not. R. Astron. Soc. 387 (2008) 1093–1098.
- [16] S. Yu, J. C. Pearson, B. J. Drouin, M.-A. Martin-Drumel, O. Pirali, M. Vervloet, L. H. Coudert, H. S. P. Müller, S. Brünken, Measurement and analysis of new terahertz and far-infrared spectra of high temperature water, J. Mol. Spectrosc. 279 (2012) 16–25.
- [17] L. H. Coudert, M.-A. Martin-Drumel, O. Pirali, Analysis of the high-resolution water spectrum up to the Second Triad and to J=30, J. Mol. Spectrosc. 303 (2014) 36–41. doi:{10.1016/j.jms.2014.07.003}.
- [18] F. Allard, P. H. Hauschildt, S. Miller, J. Tennyson, The influence of H2O line blanketing on the spectra of cool dwarf stars, Astrophys. J. 426 (1994) L39–L41.
- [19] R. B. Wattson, L. S. Rothman, Direct numerical diagonalization - wave of the future, J. Quant. Spectrosc. Radiat. Transf. 48 (1992) 763–780. doi:10.1016/0022-4073(92)90140-Y.
- [20] S. Viti, J. Tennyson, O. L. Polyansky, A spectroscopic linelist for hot water, Mon. Not. R. Astron. Soc. 287 (1997) 79–86.
- [21] H. Partridge, D. W. Schwenke, The determination of an accurate isotope dependent potential energy surface for water from extensive ab initio calculations and experimental data, J. Chem. Phys. 106 (1997) 4618–4639. doi:10.1063/1.473987.
- [22] U. G. Jørgensen, P. Jensen, G. O. Sorensen, B. Aringer, H2O in stellar atmospheres, Astron. Astrophys. 372 (2001) 249–259.
- [23] R. J. Barber, J. Tennyson, G. J. Harris, R. N. Tolchenov, A high accuracy computed water line list, Mon. Not. R. Astron. Soc. 368 (2006) 1087–1094.
- [24] O. L. Polyansky, A. A. Kyuberis, L. Lodi, J. Tennyson, R. I. Ovsyannikov, N. Zobov, S. N. Yurchenko, ExoMol molecular line lists XXVI: a complete high-accuracy line list for water, Mon. Not. R. Astron. Soc.
- [25] L. S. Rothman, I. E. Gordon, R. J. Barber, H. Dothe, R. R. Gamache, A. Goldman, V. I. Perevalov, S. A. Tashkun, J. Tennyson, HITEMP, the High-Temperature Molecular Spectroscopic Database, J. Quant. Spectrosc. Radiat. Transf. 111 (2010) 2139–2150.
- [26] J. Tennyson, S. N. Yurchenko, ExoMol: molecular line lists for exoplanet and other atmospheres, Mon. Not. R. Astron. Soc. 425 (2012) 21–33. doi:10.1111/j.1365-2966.2012.21440.x.
- [27] J. Tennyson, S. N. Yurchenko, A. F. Al-Refaie, E. J. Barton, K. L. Chubb, P. A. Coles, S. Diamantopoulou, M. N. Gorman, C. Hill, A. Z. Lam, L. Lodi, L. K. McKemmish, Y. Na, A. Owens, O. L. Polyansky, T. Rivlin, C. Sousa-Silva, D. S. Underwood, A. Yachmenev, E. Zak, The ExoMol database: molecular line lists for exoplanet and other hot atmospheres, J. Mol. Spectrosc. 327 (2016) 73–94. doi:10.1016/j.jms.2016.05.002.
- [28] J. Tennyson, P. F. Bernath, L. R. Brown, A. Campargue, M. R. Carleer, A. G. Császár, L. Daumont, R. R. Gamache, J. T. Hodges, O. V. Naumenko, O. L. Polyansky, L. S. Rothmam, A. C. Vandaele, N. F. Zobov, A. R. Al Derzi, C. Fábri, A. Z. Fazliev, T. Furtenbacher, I. E. Gordon, L. Lodi, I. I. Mizus, IUPAC critical evaluation of the rotational-vibrational spectra of water vapor. Part III. Energy levels and transition wavenumbers for H216O, J. Quant. Spectrosc. Radiat. Transf. 117 (2013) 29–80. doi:10.1016/j.jqsrt.2012.10.002.
- [29] J. Tennyson, P. F. Bernath, L. R. Brown, A. Campargue, A. G. Császár, L. Daumont, R. R. Gamache, J. T. Hodges, O. V. Naumenko, O. L. Polyansky, L. S. Rothman, A. C. Vandaele, N. F. Zobov, A Database of Water Transitions from Experiment and Theory (IUPAC Technical Report), Pure Appl. Chem. 86 (2014) 71–83. doi:10.1515/pac-2014-5012.
- [30] T. Furtenbacher, N. Dénes, J. Tennyson, O. V. Naumenko, O. L. Polyansky, N. F. Zobov, A. G. Császár, The 2016 Update of the IUPAC Database of Water Energy Levels, J. Quant. Spectrosc. Radiat. Transf.(in preparation).
- [31] J.-M. Flaud, C. Camy-Peyret, J. Maillard, Higher ro-vibrational levels of H2O deduced from high resolution oxygen-hydrogen flame spectra between 2800–6200 cm-1, Mol. Phys. 32 (1976) 499–521. doi:10.1080/00268977600103251.
- [32] C. Camy-Peyret, J.-M. Flaud, J. Maillard, G. Guelachvili, Higher ro-vibrational levels of H2O deduced from high resolution oxygen-hydrogen flame spectra between 6200 and 9100 cm-1, Mol. Phys. 33 (1977) 1641–1650. doi:10.1080/00268977700101361.
- [33] J. Y. Mandin, V. Dana, C. Camy-Peyret, J.-M. Flaud, Collisional widths of pure rotational transitions of H2O from Fourier-transform flame spectra, J. Mol. Spectrosc. 152 (1992) 179–184.
- [34] V. Dana, J. Y. Mandin, C. Camy-Peyret, J.-M. Flaud, L. S. Rothman, Rotational and vibrational dependences of collisional linewidths in the hot bands of H2O from Fourier-transform flame spectra, Appl. Opt. 31 (1992) 1179–1184.
- [35] S. N. Mikhailenko, V. G. Tyuterev, V. I. Starikov, K. K. Albert, B. P. Winnewisser, M. Winnewisser, G. Mellau, C. Camy-Peyret, R. Lanquetin, J.-M. Flaud, J. W. Brault, Water spectra in the region 4200-6250 cm-1; extended analysis of , , and 3 bands and confirmation of highly excited states from flame spectra and from atmospheric long-path observations, J. Mol. Spectrosc. 213 (2002) 91–121.
- [36] C. Abd Alrahman, A. Khodabakhsh, F. M. Schmidt, Z. Qu, A. Foltynowicz, Cavity-enhanced optical frequency comb spectroscopy of high-temperature H2O in a flame, Optics Express 22 (2014) 13889–13895.
- [37] P. Maslowski, K. F. Lee, A. C. Johansson, A. Khodabakhsh, G. Kowzan, L. Rutkowski, A. A. Mills, C. Mohr, J. Jiang, M. E. Fermann, A. Foltynowicz, Surpassing the path-limited resolution of fourier-transform spectrometry with frequency combs, Phys. Rev. A 93 (2016) 021802.
- [38] L. Rutkowski, P. Maslowski, A. C. Johansson, A. Khodabakhsh, A. Foltynowicz, Optical frequency comb fourier transform spectroscopy with sub-nominal resolution, J. Quant. Spectrosc. Radiat. Transf. 204 (2017) 63.
- [39] A. Foltynowicz, T. Ban, P. Maslowski, F. Adler, J. Ye, Quantum-noise-limited optical frequency comb spectroscopy, Phys. Rev. Lett. 107 (23) (2011) 233002.
- [40] Z. C. Qu, R. Ghorbani, D. Valiev, F. M. Schmidt, Calibration-free scanned wavelength modulation spectroscopy-application to H2O and temperature sensing in flames, Optics Express 23 (2015) 16492–16499.
- [41] L. Rutkowski, A. C. Johansson, D. Valiev, A. Khodabakhsh, A. Tkacz, F. M. Schmidt, A. Foltynowicz, Detection of OH in an atmospheric flame at 1.5 m using optical frequency comb spectroscopy, Photonics Lett. Poland 8 (2016) 110–112.
- [42] A. Foltynowicz, P. Maslowski, A. J. Fleisher, B. J. Bjork, J. Ye, Cavity-enhanced optical frequency comb spectroscopy in the mid-infrared - application to trace detection of hydrogen peroxide, Appl. Phys. B 110 (2013) 163–175.
- [43] G. Hartung, J. Hult, C. F. Kaminski, A flat flame burner for the calibration of laser thermometry techniques, Measurement Sci. Tech. 17 (2006) 2485–2493.
- [44] L. S. Rothman, I. E. Gordon, Y. Babikov, A. Barbe, D. C. Benner, P. F. Bernath, M. Birk, L. Bizzocchi, V. Boudon, L. R. Brown, A. Campargue, K. Chance, E. A. Cohen, L. H. Coudert, V. M. Devi, B. J. Drouin, A. Fayt, J.-M. Flaud, R. R. Gamache, J. J. Harrison, J.-M. Hartmann, C. Hill, J. T. Hodges, D. Jacquemart, A. Jolly, J. Lamouroux, R. J. Le Roy, G. Li, D. A. Long, O. M. Lyulin, C. J. Mackie, S. T. Massie, S. Mikhailenko, H. S. P. Müller, O. V. Naumenko, A. V. Nikitin, J. Orphal, V. Perevalov, A. Perrin, E. R. Polovtseva, C. Richard, M. A. H. Smith, E. Starikova, K. Sung, S. Tashkun, J. Tennyson, G. C. Toon, V. G. Tyuterev, G. Wagner, The HITRAN 2012 molecular spectroscopic database, J. Quant. Spectrosc. Radiat. Transf. 130 (2013) 4 – 50. doi:10.1016/jqsrt.2013.07.002.
- [45] T. Furtenbacher, A. G. Császár, J. Tennyson, MARVEL: measured active rotational-vibrational energy levels, J. Mol. Spectrosc. 245 (2007) 115–125.
- [46] T. Furtenbacher, A. G. Császár, MARVEL: measured active rotational-vibrational energy levels. II. Algorithmic improvements, J. Quant. Spectrosc. Radiat. Transf. 113 (2012) 929–935.
- [47] E. J. Barton, S. N. Yurchenko, J. Tennyson, S. Béguier, A. Campargue, A near infrared line list for NH3: Analysis of a Kitt Peak spectrum after 35 years, J. Mol. Spectrosc. 325 (2016) 7–12. doi:10.1016/j.jms.2016.05.001.
- [48] M. Birk, G. Wagner, J. Loos, L. Lodi, O. L. Polyansky, A. A. Kyuberis, N. F. Zobov, J. Tennyson, Accurate line intensities for water transitions in the infrared: comparison of theory and experiment, J. Quant. Spectrosc. Radiat. Transf. 203 (2017) 88–102. doi:10.1016/j.jqsrt.2017.03.040.