ExoMol line lists – XXII. The rotation-vibration spectrum of silane up to 1200 K
Abstract
A variationally computed 28SiH4 rotation-vibration line list applicable for temperatures up to K is presented. The line list, called OY2T, considers transitions with rotational excitation up to in the wavenumber range –cm-1 (wavelengths m). Just under 62.7 billion transitions have been calculated between 6.1 million energy levels. Rovibrational calculations have utilized a new ‘spectroscopic’ potential energy surface determined by empirical refinement to 1452 experimentally derived energy levels up to , and a previously reported ab initio dipole moment surface. The temperature-dependent partition function of silane, the OY2T line list format, and the temperature dependence of the OY2T line list are discussed. Comparisons with the PNNL spectral library and other experimental sources indicate that the OY2T line list is robust and able to accurately reproduce weaker intensity features. The full line list is available from the ExoMol database and the CDS database.
keywords:
molecular data – opacity – planets and satellites: atmospheres – stars: atmospheres – ISM: molecules.1 Introduction
The possibility of silicon-based life existing elsewhere in the Universe is an idea very much rooted in the realms of science fiction. Yet the continued discovery of exoplanets and the exhaustive search for potential biosignature gases (Seager, Bains & Petkowski, 2016) has renewed interest in the simplest silicon-hydrogen compound, silane (SiH4). A large number of high-resolution studies on the infrared (IR) absorption spectrum of SiH4 and its isotopomers have been reported since the first measurements by Steward & Nielsen (1934, 1935). Rotation-vibration transitions have been detected around the carbon star IRC +10216 (Goldhaber & Betz, 1984; Keady & Ridgway, 1993; Monnier et al., 2000), and in the atmospheres of Jupiter (Treffers et al., 1978) and Saturn (Larson et al., 1980). Although deemed unlikely, silane has already been considered in the context of H2-dominated atmospheres on rocky exoplanets (Seager, Bains & Hu, 2013).
Despite efforts to document the spectrum of SiH4, no complete line list exists for this molecule. The PNNL spectral library (Sharpe et al., 2004) contains IR absorption cross-sections at a resolution of around cm-1 for the –cm-1 range. Another useful resource is the Spherical Top Data System (STDS) (Wenger & Champion, 1998), however, a significant portion of the measured transitions and intensities are from unpublished work which makes it difficult to assess the reliability of the data. Theoretical 28SiH4 spectra are available from the TheoReTS database (Rey et al., 2016) for a temperature range of –K but the calculations that they are based on are again from unpublished work. A room temperature line list has been produced for the –cm-1 region from analysis of the and bands (Ulenikov et al., 2017). Whilst absolute line intensities have been determined by van Helden et al. (2015) for a large number of P-branch transitions of the band up to the rotational quantum number .
Previously, we generated potential energy and dipole moment surfaces for silane using state-of-the-art ab initio theory (Owens et al., 2015). Both surfaces were rigorously evaluated and showed good agreement with experimental results. Computed fundamental term values of 28SiH4 using the CBS-F12 potential energy surface (PES) possessed a root-mean-square (rms) error of cm-1 compared to experiment. The dipole moment surface (DMS), although tending to marginally overestimate the strength of line intensities, reproduced band shape and structure well.
Building on this work, we present a comprehensive rotation-vibration line list of 28SiH4 suitable for elevated temperatures. The line list, called OY2T, has been computed variationally and utilizes a new ‘spectroscopic’ PES which has been determined by rigorous empirical refinement. The OY2T line list has been produced for the ExoMol database (Tennyson & Yurchenko, 2012; Tennyson et al., 2016), which is providing important molecular spectroscopic data to help characterize exoplanet and other hot atmospheres. Examples of the application of these line lists include: the early detection of water in HD 189733b (Tinetti et al., 2007) and HD 209458b (Beaulieu et al., 2010) using the BT2 line list (Barber et al., 2006); the tentative identification of HCN in the atmosphere of super-Earth 55 Canri e (Tsiaras et al., 2016) and TiO in the atmosphere of hot Jupiter WASP-76 b (Tsiaras et al., 2017); various studies using the 10to10 line list (Yurchenko & Tennyson, 2014) to detect methane in exoplanets (Beaulieu et al., 2011; Yurchenko et al., 2014; Tsiaras et al., 2017), the bright T4.5 brown dwarf 2MASS 0559-14 (Yurchenko et al., 2014), and to make detailed line assignments in the near-infrared spectra of late T dwarfs (Canty et al., 2015) in conjunction with the BYTe ammonia line list (Yurchenko, Barber & Tennyson, 2011). Conversely, a line list for the diatomic NaH molecule (Rivlin et al., 2015) was able to rule out the tentative detection of this species in the atmosphere of a brown dwarf.
Silane is the second five-atom molecule to be treated within the ExoMol framework (Tennyson & Yurchenko, 2017) after methane and the 10to10 line list (Yurchenko & Tennyson, 2014), which demonstrated the need to consider a very large number of transitions to correctly model the opacity at elevated temperatures (Yurchenko et al., 2014). Since the 10to10 line list, several key developments have taken place in our nuclear motion code trove (Yurchenko, Thiel & Jensen, 2007; Yachmenev & Yurchenko, 2015) that significantly ease the computational burden of theoretical line list production. These include an automatic differentiation method to construct the rovibrational Hamiltonian, the implementation of curvilinear internal coordinates, and a novel vibrational basis set truncation approach which will be discussed later on.
The paper is structured as follows: In Sec. 2 we detail the empirical refinement of the CBS-F12 PES, the DMS and intensity simulations, and the variational calculations. In Sec. 3, the OY2T line list is presented and we discuss the temperature-dependent partition function of SiH4, the format of the OY2T line list, the temperature dependence of the OY2T line list, and comparisons with the PNNL spectral library and other experimental data. Concluding remarks are given in Sec. 4.
2 Methods
2.1 Potential energy surface refinement
The CBS-F12 PES (Owens et al., 2015) was constructed from extensive, explicitly correlated coupled cluster calculations with extrapolation to the complete basis set limit, and incorporated additional higher-level energy corrections to account for core-valence electron correlation, higher-order coupled cluster terms beyond CCSD(T), and scalar relativistic effects. Although impressive in its accuracy, orders-of-magnitude improvements in predicted transition frequencies can be achieved by refining the PES to experiment. Furthermore, improved energy levels means better wavefunctions and more reliable intensities.
The refinement was carried out using an efficient least-squares fitting procedure (Yurchenko et al., 2011) implemented in trove. The procedure works by assuming the CBS-F12 PES, , is already a reasonable representation such that the effect of the refinement can be treated as a perturbation , i.e.
| (1) |
where is the refined PES. The correction is expanded in terms of nine vibrational coordinates according to the formula,
| (2) |
where the coefficients are corrections to the original PES expansion parameters . The expansion terms are symmetrized combinations of the vibrational coordinates and transform according to the irreducible representation of the molecular symmetry group (Bunker & Jensen, 1998). Further details on the vibrational coordinates and analytic representation of the CBS-F12 PES can be found in Owens et al. (2015).
The new perturbed Hamiltonian, , is then diagonalized using a basis set of eigenfunctions from the initial unperturbed Hamiltonian eigenvalue problem. Each iteration utilizes the previous “unperturbed” basis set in this way until a PES of desirable quality is reached. To ensure the consistency of the refined surface, the expansion parameters are simultaneously fitted to both the experimental data and the original ab initio dataset (Yurchenko et al., 2003). This stops any unrealistic distortion of the PES in regions not sampled by experiment. It also means each expansion parameter can be adjusted irrespective of the amount, or distribution, of experimental energies used in the refinement.
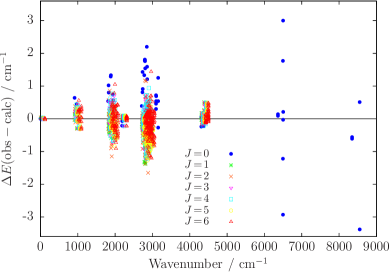
For SiH4, a total of 1452 experimental term values up to were used to refine the CBS-F12 PES. This included 53 vibrational band centres from Wenger & Champion (1998); Chevalier (1988); Zhu et al. (1991); Sun et al. (1995); Lin et al. (1998), and 1399 energies from the STDS (Wenger & Champion, 1998). Of the expansion parameters of the CBS-F12 PES, were varied and the results of the refinement are shown in Fig. 1, where we have plotted the fitting residuals . Here, and are the observed and calculated energies, respectively. Overall, the experimental energy levels are reproduced with a rms error of cm-1. This error is slightly larger than what is achievable with refinement, however, this was intentional. The energy levels from the STDS are derived from an effective Hamiltonian model based on some unpublished work. It is therefore hard to assess the reliability of the data and how much it can be trusted in the refinement. Despite this, because the CBS-F12 PES is reliable we could depend on it more and ensure the refined PES did not deviate too far away from the original surface.
Pure rotational energies were given the largest weights in the refinement, while and rovibrational term values were weighted two orders of magnitude smaller with values between – based on their energy. Since the weights are normalized in the fitting, relative weighting is more important than absolute values (see Yurchenko et al. (2011) for further details). Although we have determined a new ‘spectroscopic’ PES of silane, the accuracy of the refined PES is only guaranteed with the computational setup employed in this study. This is usually the case in theoretical line list production using programs that do not treat the kinetic energy operator exactly, and we therefore do not recommend this PES for use otherwise.
2.2 Dipole moment surface and line intensities
The electric DMS utilized for the present study was computed at the CCSD(T)/aug-cc-pVTZ(+d for Si) level of theory. Further details on the analytic representation and performance of the DMS can be found in Owens et al. (2015), where it was shown that the DMS marginally overestimates the strength of line intensities. This discrepancy is very minor though as we will see in Sec. 3.3.
To simulate absolute absorption intensities we used the expression,
| (3) |
where is the Einstein coefficient of a transition with wavenumber (in cm-1) between an initial state with energy , and a final state with rotational quantum number . Here, is the Boltzmann constant, is the absolute temperature, is the Planck constant and is the speed of light. The nuclear spin statistical weights are for states of symmetry , respectively. The partition function for a given temperature will be discussed in Sec. 3.1. All transitions obey the symmetry selection rules
| (4) |
and the standard rotational selection rules,
| (5) |
where ′ and ′′ denote the upper and lower state, respectively. Note that the ExoCross code (Yurchenko, Al-Refaie & Tennyson (in preparation); available at https://doi.org/10.5281/zenodo.400748) was employed for all spectral simulations.
2.3 Variational calculations
The computer program trove was used for all rovibrational calculations. Since the methodology of trove is well documented (Yurchenko, Thiel & Jensen, 2007; Yurchenko et al., 2009; Yachmenev & Yurchenko, 2015; Yurchenko, Yachmenev & Ovsyannikov, 2017) and we have previously reported calculations on SiH4 (Owens et al., 2015), we summarise only the key aspects relevant for this work.
The rovibrational Hamiltonian was constructed numerically using an automatic differentiation method (Yachmenev & Yurchenko, 2015). The Hamiltonian was represented as a power series expansion around the equilibrium geometry in terms of nine, curvilinear internal coordinates, with the kinetic and potential energy operators truncated at 6th order. Atomic mass values were used throughout. A multi-step contraction scheme was used to build the vibrational basis set, the size of which was controlled by the polyad number
| (6) |
The quantum numbers for are related to primitive basis functions , which are obtained by solving a one-dimensional Schrödinger equation for each th vibrational mode with the Numerov-Cooley method (Noumerov, 1924; Cooley, 1961). Multiplication with symmetrized rigid-rotor eigenfunctions produces the final basis set for calculations. Here, the label is the rotational symmetry and is a multiplicity index used to count states within a given (see Boudon, Rey & Loëte (2006)).
In calculations we set , which resulted in 19,237 vibrational basis functions corresponding to energies up to ,000 cm-1. Describing high rotational excitations with such a large basis set can quickly become computationally intractable (rovibrational matrices scale linearly with ). It was therefore necessary to reduce the number of basis functions. To do this we employed a new, basis set truncation approach (Yurchenko et al. (in preparation)) based on vibrational transition moments, which are relatively inexpensive to compute in trove. The vibrational transition moment between two states is defined as,
| (7) |
where and are the initial and final state vibrational eigenfunctions, respectively, and is the electronically averaged dipole moment function along the molecule-fixed axis .
After computing energies, all possible transition moments were calculated for a lower energy threshold of cm-1 (same as for the final OY2T line list). Once known, we estimated the vibrational band intensity at an elevated temperature (e.g. K) for every transition moment. Each vibrational energy level, and consequently each basis function, was assigned a band intensity value which was simply the largest computed for that state when acting as in Eq. (7). The basis set was then pruned by removing basis functions and energy levels above cm-1 with band intensity values smaller than cm/molecule. This is around three orders of magnitude smaller than the largest computed value. The band intensity threshold was chosen solely on a computational basis so that the rovibrational calculations were manageable with the resources available to us. The resulting pruned basis set contained 3817 functions (corresponding to energies up to ,000 cm-1) and was multiplied in the usual manner with symmetrized rigid-rotor functions for calculations.
An advantage of this truncation approach is that the accuracy of the vibrational energy levels and respective wavefunctions computed using a larger value of is retained. Naturally we will lose some information on weaker lines involving states above cm-1 and it is hard to quantify the effect without more rigorous calculations. Removing functions from the basis set will also influence predicted rovibrational energies but the errors introduced, and the basis set convergence error, can to some extent be compensated for by refining the PES with the pruned basis set, which is what we have done. The resulting ‘effective’ PES is only reliable with the same computational setup but this is usually the case in theoretical line list production with trove.
The OY2T line list was computed with a lower state energy threshold of cm-1 and considered transitions up to in the –cm-1 range. To improve the accuracy of the line list we employed an empirical basis set correction (EBSC) (Yurchenko et al., 2009), which is essentially a shift of the band centres to better match experiment. Recall that in the multi-step contraction scheme used by trove, the eigenfunctions form the final basis set and the vibrational part of the Hamiltonian is diagonal with respect to this basis set. It is possible then to replace the diagonal elements with accurate experimental values for the energies when constructing the Hamiltonian matrix. For the OY2T line list, only the four fundamentals, listed in Table 1, were replaced as these wavenumbers are well established.
| Mode | Symmetry | Band Centre | Description |
|---|---|---|---|
| 2186.87 | Symmetric stretching | ||
| 970.93 | Antisymmetric bending | ||
| 2189.19 | Antisymmetric stretching | ||
| 913.47 | Antisymmetric bending |
3 Results
3.1 Partition function of silane
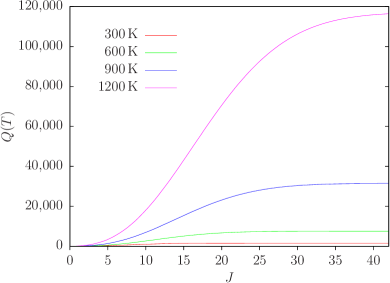
The temperature-dependent partition function is defined as,
| (8) |
where is the degeneracy of a state with energy and rotational quantum number . Summing over all computed rovibrational energy levels, in Fig. 2 we have plotted the convergence of as a function of for different temperatures. At K the partition function is converged to around . Our calculated room temperature partition function is in excellent agreement with a value of from the TheoReTS database (Rey et al., 2016). It also agrees well with an approximate estimate of used in our previous study (Owens et al., 2015), where and are the rotational and vibrational partition function, respectively.
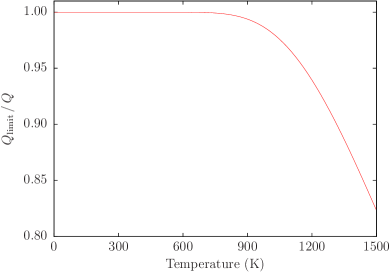
Given that the OY2T line list has been computed with a lower energy threshold of cm-1, it is informative to study a reduced partition function , which only considers energy levels up to cm-1 in the summation of Eq. (8). In Fig. 3 we plot the ratio with respect to temperature, and this can provide a measure of completeness of the OY2T line list. At K, the ratio and we recommend this as a ‘soft’ temperature limit to the OY2T line list. Using the line list above this temperature will result in the progressive loss of opacity, however, it is possible to estimate the missing contribution with the ratio (Neale, Miller & Tennyson, 1996). Note that our full partition function evaluated on a K grid from –K is provided as supplementary material.
3.2 OY2T line list format
A complete description of the ExoMol data structure along with examples was recently reported by Tennyson et al. (2016). The .states file contains all computed rovibrational energies (in cm-1). Each energy level possesses a unique state ID with symmetry and quantum number labelling as shown in Table 2. The .trans files, which are split into frequency windows so that they are easier to handle, contain all computed transitions with upper and lower state ID labels, and Einstein coefficients. An example from a .trans file for the OY2T line list is given in Table 3.
| 1 | 0.000000 | 5 | 0 | 1 | 0 | 0 | 0 | 0 | 0 | 0 | 0 | 0 | 0 | 1 | 0 | 0 | 0 | 1 | 0 | 0.99 |
| 2 | 1810.753814 | 5 | 0 | 1 | 0 | 0 | 0 | 0 | 0 | 0 | 2 | 0 | 0 | 1 | 0 | 0 | 0 | 1 | 0 | 0.32 |
| 3 | 1936.931391 | 5 | 0 | 1 | 0 | 0 | 0 | 0 | 2 | 0 | 0 | 0 | 0 | 1 | 0 | 0 | 0 | 1 | 0 | 0.49 |
| 4 | 2186.873254 | 5 | 0 | 1 | 0 | 0 | 1 | 0 | 0 | 0 | 0 | 0 | 0 | 1 | 0 | 0 | 0 | 1 | 0 | 0.24 |
| 5 | 2730.476494 | 5 | 0 | 1 | 0 | 0 | 0 | 0 | 0 | 0 | 1 | 1 | 1 | 1 | 0 | 0 | 0 | 1 | 0 | 0.91 |
| 6 | 2792.635361 | 5 | 0 | 1 | 0 | 0 | 0 | 0 | 1 | 0 | 2 | 0 | 0 | 1 | 0 | 0 | 0 | 1 | 0 | 0.49 |
| 7 | 2914.995074 | 5 | 0 | 1 | 0 | 0 | 0 | 0 | 1 | 2 | 0 | 0 | 0 | 1 | 0 | 0 | 0 | 1 | 0 | 0.73 |
| 8 | 3099.093127 | 5 | 0 | 1 | 0 | 0 | 1 | 0 | 0 | 0 | 0 | 0 | 1 | 1 | 0 | 0 | 0 | 1 | 0 | 0.69 |
| 9 | 3599.518736 | 5 | 0 | 1 | 0 | 0 | 0 | 0 | 0 | 0 | 2 | 0 | 2 | 1 | 0 | 0 | 0 | 1 | 0 | 0.20 |
| 10 | 3651.898227 | 5 | 0 | 1 | 0 | 0 | 0 | 0 | 0 | 0 | 0 | 4 | 0 | 1 | 0 | 0 | 0 | 1 | 0 | 0.21 |
-
•
: State ID;
-
•
: Term value (in cm-1);
-
•
: Total degeneracy;
-
•
: Rotational quantum number;
-
•
: Total symmetry in (1 is , 2 is , 3 is , 4 is , 5 is );
-
•
– : trove vibrational quantum numbers;
-
•
: Symmetry of the vibrational contribution in ;
-
•
: Rotational quantum number (same as column 4);
-
•
: Rotational quantum number, projection of onto molecule-fixed -axis;
-
•
: Rotational parity (0 or 1);
-
•
: Symmetry of the rotational contribution in ;
-
•
: State number in block;
-
•
: Largest coefficient used in the assignment.
| 1009016 | 887497 | 2.8705e-05 |
| 1012938 | 889497 | 1.6387e-05 |
| 1013144 | 1138036 | 5.4460e-02 |
| 1013796 | 1138422 | 1.0351e-01 |
| 101385 | 61971 | 5.4116e-04 |
| 1014053 | 890062 | 1.6747e-04 |
| 1014363 | 1010642 | 4.0593e-03 |
| 1016000 | 1139649 | 5.9798e-02 |
| 1017478 | 892208 | 1.0542e-06 |
| 1017606 | 1140576 | 5.3820e-03 |
: Upper state ID; : Lower state ID;
: Einstein coefficient (in s-1).
3.3 Validation of the OY2T line list
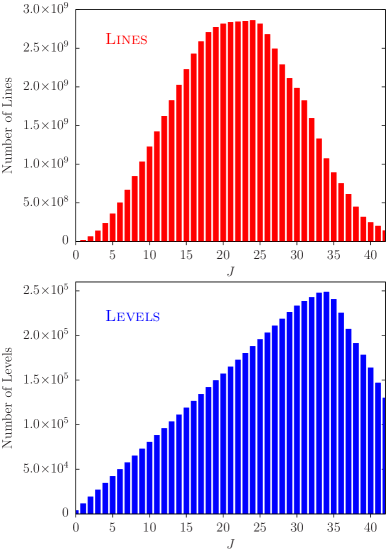
The OY2T line list contains nearly 62.7 billion (62,690,449,078) transitions between 6.1 million (6,142,521) energy levels. The distribution of lines and energies is illustrated in Fig. 4, where we have plotted the total number computed for each value of . The density of transitions is largest between but this drops off relatively smoothly and by we have nearly calculated all possible transitions for our computational setup (e.g. lower energy threshold of cm-1, wavenumber range of cm-1, pruned rovibrational basis set, etc.). The decrease in the number of energy levels after is a result of the upper energy threshold of ,000 cm-1
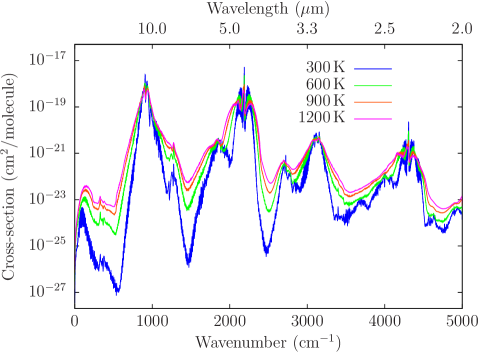
The temperature dependence of the OY2T line list is shown in Fig. 5, where we have simulated integrated absorption cross-sections at a resolution of cm-1 using a Gaussian profile with a half width at half maximum (hwhm) of cm-1. Very weak intensities can be seen to grow several orders of magnitude stronger as the temperature increases. This smoothing of the spectrum is a result of vibrationally excited states becoming more populated and causing the rotational band envelope to broaden.
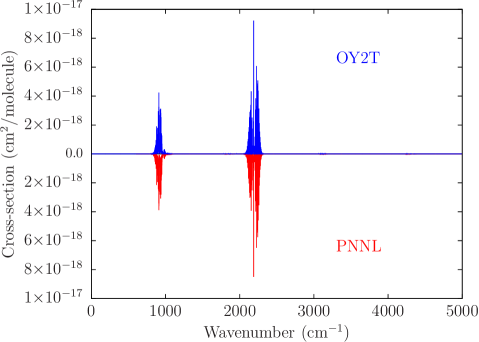
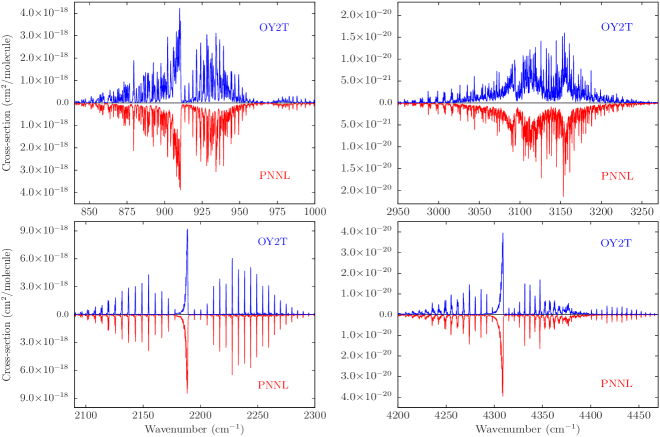
A good benchmark of the OY2T line list is to compare with the PNNL spectral library (Sharpe et al., 2004). In Fig. 6 and Fig. 7 we have simulated cross-sections at a resolution of cm-1 using a Gaussian profile with a hwhm of cm-1. The experimental PNNL silane spectrum was measured at a temperature of 25C with the dataset subsequently re-normalized to 22.84C (K). It is of electronics grade silane gas, which is composed of 28SiH4 (), 29SiH4 (), and 30SiH4 (). We have therefore scaled our computed 28SiH4 cross-sections by to ensure a reliable comparison. As expected (Owens et al., 2015), the OY2T cross-sections are marginally stronger but this is very slight. Overall the agreement is very encouraging, particularly the performance of the OY2T line list for weaker bands (see the right-hand panels of Fig. 7) as we are missing contributions from 29SiH4 and 30SiH4.
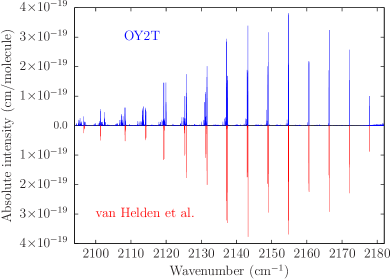
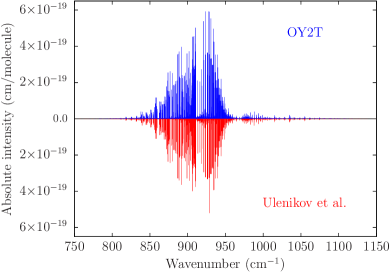
Finally, we compare absolute line intensities of the OY2T line list with measurements of the band from van Helden et al. (2015), and with the –cm-1 region line list from Ulenikov et al. (2017). Intensities were computed using Eq. (3) at K in Fig. 8, and at K in Fig. 9. As was previously found when validating the DMS (Owens et al., 2015), there is good agreement with the results of van Helden et al. (2015), where transition intensities up to were recorded at a resolution of cm-1 with an estimated experimental measurement accuracy of . For the 28SiH4 line list from Ulenikov et al. (2017) the agreement is also pleasing. Their line list contains 3512 transitions up to with the intensities determined from an analysis of 787 of the measured lines. Again the OY2T line intensities are slightly stronger in places but overall the band structure is well matched and weaker intensity features are accurately accounted for. It is worth noting that the OY2T line list is up to which would explain some of the additional spectral features in both comparisons.
4 Conclusion
A comprehensive rotation-vibration line list for 28SiH4 has been presented. The OY2T line list covers the –cm-1 region and includes transitions up to . Analysis of the temperature-dependent partition function suggests that the OY2T line list can be confidently used for temperatures below K. Applications above this temperature are likely to result in the loss of opacity. Comparisons with the PNNL spectral library and other experimental sources showed that the OY2T line list is robust and able to accurately reproduce the intensity features of weaker bands. The OY2T line list can be downloaded from the ExoMol database at www.exomol.com or the CDS database at http://cdsarc.u-strasbg.fr.
The line list OY2T will be useful for modelling of absorption of SiH4 in atmospheres of exoplanets. Its quality (completeness and accuracy) should be sufficient, at least in principle, to detect silane in an atmosphere of a hot exoplanet from the transit spectroscopic observations, when combined with a proper atmospheric and radiative transfer models and providing that the abundance of SiH4 is sufficiently large to be detectable. However for high resolution detection techniques such as the high-dispersion spectroscopy developed by Snellen (2014), our line positions might not be sufficiently accurate. This technique is based on the Doppler shifts of a large number of spectroscopic lines of a given species, which are cross-correlated to the reference lab data on the line positions. The required resolution of the line positions should be as high, 100,000. We do have a method to address this problem, which is to replace the theoretical energy levels in a synthetic line list with experimentally derived ones, usually obtained with the MARVEL (measured active rotational-vibrational energy levels) procedure (Furtenbacher, Császár & Tennyson, 2007; Furtenbacher & Császár, 2012). The most recent example of is the hybrid line list for H MiZATeP (Mizus et al., 2017). The experimental spectroscopic data available for SiH4 should be sufficient to generate such hybrid line list for this molecule in the future.
Natural extensions to the OY2T line list would be the consideration of a larger frequency range, an increased lower energy threshold in computations, and the inclusion of higher rotational excitations. These issues, although computationally challenging, are straightforward to address but will only be done if there is a demand for such work. It would be useful to derive a consistent set of normal mode quantum numbers for the OY2T line list. These are commonly used in high-resolution spectroscopic applications and could be easily incorporated by updating the .states file. Work in this direction is underway and any updates to the OY2T line list will be released on the ExoMol website. It may also be worthwhile to explore a more compact representation (Yurchenko et al., 2017) of the OY2T line list given the huge number of lines that have been generated. Certainly we are in a position to produce temperature-dependent cross-sections for a fixed resolution if requested.
Acknowledgments
This work was part of ERC Advanced Investigator Project 267219. We also acknowledge support from FP7-MC-IEF project 629237, COST Action CM1405 MOLIM, and the Max Planck Computing and Data Facility (MPCDF).
References
- Barber et al. (2006) Barber R. J., Tennyson J., Harris G. J., Tolchenov R. N., 2006, MNRAS, 368, 1087
- Beaulieu et al. (2010) Beaulieu J. P. et al., 2010, MNRAS, 409, 963
- Beaulieu et al. (2011) Beaulieu J. P. et al., 2011, ApJ, 731, 16
- Boudon, Rey & Loëte (2006) Boudon V., Rey M., Loëte M., 2006, J. Quant. Spectrosc. Radiat. Transf., 98, 394
- Bunker & Jensen (1998) Bunker P. R., Jensen P., 1998, Molecular Symmetry and Spectroscopy, 2nd edn. NRC Research Press, Ottawa
- Canty et al. (2015) Canty J. I. et al., 2015, MNRAS, 450, 454
- Chevalier (1988) Chevalier M., 1988. Thesis, Université de Paris Sud, France
- Cooley (1961) Cooley J. W., 1961, Math. Comput., 15, 363
- Furtenbacher & Császár (2012) Furtenbacher T., Császár A. G., 2012, J. Quant. Spectrosc. Radiat. Transf., 113, 929
- Furtenbacher, Császár & Tennyson (2007) Furtenbacher T., Császár A. G., Tennyson J., 2007, J. Mol. Spectrosc., 245, 115
- Goldhaber & Betz (1984) Goldhaber D. M., Betz A. L., 1984, ApJ, 279, L55
- Keady & Ridgway (1993) Keady J. J., Ridgway S. T., 1993, ApJ, 406, 199
- Larson et al. (1980) Larson H. P., Fink U., Smith H. A., Davis D. S., 1980, ApJ, 240, 327
- Lin et al. (1998) Lin H., Wang D., Chen X. Y., Wang X. G., Zhou Z. P., Zhu Q. S., 1998, J. Mol. Spectrosc., 192, 249
- Mizus et al. (2017) Mizus I. I., Alijah A., Zobov N. F., Kyuberis A. A., Yurchenko S. N., Tennyson J., Polyansky O. L., 2017, MNRAS, 468, 1717
- Monnier et al. (2000) Monnier J. D., Danchi W. C., Hale D. S., Tuthill P. G., Townes C. H., 2000, ApJ, 543, 868
- Neale, Miller & Tennyson (1996) Neale L., Miller S., Tennyson J., 1996, ApJ, 464, 516
- Noumerov (1924) Noumerov B. V., 1924, MNRAS, 84, 592
- Owens et al. (2015) Owens A., Yurchenko S. N., Yachmenev A., Thiel W., 2015, J. Chem. Phys., 143, 244317
- Rey et al. (2016) Rey M., Nikitin A. V., Babikov Y. L., Tyuterev V. G., 2016, J. Mol. Spectrosc., 327, 138
- Rivlin et al. (2015) Rivlin T., Lodi L., Yurchenko S. N., Tennyson J., Le Roy R. J., 2015, MNRAS, 451, 5153
- Seager, Bains & Hu (2013) Seager S., Bains W., Hu R., 2013, ApJ, 777, 95
- Seager, Bains & Petkowski (2016) Seager S., Bains W., Petkowski J. J., 2016, Astrobiology, 16, 465
- Sharpe et al. (2004) Sharpe S. W., Johnson T. J., Sams R. L., Chu P. M., Rhoderick G. C., Johnson P. A., 2004, Appl. Spectrosc., 58, 1452
- Snellen (2014) Snellen I., 2014, Phil. Trans. Royal Soc. London A, 372, 20130075
- Steward & Nielsen (1934) Steward W. B., Nielsen H. H., 1934, J. Chem. Phys., 2, 712
- Steward & Nielsen (1935) Steward W. B., Nielsen H. H., 1935, Phys. Rev., 47, 828
- Sun et al. (1995) Sun F. G., Wang X. G., Zhu Q. S., Pierre C., Pierre G., 1995, Chem. Phys. Lett., 239, 373
- Tennyson & Yurchenko (2012) Tennyson J., Yurchenko S. N., 2012, MNRAS, 425, 21
- Tennyson & Yurchenko (2017) Tennyson J., Yurchenko S. N., 2017, Int. J. Quantum Chem., 117, 92
- Tennyson et al. (2016) Tennyson J. et al., 2016, J. Mol. Spectrosc., 327, 73
- Tinetti et al. (2007) Tinetti G. et al., 2007, Nature, 448, 169
- Treffers et al. (1978) Treffers R. R., Larson H. P., Fink U., Gautier T. N., 1978, Icarus, 34, 331
- Tsiaras et al. (2016) Tsiaras A. et al., 2016, ApJ, 820, 99
- Tsiaras et al. (2017) Tsiaras A. et al., 2017, ApJ, in press
- Ulenikov et al. (2017) Ulenikov O. N., Gromova O. V., Bekhtereva E. S., Raspopova N. I., Kashirina N. V., Fomchenko A. L., Sydow C., Bauerecker S., 2017, J. Quant. Spectrosc. Radiat. Transf., in press
- van Helden et al. (2015) van Helden J. H., Lopatik D., Nave A., Lang N., Davies P. B., Röpcke J., 2015, J. Quant. Spectrosc. Radiat. Transf., 151, 287
- Wenger & Champion (1998) Wenger C., Champion J. P., 1998, J. Quant. Spectrosc. Radiat. Transf., 59, 471
- Yachmenev & Yurchenko (2015) Yachmenev A., Yurchenko S. N., 2015, J. Chem. Phys., 143, 014105
- Yurchenko et al. (2017) Yurchenko S. N., Amundsen D. S., Tennyson J., Waldmann I. P., 2017, A&A, in press
- Yurchenko, Barber & Tennyson (2011) Yurchenko S. N., Barber R. J., Tennyson J., 2011, MNRAS, 413, 1828
- Yurchenko et al. (2011) Yurchenko S. N., Barber R. J., Tennyson J., Thiel W., Jensen P., 2011, J. Mol. Spectrosc., 268, 123
- Yurchenko et al. (2009) Yurchenko S. N., Barber R. J., Yachmenev A., Thiel W., Jensen P., Tennyson J., 2009, J. Phys. Chem. A, 113, 11845
- Yurchenko et al. (2003) Yurchenko S. N., Carvajal M., Jensen P., Herregodts F., Huet T. R., 2003, Chem. Phys., 290, 59
- Yurchenko & Tennyson (2014) Yurchenko S. N., Tennyson J., 2014, MNRAS, 440, 1649
- Yurchenko et al. (2014) Yurchenko S. N., Tennyson J., Bailey J., Hollis M. D. J., Tinetti G., 2014, Proc. Natl. Acad. Sci. U.S.A., 111, 9379
- Yurchenko, Thiel & Jensen (2007) Yurchenko S. N., Thiel W., Jensen P., 2007, J. Mol. Spectrosc., 245, 126
- Yurchenko, Yachmenev & Ovsyannikov (2017) Yurchenko S. N., Yachmenev A., Ovsyannikov R. I., 2017, J. Chem. Theory Comput., submitted
- Zhu et al. (1991) Zhu Q. S., Qian H. B., Ma H., Halonen L., 1991, Chem. Phys. Lett., 177, 261
Supporting Information
Additional Supporting Information may be found in the online version of this article: