Accretion signatures in the X-shooter spectrum of the substellar companion to SR12
Abstract
About a dozen substellar companions orbiting young stellar objects or pre-main sequence stars at several hundred au have been identified in the last decade. These objects are interesting both due to the uncertainties surrounding their formation, and because their large separation from the host star offers the potential to study the atmospheres of young giant planets and brown dwarfs. Here, we present X-shooter spectroscopy of SR 12 C, a Myrs young brown dwarf orbiting SR 12 at an orbital separation of 1083 au. We determine the spectral type, gravity, and effective temperature via comparison with models and observational templates of young brown dwarfs. In addition, we detect and characterize accretion using several accretion tracers. We find SR 12 C to be a brown dwarf of spectral type L0 1, g = 4 0.5, an effective temperature of 2600 100 K. Our spectra provide clear evidence for accretion at a rate of . This makes SR 12 one of the few sub-stellar companions with a reliable estimate for its accretion rate. A comparison of the ages and accretion rates of sub-stellar companions with young isolated brown dwarfs does not reveal any significant differences. If further accretion rate measurements of a large number of substellar companions can confirm this trend, this would hint towards a similar formation mechanism for substellar companions at large separations and isolated brown dwarfs.
keywords:
brown dwarfs – stars: pre-main-sequence – accretion, accretion discs-1 Introduction
Planetary mass or brown dwarf companions which orbit their host stars at separations exceeding 100 au are intriguing objects that may provide the potential to perform detailed investigations of the atmospheres of young giant planets and brown dwarfs. However, how these interesting sub-stellar companions (SSCs) formed remains a mystery. At separations of several hundred au (i.e. much larger than most known exoplanets or brown dwarf companions) the currently most accepted planet formation scenario of in-situ core accretion is unlikely to occur. This is because the time required for core growth at these large distances significantly exceeds the typical lifetime of protoplanetary disks. Instead, several alternative scenarios have been suggested. Pollack et al. (1996) proposed that rocky planetesimals could grow to solid cores which are then scattered to larger separations where they accrete gaseous material to become the gas giant planets or brown dwarfs at large separations we observe. Alternatively, SSCs could represent the low mass end of multiple stars that formed similar to stellar binary stars, i.e. their formation mechanism could be fragmentation of collapsing protostellar clouds (e.g. Cha & Whitworth, 2003). Accretion in very young single brown dwarfs is consistent with direct fragmentation from collapsing molecular cores (Thies et al., 2015). SSCs could thus form the same way as single brown dwarfs with the only difference that they are members of multiple systems.
However, Kratter et al. (2010) pointed out that while this scenario offers a reasonable explanation for brown dwarf or stellar companions, it only works for the planetary mass companions if the companion forms at nearly exactly the time the circumstellar envelope is exhausted which can be considered rather unlikely. Another scenario that has been suggested for the formation of SSCs are gravitational instabilities (GI). If a massive gaseous disk becomes gravitationally unstable and fragments into a number of self-gravitating bound structures (Boss, 1997), these structures can then further collapse to become giant planets or brown dwarfs. However, models suggest that while the disk instability can indeed form planets at separations 30-70 au (Boss, 2011), it is unclear if the mechanism also works at separations of several hundred au (e.g. Rafikov, 2007). To overcome this problem, SSCs could form closer and be ejected to large orbital separations (Whitworth & Stamatellos, 2006; Stamatellos et al., 2007). Even clear predictions for objects formed by disk instabilities or an isolated cloud have been presented (Stamatellos & Herczeg, 2015). However, more recently Mercer & Stamatellos (2017) included radiation feedback in the models and find that planetary mass companions formed through disk instabilities are most likely ejected. In addition, Meru & Bate (2010); Kratter & Murray-Clay (2011) find that gravitational instabilities only occur for a certain and rather narrow set of conditions.
Despite the increasing number of SSCs detected at more than 100 au from their host systems and masses below 30 (Neuhäuser et al., 2005; Lafrenière et al., 2008; Schmidt et al., 2008a; Deacon et al., 2016; Naud et al., 2014), we struggle to understand which formation mechanism is most appropriate. An important trait to study in order to progress with our understanding of SSC formation is whether they are still accreting gas and at what rate this accretion proceeds. Accretion plays a key role in the formation of all stars, brown dwarfs, and giant planets. Unfortunately, clear evidence based on spectroscopy for accretion in SSCs has been reported only for FW Tau b, CT Cha b and GSC 06214-00210 B (Bowler et al., 2014; Bowler et al., 2011; Wu et al., 2015b).
The small number of accretion measurements for SSCs is caused by the fact that, despite their relatively large separations, classical spectroscopy of SSCs is often impossible due to the large contrast at optical wavelength and limited spatial resolution in the infrared. One exception where spectroscopic accretion measurements are feasible is the brown dwarf companion to the young stellar object SR 12. SR 12 C is an SSC at a separation of more than 1000 au from the central binary. SR 12 AB is a binary T Tauri star which is located in the Ophiuchi star-forming region. The central binary, consists of stars with spectral type K4 and M2.5 (Bouvier & Appenzeller, 1992; Gras-Velázquez & Ray, 2005) with estimated masses of 1.05 and 0.5 . The separation of the two components is 0."21, equivalent to 26 au. The age of SR 12 is unfortunately very uncertain. Kuzuhara et al. (2011) assumed that the age of SR 12 C corresponds to the age of young stellar objects in the low-extinction region of Oph and provided a rough estimate of Myr. A younger age (0.016 Myrs) has been obtained by Wahhaj et al. (2010) using the stellar evolutionary tracks from Siess et al. (2000) but these authors themselves recommend to use the provided ages only to compare the relative ages of groups of objects. Throughout this work we thus assume an age of Myrs keeping in mind that this value represents a very rough estimate. The projected separation between SR 12 C and the central T Tauri star on the sky is 8.7", which corresponds to 1083 217 au at 125 25 pc (de Geus et al., 1989). Kuzuhara et al. (2011) obtained NIR spectra of SR 12 C with CISCO mounted on the Subaru telescope. They further showed that the probability of an arbitrarious alignment between SR 12 C and SR 12 AB is 1 per cent. Based on theoretical age-luminosity relations the mass of SR 12 C has been estimated to be 0.013 0.007 (Kuzuhara et al., 2011). Bowler et al. (2014) observed SR 12 C with IRTF/SpeX and obtained spectra that matched an M9 0.5 spectral type, corresponding to a K using relation provided by Luhman et al. (2003).
SR 12 C is an ideal object to test for accretion in SSCs because of its large separation from the central binary. We here present X-shooter spectroscopy of SR 12 C and provide clear evidence for ongoing accretion based on several accretion indicators. This makes SR 12 C just the fourth SSC with clear evidence for accretion. We also find that SSCs accrete at a rate similar to isolated objects and that accretion might perhaps cease at about the same age as in isolated low-mass objects.
2 Observations
The large spectral coverage of X-Shooter (Vernet et al., 2011), extending from the UBV to NIR, allows to probe simultaneously several accretion features (e.g. Rigliaco et al., 2012; Manara et al., 2013; Alcalá et al., 2014). We observed SR12 with X-Shooter on the second of May 2016. The weather conditions were photometric with good seeing (less than 1"). We used slit widths of 1.3", 1.5" and 1.2" for the UVB, VIS and NIR arm respectively. The exposure time was 4000 s in total with a resolution of R4000 for the UVB, R5400 for the VIS, R3890 for NIR. Although SR 12 C is separated from the central binary by a few times the seeing, the large flux contrast with the primary precludes us from detecting it on the acquisition images. To obtain the required spectrum we thus applied blind offsets to the acquisition images to place the slit on the companion using the position angle and separation values provided by Kuzuhara et al. (2011). The obtained data were reduced with the X-shooter pipeline using the stare mode. The obtained SNR for the UVB were 2.3, 12.57 for the VIS arm, and 19.02 for the NIR arm. Telluric correction and sky substraction was implemented with molecfit (Kausch et al., 2015; Smette et al., 2015) and Skycorr (Noll et al., 2014). The clipping method was implemented to remove pixels deviating by more than 2.4 from the median. To evaluate whether contamination from the central binary system affected our spectrum we fitted a combination of a Gaussian and a straight line to the 2D spectrum after binning 5 pixels in the dispersion direction. We do not find any evidence for a flux gradient in the background which clearly confirms that contamination from the central binary is negligible.
3 Characterizing SR 12 C
The obtained X-shooter spectrum of SR 12 C covers the UV to NIR simultaneously and allows us to derive tight constraints on the physical properties of this young brown dwarf. To that end we fit both theoretical and observational templates to the X-shooter spectrum and derive spectral type, surface gravity, and temperature of the SSC.
3.1 Fitting model templates
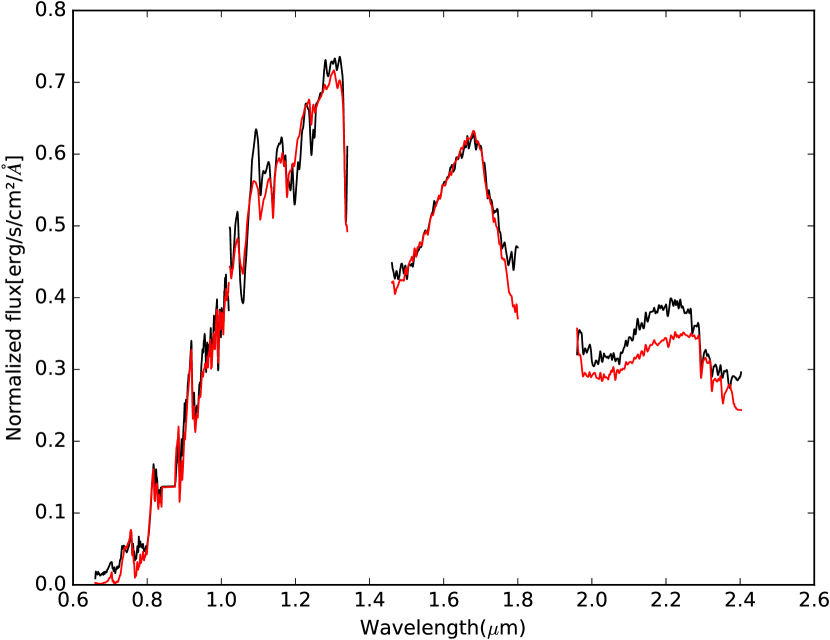
We used a grid of spectra based on BT-SETTL models (Allard, 2014) to fit the X-shooter spectrum. These model spectra assume solar abundances and cover near infrared to visible wavelengths. Our grid covered values of ranging from 1600 to 3000 K and gravities between g = 2.5 and 5.5 with a step sizes of 100 K and g0.5 respectively. To isolate the purely photospheric features that should be reproduced by the models, we masked telluric regions in the IR and the most prominent emission lines, which were H, the Ca II triplet (8662, 8542, 8498 Å), and the OI line at 8446 Å. We also resampled the theoretical spectra in order to obtain the same spectral resolution as the observed spectrum. We used the extinction law from Fitzpatrick (1999) with a fixed ratio of total to selective extinction () leaving as a free parameter to account for the intrinsic dust expected in the photosphere of brown dwarfs with effective temperature in the range from 2500 to 2700K. This dust and its effect on the emitted spectrum is known to be not accurately described by the theoretical models (Manjavacas et al., 2014; Bayo et al., 2017). We furthermore added a component for the interstellar extinction with and a fixed colour excess of that was obtained fitting only the visual part of the spectrum where the extinction curve is in the linear regime (see Fig. 1 in Fitzpatrick, 1999). For each theoretical spectrum we used least square minimization with the extinction produced by the dust in the photosphere of the brown dwarf and the scaling factor as free parameters. The best fit had a temperature of 2600 K and a surface gravity of g= 4.0 with reduced . However, we note that models in the range of 2500 K to 2800 K and with g between 3.5 and 4.5 fit almost equally well the observations with values in the range of . Based on visual inspection focusing on the shape of the spectrum in the J and H band, we finally estimate =2600100 K and g= 4.00.5. Combining these values for the effective temperature and the gravity with the isochrones from the BT-Settl models we derived an age estimate of 2 to 15 Myr (which is consistent with the 2 Myrs we assume throughout this work). The mass of SR 12 C we estimate this way is slightly larger (but still within 2) than previously estimated. Figure 1 compares the observed spectrum and the best fit model. The observed spectrum is plotted in red while the best fitting model spectrum is represented by the black line. In the wavelength range from 0.66 to 2.0 m the model reproduces well the observations. However, in the K band the model predicts too much flux. As mentioned above, this effect is well-known and generally explained by the presence of dust in the atmosphere of the brown dwarf which increases extinction and which is not properly included in the models (Hiranaka et al., 2016; Manjavacas et al., 2014; Marocco et al., 2014). Our simple addition of an extra-extinction can not entirely solve this issue most likely because extinction laws assume grain size distributions that do not need to match those of substellar atmospheres. In the H band the spectrum shows a triangular profile previously reported by Bowler et al. (2014) and Kuzuhara et al. (2011). This feature is a commonly known indicator of low surface gravity (Martín & Zapatero Osorio, 2003; Kirkpatrick et al., 2006) in agreement with the age derived for SR 12.
3.2 Observational template fitting
We used two sets of observational templates to determine the spectral type of SR 12 C. First we used a library of near-infrared (1.1-2.45 µm) integral field spectra of young M-L dwarfs with a resolution of R – (Bonnefoy et al., 2014). These spectra were obtained with the Spectrograph for INtegral Field Observations in the Near Infrared (SINFONI) mounted at the VLT/UT4. The second set of spectra that we used was the SpeX prism Library (Rayner et al., 2003) which is a repository of low-resolution spectra, primarily of low-temperature brown dwarfs, obtained with the SpeX spectrograph on the 3m NASA Infrared Telescope Facility on Mauna Kea, Hawaii. The wavelength coverage of these spectra is . We used both libraries as the SINFONI spectra have a resolution similar to our observations but cover just the near-infrarred while the SpeX spectra cover the same wavelength range as our spectrum but with a significantly lower resolution. The combination of both libraries may provide the most accurate constraints on the spectral type of SR 12 C.
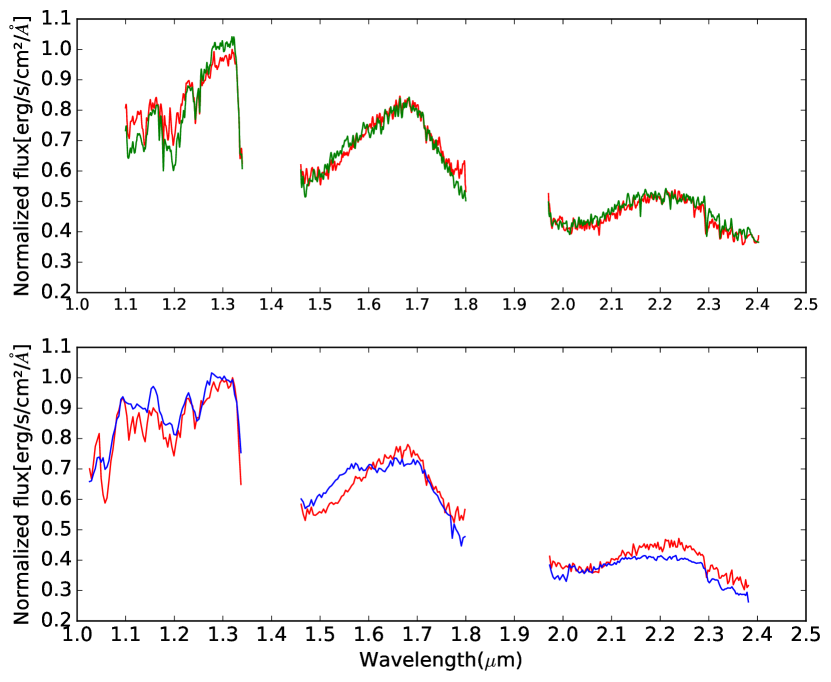
In both cases we resampled the observed SR 12 C spectrum to obtain the same resolution as the templates. We also de-reddened SR 12 C with and . The value for was obtained as explained in Sect. 3.1. The H line and the Ca II triplet were masked out in the case of the SpeX prism Library. Using the SINFONI spectra we obtained the best fit ( = 5.6) with 2M40141, a brown dwarf classified as L0. While the spectrum of the M9.5 object OTS 44 still provides a reasonable fit ( = 6.6) the fit gets much worse if we move to earlier spectral types ( for 2M1207 A with a spectral type M8.5). The library does not contain complete spectra for L1-L3 objects but the L4 object Gl417B does clearly not provide a good fit ( = 9.4). The top panel of Fig. 2 compares the spectrum of SR 12 C (red line) with the scaled spectrum of 2M40141 (green line).
The best fit ( = 4.0) using the SpeX library was obtained with 2MASP J0345432+2543023 which is classified as an L0 at optical wavelength and as an L11 brown dwarf in the NIR. While using M9 and L1 spectra available in the library (objects LHS 2924 and 2MASSW J1439284+192915) provides still reasonable agreement ( = 5.1 and 6.5 respectively), earlier or later spectral types do clearly not provide acceptable approximations of our observations as increases by more than a factor of three compared to our best fit.
The bottom panel of Fig. 2 shows the spectrum of SR 12 C (red line) versus a scaled version of 2MASP J0345432+2543023 (blue line). Both templates fit the K band much better than the theoretical spectrum which indicates that, despite significant recent progress, spectral models probably lack a proper description of the effects of dust in the atmosphere of brown dwarfs (Manjavacas et al., 2014).
Our results agree with previous studies. Kuzuhara et al. (2011) and also Bowler et al. (2014) obtained a for the spectral type of SR 12 C. Using the -spectral type relation provided by Luhman et al. (2003), our spectral type determination converts to K, in reasonable agreement with the value we found from fitting theoretical spectra. We conclude that SR 12 C should be classified as an L01 brown dwarf.
3.3 Radial velocity measurements
We measured the radial velocity of SR 12 C using two different features, the calcium triplet emission lines (8662, 8542, 8498 Å) and the sodium absorption doublet (5889.9, 5895.9 Å). We fitted the triplet and the doublet simultaneously and found radial velocities of -6.1 1.0 km/s (calcium triplet) -7.4 2.8 km/s (sodium doublet). We also reduced an archival spectrum of the central binary (SR 12 AB) which had been taken in the framework of ESO project 093.C-0506(A). This spectrum was taken with a position angle of 161.462 degrees and a total integration time of 120 seconds. We fitted the same lines for the host star and we obtained the following radial velocities: -6.7 0.5 km/s (calcium triplet) and -7.1 0.5 km/s (sodium doublet). We conclude that there is no radial velocity difference between SR 12 C and the central binary system. This indicates that the formation scenario in which PMCs form close to the central object and are then ejected does probably not apply to SR 12 C.
3.4 Identification of absorption lines
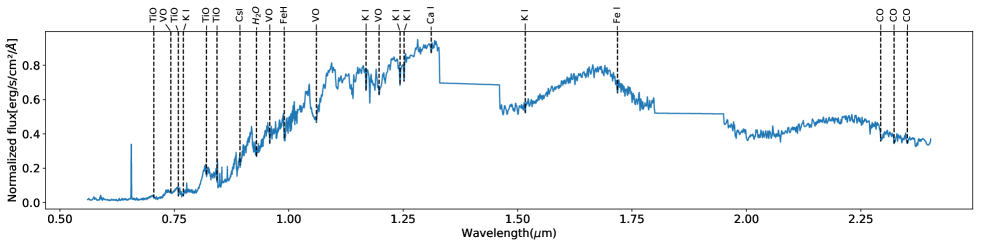
While the main focus of this work is on accretion signatures and possible constraints on formation theories of PMCs, for the sake of completeness we investigated which photospheric absorption lines are present in our X-shooter spectrum. We used Fig. 2 of Bayo et al. (2017) as a reference for typical spectral features in late M and L dwarfs (see also Jones et al., 1994; Kirkpatrick et al., 1993; Geballe et al., 1996; Allard et al., 1997). We identified several in the spectrum of SR 12 C that are common in late M and early L stars (see Fig. 3). A complete list of these lines together with the measured equivalent widths is given in the appendix.
4 Accretion
As outlined in the introduction, an important parameter for constraining formation scenarios for SSCs is the age range in which these objects accrete and the associated mass accretion rates.
The X-shooter spectrum of the brown dwarf orbiting SR 12 contains clear evidence for ongoing accretion. According to the magnetospheric accretion model (Koenigl, 1991) the stellar magnetosphere truncates the disk near the surface of the star. Material from the inner disk is transferred through magnetic field lines as accretion columns onto the high latitude regions of the star where it dissipates its kinetic energy in standing shocks (Calvet & Gullbring, 1998). Shock fronts at the base of the accretion columns create a high temperature layer (Koenigl, 1991; Gullbring, 1994; Lamzin, 1995) of K where the optically thick post shock gas and optically thin pre-shock gas generate emission leading to broad velocity profiles of and the CaII IR triplet. Other emission lines that are produced in the shocks at the base of the accretion columns and that are frequently used to measure accretion are the Paschen and the Balmer series, and Oxygen lines. We identified all these accretion tracers in the X-shooter spectrum of SR 12 C and measured the accretion rates using eight of them.
4.1 Accretion estimated from emission
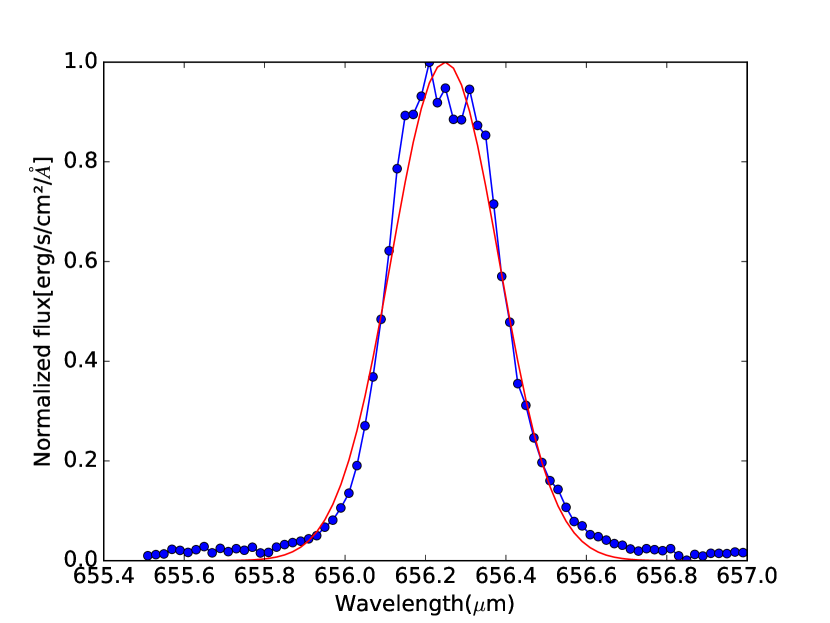
H is the most commonly used accretion indicator in Classical T-Tauri stars(CTTS). Accretion rates seem to correlate well with the H 10 per cent width (Natta et al., 2004) where values 200 km/s Jayawardhana et al. (2003) or 270 km/s (Cieza et al., 2010) are considered as evidence for accretion (see also Romero et al., 2012; Cieza et al., 2012, for a discussion). Less broad emission lines can be produced by chromospheric activity and cannot be interpreted as evidence for accretion.
Although this diagnostic was originally developed for CTTS it can be used for objects below the hydrogen burning limit as well. In brown dwarfs, H has been used to measure accretion adopting the limit of 200 km/s and using the following equation
| (1) |
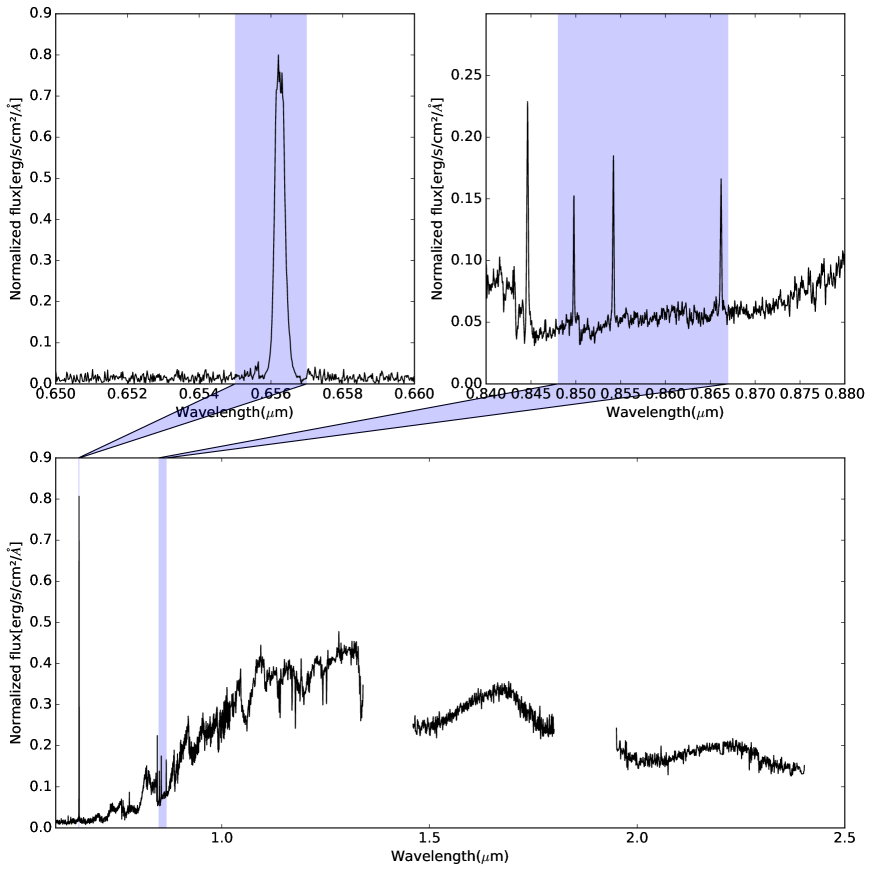
where is in km/s and in (Natta et al., 2004). Using this method we obtain 266.3 km/s as the 10 per cent width which correspond to a (see Fig. 4).
| Line (Å) | EW (Å) | Flux line (W/) | (/ | () |
|---|---|---|---|---|
| H 6562.8 | ||||
| H 4861 | ||||
| H 4341 | ||||
| H11 3771 | ||||
| OI 8446 |
4.2 Accretion measured with the Ca II triplet
The CaII triplet emission lines are another frequently used accretion indicator in young stellar objects. These lines are present in SR 12 C and the line flux ratio clearly indicates accretion (see Fig. 5). As shown by Comerón et al. (2003), if the line flux ratio is close to 1:1:1, the lines cannot be produced by chromospheric activity because optically thin emission would cause line flux ratios of 1:9:5. Measuring the line flux ratio of the CaII triplet is therefore one of the most reliable accretion tracers. We measured the line flux ratio and obtained 1:1.37:1.09, a clear sign of ongoing accretion in SR 12 C.
Furthermore, Comerón et al. (2003) derived simple equations relating the accretion rate to the line flux based on the theoretical work of Muzerolle et al. (1998). These relations are:
| (2) |
| (3) |
where is the line flux, is the magnitude of the star at 8542, and is the visual extincton at the wavelength of the line. Using the above relations we obtained an accretion rate of for SR 12 C.
| Object | Mass | Age | Separation | SpT | Primary | Accretionb | Accretion rate | References |
|---|---|---|---|---|---|---|---|---|
| () | (Myr) | (AU) | log() | |||||
| 1RXS J1609-2105b | 5 | 330 | L21 | S | N | - | 1,2,3,4,5 | |
| ROXs 42B b | 93 | 140 | L11 | B | U | - | 6,7 | |
| FW Tau b | 6-14 | 330 | - | B | Y | -11.0 | 6,7,8 | |
| ROXs 12 b | 12-20 | 210 | - | S | - | 7,9 | ||
| CHXR 73 B | 2 | 210 | M9.5 | S | U | - | 10,11 | |
| DH Tau B | 1-2 | 330 | M9.25 0.25 | S | Y | -9 to -11 | 9,12,13,14,30 | |
| GSC 6214-210 B | 5 | 320 | M9.5 1 | S | Y | -10.7 1.3 | 5,6,15 | |
| CT Cha B | 176 | 0.9-3 | 440 | - | S | Y | -9.22 | 16,32 |
| WD 0806-661B | 8 2 | 1.50.3 | 2500 | Y | S | U | - | 17,18 |
| HD 106906 b | 112 | 132 | 6543 | L2.5 1 | S | U | - | 19, 2 |
| Ross 458 C | 114.5 | 150-800 | 1168 | T8.50.5 | B | U | - | 20,21,22,23,24,25 |
| AB Pic B | 130.5 | 0.9-3 | 275 | L0 1 | S | U | - | 26,27 |
| SR 12 C | 137 | 2 | 1083217 | L0 1 | B | Y | -9.840.53 | 6,28,29 |
| Oph 1622-2405 | 213 | 112 | 24355 | L8 | S | U | - | 2,33 |
| UScoCTIO 108 b | 112 | 670 | M9.5 | S | U | - | 2,34 |
-
•
Notes
Table based on Table 1 from Bowler et al. (2014) a Single("S") or Binary ("B") b Yes("Yes"), No("N"), Unknown or non reported ("U") c Bowler et al. (2014) They also calculated log = 11.4 1.3 () depending on the calculation of the Mass. d Kraus et al. (2014) describes H line weak as a WTTS, accretion was discarded. GSC 6214-210 B and FW TAU B accretion rate are based on Paschen . In the case of DH TAU B the accretion rate is based on its optical excess emission. Accretion rate of CT Cha B measured from excess emission in r’. -
•
References.
(1) Wu et al. (2015b);(2) Pecaut et al. (2012);(3) Lafrenière et al. (2008);(4) Lafrenière et al. (2010);(5) Ireland et al. (2011);(6) Bowler et al. (2014);(7) Kraus et al. (2014);(8)Caceres et al. (2015);(9)Bouvier & Appenzeller (1992);(10)Luhman (2004);(11)Luhman et al. (2006);(12)Itoh et al. (2005);(13)White & Ghez (2001);(14)Bonnefoy et al. (2014);(15)Bowler et al. (2011);(16)Schmidt et al. (2008b); (17) Rodriguez et al. (2011); (18) Luhman et al. (2011): (19) Bailey et al. (2014); (20) Goldman et al. (2010); (21) Dupuy & Kraus (2013); (22)Scholz et al. (2012); (23) Burgasser et al. (2010); (24) Burningham et al. (2011);(25) Beuzit et al. (2004); (26)Chauvin et al. (2005); (27)Perryman et al. (1997); (28)Kuzuhara et al. (2011);(29) this work; (30) Zhou et al. (2014); (31) Neuhäuser et al. (2005); (32) Wu et al. (2015a); (33) Close et al. (2007); Béjar et al. (2008)
4.3 Accretion rate based on Paschen
One of the regularly used accretion tracers in low-mass stars is Paschen . Natta et al. (2004) found that the Pa luminosity correlates with the accretion luminosity. We measured the Pa luminosity in SR 12 C and obtained . The empirical relation found by Natta et al. (2004) and revised by Rigliaco et al. (2012) is which gives for SR 12 C. Assuming a mass of SR 12 C of (Kuzuhara et al., 2011) and a radius of (derived from the gravity values we obtained by spectral fitting) finally results in a mass accretion rate of yr-1.
4.4 Accretion rate based on the OI line
Additional emission lines that can be related to accretion are those from OI (e.g. Joergens et al., 2012). Our X-shooter spectrum contains a strong OI 8446 emission line that we here use to add another measurement of the accretion rate in SR 12 C. First, we calculate the line luminosity in a similar fashion as in the previous subsection. We then use Fig. 10 from Herczeg & Hillenbrand (2008) to estimate the accretion luminosity of SR 12 C (note that the coefficients for the shown linear correlation are not given) and finally obtain an accretion rate of using the mass and radius of SR 12 C as above. The given uncertainty does not take into account the standard deviation of the linear fit from Herczeg & Hillenbrand (2008) as these values are not available to us. However, the included uncertainties related to the mass and radius of SR 12 C likely dominate the error estimate.
4.5 Accretion rates derived from other Hydrogen lines
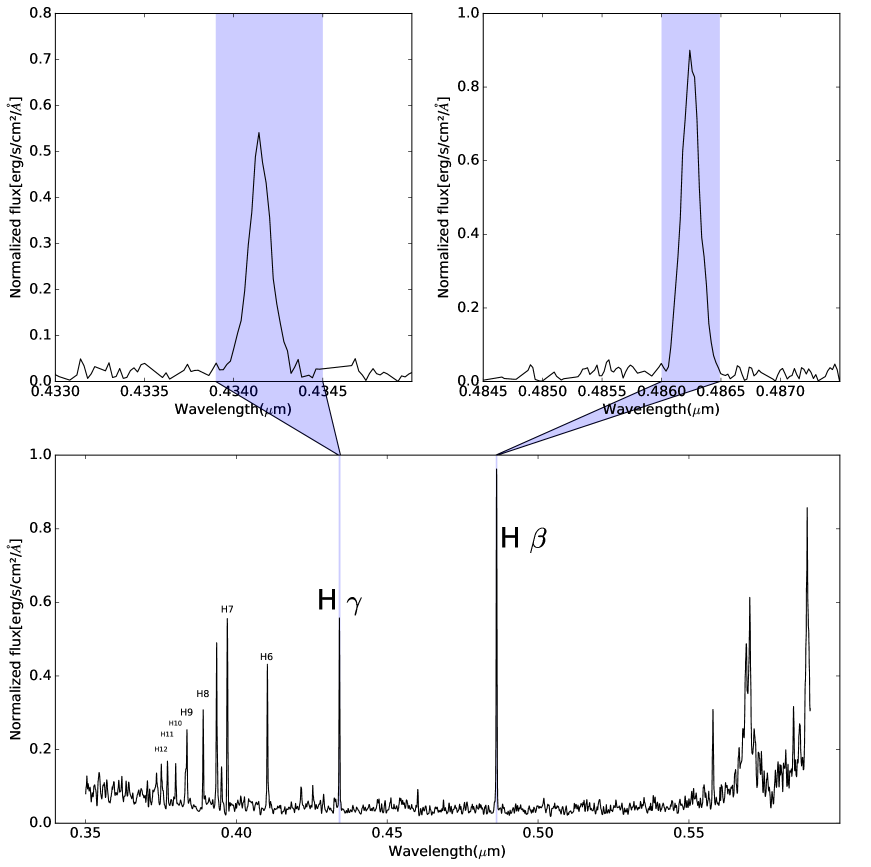
The entire Balmer and Paschen emission line series has been used to measure accretion (Ferguson, 1997). We used to relate the accretion luminosity and the luminosities of the lines (see Fang et al. 2009; Herczeg & Hillenbrand 2008 and Table 6 and 8 from Rigliaco et al. 2012). We applied this method to the H, H, H and H11 lines identified in the spectrum of SR 12 C. Figure 6 shows the UV spectrum (bottom panel) of SR 12 C. Equivalent width, flux line (W/), (/ and accretion luminosity in solar units are given in Table 1. The resulting accretion rates can be found in Table 2.
5 Discussion
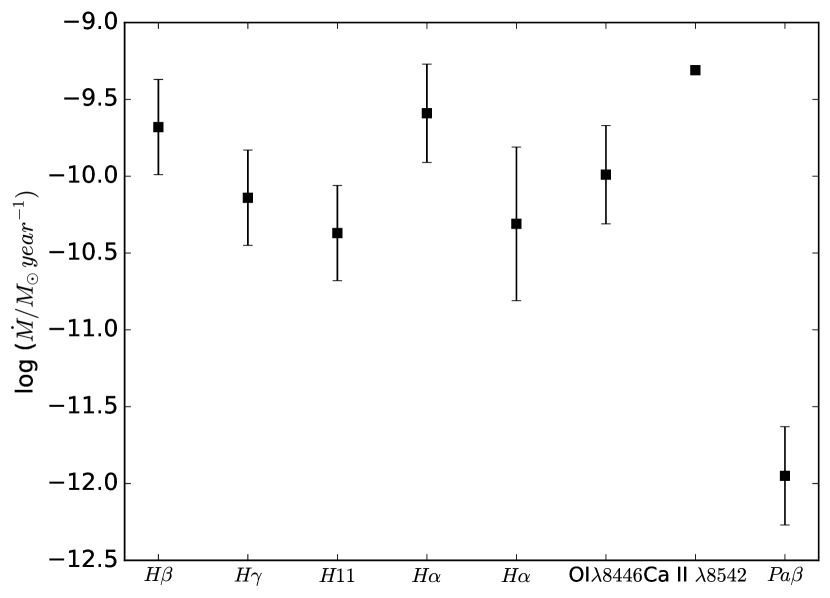
We have measured accretion rates for the substellar companion (SSC) to the young binary SR 12 using eight different methods. In general, the measured accretion rates are very similar and agree with each other. However, the accretion rate measurement based on Pa is significantly lower than the other values we obtain, as illustrated in Fig. 7. As all values agree very well except the one obtained from Pa, the empirical relation used for Pa seems to provide accretion rates that are perhaps less reliable. This hypothesis is somewhat supported by looking at the accretion rates obtained for other SSCs. Accretion rate measurements exist for three other SSCs(CT Cha b,GSC 6214-210 B and FW Tau B). For CT Cha b Wu et al. (2015b) estimate a relatively high accretion rate of ()=-9.22 from interpreting excess emission in the r’ -band as caused by H emission. This is similar to the value we obtained for SR 12 C using all techniques (i.e. ) except the one based on Pa. For GSC 6214-210 B and FW Tau B published accretion rate measurements are based on Pa emission and the obtained values are relatively low, i.e. and respectively. Thus one might get the impression that indeed be that Pa accretion rates of SSCs are systematically lower. However, Joergens et al. (2013) investigated accretion on the isolated brown dwarf OTS 44 and find that the rate derived from Pa is significantly larger than the one obtained from H. Thus, further simultaneous measurements of accretion rates based on different lines are needed before any firm conclusions can be drawn. Nevertheless, we conclude that the higher values we obtain for SR 12 C with 8 different methods probably represent a more reliable estimate of the accretion rate in SR 12 C. The currently available accretion rate measurements for SSCs as listed in Table 3. In addition to the three objects mentioned above, two more objects have accretion rate estimates based on the accretion luminosity from excess continuum emission (Zhou et al., 2014).
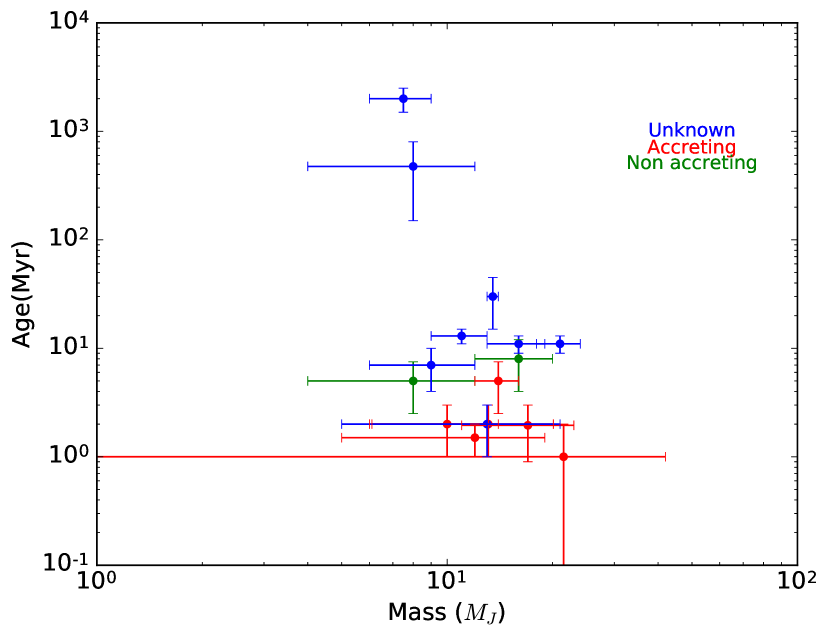
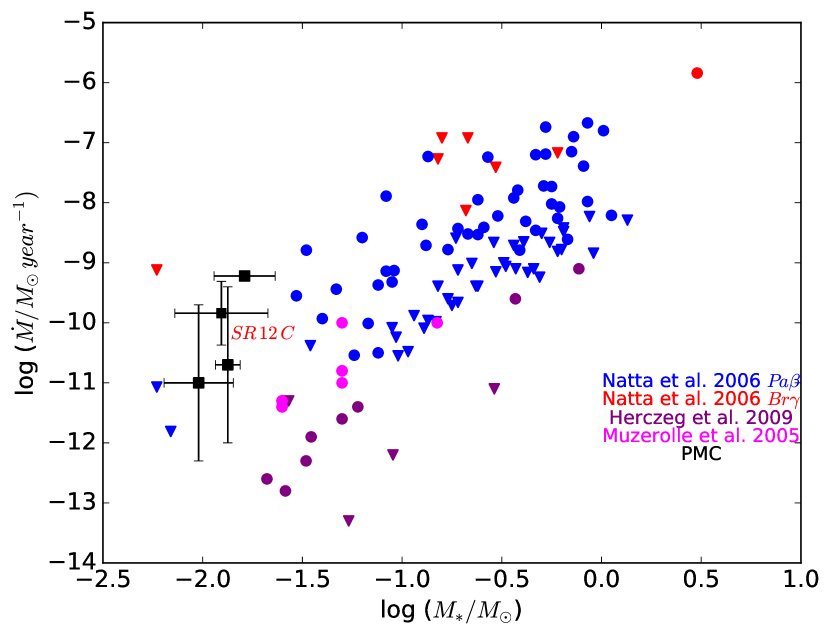
In Fig. 8 we show accreting and non accreting systems as a function of age and mass. Objects in red are those that are accreting, objects in green have been reported as non-accreting in the literature, and the objects in blue lack accretion measurements. While more measurements are clearly needed before we can draw firm conclusions, this figure illustrates that SSCs younger than 10 Myr seem to be generally accreting. A similar tendency is observed in isolated brown dwarfs. For example, Liu et al. (2003) identify a decreasing disk fraction around low-mass objects and brown dwarfs supporting the idea that disks do usually not survive longer than 10 Myr. The potential similarity between isolated low-mass objects and SSCs is further supported by Figure 9 where we show the position of the SSCs with accretion measurements in the diagram together with young isolated low mass stars and brown dwarfs. SSCs seems to follow the usual correlation between mass an accretion rate (see also Bowler et al., 2014).
In summary, SSCs seem to share two accretion traits with young isolated brown dwarfs. These are their similar accretion rates, as well as the observation that both are accreting if they are younger than 10 Myrs. Although we are in an early stage concerning the understanding of these objects and only few observational constraints are available, the measured accretion rates might indicate that SSCs perhaps form in a similar way as isolated brown dwarfs. For example, if SSCs are originally formed close to the host star due to core accretion, one would expect the circumplanetary disks to be severely affected (see Bowler et al., 2011, for details) and would thus not expect the accretion on the companions to follow the same trend as observed in single low-mass objects. For the remaining two scenarios, disk instabilities and collapsing protostellar clouds, the predicted accretion rates are quite similar (Stamatellos & Herczeg, 2015). The currently available measurements accretion rates of SSCs do not allow to distinguish between the two scenarios although the larger accretion rates predicted by disk instability models would perhaps even fit slightly better. However, if radiation feedback is included disk fragmentation has general problems in producing planetary mass companions at large separations (Mercer & Stamatellos, 2017). The least problematic formation scenario therefore seems to be collapsing prestellar clouds, i.e. SSCs represent just the low-mass end of companions in multiple stellar systems.
6 Conclusion
SR 12 C is a substellar companion orbiting the binary system SR 12 AB at a projected separation of 1083 217 au in the Ophiuchus star forming cloud. We observed SR 12 C using X-Shooter and fitted the resulting spectrum with a set of theoretical templates and two different sets of observational templates and find that SR 12 C is best described as brown dwarf with surface gravity , a temperature of 2600 K and that its spectral type is L0. These results agree well with previous studies of the object.
Investigating several accretion indicators we find that our X-shooter spectrum provides clear evidence for ongoing accretion in SR 12 C. We estimated the accretion rate using different emission lines and different methods and find that the obtained values cluster around .
Comparing the accretion rate measured for SR 12 C with those obtained for other SSCs and young isolated brown dwarfs we do not find indications for any significant differences. Indeed, it seems that most SSCs accrete if they are younger than Myrs and with similar rates as young isolated low-mass objects. While further observations of SSCs are clearly needed, this might perhaps indicate that the formation mechanism for isolated brown dwarfs and low-mass stars also produces substellar companions.
Acknowledgements
This research has benefitted from the SpeX Prism Spectral Libraries, maintained by Adam Burgasser. ASM, CC, MRS thank for support from the Millennium Science Initiative (Chilean Ministry of Economy), through grant RC13007. MRS also achnowledges support from Fondecyt (1141269). CC acknowledges support from CONICYT PAI/Concurso nacional de insercion en la academia 2015, Folio 79150049. A. Bayo acknowledges financial support from the Proyecto Fondecyt Iniciación 11140572
References
- Alcalá et al. (2014) Alcalá J. M., et al., 2014, A&A, 561, A2
- Allard (2014) Allard F., 2014, in Booth M., Matthews B. C., Graham J. R., eds, IAU Symposium Vol. 299, Exploring the Formation and Evolution of Planetary Systems. pp 271–272, doi:10.1017/S1743921313008545
- Allard et al. (1997) Allard F., Hauschildt P. H., Alexander D. R., Starrfield S., 1997, ARA&A, 35, 137
- Bailey et al. (2014) Bailey V., et al., 2014, ApJ, 780, L4
- Bayo et al. (2017) Bayo A., et al., 2017, MNRAS, 465, 760
- Béjar et al. (2008) Béjar V. J. S., Zapatero Osorio M. R., Pérez-Garrido A., Álvarez C., Martín E. L., Rebolo R., Villó-Pérez I., Díaz-Sánchez A., 2008, ApJ, 673, L185
- Beuzit et al. (2004) Beuzit J.-L., et al., 2004, A&A, 425, 997
- Bonnefoy et al. (2014) Bonnefoy M., Chauvin G., Lagrange A.-M., Rojo P., Allard F., Pinte C., Dumas C., Homeier D., 2014, A&A, 562, A127
- Boss (1997) Boss A. P., 1997, Science, 276, 1836
- Boss (2011) Boss A. P., 2011, ApJ, 731, 74
- Bouvier & Appenzeller (1992) Bouvier J., Appenzeller I., 1992, A&AS, 92, 481
- Bowler et al. (2011) Bowler B. P., Liu M. C., Kraus A. L., Mann A. W., Ireland M. J., 2011, ApJ, 743, 148
- Bowler et al. (2014) Bowler B. P., Liu M. C., Kraus A. L., Mann A. W., 2014, ApJ, 784, 65
- Burgasser et al. (2010) Burgasser A. J., et al., 2010, ApJ, 725, 1405
- Burningham et al. (2011) Burningham B., et al., 2011, MNRAS, 414, 3590
- Caceres et al. (2015) Caceres C., et al., 2015, ApJ, 806, L22
- Calvet & Gullbring (1998) Calvet N., Gullbring E., 1998, ApJ, 509, 802
- Cha & Whitworth (2003) Cha S.-H., Whitworth A. P., 2003, MNRAS, 340, 91
- Chauvin et al. (2005) Chauvin G., et al., 2005, A&A, 438, L29
- Cieza et al. (2010) Cieza L. A., et al., 2010, ApJ, 712, 925
- Cieza et al. (2012) Cieza L. A., Schreiber M. R., Romero G. A., Williams J. P., Rebassa-Mansergas A., Merín B., 2012, ApJ, 750, 157
- Close et al. (2007) Close L. M., et al., 2007, ApJ, 660, 1492
- Comerón et al. (2003) Comerón F., Fernández M., Baraffe I., Neuhäuser R., Kaas A. A., 2003, A&A, 406, 1001
- Deacon et al. (2016) Deacon N. R., Schlieder J. E., Murphy S. J., 2016, MNRAS, 457, 3191
- Dupuy & Kraus (2013) Dupuy T. J., Kraus A. L., 2013, Science, 341, 1492
- Fang et al. (2009) Fang M., van Boekel R., Wang W., Carmona A., Sicilia-Aguilar A., Henning T., 2009, A&A, 504, 461
- Ferguson (1997) Ferguson D. H., 1997, ApJ, 486, 987
- Fitzpatrick (1999) Fitzpatrick E. L., 1999, PASP, 111, 63
- Geballe et al. (1996) Geballe T. R., Kulkarni S. R., Woodward C. E., Sloan G. C., 1996, ApJ, 467, L101
- Goldman et al. (2010) Goldman B., Marsat S., Henning T., Clemens C., Greiner J., 2010, MNRAS, 405, 1140
- Gras-Velázquez & Ray (2005) Gras-Velázquez À., Ray T. P., 2005, A&A, 443, 541
- Gullbring (1994) Gullbring E., 1994, A&A, 287, 131
- Herczeg & Hillenbrand (2008) Herczeg G. J., Hillenbrand L. A., 2008, ApJ, 681, 594
- Herczeg et al. (2009) Herczeg G. J., Cruz K. L., Hillenbrand L. A., 2009, ApJ, 696, 1589
- Hiranaka et al. (2016) Hiranaka K., Cruz K. L., Douglas S. T., Marley M. S., Baldassare V. F., 2016, ApJ, 830, 96
- Ireland et al. (2011) Ireland M. J., Kraus A., Martinache F., Law N., Hillenbrand L. A., 2011, ApJ, 726, 113
- Itoh et al. (2005) Itoh Y., et al., 2005, ApJ, 620, 984
- Jayawardhana et al. (2003) Jayawardhana R., Mohanty S., Basri G., 2003, ApJ, 592, 282
- Joergens et al. (2012) Joergens V., Kopytova T., Pohl A., 2012, A&A, 548, A124
- Joergens et al. (2013) Joergens V., Bonnefoy M., Liu Y., Bayo A., Wolf S., Chauvin G., Rojo P., 2013, A&A, 558, L7
- Jones et al. (1994) Jones H. R. A., Longmore A. J., Jameson R. F., Mountain C. M., 1994, MNRAS, 267, 413
- Kausch et al. (2015) Kausch W., et al., 2015, A&A, 576, A78
- Kirkpatrick et al. (1993) Kirkpatrick J. D., Kelly D. M., Rieke G. H., Liebert J., Allard F., Wehrse R., 1993, ApJ, 402, 643
- Kirkpatrick et al. (2006) Kirkpatrick J. D., Barman T. S., Burgasser A. J., McGovern M. R., McLean I. S., Tinney C. G., Lowrance P. J., 2006, ApJ, 639, 1120
- Koenigl (1991) Koenigl A., 1991, ApJ, 370, L39
- Kratter & Murray-Clay (2011) Kratter K. M., Murray-Clay R. A., 2011, ApJ, 740, 1
- Kratter et al. (2010) Kratter K. M., Murray-Clay R. A., Youdin A. N., 2010, ApJ, 710, 1375
- Kraus et al. (2014) Kraus A. L., Ireland M. J., Cieza L. A., Hinkley S., Dupuy T. J., Bowler B. P., Liu M. C., 2014, ApJ, 781, 20
- Kuzuhara et al. (2011) Kuzuhara M., Tamura M., Ishii M., Kudo T., Nishiyama S., Kandori R., 2011, AJ, 141, 119
- Lafrenière et al. (2008) Lafrenière D., Jayawardhana R., van Kerkwijk M. H., 2008, ApJ, 689, L153
- Lafrenière et al. (2010) Lafrenière D., Jayawardhana R., van Kerkwijk M. H., 2010, ApJ, 719, 497
- Lamzin (1995) Lamzin S. A., 1995, A&A, 295, L20
- Liu et al. (2003) Liu M. C., Najita J., Tokunaga A. T., 2003, ApJ, 585, 372
- Luhman (2004) Luhman K. L., 2004, ApJ, 602, 816
- Luhman et al. (2003) Luhman K. L., Stauffer J. R., Muench A. A., Rieke G. H., Lada E. A., Bouvier J., Lada C. J., 2003, ApJ, 593, 1093
- Luhman et al. (2006) Luhman K. L., et al., 2006, ApJ, 649, 894
- Luhman et al. (2011) Luhman K. L., Burgasser A. J., Bochanski J. J., 2011, ApJ, 730, L9
- Manara et al. (2013) Manara C. F., et al., 2013, A&A, 551, A107
- Manjavacas et al. (2014) Manjavacas E., et al., 2014, A&A, 564, A55
- Marocco et al. (2014) Marocco F., et al., 2014, MNRAS, 439, 372
- Martín & Zapatero Osorio (2003) Martín E. L., Zapatero Osorio M. R., 2003, ApJ, 593, L113
- Mercer & Stamatellos (2017) Mercer A., Stamatellos D., 2017, MNRAS, 465, 2
- Meru & Bate (2010) Meru F., Bate M. R., 2010, MNRAS, 406, 2279
- Muzerolle et al. (1998) Muzerolle J., Hartmann L., Calvet N., 1998, AJ, 116, 455
- Muzerolle et al. (2005) Muzerolle J., Luhman K. L., Briceño C., Hartmann L., Calvet N., 2005, ApJ, 625, 906
- Natta et al. (2004) Natta A., Testi L., Muzerolle J., Randich S., Comerón F., Persi P., 2004, A&A, 424, 603
- Natta et al. (2006) Natta A., Testi L., Randich S., 2006, A&A, 452, 245
- Naud et al. (2014) Naud M.-E., et al., 2014, ApJ, 787, 5
- Neuhäuser et al. (2005) Neuhäuser R., Guenther E. W., Wuchterl G., Mugrauer M., Bedalov A., Hauschildt P. H., 2005, A&A, 435, L13
- Noll et al. (2014) Noll S., Kausch W., Kimeswenger S., Barden M., Jones A. M., Modigliani A., Szyszka C., Taylor J., 2014, A&A, 567, A25
- Pecaut et al. (2012) Pecaut M. J., Mamajek E. E., Bubar E. J., 2012, ApJ, 746, 154
- Perryman et al. (1997) Perryman M. A. C., et al., 1997, A&A, 323, L49
- Pollack et al. (1996) Pollack J. B., Hubickyj O., Bodenheimer P., Lissauer J. J., Podolak M., Greenzweig Y., 1996, Icarus, 124, 62
- Rafikov (2007) Rafikov R. R., 2007, ApJ, 662, 642
- Rayner et al. (2003) Rayner J. T., Toomey D. W., Onaka P. M., Denault A. J., Stahlberger W. E., Vacca W. D., Cushing M. C., Wang S., 2003, PASP, 115, 362
- Rigliaco et al. (2012) Rigliaco E., Natta A., Testi L., Randich S., Alcalà J. M., Covino E., Stelzer B., 2012, A&A, 548, A56
- Rodriguez et al. (2011) Rodriguez D. R., Zuckerman B., Melis C., Song I., 2011, ApJ, 732, L29
- Romero et al. (2012) Romero G. A., Schreiber M. R., Cieza L. A., Rebassa-Mansergas A., Merín B., Smith Castelli A. V., Allen L. E., Morrell N., 2012, ApJ, 749, 79
- Schmidt et al. (2008a) Schmidt T. O. B., Neuhäuser R., Seifahrt A., Vogt N., Bedalov A., Helling C., Witte S., Hauschildt P. H., 2008a, A&A, 491, 311
- Schmidt et al. (2008b) Schmidt T. O. B., Neuhäuser R., Seifahrt A., Vogt N., Bedalov A., Helling C., Witte S., Hauschildt P. H., 2008b, A&A, 491, 311
- Scholz et al. (2012) Scholz A., Jayawardhana R., Muzic K., Geers V., Tamura M., Tanaka I., 2012, ApJ, 756, 24
- Siess et al. (2000) Siess L., Dufour E., Forestini M., 2000, A&A, 358, 593
- Smette et al. (2015) Smette A., et al., 2015, A&A, 576, A77
- Stamatellos & Herczeg (2015) Stamatellos D., Herczeg G. J., 2015, MNRAS, 449, 3432
- Stamatellos et al. (2007) Stamatellos D., Hubber D. A., Whitworth A. P., 2007, MNRAS, 382, L30
- Thies et al. (2015) Thies I., Pflamm-Altenburg J., Kroupa P., Marks M., 2015, ApJ, 800, 72
- Vernet et al. (2011) Vernet J., et al., 2011, A&A, 536, A105
- Wahhaj et al. (2010) Wahhaj Z., et al., 2010, ApJ, 724, 835
- White & Ghez (2001) White R. J., Ghez A. M., 2001, ApJ, 556, 265
- Whitworth & Stamatellos (2006) Whitworth A. P., Stamatellos D., 2006, A&A, 458, 817
- Wu et al. (2015a) Wu Y.-L., et al., 2015a, ApJ, 801, 4
- Wu et al. (2015b) Wu Y.-L., et al., 2015b, ApJ, 807, L13
- Zhou et al. (2014) Zhou Y., Herczeg G. J., Kraus A. L., Metchev S., Cruz K. L., 2014, ApJ, 783, L17
- de Geus et al. (1989) de Geus E. J., de Zeeuw P. T., Lub J., 1989, A&A, 216, 44
Appendix A Equivalent width of photospheric features in SR 12 C
We identified the several absorption features common in late M and early L stars. The lines and the equivalent width are given in the table below.
| Line | Wavelength (Å) | Equivalent Width (Å) |
|---|---|---|
| TiO | 7053 | 0.83 0.04 |
| VO | 7424 | 0.14 0.01 |
| TiO | 7589 | 0.59 0.01 |
| K I | 7697 | 0.47 0.07 |
| TiO | 8204 | 0.62 0.01 |
| TiO | 8433 | 0.72 0.03 |
| FeH | 9901 | 0.82 0.27 |
| VO | 9586 | 0.21 0.01 |
| CsI | 8935 | 1.33 0.09 |
| VO | 10604 | 0.31 0.01 |
| K I | 11690 | 1.41 0.16 |
| K I | 12432 | 1.26 0.02 |
| VO | 11975 | 0.37 0.01 |
| K I | 12520 | 1.78 0.05 |
| Ca I | 13113 | 2.08 0.01 |
| K I | 15167 | 1.81 0.13 |
| Fe I | 17181 | 0.28 0.01 |
| CO | 22934 | 2.10 0.06 |
| CO | 23225 | 1.02 0.06 |
| CO | 23516 | 0.86 0.06 |