∎
A. Balagopal V.22institutetext: Wisconsin IceCube Particle Astrophysics Center, University of Wisconsin–Madison, USA
Institut für Experimentelle Teilchenphysik, Karlsruhe Institute of Technology (KIT), Germany 33institutetext: A. Haungs, T. Huege, F. G. Schröder44institutetext: Institut für Astroteilchenphysik, Karlsruhe Institute of Technology(KIT), Germany
Erratum to: Search for PeVatrons at the Galactic Center using a radio air-shower array at the South Pole
Erratum to: Eur. Phys. J. C (2018) 78: 111
It was shown in Balagopal V. et al. (2018) that an optimal signal-to-noise ratio is obtained in the frequency band of 100-190 MHz, which allows us to lower the energy threshold of radio observations of air showers. Subsequent studies revealed a correction required to the normalisation factor of the modelled noise used in this study. A factor of was found to be missing in the normalisation, where N is the number of samples of the time series. This resulted in the overall scale of the noise amplitude to be underestimated by a factor of .
While this does not change the optimal frequency band, it results in a constant scaling factor of for all SNR values shown in Balagopal V. et al. (2018). To be specific, Figures 3-10 in Balagopal V. et al. (2018) will be affected by this scaling.
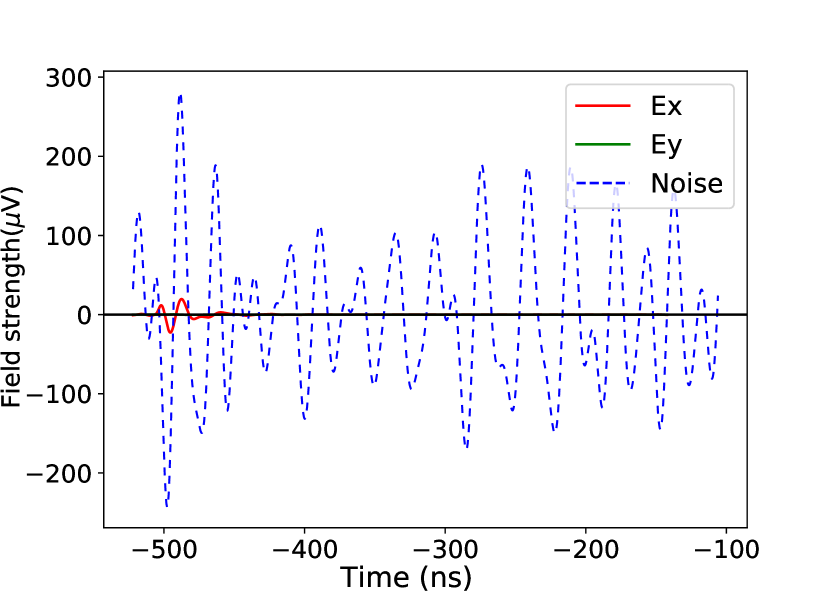
Figure 1 shows the effect of the correction factor on the scale of the noise amplitudes. This is an updated version of Figure 3 in Balagopal V. et al. (2018). While there is no change to the time traces of the signal (from a 10 PeV gamma-ray shower with = ), the noise becomes significantly larger, resulting in lower values of SNR. For this particular antenna location, the SNR for the 30-80 MHz band lowers from 35 to 0.07 while that for the 50-350 MHz band lowers from 1055 to 2.07.
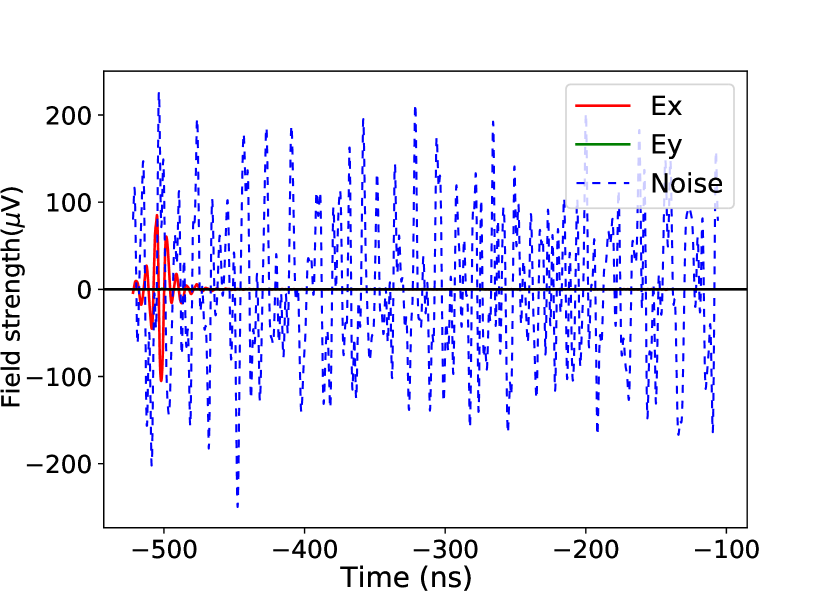
Another example is shown in Figure 2 where the SNR obtained for an antenna at the Cherenkov ring at different frequency bands is shown for a 10 PeV gamma-ray shower. In the corresponding plot in Balagopal V. et al. (2018) all the frequency bands with SNR 10 were set to the colour white, which is not done here for visualisation purposes. It can be clearly seen that the optimal frequency band remains 100-190 MHz as shown in Balagopal V. et al. (2018).
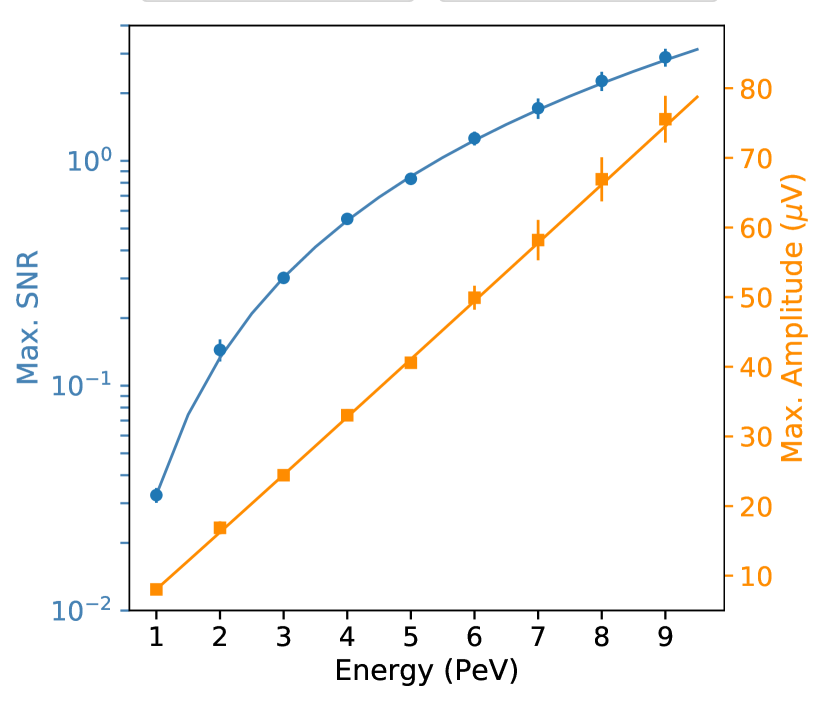
However, the required correction to the scaling of the SNR increases the detection threshold to a higher energy value.111A corresponding correction of the threshold will also apply to Figure 2 in F.G. Schroeder for the IceCube Collaboration (2020), which was produced using the same wrong normalization of the noise model. A recalculation of the SNR for the simulations used in Figure 9 of Balagopal V. et al. (2018) allows us to estimate the new threshold energy. The updated plot is shown in Figure 3. The new fit is given by . From the fit, it is estimated that at an energy of 16.8 PeV, for gamma rays from the direction of at the South Pole, we will obtain the threshold SNR of 10. Due to the lack of simulations of air showers with energies above 10 PeV, this cannot be cross-checked. Therefore, we expect that a radio array as presented in Balagopal V. et al. (2018) will feature a threshold energy for gamma rays above PeV and the exact threshold energy needs to be determined by a dedicated study for this higher energy range.

Acknowledgements.
The authors thank Alan Coleman for bringing a problem in the normalisation to our attention.References
- Balagopal V. et al. [2018] A. Balagopal V., A. Haungs, T. Huege, and F. G. Schröder. Search for PeVatrons at the Galactic Center using a radio air-shower array at the South Pole. Eur. Phys. J., C78(2):111, 2018. doi: 10.1140/epjc/s10052-018-5537-2.
- F.G. Schroeder for the IceCube Collaboration [2020] F.G. Schroeder for the IceCube Collaboration. Science Case of a Scintillator and Radio Surface Array at IceCube. PoS, ICRC2019:418, 2020. doi: 10.22323/1.358.0418.