SDSSJ1156-0207: A 0.54 + 0.19 M⊙ double-lined M dwarf eclipsing binary system
Abstract
Eclipsing binaries are instrumental to our understanding of fundamental stellar parameters. With the arrival of ultra-wide cameras and large area photometric monitoring programs, numerous eclipsing binaries systems have been reported photometrically. However, due to the expensive efforts to follow up them spectroscopically, most of their basic properties remain unexplored. In this paper we exploited the eclipsing binary light curves delivered by the all-sky catalina sky surveys, in tendem with the single shot spectroscopic survey from SDSS, and identify a double-lined M-dwarf eclipsing binary SDSSJ1156-0207. Because this system is very faint (V=15.89 magnitude), we obtained follow-up radial velocity measurements using Gemini Multi-Object Spectrograph onboard Gemini north telescope. This provides us a spectral resolution R4000, enabling us to determine the mass and radius of each stellar components when jointly fitted with light curve. Our best-fit results indicate that both components are of M dwarf, with the primary component to be 0.540.20 M⊙ and 0.460.08 R⊙, while the secondary component to be 0.190.08 M⊙ and 0.300.08 R⊙. High resolution spectroscopic observations in the future will help pin down the stellar parameters, providing insights to the stellar models at low mass regimes, as well as sheding lights on the internal structure of close-in low mass objects and their inflation mechanism.
1 Introduction
M dwarfs span the cool, low mass end of the main sequence. They are the most abundant stars in the Milky Way. However, they are difficult to discover and characterize because of their faintness. Thanks to large sky surveys, e.g. SDSS (York et al., 2000), several thousands of M dwarfs have been charted (West et al., 2011). However, only a few of them are well-studied, where their masses, radii, and temperatures are known to few percent level (Torres et al., 2010).
Observational results of M dwarfs also cast challenges to the models of low mass stars. It has been shown that theoretical modeling often underestimates the size and overestimates the temperature of M dwarfs (Boyajian et al., 2012). As shown by Zhou et al. (2015), the discrepancies are prominent among very low mass stars (VLMS, M0.3M⊙). This is because at such low masses the stars become completely convective and are difficult to model. Furthermore, these low mass stars are magnetically active, which links to their inflation (Feiden & Chaboyer, 2013, 2014).
With increasing numbers of exoplanets found to be around low mass stars (Dressing & Charbonneau, 2013), there are growing interests to understand the properties of low mass stars. This is especially the case of planets discovered by the transit method, because we require accurate stellar parameters to estimate exoplanet properties. Thus, improving VLMS models, or deriving relations for mass, radius and effective temperature empirically (e.g. Delfosse et al., 2000; Benedict et al., 2016; Mann et al., 2015; Newton et al., 2015) are highly demanded.
Eclipsing binaries can deliver direct measurement of the mass, radius, and effective temperature of stars. From eclipsing binary light curves we can determine the period, inclination angle, eccentricity, mass ratio, and fractional radius. With spectroscopic observations, we can estimate the mass, radius, and temperature of individual stars. We note that while there is a degeneracy of extracting both temperature and the gravity (log) from spectra of a single star, it is not an issue in the case of eclipsing binaries. This is because we can determine the mass and radius independently combining the radial velocity information and light curves. We can therefore break the degeneracy and estimate the temperature. There have been seminal works to provide benchmark M-M binary systems, such as CM Draconis (Morales et al., 2009, ApJ, 691, 1400), KOI-126 (Carter et al., 2011, Science, 331, 562), Kepler-16 (Bender et al., 2012, ApJ, 751, L31), LSPM J1112+7626 (Irwin et al., 2011, ApJ, 742, 123).
Taking advantage of eclipsing binaries composed of VLMS, Zhou et al. (2015) presented studies from 9 VLMS, including the abovementioned M-M binary systems, with masses between 0.14 to 0.28 M⊙. Their results suggest larger radius and lower temperature then those predicted by stellar models. To better understand the discrepency between the theoretical modeling and observations, and to derive mass vs. radius and mass vs. temperature relations empirically for VLMS, we need to determine stellar parameters for a larger sample of VLMS, which is only possible via eclipsing binaries.
Further more, short-period binaries presented in this study tend to be inflated due to tidal locking. Though they are not ideal for empirical calibrations, they can provide insights to inflation mechanisms and probe the interior structures of M dwarfs.
In this work we present a double-lined, M dwarf eclipsing binary discovered from cross matching Catalina Sky Surveys and Sloan Digital Sky Survey. The physical properties of this system are further characterized using Gemini telescope. This paper is organized as follows: in §2 we describe the photometric and spectroscopic data we used. Our analysis is shown in §3 and discussed in §4, followed by a summary in §5.
2 Data
2.1 Eclipsing binaries from Catalina Sky Survey
Starting from 2004, the Catalina Sky Survey (CSS) made use of three telescopes to survey the sky with -75 Dec 70 deg, with the Catalina Schmidt Telescope (0.7m, using a 8.2 deg2 camera) and the Mount Lemmon Telescope (1.5m, using a 1 deg2 camera) in Arizona, USA, as well the Siding Spring Telescope (0.5m, equipped with 4.2 deg2 FOV) from Australia. The original goal of CSS is to discover hazardous near Earth objects (NEOs). To maximize the throughput, the CSS observations were conducted without filters. The exposures were taken in quad manner, with cadence of 10-min among images, as well as an exposure time of 30-sec. The photometry are done using SExtractor (Bertin & Arnouts, 1996). Due to the high cadence, as well as the wide survey area, CSS data are also pivotal to time-domain studies. This leads to the Catalina Real-time Transient Survey (CRTS Drake et al., 2009).
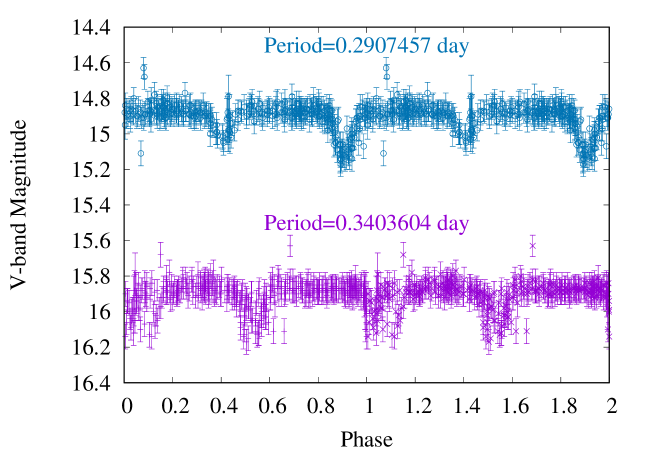
The current Catalina Surveys Data Release111http://nesssi.cacr.caltech.edu/DataRelease/ contains data obtained by the Catalina Schmidt Telescope (with a pixel scale of 1.5”/pixel) obtained in 2005-2013, with the light curves magnitudes converted to V-band. In the first data release (CSDR1), (Drake et al., 2013) presented 200 million sources with 12V20 magnitudes. Drake et al. (2014) further searched variables in CSDR1 sky regions between -22 Declination 65 deg, and discovered 47,000 periodically varying objects. They visually inspected the light curves and classified 4683 detached eclipsing binaries. This is largest all-sky eclipsing binary catalog to-date, providing a reservoir of time-series photometry. We note that while CSS catalog provides period estimate (0.3403604 days) using Lomb-Scargle periodogram, it is not very accurate (see Fig. 1. To determine period precisely, we empolyed the Analysis of Variance method (Schwarzenberg-Czerny, 1989), and estimate a period of 0.2907457 days. To estimate the period error, we use bootstrapping by replacing 1/5 of the data points in the light curve, and repeat the bootstrapping test for 50 times. This yields a period error estimate of 910-7 days, as presented in Table 1.
2.2 Spectroscopic M dwarfs from SDSS
As M dwarfs are very faint in the optical wavelength, previous searches were limited to infrared imaging studies, such as Lépine & Gaidos (2011); Thompson et al. (2013). Thanks to the advent of in wide-field cameras, multi-object spectrographs, and all sky surveys with medium-size telescopes, tens of thousands of M dwarfs have been confirmed by optical spectra. For example, West et al. (2011) took the advantage of Sloan Digital Sky Survey (hereafter SDSS York et al., 2000) to identify and classify 70,000 M dwarfs. Their sample were drawn from 120,000 M dwarf candidates pre-classified by Hammer spectral typing facility (Covey et al., 2007), further excluding low S/N spectra and removing contaminations from extra-galactic objects, K/L dwarfs, and white dwarf - M dwarf pairs. In the end they presented 70,841 M dwarfs with spectral type error within 1 subtype. This is the largest and purest spectroscopic M dwarf catalog to-date, providing us a firm basis to cross-matching with eclipsing binaries charted by other time-domain surveys.
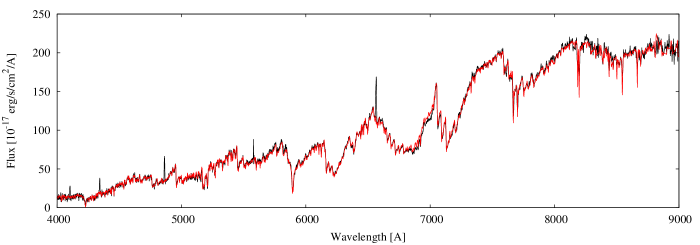
In order to identify candidate VLMS systems in eclipsing binaries, we matched the M dwarfs in West et al. (2011) to the CSS eclipsing binary catalogue. We only looked for M dwarfs with spectral classification later than M3, which have stellar masses0.3M⊙ (Baraffe & Chabrier, 1996). In the end we identified two VLMS M dwarfs in eclipsing systems: CSS114804.3+244132/SDSSJ114804.35+255132.6 in Lee (2017), as well as SDSSJ1156-0207 as presented here. The photometric and astrometric parameters, as well as the SDSS spectrum of SDSSJ1156-0207, and shown in Table 1 and in Fig. 2.
| Parameter | Value |
|---|---|
| RA (J2000) | 11:56:41.68 |
| Dec (J2000) | -02:07:03.8 |
| [mas/yr] | 9.0 |
| [mas/yr] | -34.0 |
| u [mag] | 20.3530.049 |
| g [mag] | 17.8740.006 |
| r [mag] | 16.3810.004 |
| i [mag] | 15.1730.004 |
| z [mag] | 14.5030.005 |
| J [mag] | 13.1370.046 |
| H [mag] | 12.5720.044 |
| K [mag] | 12.2620.025 |
| Period [day] | 0.2907457 910-7 |
2.3 GMOS follow-up spectra
SDSSJ1156-0207 is rather faint (V16 mag); it also exhibits a very short period (P0.3 days). In this regard, we need to reach good S/N 50-100) within less than an hour (0.1 periods). Further more, we also need spectral resolution at least several per pixel to estimate the mass and radius. In this regard, only 8-m telescope class telescopes can deliver the desired spectral resolution and signal-to-noise ratio in the short time window. We carried out spectroscopic follow-up with GMOS (Hook et al., 2004) mounted on the Gemini telescope (Program ID GN-2016-FT16). We used the R831 grating along with a 0.5”-slit, reaching a resolution R=4396. The central wavelength of the spectrum is set to be 7000, with a coverage of 2000.
The observations were carried out on 2016 April 2nd and 14th during the expected radial velocity maxima around light curve phase 0.25 and 0.75. In principle we only need one observations to measurement the radial velocity maximum, nevertheless we obtain two exposures at each maximum, with the second exposure serves as a sanity check, ensuring we obtain consistent radial velocity measurement at the same maximum. Each exposure has 10 minutes integration to reach sufficient S/N. Data reduction were carried out using dedicated IRAF222http://iraf.noao.edu GMOS package333http://www.gemini.edu/sciops/data-and-results/processing-software (v1.13) in a standard manner. Each spectrum was bias subtracted, flat fielded, sky subtracted, and wavelength calibrated using CuAr lamp.
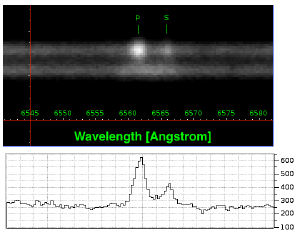
To extract radial velocity information, we make use of the H emission line at 6562.8. The H emissions from both stellar component are clearly resolved. We then fit the H line profile using two Gaussian functions. From the Gaussian fit, we obtain the radial velocity of each stellar component, as shown in Table 2, with estimated error of 15 km/s based on the spectral resolution delivered by the instrument (i.e. 3.4 per pixel).
| Epoch | RV1 | RV2 |
|---|---|---|
| (HJD) | [km/s] | [km/s] |
| 2457480.335324 | 63.996.7 | -165.0210.7 |
| 2457480.343681 | 63.086.7 | -149.937.4 |
| 2457592.427153 | -34.741.1 | 134.3910.9 |
| 2457592.435509 | -37.483.4 | 121.592.2 |
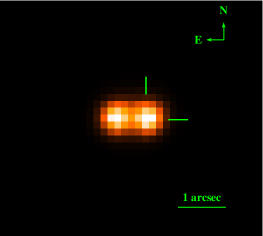
We also exploit the acquisition imaging of the Gemini spectroscopic observation (see Fig. 3, and found a third object 0.5 arcseconds away from the binary system. Such small separation is not resolvable from the poor spatial resolution of CSS. We also checked the Gemini follow-up spectra. As our spectra were obtained with position angle of 90 degrees, east of north, we were able to resolve both the eclipsing binary system and the third light object into spectra, as shown in Fig. 3. The radial velocity presented here were measured using the spectra of eclipsing binary system alone, without contaminations from the third light object.
2.4 WIYN/ODI high precision light curve
Whilte the discovery light curve from CSS is sufficient to identify the eclipsing binary nature, it is not ideal for light curve analysis especially due to the small aperture size and the large uncertainty in the photometry. In this regard, we thus obtained further high precision time-series photometry of SDSSJ1156-0207 using the One Degree Imager (ODI) on the WIYN telescope. The observations were carried out on February 3rd 2017 using i-band filter, with an individual exposure time of 120-sec. The median seeing was between 0.7” and 0.8”.
The raw data were then de-trended, astrometric and photometric calibrated using the ODI Pipeline, Portal, and Archive (ODI-PPA) system444The ODI Pipeline, Portal, and Archive (ODI-PPA) system is a joint development project of the WIYN Consortium, Inc., in partnership with Indiana University’s Pervasive Technology Institute (PTI), University of Wisconsin, and with the National Optical Astronomy Observatory Science Data Management (NOAO SDM) Program.. We retrieved the calibrated data via ODI-PPA, and performed aperture photometry using the SExtractor package (Bertin & Arnouts 1996). The light curve from WIYN/ODI is further discussed in section 3.
3 Analysis
3.1 Dynamical modeling
To start, we analyse the CSS light curve of SDSSJ1156-0207 using
the Detached Eclipsing Binary Light curve fitter (DEBiL, Devor, 2005).
DEBiL fits a binary light curve assuming a simple geometry: it guesses the initial values of
the parameters
using approximated analytic formula (see e.g. Seager & Mallén-Ornelas, 2003),
and fits the following parameters:
1. The fractional radius (,), expressed in terms of the
semi-major axis .
2. The magnitudes of both stellar components (mag1,mag2).
3. The orbital eccentricity (), inclination angle (), and argument of periastron ().
DEBiL performs light curve fitting iteratively, minimising the using the downhill simplex method, and finds the minima (Nelder & Mead, 1965) using simulated annealing (Press et al., 1992). We then pass the best-fit DEBiL parameters to JKTEBOP (Southworth, Maxted, & Smalley, 2004) for further dynamical analysis.
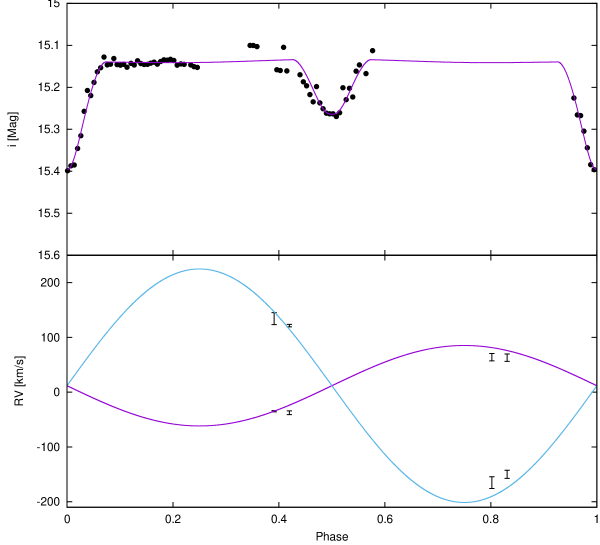
JKTEBOP (Southworth, Maxted, & Smalley, 2004) uses the EBOP code from Popper & Etzel (1981). It is capable of fitting the light curves and radial velocity measurements at the same time, to determine the mass and radius of each stellar component. The following parameters are used during the fitting process: primary eclipse timing (t0), radius ratio (R2/R1), radius sum in terms of semi-major axis ((R1+R2)/), light ratio(L2/L1), inclination angle (), as well as semi-amplitudes of the radial velocity curve (K1 and K2)and the systemic velocity . For dynamical analysis purpose, we only use the high precision i-band light curve from WIYN/ODI. In addition, in the WIYN/ODI image we can partially resolve the nearby star contaminating the photometry of SDSSJ1156-0207 (see Fig. 3). This allows us to we put a strong constraint on the 3rd light ratio. We thus fixed the 3rd light ratio to be 0.42 for the JKTEBOP analysis. We note that the period is very short, indicating that the binary is tidally locked and the orbital is circularized. We thus fix the eccentricity to be zero and only fit a non-eccentric orbit. During the fitting, we assume a limb darkening in quadratic form, with a=0.37 and b=0.49 for both stellar components. This value is taken from Claret (2004), assuming logg=5.0 and Teff=3500 for SDSS i-band filter. We also assume a gravity darkening =0.0 and reflection =0.0 for both stellar components.
We show the best-fit JKTEBOP results in Fig. 4 and Table 3. We note that there is a general degeneracy of determine the radii in non-eccentric eclipsing binary systems. While the sum of radii can be well determined from the light curve fit, the ratio of radii is much less uniquely determined, see e.g. Irwin et al. (2011) and references therein. Hence the radius ratio presented here must be regarded with caution.
| Parameter | Result |
|---|---|
| Modeled parameters | |
| t0 [HJD] | 2457788.29270.0002 |
| L2/L1 | 0.540.03 |
| (R1+R2)/ | 0.460.02 |
| R2/R1 | 0.640.07 |
| [deg] | 83.52.3 |
| K1 [km/s] | 73.42.7 |
| K2 [km/s] | 213.14.3 |
| [km/s] | 11.81.6 |
| Derived parameters | |
| M1 [M⊙] | 0.540.20 |
| M2 [M⊙] | 0.190.08 |
| R1 [R⊙] | 0.460.08 |
| R2 [R⊙] | 0.300.08 |
| a [AU] | 0.00770.0008 |
3.2 SED fitting
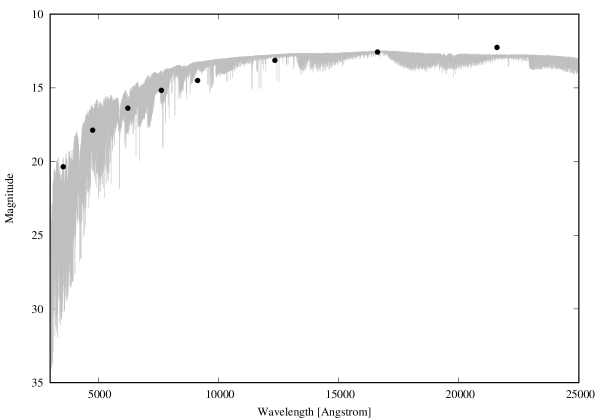
To derive the temperature of this eclipsing binary system, We also perform a basic analysis based on the broad-band spectral energy distribution. We fit the SDSS ugriz and 2MASS JHK broad-band magnitudes using a grid of M dwarf model spectra. These model spectra are drawn from the BT-Settl model (Allard et al. 2012), with log=5, solar metallicity, and a range of effective temperature from 2500 to 4000 K, with a grid size of 100 K. Our best-fit BT-Settl (as shown in Fig. 5 suggests the system has an effective temperature of 3000 K. To further derive the effective temperature of the primary and secondary stars, we assume the two stars are blackbodies, i.e. . With the light ratio and the radius ratio in hand, we estimate an effective temperature of 3101 K for the primary and 2899 K for the secondary, respectively.
4 Discussion
The best-fit model from JKTEBOP indicates M1=0.54 M⊙, M2=0.19 M⊙, R1=0.46 R⊙, and R2=0.30 R⊙. We compare our results with stellar models of low mass stars by Baraffe et al. (1998), as shown in Fig. 6. We note that our secondary (M2 = 0.19 M⊙) is among the lowest mass of known M-M dwarf binaries. The secondary star appears to be inflated, but it is still consistent with the theoretical predictions considering the large uncertainty in our radius measurements. Future spectroscopic follow-up, especially high resolution spectrograph, will help narrow down the estimated uncertainties.

5 Summary
We perform preliminary analysis of the low mass eclipsing binary SDSSJ1156-0207, found by cross-matching CSS eclipsing binaries and SDSS spectroscopic M dwarf. We further obtained spectra with GMOS mounted on the Gemini North telescope, detecting the emission lines from each of the stellar components. The spectroscopic observations also provide the radial velocity maxima. We analyzed the photometric and spectroscopic measurements simultaneously using JKTEBOP. Our results suggest the secondary component is inflated, while the primary has a radius consistent with the empirical mass-radius relation. The secondary’s inflation might be due to tidal locking, which enhances stellar activity and inhibites convection. This is not unusual in short period binaries. High resolution spectroscopy in the future will help narrow down the basic properties of this system. Further H observations will shed light on the stellar activity, providing constraints on the inflation mechanism due to tidal-locking.
References
- Baraffe & Chabrier (1996) Baraffe, I., & Chabrier, G. 1996, ApJ, 461, L51
- Benedict et al. (2016) Benedict, G. F., Henry, T. J., Franz, O. G., et al. 2016, AJ, 152, 141
- Bertin & Arnouts (1996) Bertin E., Arnouts S., 1996, A&AS, 117, 393
- Boyajian et al. (2012) Boyajian, T. S., von Braun, K., van Belle, G., et al. 2012, ApJ, 757, 112
- Covey et al. (2007) Covey K. R., et al., 2007, AJ, 134, 2398
- Delfosse et al. (2000) Delfosse, X., Forveille, T., Ségransan, D., et al. 2000, A&A, 364, 217
- Demory et al. (2009) Demory B.-O., et al., 2009, A&A, 505, 205
- Devor (2005) Devor, J. 2005, ApJ, 628, 411
- Drake et al. (2009) Drake A. J., et al., 2009, ApJ, 696, 870
- Drake et al. (2013) Drake A. J., et al., 2013, ApJ, 763, 32
- Drake et al. (2014) Drake A. J., et al., 2014, ApJS, 213, 9
- Dressing & Charbonneau (2013) Dressing C. D., Charbonneau D., 2013, ApJ, 767, 95
- Feiden & Chaboyer (2013) Feiden, G. A., & Chaboyer, B. 2013, ApJ, 779, 183
- Feiden & Chaboyer (2014) Feiden, G. A., & Chaboyer, B. 2014, ApJ, 789, 53
- Hook et al. (2004) Hook I. M., Jørgensen I., Allington-Smith J. R., Davies R. L., Metcalfe N., Murowinski R. G., Crampton D., 2004, PASP, 116, 425
- Kraus et al. (2011) Kraus A. L., Tucker R. A., Thompson M. I., Craine E. R., Hillenbrand L. A., 2011, ApJ, 728, 48
- Lépine & Gaidos (2011) Lépine S., Gaidos E., 2011, AJ, 142, 138
- Mann et al. (2015) Mann, A. W., Feiden, G. A., Gaidos, E., Boyajian, T., & von Braun, K. 2015, ApJ, 804, 64
- Nelder & Mead (1965) Nelder, J. A., & Mead, R. 1965, Computer Journal, 7, 308
- Newton et al. (2015) Newton, E. R., Charbonneau, D., Irwin, J., & Mann, A. W. 2015, ApJ, 800, 85
- Popper & Etzel (1981) Popper D. M., Etzel P. B., 1981, AJ, 86, 102
- Press et al. (1992) Press, W. H., Teukolsky, S. A., Vetterling, W. T., & Flannery, B. P. 1992, Cambridge: University Press, —c1992, 2nd ed.,
- Seager & Mallén-Ornelas (2003) Seager, S., & Mallén-Ornelas, G. 2003, ApJ, 585, 1038
- Southworth, Maxted, & Smalley (2004) Southworth J., Maxted P. F. L., Smalley B., 2004, MNRAS, 351, 1277
- Thompson et al. (2013) Thompson M. A., et al., 2013, PASP, 125, 809
- Torres et al. (2010) Torres, G., Andersen, J., & Giménez, A. 2010, A&A Rev., 18, 67
- West et al. (2011) West A. A., et al., 2011, AJ, 141, 97
- York et al. (2000) York D. G., et al., 2000, AJ, 120, 1579
- Zhou et al. (2015) Zhou G., et al., 2015, MNRAS, 451, 2263