Chemical modelling of glycolaldehyde and ethylene glycol in star-forming regions
Abstract
Glycolaldehyde (HOCH2CHO) and ethylene glycol ((CH2OH)2) are two complex organic molecules detected in the hot cores and hot corinos of several star-forming regions. The ethylene glycol/glycolaldehyde abundance ratio seems to show an increase with the source luminosity. In the literature, several surface-chemistry formation mechanisms have been proposed for these two species. With the UCLCHEM chemical code, we explored the different scenarios and compared the predictions for a range of sources of different luminosities with the observations. None of the scenarios reproduce perfectly the trend. A better agreement is, however, found for a formation through recombination of two HCO radicals followed by successive hydrogenations. The reaction between HCO and CH2OH could also contribute to the formation of glycolaldehyde in addition to the hydrogenation pathway. The predictions are improved when a trend of decreasing H2 density within the core region with T100 K as a function of luminosity, is included in the model. Destruction reactions of complex organic molecules in the gas phase would also need to be investigated, since they can affect the abundance ratios once the species have desorbed in the warm inner regions of the star-forming regions.
keywords:
astrochemistry – ISM: molecules – ISM: abundances – protostars1 Introduction
Complex organic molecules (COMs) are defined as molecules consisting of 6 atoms or more with at least one carbon atom (Herbst & van Dishoeck, 2009). The warm inner regions of star-forming regions ( 100 K) are known to be enriched in COMs. Their abundant presence in these regions can be explained by the sublimation of the icy grain mantles that release in the gas phase the COMs or the precursors that lead to their formation. These chemically rich regions are called hot cores for high-mass sources and hot corinos for low-mass sources (Ceccarelli, 2004). Some of the COMs are particularly interesting because of their potential prebiotic role. This is the case of glycolaldehyde (HOCH2CHO, hereafter GA). This molecule is involved, under terrestrial conditions through the formose reaction, in the formation of ribose, an essential constituent of ribonucleic acid (RNA). It was first detected towards the high-mass star-forming region Sgr B2 by Hollis et al. (2000). The first detection outside of the Galactic Center was obtained towards the hot core G31.41+0.31 by Beltrán et al. (2009). It was later detected towards a low-mass protostar by Jørgensen et al. (2012) using Atacama Large Millimeter Array (ALMA) science verification data of IRAS 16293-2422. Often studied with glycolaldehyde is its reduced alcohol, ethylene glycol ((CH2OH)2, hereafter EG). The abundance ratio of these two molecules has been determined in several star-forming regions as well as comets to discuss the possible preservation of these species formed at an early stage of the star formation process until their incorporation into asteroids and comets. The EG/GA ratio is about 4 in comet Lovejoy (Biver et al., 2015), 3 in comet Lemmon (Biver et al., 2014) and 6 in comet Hale-Bopp (Crovisier et al., 2004). This ratio is found to be relatively similar in low-mass protostars (3–5, Coutens et al. 2015; Jørgensen et al. 2016). It is, however, higher for high-mass sources with a value of 10 for G31.41+0.31 (Rivilla et al., 2017) and lower limits of 6, 13 and 15 in three other sources (Lykke et al., 2015; Brouillet et al., 2015). This led Rivilla et al. (2017) to suggest an increase of the EG/GA ratio with the source luminosity (see Table 3).
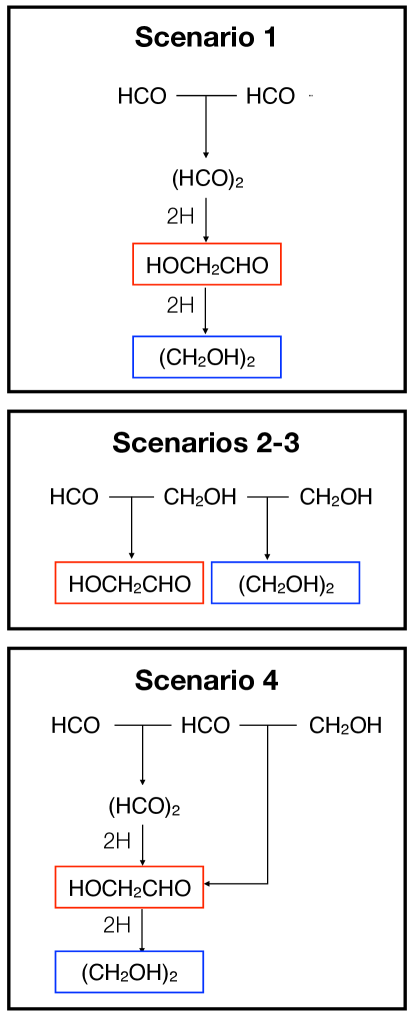
So far, the gas phase routes proposed in the literature do not lead to an efficient formation of glycolaldehyde and ethylene glycol in star-forming regions (Woods et al., 2012). Grain surface chemistry is consequently considered as the only way to form these species (e.g., Garrod, 2008), which is also supported by laboratory experiments (Fedoseev et al., 2015; Butscher et al., 2015; Chuang et al., 2016). Their dominant formation pathways are however unclear. A first route (hereafter Scenario 1, see Figure 1) involving the formation of glyoxal ((HCO)2) through the dimerization of the formyl radical (HCO) followed by its hydrogenation was proposed by Woods et al. (2013), then tested experimentally at low temperature through hydrogenation of CO ices by Fedoseev et al. (2015):
| (1) | |||
| (2) |
Fedoseev et al. (2015) also detected ethylene glycol in these experiments and proposed that it formed by hydrogenation of glycolaldehyde:
| (3) |
A second route (hereafter Scenarios 2 and 3, see Figure 1) based on the recombination of the radicals HCO and CH2OH on the grains was explored in laboratory by Butscher et al. (2015) and found to be efficient:
| (4) | |||
| (5) |
More recently, Chuang et al. (2016) explored the hydrogenation of different CO:H2CO:CH3OH ice mixtures at low temperature and detected both ethylene glycol and glycolaldehyde as well as methyl formate (CH3OCHO, hereafter MF). They found that glycolaldehyde could form by any route (reactions 2 and 4), but that the CH2OH radical recombination reaction (reaction 5) should be less efficient than the hydrogenation of glycolaldehyde (reaction 3). We will hereafter refer to this case as Scenario 4 (see Figure 1).
In this paper, we explore the different formation pathways proposed in the literature for these two species by modelling sources of different masses and luminosities. In Section 2, we describe the physical and chemical model. In Section 3, we present the results of the chemical predictions for sources of different luminosities, while in Section 4 we discuss the results. Finally, we summarize the results and conclude in Section 5.
2 The model
2.1 The physical and chemical model
In this study, we perform time-dependent calculations using the gas grain chemistry code UCLCHEM111https://github.com/uclchem/UCLCHEM. This code is fully described in Holdship et al. (2017). To simulate the evolution of the physical conditions during the star formation process, two phases are considered: the free-fall collapse of a cloud (Phase I) followed by a “warm-up” phase (Phase II).
In Phase I, we assume a constant temperature of 10 K and an increase of the density from an initial value = 300 cm-3, characteristic of a rather diffuse medium, to a final value = 107 cm-3 for high mass sources and = 108 cm-3 for low-mass protostars, as assumed in other studies (e.g. Woods et al., 2013; Awad et al., 2014). The initial visual extinction is 2 magnitudes and the cosmic ray ionization rate is 1.3 10-17 s-1. During this time, atoms and molecules accrete on the grain surfaces with an accretion rate that depends on the density. The species may then be quickly hydrogenated or react with other grain species. The initial atomic abundances of He, O, C, and N in our model correspond to the solar values from Asplund et al. (2009), while the other elements (S, Si, Cl, P, F, Mg) are assumed to be depleted by a factor 100.
In Phase II, the density remains constant, while the temperature increases with time from 10 K to 300 K following the trend described in Viti et al. (2004):
| (6) |
This is based on the assumption that the temperature of the gas and dust surrounding the accreting protostar increases according to the same power law as the stellar temperature, and it was fitted so that the maximum temperature of the gas is reached at the contraction time, i.e. the time after which hydrogen starts burning and the star reaches the zero-age main sequence (see more details in Viti et al. 2004). The values of and derived for hot cores are taken from Viti et al. (2004) ( 4.9 10-2, 7.8 10-3, 9.7 10-4, 1.7 10-4, 4.7 10-7 and 0.63, 0.84, 1.1, 1.3 and 1.98 for masses of 5, 10, 15, 25 and 60 , respectively) and for a low-mass protostar from Awad et al. (2010) ( = 1.9 10-1 and = 0.53). This means that the more massive the source, the faster the temperatures raises and reaches its maximum value. The sizes of the hot core ( = 5, 10, 15, 25 and 60 ) and hot corino ( = 1 ) are assumed to be 0.06 pc and 160 au, respectively. During this phase, the molecules do not freeze any longer and the molecules frozen on the grains can be released in the gas phase by both thermal and non-thermal desorption mechanisms, although above temperatures of 40 K thermal desorption dominates. The thermal evaporation treatment of our model is fully described in Viti et al. (2004) and includes monomolecular desorption, volcano desorption and co-desorption with water (see also Collings et al. 2004). The fractions of methyl formate and glycolaldehyde desorbing due to these different mechanisms were updated based on the temperature programmed desorption experiments carried out by Burke et al. (2015).
The gas phase chemistry part of our chemical network is based on the UMIST 2012 database (McElroy et al., 2013). Additional gas-phase reactions such as the formation pathway derived by Balucani et al. (2015) for methyl formate have also been included. Our network includes all the potential routes of formation of glycolaldehyde listed in Woods et al. (2012, 2013), but as stated in these papers, apart from the grain surface reactions (1–2), none of them is efficient. They are consequently not discussed further. For this study, we include all the grain surface routes listed in Section 1 (see Figure 1) and vary their rates to test the proposed formation pathways of glycolaldehyde and ethylene glycol. Some gas-phase destruction routes of glycolaldehyde and ethylene glycol are also included, although we note that the destruction of these two species is very little investigated. In fact the only route of destruction that we found in the literature is the one involving the reaction of glycolaldehyde with OH with a rate of 7.3 10-12 cm3 s-1 (Galano et al., 2005). This reaction was consequently added to the network. We also take into account the dissociation of these molecules by the cosmic ray induced UV field. Very few cosmic-ray induced photoreaction rates are included in astrochemical databases due to a lack of data. For the purpose of this study, we have simply assumed that the rates follow the trends seen in other molecules of similar types. The rate coefficient of this type of reaction is calculated according to the following formalism: /, where is the cosmic ray ionisation rate (1.3 10-17 s-1), the scaling factor, and the dust-grain albedo in the far ultraviolet (0.5 at 150 nm). Thus for glycolaldehyde we adopt a value of 800 for the scaling factor, to be compared with 1330 and 520 for formaldehyde and acetaldehyde, respectively. For ethylene glycol we adopt a value of 2000, to be compared with 3050 and 3500 for methanol and ethanol, respectively. Our estimates and the dissociation products are, of course, highly uncertain, but the rates should be accurate to within a factor of a few.
2.2 Method
To test the formation pathways of glycolaldehyde and ethylene glycol, we proceed in two stages. In a first step, we only consider the case of the G31.41+0.3 massive star-forming region, whose mass was found to be about 25 (Osorio et al., 2009). This source, which is located at a distance of 7.9 kpc, harbors a hot molecular core of about 3 105 rich in complex organic molecules (Beltrán et al., 2005). We consequently run grids of models by varying the reaction rates for a 25 source. We determine the best-fit parameters by comparing the predicted abundances of glycolaldehyde and ethylene glycol with those derived for G31.41+0.31 by Rivilla et al. (2017). In a second step, we use these parameters to run models for other source masses (1, 5, 10, 15, and 60 ) and compare the predictions with the observed trend as a function of luminosity (see list of sources in Table 3). The relation between the stellar mass and the luminosity used here comes from Molinari et al. (2000).
To compare the chemical predictions with the observations, we consider that a model is in agreement with the observations, as long as the abundances of the molecules with respect to H2 are reproduced within an uncertainty of one order of magnitude, and that the EG/GA ratio is reproduced within a factor 2. The large uncertainty for the abundance with respect to H2 is explained by the difficulty to derive precise H2 column densities. If ethylene glycol and glycolaldehyde arise from the same region, their relative abundance ratio is, however, more precise. A summary of the tested scenarios for the formation paths of glycolaldehyde and ethylene glycol is presented in Figure 1. The list of the parameters that are varied are explained below.
First, we consider the fraction of CO that is converted into HCO () and CH2OH () on the grain surfaces. It should be noted that this fraction only refers to the fraction of HCO and CH2OH that is left unconverted. More HCO and CH2OH are formed from CO but they are hydrogenated into species such as H2CO and CH3OH. We assume that the hydrogenation of CO can lead to the formation of the HCO and CH2OH precursors with a conversion factor of maximum 1% for the following reasons. In the gas phase of prestellar cores, the abundance of HCO was found to be 10 times lower than CH3OH (Bacmann & Faure, 2016). As the conversion factor of CO into CH3OH is assumed to be 10% (e.g. Watanabe & Kouchi, 2002; Coutens et al., 2017), we can assume that no more than 1% of CO should be converted to HCO. It should be noted that in prestellar cores, the formation of HCO could also be due to gas phase formation pathways (Bacmann & Faure, 2016), so this value of 1% can only be considered as an upper limit. To limit the number of free parameters in this study, we only consider the formation of the precursors HCO and CH2OH on the grains. Note that we can safely do this because the formation routes of glycolaldehyde and ethylene glycol in the gas phase are not efficient, and therefore the only relevant information for our study is the formation of their potential precursors (HCO and CH2OH) on the surface of dust grains. CH2OH has never been observed in the interstellar medium so far; hence we assume a conversion factor similar to the one of HCO, 1%.
The other free parameters are the rate coefficients of some key reactions. Regarding the first scenario (Reactions 1–3), we vary the values of the rate coefficients of the reaction between the two HCO radicals () and the hydrogenation reaction of glycolaldehyde (). The rate coefficient of the HCO + HCO reaction is constant as a function of the temperature. Variations with the temperature cannot affect the results in any case, since, in our model, the hydrogenation reactions including the one for glycolaldehyde only occur during the prestellar phase, i.e. at a temperature of 10 K222All the results presented in this paper are similar if the hydrogenation reactions occur at temperatures 20 K.. It means that glycolaldehyde and ethylene glycol can only form during the first phase, even if glyoxal ((HCO)2) can keep forming at higher temperature in the second phase. The other hydrogenation reactions are assumed to be very fast, as experimentally found by Fedoseev et al. (2015).
Regarding the second formation route, we vary the rates of both reactions 4 and 5. We study two cases : i) constant rates (, ) (scenario 2) and ii) rates increasing with the temperature to simulate the diffusion (by thermal hopping) on the grain surface (scenario 3). In the second case, the rate coefficients are calculated following the formalism described in other studies (e.g., Reboussin et al., 2014). They depend on the density, the number of sites on the surface of the grain per cm2 (1.5 1015 cm-2), the grain size (0.1 m), the binding energy () and the mass of the reactants. The diffusion barrier energies () are assumed to be equal to 0.5 times the binding energies (Garrod & Herbst, 2006). Slightly different factors (0.3–0.7) are also tested to insure that it did not affect the results. The binding energies of HCO (1600 K) and CH2OH (5084 K) are taken from Belloche et al. (2014).
As the number of free parameters is higher than the number of observational constraints (i.e., abundances of ethylene glycol and glycolaldehyde), we explored several cases with different assumptions :
-
•
some cases where reactions can be very fast in order to determine the minimum amount of HCO and CH2OH with respect to CO that is needed to reproduce the observed abundances of glycolaldehyde and ethylene glycol,
-
•
some other cases where the fraction of CO that is converted to HCO or CH2OH is fixed, 1% and 0.1%.
| Scenario | Reactions | Best-fit parameters |
| 1 | A. = 0.025% ; 10-8 cm3 s-1 ; = 2 10-12 cm3 s-1 | |
| B. = 1% ; = 2 10-15 cm3 s-1 ; = 8 10-11 cm3 s-1 | ||
| C. = 0.1% ; = 4 10-13 cm3 s-1 ; = 6 10-11 cm3 s-1 | ||
| 2 | A. = 0.001% ; = 0.03% ; 10-8 cm3 s-1 ; 10-8 cm3 s-1 | |
| B. = 1% ; = 1% ; = 5 10-17 cm3 s-1 ; = 7 10-16 cm3 s-1 | ||
| (constant rates) | C. = 0.1% ; = 0.1% ; = 5 10-15 cm3 s-1 ; = 7 10-14 cm3 s-1 | |
| 3 | A. = 0.001% ; = 0.03% ; (HCO) = 1600 K; (CH2OH) = 5084 K ; = 0.5 | |
| B. = 0.001% ; = 0.03% ; (HCO) = 1600 K; (CH2OH) = 5084 K ; = 0.3 | ||
| (diffusion) | C. = 0.001% ; = 0.03% ; (HCO) = 1600 K; (CH2OH) = 5084 K ; = 0.7 | |
| 4 | A. = 1% ; = 1% ; = 2 10-15 cm3 s-1 ; = 8 10-11 cm3 s-1 ; | |
| = 5 10-17 cm3 s-1 | ||
| B. = 0.1% ; = 0.1% ; = 4 10-13 cm3 s-1 ; = 6 10-11 cm3 s-1 ; | ||
| = 5 10-15 cm3 s-1 |
Note: The parameters that are fixed in each scenario are indicated in boldface (see more details in the text).
3 Results
3.1 Scenario 1
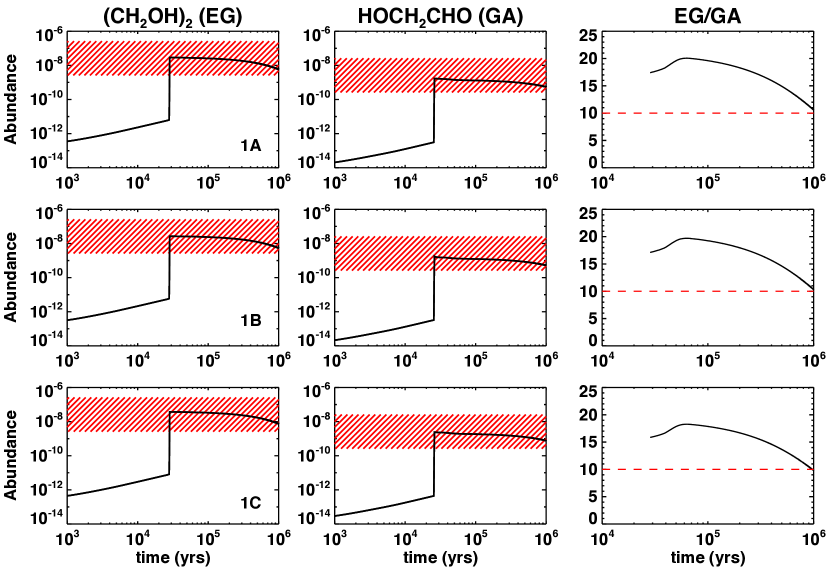
We explore here the formation of glycolaldehyde and ethylene glycol through the recombination of the HCO radicals followed by successive hydrogenations (Reactions 1–3) in the case of a star of 25 and compare the predicted abundances with the ones derived by Rivilla et al. (2017) towards G31.41+0.31.
Figure 2 shows the variation of the abundances of glycolaldehyde and ethylene glycol as a function of time for three different models that give a good agreement with the observations (see Table 1 for the assumptions of each model). As expected, the gas-phase abundances of glycolaldehyde and ethylene glycol reach a maximum once the two species co-desorb with water at high temperatures ( 100 K, = 2–3 104 yrs). Afterwards, the abundances decrease slowly. As the age of the source is quite uncertain, we consider that the model is good if the predicted abundance at the time of desorption reaches the observed value. It allows us to determine the minimum fraction of CO that needs to convert into HCO to reproduce the observed abundances. Moreover, at the final time of our calculations = 106 yrs, the abundances of the two molecules are still within a factor 10 uncertainty. The EG/GA ratio at the time of the co-desorption with water reflects the EG/GA ratio on the grains. Afterwards, it slightly increases before decreasing. For the models selected here, an EG/GA ratio of 10 is obtained at 106 yrs (see Figure 2). This was chosen as a conservative limit. Indeed in most of the high-mass sources (apart from G31.41+0.3), the EG/GA ratio is constrained by a significantly high lower limit (> 13-15) and, as we realized after testing different source masses that the predicted EG/GA ratio with time was very similar for the high mass sources (see Section 3.4), it is better to have a slightly higher value than 10 at shorter times (3 104 < < 106 yrs) in order to reproduce the observations of a maximum of sources. In addition, it should be noted that by using a value of about 10 at 106 yrs, the EG/GA ratio of G31.41+0.31 is still consistent with the observations within a factor 2 at any time after the desorption of the grain mantles.
For a very efficient HCO + HCO reaction (scenario 1A), we found that the hydrogenation of CO into HCO on grains needs to have an efficiency of at least = 0.025%. This scenario implies that all the HCO on the grains is converted into glycolaldehyde and ethylene glycol ( 10% and 90% respectively). In other words, 2.3 10-4 of the CO on the grains convert into ethylene glycol and 2 10-5 into glycolaldehyde. If the conversion factor of CO into HCO is higher ( = 1%), the rate of the reaction HCO + HCO only needs to be about 2 10-15 cm3 s-1, while it is a little higher ( 4 10-13 cm3 s-1) if is equal to 0.1%. In the first case ( = 1%), 1% and 0.1% of solid HCO are converted into ethylene glycol and glycolaldehyde, respectively. In the second case ( = 0.1%), 10% and 1% of HCO are converted. In terms of conversion of the solid CO, this is equivalent, in both cases, to a conversion factor of about 10-4 and 10-5, respectively.
3.2 Scenarios 2–3
The formation of glycolaldehyde and ethylene glycol through the radical-radical reactions HCO + CH2OH and CH2OH + CH2OH (Reactions 4–5) was also investigated and compared with the observations of G31.41+0.31.
Figures 3 and 4 show the variation of the abundances of glycolaldehyde and ethylene glycol as a function of time in the case of constant rates (Scenario 2) and in the case of diffusion by thermal hopping (Scenario 3) respectively. They are very similar to the ones for route 1. The minimum fraction of CO that needs to be converted into HCO and CH2OH is estimated to be about 0.001% (25 times lower than in Scenario 1) and 0.03% respectively, both in the case of constant rates as a function of the temperature and in the case of diffusion. The only difference is that, in the first case, the formation of ethylene glycol and glycolaldehyde on grains already occur during Phase 1, while in the second case they only form in Phase 2. This explains the lower abundances of ethylene glycol and glycolaldehyde predicted with the diffusion scenario at early times in Phase 2 ( 103–104 yrs). The non-thermal mechanisms can only release them once they are formed on the grains. It should be noted that for diffusion, assuming a diffusion barrier energy equal to 0.3 or 0.7 times the binding energy (instead of 0.5) does not affect the results (these two cases are consequently not shown in Figure 4). The diffusion on the grains starts being efficient at a higher or lower temperature depending on the assumed diffusion barrier energy, but the final abundances are similar. In the end, 100% of HCO and 3% of CH2OH convert into glycolaldehyde, the remaining 97% of CH2OH are used to form ethylene glycol. It means that about 2 10-5 of CO is converted into glycolaldehyde and 3 10-4 into ethylene glycol.
In the case of conversion factors of CO into HCO and CH2OH of 1%, the constant rate of the reaction HCO + CH2OH needs to be about 5 10-17 cm3 s-1, while the rate of the reaction CH2OH + CH2OH should be about 7 10-16 cm3 s-1. This represents a conversion of 0.1% of HCO and 0.1% of CH2OH into glycolaldehyde and 2% into ethylene glycol. The reaction rates are higher by two orders of magnitude (5 10-15 cm3 s-1 and 7 10-14 cm3 s-1), when the conversion factors of CO into HCO and CH2OH are 0.1%. In this case, 1% of HCO and 1% of CH2OH are used to form glycolaldehyde, while 20% of CH2OH is used for ethylene glycol. This means that, here again, about 2 10-4 and 2 10-5 of the CO on the grains lead to the formation of the observed ethylene glycol and glycolaldehyde, respectively.

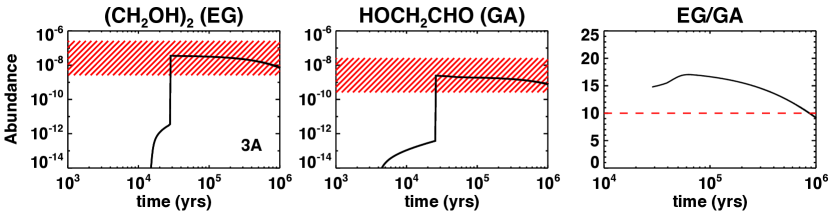
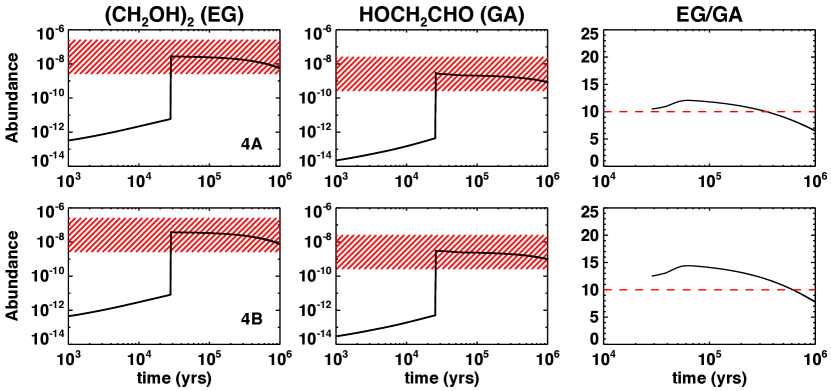
3.3 Scenario 4
Chuang et al. (2016) showed in their experiments that all the routes studied earlier (i.e. a combination of Scenarios 1 and 2) may work, but that the reaction CH2OH + CH2OH (Eq. 5 in this paper) would be less efficient than the other reactions. We tested this scenario and considered that the reaction between the two CH2OH radicals is not efficient at all. This was, moreover, suggested in a theoretical study by Enrique-Romero et al. (2016). Because of the increase in the number of free parameters, we only ran models with reaction rates (, and ) similar to those determined in the cases 1B/2B ( = = 1%) and 1C/2C ( = = 0.1%). We found that they can reproduce the observations within the uncertainties, even if the predictions for the EG/GA ratios are slightly lower than those found for the scenarios 1 and 2 separately (see Figure 5 for comparison with Figures 2 and 3). With these parameters, glycolaldehyde is efficiently formed both through the HCO + HCO pathway and the HCO + CH2OH reaction. In the case of = = 1%, 0.1% of HCO and 0.1% of CH2OH are converted into glycolaldehyde, while 1% of HCO produces ethylene glycol. In the case of = = 0.1%, 1% of HCO and 1% of CH2OH lead to the formation of glycolaldehyde, and 10% of HCO forms ethylene glycol.
3.4 Variation of the EG/GA ratio with the luminosity
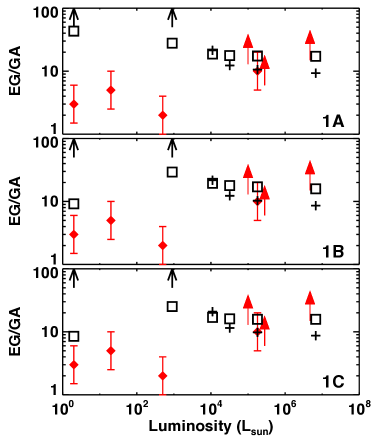
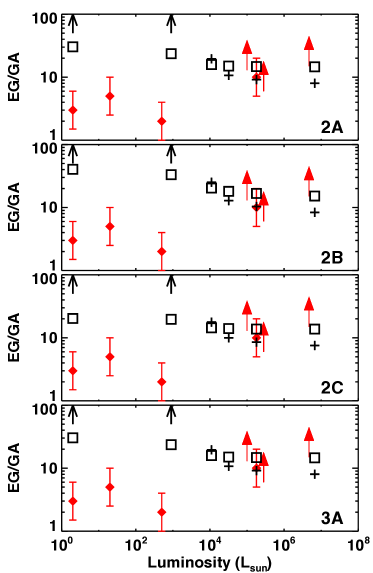
To study the variation of the EG/GA ratio as a function of the luminosity, we run each of the models listed in Table 1 for sources with masses from 1 to 60 . As explained in Section 2, the only difference for the intermediate- and high-mass sources is the speed at which the temperature increases depending on the mass, while for the low-mass case, we also increase the density and use a smaller size of 160 au (instead of 0.06 pc for hot cores), which is more characteristic of hot corinos (Awad et al., 2010). The EG/GA ratios are extracted just after the desorption of the grain mantles and at a time of 106 years. The values given after the desorption of the grain mantles correspond to the EG/GA ratio inherited from the grain mantles, while the values at a time of 106 years reflect how the EG/GA ratios are affected by the gas phase destruction routes of ethylene glycol and glycolaldehyde. The comparisons of the predicted and observed EG/GA ratios are shown in Figures 6 and 7. The EG/GA ratio inherited from the grain mantles appears to be relatively constant (13–20) for the more massive sources with a slight increase for the 5 objects. The values for the low-mass protostars depend however on the scenario. For models 1B and 1C, the EG/GA ratio is in better agreement with the observations than in the other cases. At a time of 106 years, the predicted EG/GA ratio decreases with the luminosity and shows very high values for 1 and 5 whatever the scenario is. In fact, the abundance of glycolaldehyde decreases very quickly due to its destruction by OH. The abundance of OH predicted by our models quickly reaches a value of 10-10 for the more massive sources, while it can be up to two orders of magnitude higher for sources of 1 and 5 . For this reason, in a low-mass source, glycolaldehyde falls down to an abundance of 10-16 in a few 105 years, which makes this molecule undetectable in hot corinos. As glycolaldehyde is detected towards five solar-type protostars (Jørgensen et al. 2012, Coutens et al. 2015, Taquet et al. 2015, De Simone et al. 2017), it indicates that the icy grain mantles only desorbed recently in these sources ( 2 105 yrs). Although we cannot exclude that the OH abundance could be overestimated by our model, the inferred age of these sources tend to be in good agreement with the upper limit we constrained (e.g., Schöier et al., 2002; Webster, 2003).
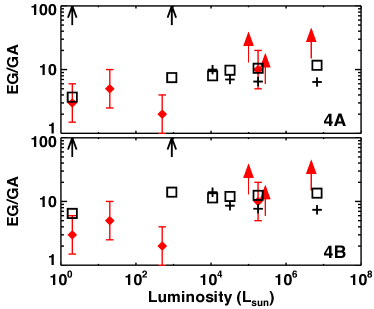
The trends for Scenario 4 (for which we did not run any grid) are shown in Figure 8. The fact that the predicted EG/GA ratios are lower than those obtained within the other scenarios provides a better agreement for low-mass protostars at the time of desorption. They are, however, lower than the lower limits derived in high-mass sources. But in the end, the trend is relatively similar to what is obtained for models 1B and 1C, in the sense that we see a decrease of the EG/GA ratio for low-mass sources compared to high-mass sources.
4 Discussion
4.1 Comparison of the observed and predicted trends
The chemical predictions do not show the same increase of the EG/GA ratios with the luminosity as the observations. This disagreement cannot be explained by the possible different ages of the sources. Indeed the inverse trend is even reinforced with time (see results at = 106 yrs). The EG/GA ratio only increases with time for the less massive protostars (leading to predictions above the observed values), while it only decreases for the most massive sources ( = 60 ). Two hypotheses can, however, be put forward to explain this disagreement.
First, the gas phase chemical network of glycolaldehyde and ethylene glycol is certainly incomplete. The destruction routes of these two species have been very little explored. With the current destruction routes included in our network, we show that the discrepancy between the observed and predicted EG/GA ratios increase with time and the EG/GA ratio is always higher than observed for the low-mass sources. Inclusion of missing routes as well as any difference in the rates of the destruction routes we assumed could potentially lead to the opposite effect. Consequently it appears necessary to constrain the rates of all the possible destruction routes of glycolaldehyde and ethylene glycol for the high temperatures of hot cores and hot corinos ( 100–300 K). Astrochemical models of COM formation usually assume that the environment in which they form is essentially neutral and chemically saturated. However, if ions and/or radicals are present then they can act as significant COM destruction reagents. These reaction channels are not included in most astrochemical networks and, as an example, we consider the destruction of GA by OH radicals. Whilst this is possibly the dominant GA+radical reaction in the conditions that we are investigating, it should be recognized that there may well be other important destruction channels that have not been included in this, and other, studies of COM formation.
Secondly, some of the physical assumptions may need to be revised. In particular, from Figures 6 and 7, we note that the EG/GA ratios inherited from the grain mantles for low-mass protostars significantly differ according to the scenario, while the ratios for the high-mass sources are relatively similar in all cases. A key difference between the chemical models of high mass protostars and those for low mass protostars are the density and size. To determine if the density and size of hot cores could show any variation with the source luminosity, we explored the literature and plotted the variation of the density of H2 and the radius at =100 K derived for intermediate- and high-mass sources as a function of their luminosity (see Figure 9). The spherical structures of these sources were constrained by Crimier et al. (2009); Crimier et al. (2010) and van der Tak et al. (2013) based on continuum observations. We find that the density at the position where the temperature reaches 100 K decreases with the source luminosity following the equation:
| (7) |
The radius at =100 K shows a clear increase with the luminosity for both the intermediate and high-mass sources with a best fit :
| (8) |
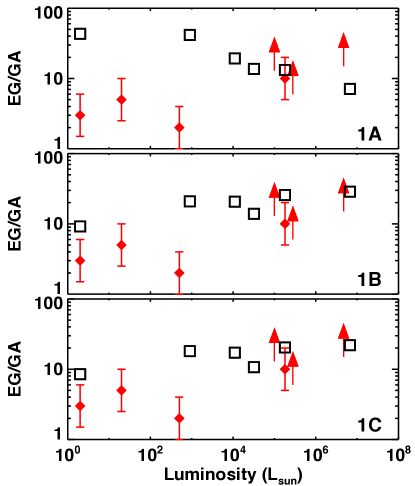
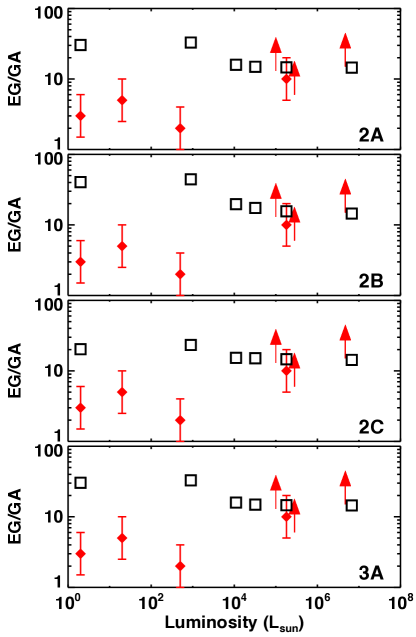
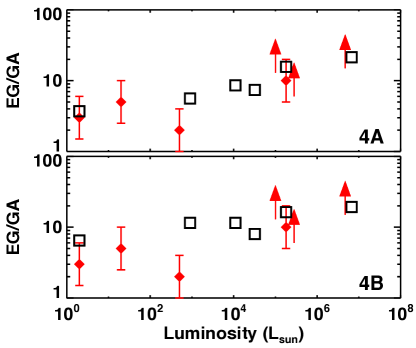
To investigate the possible impact of each of these parameters on the EG/GA ratios, we include the variation of density and radius with the luminosity and re-run the models listed in Table 1 for different luminosities. Figures 10, 11 and 12 show the new EG/GA ratios predicted after the grain mantle desorption. Changes in the EG/GA ratios are observed. Even if none of the models can perfectly reproduce the trend shown by the observations, the best agreement is found for models 1B, 1C, 4A, and 4B. Note that the density is the parameter that really leads to the change in chemistry. The size has very little impact on the results.
Models 1B, 1C, 4A, and 4B show on average an increase of the EG/GA ratio with the luminosity, which could mean that glycolaldehyde and ethylene glycol will form more efficiently in star-forming regions through HCO + HCO recombination followed by hydrogenation. Glycolaldehyde could, in addition, form through the HCO + CH2OH reaction too.


4.2 Inclusion of methyl formate grain surface formation pathway
In all the models presented previously, methyl formate is only formed through gas phase reactions, including the ones proposed by Balucani et al. (2015):
| (9) | |||
| (10) | |||
| (11) | |||
| (12) |
Compared to Balucani et al. (2015), we used the rate for the reaction OH + CH3OH that was recently determined by Antiñolo et al. (2016). We also assumed a depletion of F and Cl by a factor 100 with respect to the solar value. We find that the abundance of methyl formate (with respect to H2) in the high temperature regime (100–300 K) varies between 7 10-10 and 2.5 10-8 once the temperature is above 100 K. Rivilla et al. (2017) derived a value of 4.2 10-8 for G31.41+0.31, which is only slightly above the predicted range. Note that even if F and Cl are not depleted, the results are quite similar. The predicted abundance of dimethyl ether, an intermediate species in the formation of methyl formate, is, however, shortly after the thermal desorption of the grain mantles, higher than the observed value ( 8.4 10-8, Rivilla et al. 2017) by one order of magnitude.
Even if our simulations predict abundances of methyl formate relatively similar to the observations with just the inclusion of the gas phase mechanism, it was also shown that methyl formate could also form on the grains with ethylene glycol and glycolaldehyde through hydrogenation of CO:H2CO:CH3OH ice mixtures under certain conditions (Chuang et al., 2016, 2017). Running the previous cases after the inclusion of this grain surface mechanism is beyond the scope of this paper. This would require a higher number of free parameters, since the conversion factor of CO into CH3O and the reaction efficiency between HCO and CH3O are not known either. We should however keep in mind that, if this mechanism is efficient, it implies that some of the free parameters derived in Table 1 could be underestimated. For example, the fraction of CO converted into HCO would need to be higher than the values derived here, since HCO will also react with CH3O to form methyl formate. It may also affect the efficiency of some reactions if they compete between each other.
As an example, we included the grain surface reaction HCO + CH3O and considered the case of diffusion by thermal hopping (scenario 3). The assumed binding energy of CH3O is 2500 K (Garrod, 2008; Belloche et al., 2014). In this case, we only need to vary the fractions of CO converted into HCO, CH2OH, and CH3O. We constrain these parameters (see Table 2) so that the maximum abundance of methyl formate for a source of 25 reaches a value higher than 4.2 10-8, the precise value of the abundance constrained in G31.41+0.31 by Rivilla et al. (2017). Basically the peak abundance is increased by a factor 2 compared to the case without formation of methyl formate on grain surface, which means that both gas phase and grain surface pathways contribute to the formation of this molecule. We find that 1% of CO needs to convert into CH3O to reproduce the observations. The conversion factor of CO into CH2OH is the same as before (0.03%), while the conversion factor of CO into HCO needs to be higher (0.05% instead of 0.001%) as HCO is now used for the formation of both methyl formate and glycolaldehyde. Using these parameters, we also run simulations for a range of 1–60 solar masses and obtain the exact same trend as for the scenario 3A (see Figure 7). While the values of the reaction rates and conversion factors of CO into HCO can be affected by the inclusion of the formation pathway of methyl formate on grains, it seems that the predicted trend of the EG/GA ratio with the luminosity is not.
| Assumptions | Range of [CH3OCHO/H2] predicted after desorption |
|---|---|
| Gas phase formation of MF only – F and Cl depleted by a factor 100 | 7 10-10 – 2.5 10-8 |
| Gas phase formation of MF only – no depletion of F and Cl | 7 10-10 – 2.9 10-8 |
| Gas phase formation of MF + Scenario 3 (thermal diffusion) | 1.7 10-8 – 4.7 10-8 |
| = 1%, = 0.05% and = 0.03% |
5 Conclusion
In this study, we explored the formation of the complex organic molecules, glycolaldehyde and ethylene glycol. We tested different grain surface formation pathways proposed in the literature by running simulations with the UCLCHEM chemical code. We extracted parameters that give a good agreement between the observations of the source G31.41+0.3 and the chemical predictions for a source of 25 . We then ran models for sources from 1 to 60 and compared the variation of the ethylene glycol-glycolaldehyde abundance ratio with the observational trend. Although none of the scenarios fully reproduce the trend, we found a better agreement with the formation channel involving the recombination of two HCO radicals followed by hydrogenation. It should be noted that a good agreement is also found if glycolaldehyde partially forms through the reaction between HCO and CH2OH in addition to the hydrogenation reaction. The reproduction of the trend is improved when a trend of decreasing H2 density within the core region with T100 K as a function of luminosity, is included in the model. We also note that destruction reactions of complex organic molecules in the gas phase need to be investigated, as they can affect the abundance ratios after the thermal desorption of the grain mantles in the inner regions of the star-forming regions.
Other species, such as methyl formate, ethanol and dimethyl ether, seem to present abundance ratios that increase or decrease with the luminosity (Rivilla et al., 2017). More studies would be needed to understand the origin of these observational trends, as they may provide helpful clues on the formation of these species.
Acknowledgements
The work of A.C. was funded by the STFC grant ST/M001334/1 and by the ERC Starting Grant 3DICE (grant agreement 336474). J.H. is funded by an STFC studentship. I.J.-S. and D.Q. acknowledge the financial support received from the STFC through an Ernest Rutherford Fellowship and Grant (proposals number ST/L004801 and ST/M004139). V.M.R. acknowledges the funding received from the European Union’s Horizon 2020 research and innovation programme under the Marie Sklodowska-Curie grant agreement n. 664931, and from the Italian Ministero dell’Istruzione, Università e Ricerca through the grant Progetti Premiali 2012 - iALMA.
References
- Antiñolo et al. (2016) Antiñolo M., Agúndez M., Jiménez E., Ballesteros B., Canosa A., El Dib G., Albaladejo J., Cernicharo J., 2016, ApJ, 823, 25
- Asplund et al. (2009) Asplund M., Grevesse N., Sauval A. J., Scott P., 2009, Annual Review of Astronomy and Astrophysics, 47, 481
- Awad et al. (2010) Awad Z., Viti S., Collings M. P., Williams D. A., 2010, MNRAS, 407, 2511
- Awad et al. (2014) Awad Z., Viti S., Bayet E., Caselli P., 2014, MNRAS, 443, 275
- Bacmann & Faure (2016) Bacmann A., Faure A., 2016, Astronomy & Astrophysics, 587, A130
- Balucani et al. (2015) Balucani N., Ceccarelli C., Taquet V., 2015, Monthly Notices of the Royal Astronomical Society, 449, L16
- Belloche et al. (2014) Belloche A., Garrod R. T., Muller H. S. P., Menten K. M., 2014, Science, 345, 1584
- Beltrán et al. (2005) Beltrán M. T., Cesaroni R., Neri R., Codella C., Furuya R. S., Testi L., Olmi L., 2005, A&A, 435, 901
- Beltrán et al. (2009) Beltrán M. T., Codella C., Viti S., Neri R., Cesaroni R., 2009, ApJ, 690, L93
- Biver et al. (2014) Biver N., et al., 2014, A&A, 566, L5
- Biver et al. (2015) Biver N., et al., 2015, Science Advances, 1, e1500863
- Brouillet et al. (2015) Brouillet N., Despois D., Lu X.-H., Baudry A., Cernicharo J., Bockelée-Morvan D., Crovisier J., Biver N., 2015, A&A, 576, A129
- Burke et al. (2015) Burke D. J., Puletti F., Brown W. A., Woods P. M., Viti S., Slater B., 2015, MNRAS, 447, 1444
- Butscher et al. (2015) Butscher T., Duvernay F., Theule P., Danger G., Carissan Y., Hagebaum-Reignier D., Chiavassa T., 2015, MNRAS, 453, 1587
- Ceccarelli (2004) Ceccarelli C., 2004, in Johnstone D., Adams F. C., Lin D. N. C., Neufeld D. A., Ostriker E. C., eds, Astronomical Society of the Pacific Conference Series Vol. 323, Star Formation in the Interstellar Medium: In Honor of David Hollenbach. p. 195
- Chuang et al. (2016) Chuang K.-J., Fedoseev G., Ioppolo S., van Dishoeck E. F., Linnartz H., 2016, MNRAS, 455, 1702
- Chuang et al. (2017) Chuang K.-J., Fedoseev G., Qasim D., Ioppolo S., van Dishoeck E. F., Linnartz H., 2017, MNRAS, 467, 2552
- Collings et al. (2004) Collings M. P., Anderson M. A., Chen R., Dever J. W., Viti S., Williams D. A., McCoustra M. R. S., 2004, MNRAS, 354, 1133
- Coutens et al. (2015) Coutens A., Persson M. V., Jørgensen J. K., Wampfler S. F., Lykke J. M., 2015, A&A, 576, A5
- Coutens et al. (2017) Coutens A., Rawlings J. M. C., Viti S., Williams D. A., 2017, MNRAS, 467, 737
- Crimier et al. (2009) Crimier N., Ceccarelli C., Lefloch B., Faure A., 2009, A&A, 506, 1229
- Crimier et al. (2010) Crimier N., et al., 2010, A&A, 516, A102
- Crovisier et al. (2004) Crovisier J., Bockelée-Morvan D., Colom P., Biver N., Despois D., Lis D. C., 2004, A&A, 418, 1141
- De Simone et al. (2017) De Simone M., et al., 2017, A&A, 599, A121
- Enrique-Romero et al. (2016) Enrique-Romero J., Rimola A., Ceccarelli C., Balucani N., 2016, MNRAS, 459, L6
- Fedoseev et al. (2015) Fedoseev G., Cuppen H. M., Ioppolo S., Lamberts T., Linnartz H., 2015, MNRAS, 448, 1288
- Fuente et al. (2014) Fuente A., et al., 2014, A&A, 568, A65
- Galano et al. (2005) Galano A., Alvarez-Idaboy J. R., Ruiz-Santoyo M. E., Vivier-Bunge A., 2005, The Journal of Physical Chemistry A, 109, 169
- Garrod (2008) Garrod R. T., 2008, A&A, 491, 239
- Garrod & Herbst (2006) Garrod R. T., Herbst E., 2006, A&A, 457, 927
- Herbst & van Dishoeck (2009) Herbst E., van Dishoeck E. F., 2009, Annual Review of Astronomy and Astrophysics, 47, 427
- Holdship et al. (2017) Holdship J., Viti S., Jiménez-Serra I., Makrymallis A., Priestley F., 2017, AJ, 154, 38
- Hollis et al. (2000) Hollis J. M., Lovas F. J., Jewell P. R., 2000, ApJ, 540, L107
- Jørgensen et al. (2012) Jørgensen J. K., Favre C., Bisschop S. E., Bourke T. L., van Dishoeck E. F., Schmalzl M., 2012, ApJ, 757, L4
- Jørgensen et al. (2016) Jørgensen J. K., et al., 2016, A&A, 595, A117
- Lykke et al. (2015) Lykke J. M., Favre C., Bergin E. A., Jørgensen J. K., 2015, A&A, 582, A64
- McElroy et al. (2013) McElroy D., Walsh C., Markwick A. J., Cordiner M. A., Smith K., Millar T. J., 2013, A&A, 550, A36
- Molinari et al. (2000) Molinari S., Brand J., Cesaroni R., Palla F., 2000, A&A, 355, 617
- Osorio et al. (2009) Osorio M., Anglada G., Lizano S., D’Alessio P., 2009, ApJ, 694, 29
- Reboussin et al. (2014) Reboussin L., Wakelam V., Guilloteau S., Hersant F., 2014, MNRAS, 440, 3557
- Rivilla et al. (2017) Rivilla V. M., Beltrán M. T., Cesaroni R., Fontani F., Codella C., Zhang Q., 2017, A&A, 598, A59
- Schöier et al. (2002) Schöier F. L., Jørgensen J. K., van Dishoeck E. F., Blake G. A., 2002, A&A, 390, 1001
- Taquet et al. (2015) Taquet V., López-Sepulcre A., Ceccarelli C., Neri R., Kahane C., Charnley S. B., 2015, ApJ, 804, 81
- Viti et al. (2004) Viti S., Collings M. P., Dever J. W., McCoustra M. R. S., Williams D. A., 2004, MNRAS, 354, 1141
- Watanabe & Kouchi (2002) Watanabe N., Kouchi A., 2002, The Astrophysical Journal Letters, 571, L173
- Webster (2003) Webster Z. T., 2003, PASP, 115, 1352
- Woods et al. (2012) Woods P. M., Kelly G., Viti S., Slater B., Brown W. A., Puletti F., Burke D. J., Raza Z., 2012, ApJ, 750, 19
- Woods et al. (2013) Woods P. M., Slater B., Raza Z., Viti S., Brown W. A., Burke D. J., 2013, ApJ, 777, 90
- van der Tak et al. (2013) van der Tak F. F. S., et al., 2013, A&A, 554, A83
Appendix A Summary of the EG/GA ratios derived in star-forming regions
| Source | Luminosity | EG/GA | Reference |
| () | |||
| IRAS16293 B | 3 | 3 | Jørgensen et al. (2016) |
| NGC1333 IRAS2A | 20 | 5 | Coutens et al. (2015) |
| NGC7129 FIRS2 | 500 | 2 | Fuente et al. (2014) |
| Orion KL | 1 105 | 13 | Brouillet et al. (2015) |
| G31.41+0.31 | 1.8 105 | 10 | Rivilla et al. (2017) |
| G34.3+0.2 | 2.8 105 | 6 | Lykke et al. (2015) |
| W51e2 | 4.7 106 | 15 | Lykke et al. (2015) |