![[Uncaptioned image]](/html/1712.08510/assets/figures/TOC.png)
A temperature-controlled stage for laser scanning confocal microscopy and case studies in chemistry of materials
Abstract
If confocal microscopy is an ubiquitous tool in life science, its applications in chemistry and materials science are still, in comparison, very limited. Of particular interest in these domains is the use of confocal microscopy to investigate temperature-dependent phenomena such as self-assembly, diffusio- or thermophoresis, or crystal growth. Several hurdles must be solved to develop a temperature-controlled stage for laser scanning confocal microscopy, in particular regarding the influence of an elevated temperature gradient close to the microscope objective, which most people try very hard to avoid. Here we report the design of a temperature-controlled stage able to generate stable temperature gradients in both positive and negative temperature range and does not require use of liquid nitrogen. Our setup provides an excellent control of the temperature gradient, which can be coupled with a controlled displacement of the sample, making it useful in particular for a variety of solidification, chemistry, and interfacial problems. We illustrate the benefits of our setup with several case studies of interest in chemistry and materials science: the 3D real-time imaging of ice growth, the segregation of hard particles by growing crystals, the freezing behaviour of single emulsions, the self-shaping of oil droplets upon cooling, and the self-assembly of amphiphile molecules into helical structures. These results show how confocal microscopy coupled with a temperature-controlled stage is a welcome addition to the toolkit of chemists and materials scientists.
1 Introduction
Temperature gradients have an important impact on many natural and industrial, chemical, and physical processes ranging from geophysics and biology to metallurgy and materials synthesis. In Nature temperature gradients are responsible for the ice lensing of soils in cold regions and the metamorphism of snow 1, 2, ice and the evolution of their interface 3. Naturally occurring antifreeze proteins protect a variety of living species (plants, insects, fishes) from freezing. To evaluate their effectiveness and that of developed synthetic analogues, well established temperature gradients are required 4. In metallurgy, temperature gradients determine the morphology of solid/liquid interface 5, 6, the lateral growth rate of the crystals 7, or the formation of intermetallic compounds at solid/liquid interfaces 8. The evolution of the mushy zone (partially solid/liquid region) in a fixed temperature gradient is also an important topic in nuclear safety9. Temperature gradient is one of the key parameter in the growth of monocrystals, which are essential components of optical systems 10 and microelectronics 11. Temperature gradients are used to create composition gradients for new types of materials such as plasmonic arrays 12. In soft matter studies, temperature gradients are used to study self-assembly processes such as micelles formation 13 or evolution of RNA-based self-assembled structures 14. Temperature gradients are applied to study thermophoretic mobility of vesicles 15. Thermophoresis is used to manipulate bubbles and droplets16. Temperature gradients were also used to study phase transitions in liquid crystals17 and later were applied to develop new temperature measurement techniques 18. We could continue this list of examples for a long time. Being able to use and control temperature gradients in experimental setups is therefore an problem with far-reaching implications. While sample heating is easily achieved by the use of resistive heaters, sample cooling typically relies on the use of liquid nitrogen which is, in some cases, inconvenient. In addition, because of thermal stability and condensation issues, most microscopists try very hard to avoid freezing temperatures and temperature gradients close to the microscope objectives. A few (costly) commercial temperature-controlled stages, cooled using liquid nitrogen, are available.
Here we report the design of a temperature-controlled stage (and the corresponding samples) able to generate stable temperature gradients in both positive and negative temperature range and does not require the use of liquid nitrogen. We developed this stage to perform in situ laser scanning confocal microscopy, which is relevant to investigate a broad range of chemistry problems, as we will demonstrate in this paper.
Confocal microscopy with rapid imaging capacities provides access to the 2D or 3D evolution of sample morphology with good time and space resolution. It allows simultaneous imaging of liquid phase, crystals and dispersed phase (particles, droplets, bubbles…).
2 Design of the stage
We designed a temperature-controlled stage based on two Peltier elements (Fig. 1). The main advantage of this design is that it allows both heating and cooling. Therefore, temperature controlled experiments can be performed either in positive or negative temperature range, or in a mixed regime, providing elevated temperature gradients.
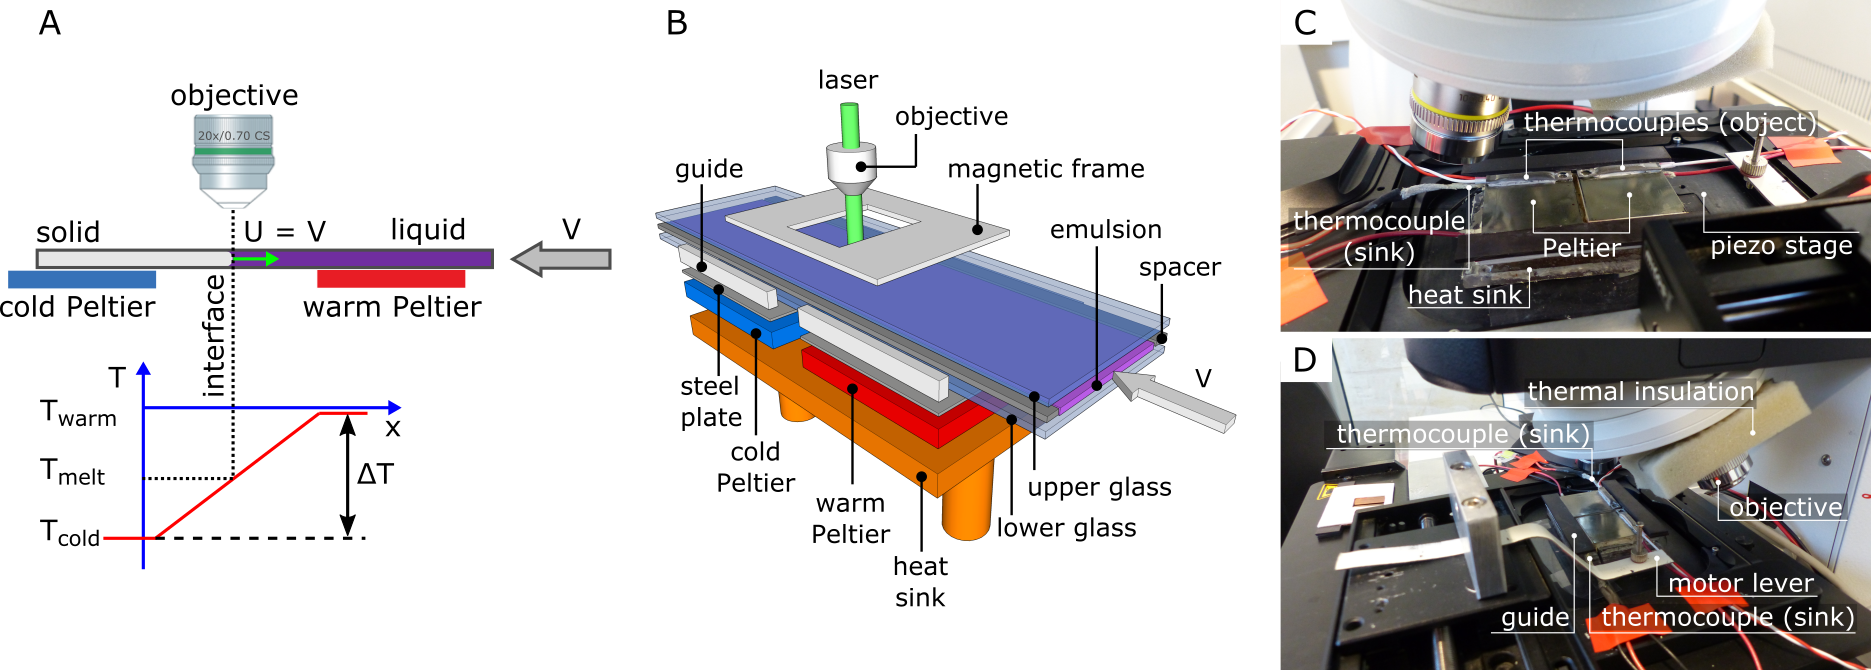
For our stage, we selected two ET-127-10-13 Peltier cooler modules (Produced by Adaptive and purchased from RS Components, France). These modules have following parameters: dimensions = , = 3.9 A, = 15.7Vdc and maximum cooling power = 35.2 W. Dimensions were chosen based on the sample geometry and desired stage size. and determine the choice of power and controlling modules. The maximum cooling power defines the overall performance of the temperature-controlled stage and the setup requirements for the heat sink.
To control the Peltier cooling modules, we use TEC-1122 Dual Thermo Electric Cooling Temperature Controller from Meerstetter Engineering, Switzerland. This specialized TEC controller is able to independently drive two Peltier modules which generate an output current up to 10 A and driving voltage up to 21 V. The controller can handle Pt100, Pt1000, or NTC temperature probes. The temperature precision/stability of the controller is C. The temperature controller is paired to a laptop via USB. The TEC Service software (v2.50, provided with the controller) is used to monitor and control all the operating parameters of the temperature-controlled stage.
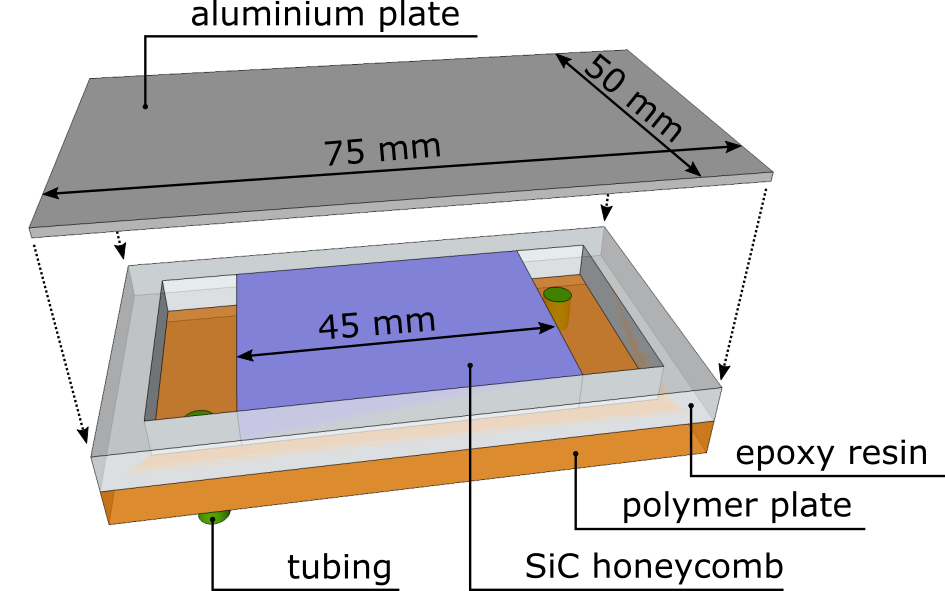
The design of an efficient heat sink is of uttermost importance to ensure the efficient operation of Peltier elements. The heat sink must withdraw and dissipate the heat generated on the warm side of the Peltier modules. The heat load is composed of the heat load of the object (amount of heat withdrew by Peltier element from the object) and heat load of the Peltier element due to losses. In our case, the maximum heat load can be as high as 96.4 W () for each Peltier. Almost 200 W must thus be removed continuously during the operations. Based on these high heat loads, we design a home-made water-cooled heat sink (Fig. 2). A silicon carbide honeycomb (which provides a high surface exchange), in contact with the heat source, is used to transfer the heat to the coolant that circulates through the heat sink. The thermal conductivity of silicon carbide is sufficient to remove all the generated heat, while the chemical inertia of silicon carbide ensures that the heat sink does not degrade over time because of corrosion. The circulating water is cooled by MPC Minichiller (Model 3006.0015.99, Huber, Germany), which typically operates at C.
The temperature-controlled stage is thermally isolated with a polyurethane foam. A hole is cut in the foam to accommodate the objective of the microscope. This allows to decrease the amount of condensation on the top of the sample.
An additional step is required to ensure a reliable contact with the Peltier elements and avoid undesirable z-translations of the sample during the operations. We thus attached thin (1 mm) steel plates on the top of each Peltier element. A magnetic frame is placed on the top of the sample to ensure that the sample remains in contact with the temperature-controlled stage during translation (Fig. 1B). This approach ensures a good thermal contact between the sample and the stage independently of sample thickness variations and guarantees that friction remains reasonably low to prevent stick-and-slip behaviour. Steel plates, in addition, help better homogenize the temperature field.
The temperature gradient stage is placed on the piezoelectric stage of the microscope. Because the piezoelectric stage needs to move freely during 3D acquisition, the weight placed on top of the stage cannot exceed . It was therefore critical to come up with a lightweight design for the stage. The whole temperature-controlled stage weight is , which ensures that 3D acquisition can be properly conducted.
3 Price estimate
A breakdown of the cost of the elements used for the setup is given in Tab. 1. The most costly parts are the temperature controller and the water cooler (which most labs already have). For the later, we used an expensive (but very efficient) water cooler (4,000 Eur.), although a cheaper one would probably do the job as well. The overall cost is therefore in the 3,800–6,8000 Eur. range, which is much cheaper than the commercially available stages. The cost does not include, of course, the time spent on designing, building, and testing the stage.
| Parts | Price (Eur.) |
|---|---|
| Temperature controller | 2,600 |
| Peltier elements () | 70 |
| Sink temperature sensors | 6 |
| Object temperature sensors () | 104 |
| Thermal paste | 25 |
| Epoxy resin | 6 |
| Heat sink | 0 (spare parts) |
| Water cooler | 1,000 to 4,000 |
| Total | 3,800 to 6,800 |
4 Sample preparation
We design lightweight samples for solidification studies (see case studies below). Hele-Shaw cells are prepared by sandwiching the sample (solution, emulsion, suspension) between two microscope cover glass slides. The slides are connected together with two stripes of double-side sticky tape (Fig. 3A, B). The second stripe acts as a spacer and ensures a constant sample thickness. To reduce thermal mass of the sample cell we use cover glass slides (Menzel, , thickness 0.13–0.16 mm) instead of traditional microscope slides used in commercially available temperature-controlled stages. This solution decreases the thermal inertia in the system. However, it requires additional measures to ensure a constant contact of the sample with the stage during translation as we discussed above (magnetic frame). Samples were sealed with acrylic glue or nail polish. We observed no effect of possible solvent residues on the freezing behaviour of the samples.
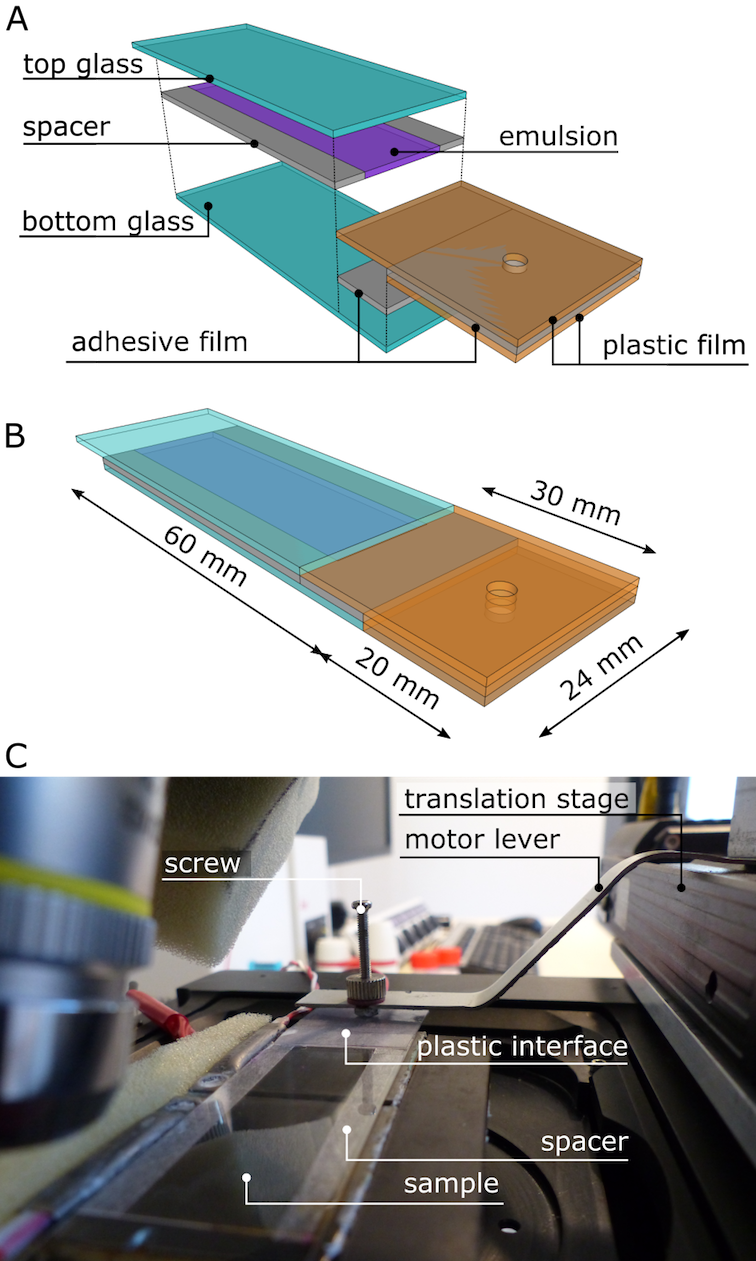
For the experiments–solidification studies–where the sample is translated through a temperature gradient, we use Micos Pollux Drive stepper motor with VT-80 translation stage (PI, USA). A flexible connection of the sample to the motor was achieved via thick plastic strip. It is attached to the sample with double sided sticky tape and screwed to the motor lever (Fig. 3C). Such type of connection diminishes the risks of damages to the sample by bending loads arising from the lack of parallelism between the latter and the motor. It reduces as well heat transfer in the system.
For image acquisition, we use long working distance non-immersive objectives (Leica HC PL APO 20x/0.70 CS and 10x/0.40 CS2) to minimize the effect of the microscope thermal mass on the freezing process. These objectives have free working distances of 0.59 mm and 2.2 mm respectively.
5 Operation modes
Several operation modes are possible, depending on the system investigated. In the case studies reported below, we used two main operating modes: (1) a fixed temperature gradient, no sample displacement and (2) a fixed temperature gradient with sample displacement. We use the first mode to investigate temperature-dependent phenomena such as self-assembly or the self-shaping of droplets. Because of the high temperature gradient (up to ) in a small observation window typically less than , it is possible to investigate a large variety of experimental conditions at once. Although we work at a constant temperature and temperature gradient, it is also possible to keep the temperature gradient constant while the temperature is increased or decreased, if needed.
The second mode (sample displacement, fixed temperature gradient) is used for solidification studies. This mode has two main benefits. First, it allows to decouple the temperature gradient with the growth rate of the crystals, because they are independently controlled. These two parameters play a critical role on the solidification regimes and microstructure. The second benefit is a consequence of the fixed interface position in the observation frame. If we investigate the interactions of objects (particles, oil droplets) with the solidification front, we can observe and analyse hundreds or more of interaction events. A statistical analysis of the interactions can thus be achieved. We use this mode to investigate the 3D morphology of ice growth, the behaviour of hard particles in interaction with a solidification front, and the freezing of emulsions.
The typical operation procedure is as follows. The sample is prepared as described previously. The temperature of the stage is adjusted to C. The sample is deposited on the freezing stage, attached to the stepper motor, and put-in-place with the magnetic frame. The stage is then thermally isolated with the polymer foam. The desired temperature gradient is established by setting the temperatures of Peltier elements. Finally–if needed–, the solidification front velocity is set by adjusting the speed of translation stage motor.
Image analysis was done with Fiji (ImageJ 1.51h)19.
6 Performances
The temperature of the Peltier elements in our setup can be varied from C to over C. The lower limit is determined by the choose of Peltier elements, efficiency of heat sink, temperature of cooling water, and thermal insulation of the stage. The upper limit is set by the sample evaporation and thermal stability of some elements of the stage. The maximal temperature gradient that can be established depends on the temperature of each Peltier. In our experiments, we apply temperature gradients in the 5–20 range. The design of the stage, combined with the small sample thickness, ensure that the vertical temperature gradient through the sample is negligible. Symmetrical ice crystals are formed (Fig. 4A).
Pt100 thermocouples provide temperature readings with a precision of while the temperature controller ensures a temperature precision of . The actual precision of the temperature control within the sample is, however, lower due to the sample displacement and therefore to the dynamic character of the thermal contact with the temperature-controlled stage. Position of solid/liquid interface for the temperature gradient of and several sample displacement velocities are shown in Fig. 4B. The interface velocity stabilizes within a minute after the beginning of the sample translation. The small fluctuations observed, most likely, arise from the variations in the thermal contact between the sample and the freezing stage.
We find a very good agreement between the imposed velocity (speed of stepper motor) and the measured velocity of the solidification front (Fig. 4C). The VT-80 translation stage can adjust the sample displacement velocity from to several . The useful upper limit is nevertheless mainly determined by the acquisition performance of the microscope and specificity of the experiment.

7 Design of the solutions/emulsions
We choose a set of three oils combining a melting temperature significantly lower than that of the water, a low solubility in water and compatibility with standard surfactants–see Tab. 2. For the most of the studies we used propyl benzoate as an oil due to the good density matching with water.
| Oil | Melting point | Solubility () | Density () | CAS number |
|---|---|---|---|---|
| Anisole | 0.100 | 0.995 | 100-66-3 | |
| Octyl acetate | 0.018 | 0.870 | 112-14-1 | |
| Propyl benzoate | 0.035 | 1.023 | 2315-68-6 |
| Dye | Excitation wavelength (nm) | Emission wavelength (nm) | CAS number |
|---|---|---|---|
| Sulforhodamine B | 565 | 586 | 3520-42-1 |
| 493 | 504 | 121207-31-6 |
To dye the aqueous phase we use Sulforhodamine B. To avoid fluorescence self-quenching which was reported above 20 we use solution in combination with 1% - 5% laser power (MAX power - ) for all the experiments. For oil staining we use Difluoro2-[1-(3,5-dimethyl-2H-pyrrol-2-ylidene-N)ethyl]-3,5-dimethyl-1H-pyrrolato-Nboron. This is a more hydrophobic version of the BODIPY fluorescent dye. It has good solubility in all the oils we studied. A concentration of is sufficient to obtain clear imaging at 1% laser power. We observe no significant changes in the fluorescence intensity upon cooling.
8 Case studies
We illustrate here the benefits of our setup with a variety of case studies of interest in chemistry in particular, and more generally in materials science: 3D real-time imaging of ice growth, the segregation of hard particles by growing crystals, the freezing behavior of single emulsions, the self-shaping of oil droplets upon cooling, and the self-assembly of amphiphiles into helical structures.
8.1 3D, real-time imaging of ice growth
An advantage of confocal microscopy in comparison to other characterization techniques is ability to perform in situ 3D imaging of the sample without introducing observation artifacts. A number of techniques have been used to investigate crystal growth, and each one of them has its own benefits and limitations. Optical microscopy is easy to perform, does not induce observation artifacts (low energy of the light beam), but does not provide a 3D representation of the crystals. The only technique able to provide in situ 3D representation of crystal growth is X-ray tomography. However, the effects of interaction between the highly energetic beam and the ice crystals are still problematic 21. Confocal microscopy provides thus a complementary alternative to X-ray imaging.
We previously used confocal microscopy to image crystal growth in situ 22. However, the previous setup provided little to no control over the cooling rate and temperature gradient, and the solidification front was moving through the observation window, making the operation difficult. With the current temperature-controlled stage, we have a complete control of the growth velocity, growth direction, and temperature gradient. It is thus much easier to investigate in a reliable and reproducible manner.
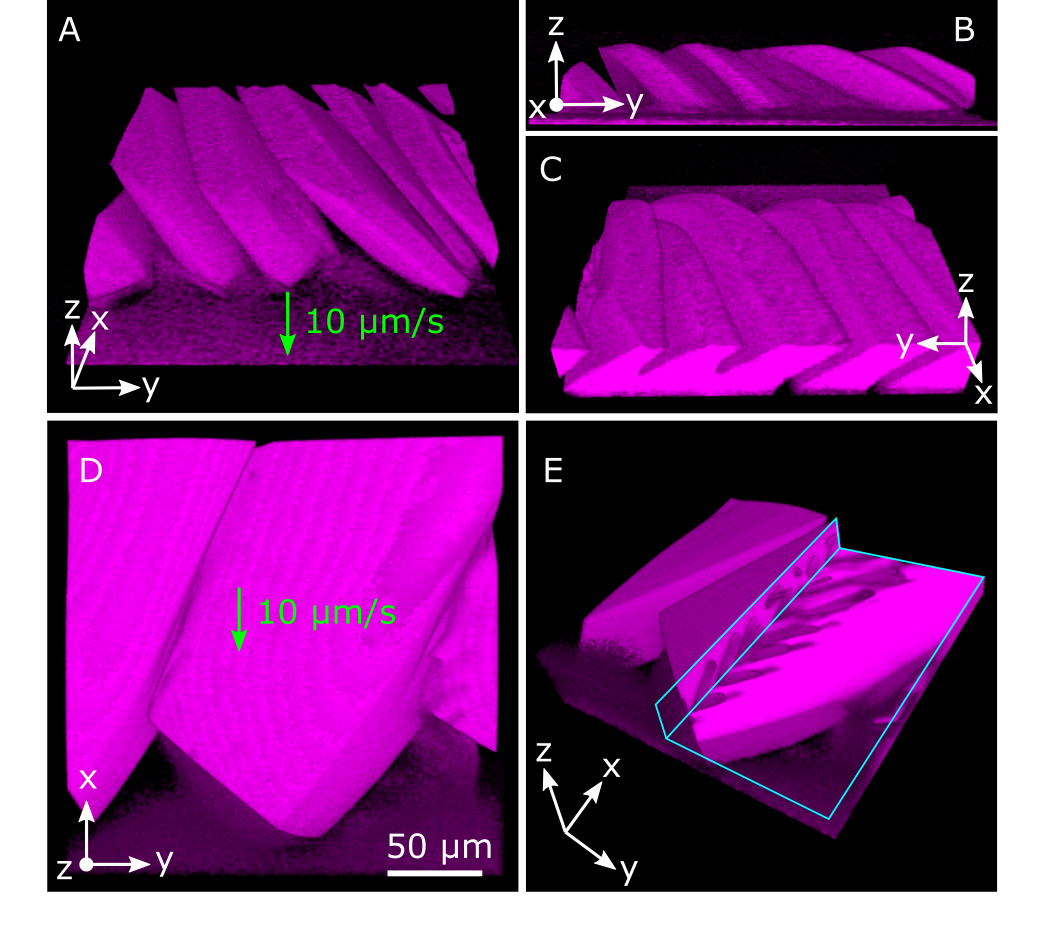
This is particularly useful when one of the main crystallographic axes of the sample does not coincide with the orientation of the focal plane. One such example is the growth of tilted crystals during the solidification of solution of ice shaping compound - zirconium acetate (Fig. 5A-C). Classical 2D imaging in this case will not provide the complete information on the sample morphology. Volume information acquired in such a case with AFM may be misinterpreted as well.
The importance of 3D imaging becomes even more prominent if we reduce the temperature gradient in this system from to . This leads to the formation of internal porosity with complex geometry (Fig. 5E) while in-plane view provides no evidences of such change in the ice shaping behavior of zirconium acetate (Fig. 5D). However, this observation of the internal porous structure of the crystals help us rationalize the previously reported porous morphology of ice-templated materials, obtained under similar conditions 22.
8.2 Segregation of hard particles by growing crystals
The interaction of particles with a solidification front has been a central feature of interest in solidification studies for the past 40 years. Because of its many occurrences in different domains, from geophysics (soils freezing) to metallurgy (particle-reinforced alloys), food engineering, or ice-templating of porous materials 23, a lot of attention has been paid to investigate the interactions of particles with growing crystals and their outcome. Of particular interest are the solidification patterns 24, the development of secondary phases or premelted films around entrapped particles 25, and the solidification in confined environments 26, 27.
Further progress in our understanding of these phenomena requires in situ observation of the solidification processes, at the spatial resolution of particles. In addition, being able to discriminate the solid and liquid phases during solidification is critical. Confocal microscopy, with point by point illumination of the sample and rejection of out of focus light, provides a way to overcome many of the problems in conventional microscopy caused by multiple scattering of objects which are out of focus, and prevents imaging deep within a sample. A popular technique in solidification studies is X-ray tomography. However, in addition to the beam-induced artefacts mentioned above, the current spatial resolution does not allow imaging individual particle and their dynamics.
Here we use our temperature-controlled stage to investigate the freezing of hard particles suspensions in conditions similar to that used in materials processing routes based on freezing 28. The 1 vol.% particle suspension was frozen at , in a temperature gradient.
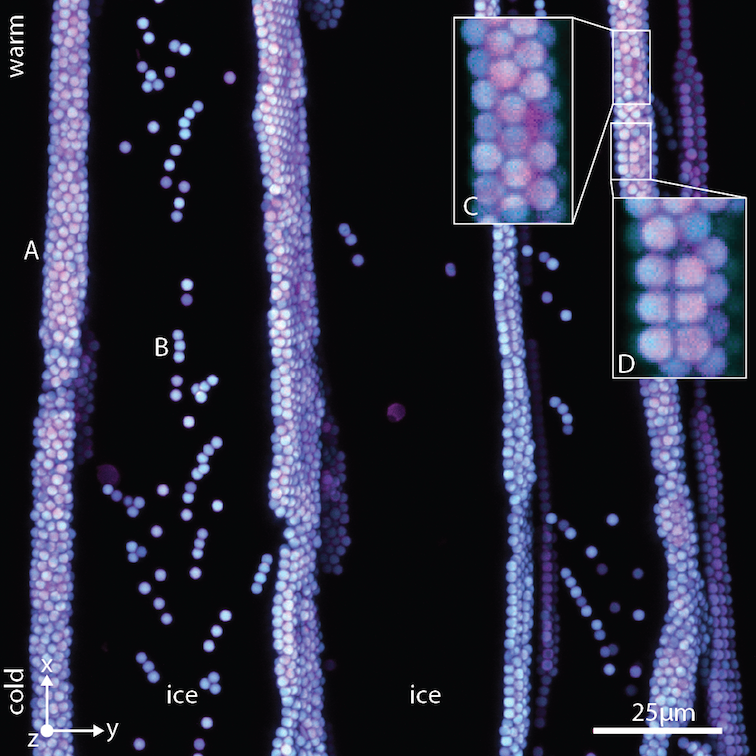
A 3D view of the frozen sample is shown in Fig. 6. The Sulforhodamine B dye is rejected by the ice crystals, the black regions of the image corresponds thus to the ice crystals. The rapid growth rate of the crystals (20 ) induce lamellar solidification patterns typically encountered in ice-templating studies 29. The particles are segregated between the lamellar ice crystals (region A), where a nearly dense packing can be observed. We can also notice that not all particles are segregated by the crystals: a few isolated particles (region B) are entrapped within the ice crystals. This means that a mixed regime can exist during solidification, where most–but not all– particles are segregated by the solidification front. The critical velocity above which particles are engulfed by the front 30 directly depends on the particle size. However, here we use particles with a very narrow size distribution. Therefore the mixed regime cannot be explained by a particle size distribution effect, where large particles would be engulfed and smaller one repelled and concentrated between adjacent crystals.
Higher magnification observations (insets C and D in Fig. 6) enable us to identify the inter-particle regions where ice is already present. In inset C, a dense packing of particles can be seen. The pore size between the particles is thus small, and we can see on the image that the water is still liquid, as the Sulforhodamine B signal is strong. In inset D, however, a cubic packing with larger pores is observed. The Sulforhodamine B signal is much weaker, revealing thus that ice has already penetrated into the pores. This behavior can be explained by the Gibbs-Thomson freezing point depression: the freezing point decreases with pore size 31. Hence pore ice is formed first in the largest pores. With confocal microscopy, we can thus follow the progression of freezing within the packing of segregated particles. No other technique can provide such observations today.
The perspectives in the solidification studies in the presence of particles are therefore exciting. Not only can we image ice, liquid, and particles, but the temperature-controlled stage also provides a decoupled control of the temperature gradient and the ice growth rate, which are the main parameters that control the solidification patterns and segregation behaviours. In addition, we can perform such observations dynamically, and should thus be able to investigate the dynamics of particle segregation and their coupling with crystal growth.
8.3 Freezing emulsions
Emulsions are another interesting system to freeze, for several reasons. The first one is, of course, to better understand the freeze/thaw stability of emulsions, which are of interest in many chemistry 32, pharmaceutical 33, and food engineering 34, 35, 36 applications. The second motivation are freezing routes using emulsions, which can yield porous materials 37 or capsules 38. The third reason, with far-reaching implications, is the use of model mono-dispersed emulsions to investigate the interaction of objects with a solidification front 39. The later is a phenomenon encountered in applications as diverse as the freezing of soils in cold regions, the cryopreservation of cells, the solidification of particle-reinforced alloys, or the removal of pollutants by directional freezing 40. Because we can easily control their size, composition, and surface chemistry, oil droplets are interesting objects to play with in this case. They may offer a particularly interesting analogy to the behaviour of soft objects such as reproductive or red blood cells.
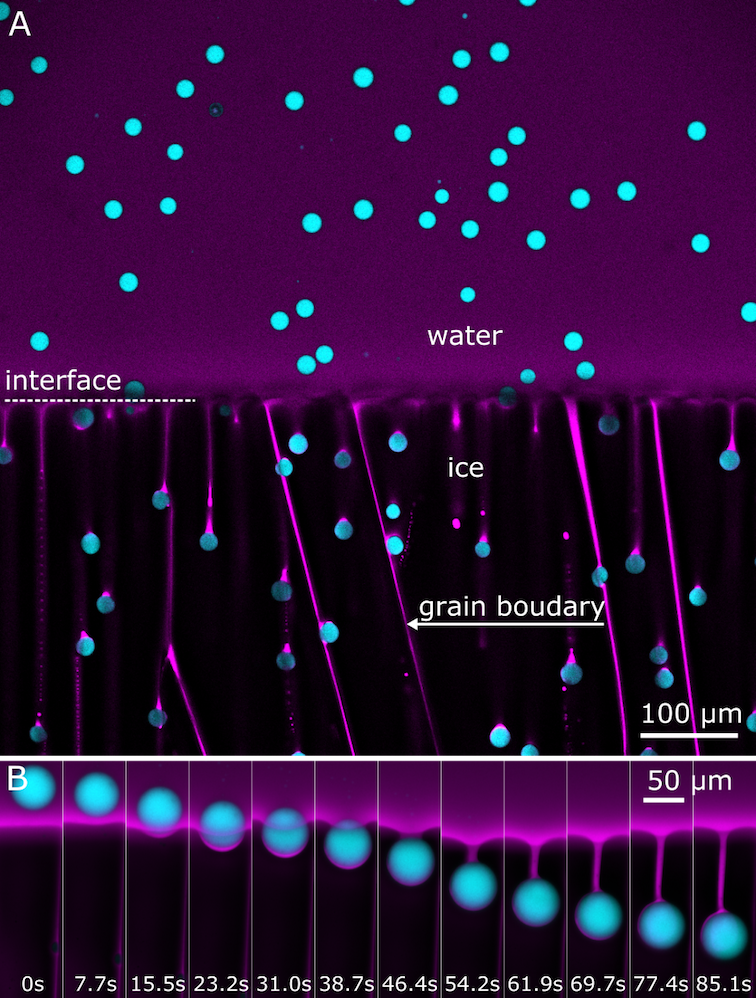
Before moving to systems closer to that of applications, it is better to start the investigations with a model system. Here we prepare an oil-in-water emulsion using microfluidics. The volume fraction of oil is low enough so that droplets do not interact with each other during freezing. We can thus investigate in details the interaction of isolated droplets with the front. A typical image is shown in Fig. 7. The ice rejects the dye from water and appears thus in black. The liquid regions fluoresce (magenta). A second dye, incorporated in the oil droplets (cyan), enables us to identify them. We can thus simultaneously image the liquid, the ice, and the droplets, in 2D or 3D.
With rapid imaging capacities, we can capture in 3D the interaction of an oil droplet with the solidification front. A typical time-lapse, 3D reconstruction is shown in Fig. 7B. Here, we combined all the slices (z-projection). The result is equivalent to an optical microscopy image with an extended depth of view and limited light scattering. We can thus clearly follow the movement of the droplet, the deformation of the solid/liquid interface, as well as the formation of a thin liquid film between the droplet and the ice. This thin film is preserved when the droplet is completely engulfed by the ice. In the example shown here, the thin liquid film extends towards the solidification front, creating thus a defect (grain boundary) in the solidification microstructure. Because the solidification front is at a constant position in the observation frame, we can gather statistics about the droplet behaviour, unlike previous studies of particle/front interactions where only a few interactions events were imaged and analysed. Hundreds of interactions events can be analysed if the experiment is run for long enough 39.
The current setup offers a uniquely-controlled platform to investigate the freeze/thaw stability of emulsions, with 3D, in situ, multiphase imaging capacities, providing statistical informations about the interactions of soft objects with a solidification front. It may thus become a valuable tool in the study of such systems.
8.4 Self-shaping of oil droplets upon cooling
Bottom-up approach becoming an attractive energy and material efficient alternative to the classical top-down approach in the materials synthesis. A great variety of organic 41, 42, 43, inorganic 44 and composite materials 45 was obtained via the bottom-up approach by using polymers, small synthetic and biological molecules, amphiphiles, graphene and other components as building blocks. Of particular interest of organic self-assembly is that many of such systems, including DNA 46, peptides 47 and amphiphiles 48, 49, exhibit temperature metamorphism - i.e. different morphologies may be obtained by changing the temperatures or cooling rate. While being able to provide multiplicity of morphologies, self-assembling systems can be difficult to study when both thermodynamics and kinetics are involve in the structure formation 50.
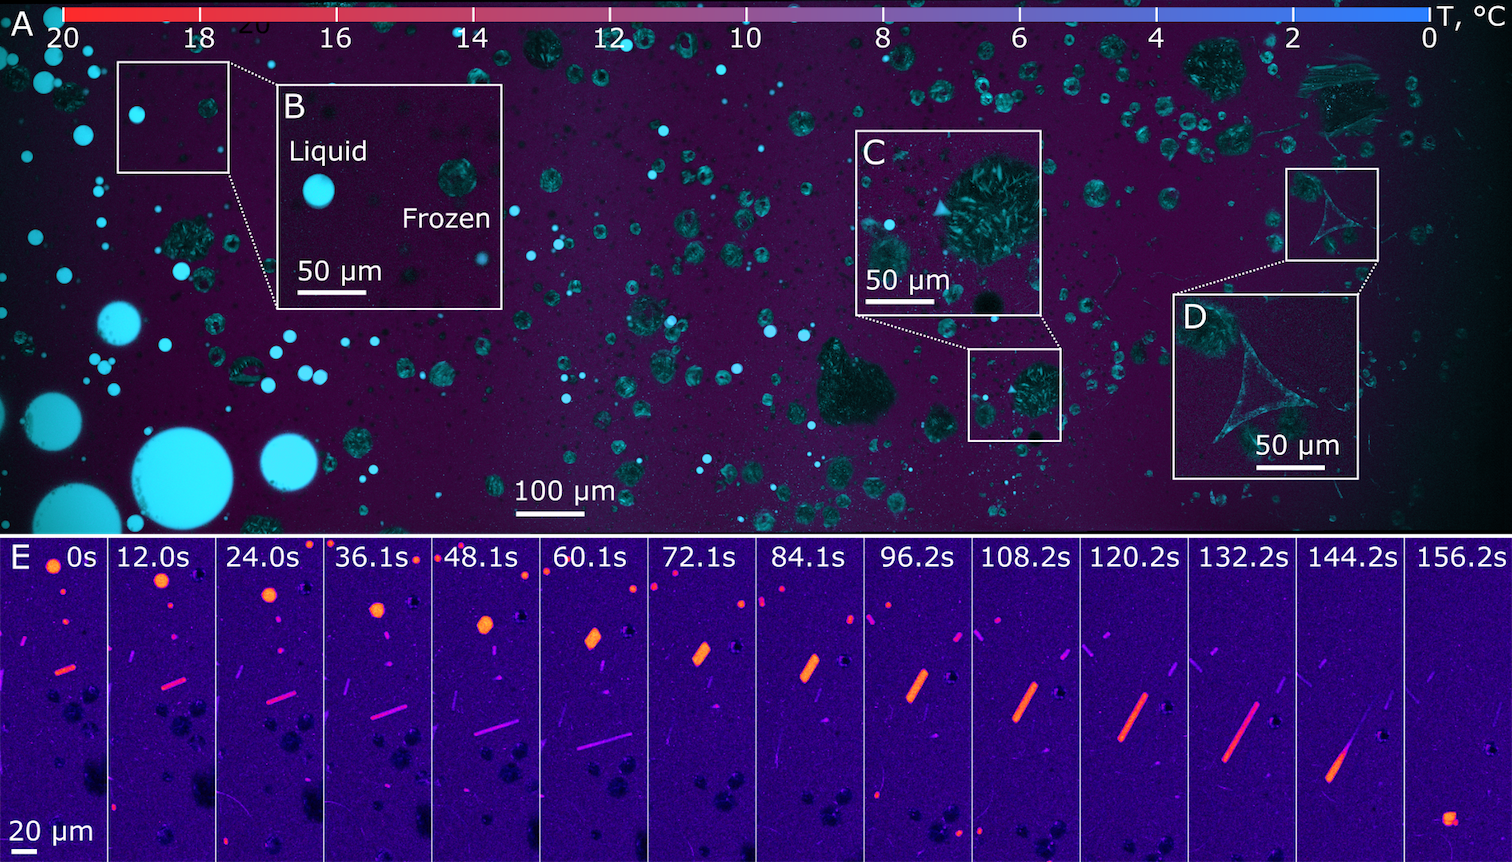
Here we present an example based on the work of Denkov et al. 51. Hexadecane droplets in water (containing appropriate surfactant) spontaneously change their morphology several times, generating series of complex regular shapes owing to the internal phase-transition processes (Fig. 8). The sample consists of 5% v/v of hexadecane in water (containing 1 wt% of Brij 58 surfactant). The emulsion is produced by hand shaking for 30 seconds. The sample is introduced at and then one side was cooled to with a cooling rate of .
The confocal image is shown in Fig. 8A. At (melting point of hexadecane), the oil freezes, resulting in the change in the droplet colour (insert B in Fig. 8). A variety of frozen droplets with irregular shapes including triangles (Fig. 8C and D), hexagons, and prisms (Fig. 8E) can be observed below the melting point.
Fig. 8E shows the time-lapse sequence for the sample translated with a velocity of 1 over a temperature gradient of . This corresponds to the cooling rate of . In total agreement with the work of Denkov et al. under slow cooling spherical oil droplet transforms consecutively into hexagonal platelet, tetragonal platelet, platelet with high aspect ratio and, eventually, thin fibre. The advantage of the approach proposed here over the classical cooling experiment is that a large amount of statistical data on the droplets metamorphism can be accumulated within single experiment.
8.5 Self-assembly of amphiphiles into helical structures
Chiral assemblies such as twisted ribbons, helices and tubes are commonly encountered in Nature, with the double helix of DNA being the most well-known. Such structures have attracted extensive research interest over the last decade owing to their importance for the understanding of biological phenomena and use in nanotechnology 44 and functional materials synthesis 41, 42.
Chiral structures are typically formed upon the cooling of the sample below the phase transition temperature 52. Determining the effect of the temperature on the formation kinetics and morphology of aggregates can be, however, a time consuming task. Here we present a fast screening of the temperature effect on the amphiphile self-assembly.
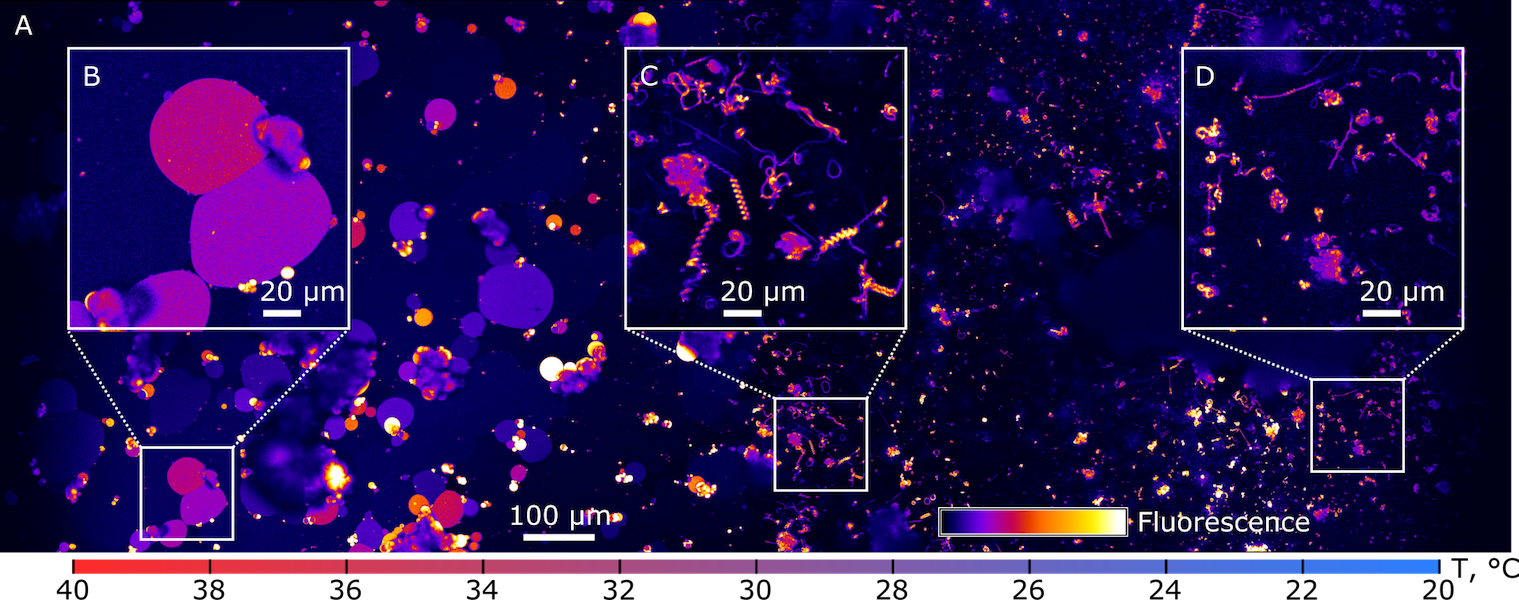
The following experiment is based on the work of Aime et al. 53, 54. The sample contains didodecyldimethylammonium bromide, guanosine 5’-monophosphate (GMP) disodium salt, and acetic acid to adjust the pH to 5.9. We first solubilize the sample at and then introduced it in a temperature gradient of (between and ).
Fig. 9A shows the sample morphology after four hours of ageing. Sulforhodamine B fluorescent dye forms strong ion pair with amphiphile, which ensures that in our experiment we do visualize only the latter. The reported Krafft temperature of didodecyldimethylammonium guanosine 5’-monophosphate complex is (for solution). Above this temperature amphiphile is in the melted state. It forms circular domains at the surface of the bottom glass slide (Fig. 9B). Fluorescence intensity differs between the domains which can result from the thickness variation (multi-layered structure). Below the Krafft temperature, the amphiphile/GMP complex precipitates from the solution and self-assembles into micrometer-size helical structures (Fig. 9C). Interestingly, even close to the phase transition temperature, we do not observe any helix orientation along the temperature gradient. This suggests that helical structures are not formed through the condensation of monomers from solution, but rather via the structural reorganization of existing precipitate. Decreasing the temperature results in the formation of smaller helical structures evincing slower self-assembly kinetics (Fig. 9D).
9 Conclusions and perspectives
We presented here a versatile design of a stage for temperature controlled-experiments under the confocal microscope, including experiments with elevated temperature gradients (up to here). The variety of examples reported here, from crystal growth to the freezing stability of emulsions emulsions, the self-assembly of amphiphiles into helical structures or the self-shaping of oil droplets, illustrate the potential of this approach in chemistry and materials science. If confocal microscopy is an ubiquitous tool in life sciences, very little has been comparatively shown in chemistry and materials science. We hope that this study and setup design will inspire other chemists to enter this playground. While we used only two detectors in our setup, most confocal microscope today can accommodate up to 5 detectors. More complex multiphase imaging can thus be envisioned if needed.
The research leading to these results has received funding from the European Research Council under the European Union’s Seventh Framework Programme (FP7/2007-2013) / ERC grant agreement 278004 (project FreeCo). We thank Tom Kodger for providing the particles used in one of the examples shown here.
References
- Wiese and Schneebeli 2017 Wiese, M.; Schneebeli, M. Early-stage interaction between settlement and temperature-gradient metamorphism. Journal of Glaciology 2017, 63, 652–662
- Pinzer et al. 2012 Pinzer, B. R.; Schneebeli, M.; Kaempfer, T. U. Vapor flux and recrystallization during dry snow metamorphism under a steady temperature gradient as observed by time-lapse micro-tomography. Cryosphere 2012, 6, 1141–1155
- Hammonds et al. 2015 Hammonds, K.; Lieb-Lappen, R.; Baker, I.; Wang, X. Investigating the thermophysical properties of the ice-snow interface under a controlled temperature gradient. Part I: Experiments & Observations. Cold Regions Science and Technology 2015, 120, 157–167
- Haleva et al. 2016 Haleva, L.; Celik, Y.; Bar-Dolev, M.; Pertaya-Braun, N.; Kaner, A.; Davies, P. L.; Braslavsky, I. Microfluidic Cold-Finger Device for the Investigation of Ice-Binding Proteins. Biophysical Journal 2016, 111, 1143–1150
- Clarke et al. 2017 Clarke, A. J.; Tourret, D.; Song, Y.; Imhoff, S. D.; Gibbs, P. J.; Gibbs, J. W.; Fezzaa, K.; Karma, A. Microstructure selection in thin-sample directional solidification of an Al-Cu alloy: In situ X-ray imaging and phase-field simulations. Acta Materialia 2017, 129, 203–216
- Cai et al. 2016 Cai, B.; Wang, J.; Kao, A.; Pericleous, K.; Phillion, A. B.; Atwood, R. C.; Lee, P. D. 4D synchrotron X-ray tomographic quantification of the transition from cellular to dendrite growth during directional solidification. Acta Materialia 2016, 117, 160–169
- Chang et al. 2012 Chang, G.-W.; Chen, S.-Y.; Li, Q.-C.; Yue, X.-D.; Jin, G.-C. Lateral Growth Rate of Cells in Melt. Journal of Iron and Steel Research, International 2012, 19, 28–50
- Zhao et al. 2015 Zhao, N.; Zhong, Y.; Huang, M. L.; Ma, H. T.; Dong, W. Growth kinetics of Cu<inf>6</inf> Sn<inf>5</inf> intermetallic compound at liquid-solid interfaces in Cu/Sn/Cu interconnects under temperature gradient. Scientific Reports 2015, 5, 1–12
- Salloum-Abou-Jaoude et al. 2015 Salloum-Abou-Jaoude, G.; Reinhart, G.; Combeau, H.; Založnik, M.; Lafford, T. A.; Nguyen-Thi, H. Quantitative analysis by in situ synchrotron X-ray radiography of the evolution of the mushy zone in a fixed temperature gradient. Journal of Crystal Growth 2015, 411, 88–95
- Natarajan et al. 2014 Natarajan, V.; Arivanandhan, M.; Anandan, P.; Sankaranarayanan, K.; Ravi, G.; Inatomi, Y.; Hayakawa, Y. In-situ observation of faceted growth of benzophenone single crystals. Materials Chemistry and Physics 2014, 144, 402–408
- Fujiwara et al. 2011 Fujiwara, K.; Gotoh, R.; Yang, X. B.; Koizumi, H.; Nozawa, J.; Uda, S. Morphological transformation of a crystal-melt interface during unidirectional growth of silicon. Acta Materialia 2011, 59, 4700–4708
- Ye et al. 2017 Ye, S.; Wang, H.; Su, H.; Chang, L.; Wang, S.; Zhang, X.; Zhang, J.; Yang, B. Facile fabrication of homogeneous and gradient plasmonic arrays with tunable optical properties via thermally regulated surface charge density. J. Mater. Chem. C 2017, 5, 3962–3972
- Jensen et al. 2013 Jensen, G. V.; Lund, R.; Gummel, J.; Monkenbusch, M.; Narayanan, T.; Pedersen, J. S. Direct observation of the formation of surfactant micelles under nonisothermal conditions by synchrotron SAXS. Journal of the American Chemical Society 2013, 135, 7214–7222
- Jaeger and Chworos 2005 Jaeger, L.; Chworos, A. From RNA Tectonics to Programmable Jigsaw Puzzles Made of RNA. Foundations of Nanoscience. Edited by Reif JH. Science Technica 2005, 157–162
- Talbot et al. 2017 Talbot, E. L.; Kotar, J.; Parolini, L.; Di Michele, L.; Cicuta, P. Thermophoretic migration of vesicles depends on mean temperature and head group chemistry. Nature Communications 2017, 8, 1–8
- Selva et al. 2010 Selva, B.; Miralles, V.; Cantat, I.; Jullien, M.-C. Thermocapillary actuation by optimized resistor pattern: bubbles and droplets displacing, switching and trapping. Lab on a Chip 2010, 10, 1835
- Balachandran et al. 2014 Balachandran, R.; Panov, V. P.; Panarin, Y. P.; Vij, J. K.; Tamba, M. G.; Mehl, G. H.; Song, J. K. Flexoelectric behavior of bimesogenic liquid crystals in the nematic phase – observation of a new self-assembly pattern at the twist-bend nematic and the nematic interface. J. Mater. Chem. C 2014, 2, 8179–8184
- Basson and Pottebaum 2012 Basson, M.; Pottebaum, T. S. Measuring the temperature of fluid in a micro-channel using thermochromic liquid crystals. Experiments in Fluids 2012, 53, 803–814
- Schindelin et al. 2012 Schindelin, J. et al. Fiji: an open-source platform for biological-image analysis. Nature methods 2012, 9, 676–82
- Arbeloa et al. 1989 Arbeloa, F.; Ojeda, P.; Arbeloa, I. Flourescence self-quenching of the molecular forms of Rhodamine B in aqueous and ethanolic solutions. Journal of Luminescence 1989, 44, 105–112
- Deville et al. 2013 Deville, S.; Adrien, J.; Maire, E.; Scheel, M.; Di Michiel, M.; Michiel, M. D. Time-lapse, three-dimensional in situ imaging of ice crystal growth in a colloidal silica suspension. Acta Mater. 2013, 61, 2077–2086
- Marcellini et al. 2016 Marcellini, M.; Noirjean, C.; Dedovets, D.; Maria, J.; Deville, S. Time-Lapse, in Situ Imaging of Ice Crystal Growth Using Confocal Microscopy. ACS Omega 2016, 1, 1019–1026
- Deville 2017 Deville, S. Freez. Colloids Obs. Princ. Control. Use; 2017; pp 1–46
- Watanabe and Mizoguchi 2000 Watanabe, K.; Mizoguchi, M. Ice configuration near a growing ice lens in a freezing porous medium consisting of micro glass particles. J. Cryst. Growth 2000, 213, 135–140
- Dash et al. 1999 Dash, J. G.; Fu, H.; Wettlaufer, J. S. The premelting of ice and its environmental consequences. Reports Prog. Phys. 1999, 58, 115–167
- Hansen-Goos and Wettlaufer 2010 Hansen-Goos, H.; Wettlaufer, J. S. Theory of ice premelting in porous media. Phys. Rev. E 2010, 81, 31604
- Coasne et al. 2013 Coasne, B.; Galarneau, A.; Pellenq, R. J. M.; Di Renzo, F. Adsorption, intrusion and freezing in porous silica: the view from the nanoscale. Chem. Soc. Rev. 2013, 4141–4171
- Deville 2017 Deville, S. Freez. Colloids Obs. Princ. Control. Use; 2017; pp 351–438
- Deville et al. 2007 Deville, S.; Saiz, E.; Tomsia, A. P. Ice-templated porous alumina structures. Acta Mater. 2007, 55, 1965–1974
- Rempel and Worster 2001 Rempel, A. W.; Worster, M. G. Particle trapping at an advancing solidification front with interfacial-curvature effects. J. Cryst. Growth 2001, 223, 420–432
- Liu et al. 2003 Liu, Z.; Muldrew, K.; Wan, R. G.; Elliott, J. A. W. Measurement of freezing point depression of water in glass capillaries and the associated ice front shape. Phys. Rev. E 2003, 67, 61602
- Lin et al. 2008 Lin, C.; He, G.; Dong, C.; Liu, H.; Xiao, G.; Liu, Y. Effect of Oil Phase Transition on Freeze/Thaw-Induced Demulsification of Water-in-Oil Emulsions. Langmuir 2008, 24, 5291–5298
- Bogdan et al. 2016 Bogdan, A.; Molina, M. J.; Tenhu, H. Freezing and glass transitions upon cooling and warming and ice/freeze-concentration-solution morphology of emulsified aqueous citric acid. Eur. J. Pharm. Biopharm. 2016, 109, 49–60
- Ghosh and Coupland 2008 Ghosh, S.; Coupland, J. N. Factors affecting the freeze-thaw stability of emulsions. Food Hydrocoll. 2008, 22, 105–111
- Degner et al. 2014 Degner, B. M.; Chung, C.; Schlegel, V.; Hutkins, R.; Mcclements, D. J. Factors influencing the freeze-thaw stability of emulsion-based foods. Compr. Rev. Food Sci. Food Saf. 2014, 13, 98–113
- Katsuki et al. 2017 Katsuki, K.; Miyagawa, Y.; Nakagawa, K.; Adachi, S. Dispersion Stability of O/W Emulsions with Different Oil Contents Under Various Freezing and Thawing Conditions. J. Food Sci. 2017, 82, 1569–1573
- Chatterjee et al. 2016 Chatterjee, S.; Sen Gupta, S.; Kumaraswamy, G. Omniphilic Polymeric Sponges by Ice Templating. Chem. Mater. 2016, 28, 1823–1831
- Khapli et al. 2009 Khapli, S.; Kim, J. R.; Montclare, J. K.; Levicky, R.; Porfiri, M.; Sofou, S. Frozen cyclohexane-in-water emulsion as a sacrificial template for the synthesis of multilayered polyelectrolyte microcapsules. Langmuir 2009, 25, 9728–9733
- Dedovets et al. 2017 Dedovets, D.; Monteux, C.; Deville, S. Freezing Emulsions. arXiv Prepr. 2017,
- Deville 2017 Deville, S. Freez. Colloids Obs. Princ. Control. Use; 2017; pp 1–46
- Luo and Zhang 2012 Luo, Z.; Zhang, S. Designer nanomaterials using chiral self-assembling peptide systems and their emerging benefit for society. Chemical Society Reviews 2012, 41, 4736
- Busseron et al. 2013 Busseron, E.; Ruff, Y.; Moulin, E.; Giuseppone, N. Supramolecular self-assemblies as functional nanomaterials. Nanoscale 2013, 5, 7098
- Hu et al. 2014 Hu, H.; Gopinadhan, M.; Osuji, C. O. Directed self-assembly of block copolymers: a tutorial review of strategies for enabling nanotechnology with soft matter. Soft Matter 2014, 10, 3867
- Yang and Kotov 2011 Yang, M.; Kotov, N. A. Nanoscale helices from inorganic materials. Journal of Materials Chemistry 2011, 21, 6775
- Ariga et al. 2008 Ariga, K.; Hill, J. P.; Lee, M. V.; Vinu, A.; Charvet, R.; Acharya, S. Challenges and breakthroughs in recent research on self-assembly. Science and Technology of Advanced Materials 2008, 9
- Rogers et al. 2016 Rogers, W. B.; Shih, W. M.; Manoharan, V. N. Using DNA to program the self-assembly of colloidal nanoparticles and microparticles. Nature Reviews Materials 2016, 1, 16008
- Wang et al. 2016 Wang, J.; Liu, K.; Xing, R.; Yan, X. Peptide self-assembly: thermodynamics and kinetics. Chemical Society Reviews 2016, 45, 5589–5604
- Sorrenti et al. 2013 Sorrenti, A.; Illa, O.; Ortuño, R. M. Amphiphiles in aqueous solution: well beyond a soap bubble. Chemical Society Reviews 2013, 42, 8200
- Liu et al. 2013 Liu, Q.; Zhou, H.; Zhu, J.; Yang, Y.; Liu, X.; Wang, D.; Zhang, X.; Zhuo, L. Self-assembly into temperature dependent micro-/nano-aggregates of 5,10,15,20-tetrakis(4-carboxyl phenyl)-porphyrin. Materials Science and Engineering C 2013, 33, 4944–4951
- Wang et al. 2015 Wang, Y.; Qi, W.; Huang, R.; Yang, X.; Wang, M.; Su, R.; He, Z. Rational Design of Chiral Nanostructures from Self-Assembly of a Ferrocene-Modified Dipeptide. Journal of the American Chemical Society 2015, 137, 7869−7880
- Denkov et al. 2015 Denkov, N.; Tcholakova, S.; Lesov, I.; Cholakova, D.; Smoukov, S. K. Self-shaping of oil droplets via the formation of intermediate rotator phases upon cooling. Nature 2015, 528, 392–395
- Ziserman et al. 2011 Ziserman, L.; Lee, H. Y.; Raghavan, S. R.; Mor, A.; Danino, D. Unraveling the mechanism of nanotube formation by chiral self-assembly of amphiphiles. Journal of the American Chemical Society 2011, 133, 2511–2517
- Aimé et al. 2007 Aimé, C.; Manet, S.; Satoh, T.; Ihara, H.; Park, K. Y.; Godde, F.; Oda, R. Self-assembly of nucleoamphiphiles: Investigating nucleosides effect and the mechanism of micrometric helix formation. Langmuir 2007, 23, 12875–12885
- Aimé et al. 2009 Aimé, C.; Tamoto, R.; Satoh, T.; Grelard, A.; Dufourc, E. J.; Buffeteau, T.; Ihara, H.; Oda, R. Nucleotide-promoted morphogenesis in amphiphile assemblies: Kinetic Control of micrometric helix formation. Langmuir 2009, 25, 8489–8496