Fault Localization in Large-Scale Network Policy Deployment
Abstract
The recent advances in network management automation and Software-Defined Networking (SDN) are easing network policy management tasks. At the same time, these new technologies create a new mode of failure in the management cycle itself. Network policies are presented in an abstract model at a centralized controller and deployed as low-level rules across network devices. Thus, any software and hardware element in that cycle can be a potential cause of underlying network problems. In this paper, we present and solve a network policy fault localization problem that arises in operating policy management frameworks for a production network. We formulate our problem via risk modeling and propose a greedy algorithm that quickly localizes faulty policy objects in the network policy. We then design and develop Scout—a fully-automated system that produces faulty policy objects and further pinpoints physical-level failures which made the objects faulty. Evaluation results using a real testbed and extensive simulations demonstrate that Scout detects faulty objects with small false positives and false negatives.
I Introduction
Fast fault localization in the network is essential but becoming more challenging than ever. Modern networks are increasingly complex. The network infrastructures support new complex functions such as virtualization, multitenancy, performance isolation, access control, and so forth. The instantiation of these functions is governed by high-level network policies that reflect on network-wide requirements. SDN111In this paper, SDN is used in a broader context, not just limited to the OpenFlow protocol, to which all the discussions are still relevant. makes such network management tasks easier with a global view on the network state at a logically centralized SDN controller.
In a network, a vast amount of low-level configuration instructions can be translated from a few high-level policies. Errors that lurk during policy creation, translation or delivery, may lead to the incorrect deployment of a large number of low-level rules in network devices. A single error for a policy can cause a serious damage such as outage to business-critical services. Hence, the network policy management process of SDN creates a new mode of failure.
A number of frameworks [1, 2, 3, 4, 5, 6, 7] aid network policy management tasks through abstraction, policy composition and deployment. However, these frameworks are not immune to various faulty situations that can arise from misconfiguration, software bugs, hardware failure, control channel disruption, device memory overflow, etc. Many of them incur a flow of instructions from a centralized controller, to a software agent in a network device and finally to ternary content addressable memory (TCAM) in that device. Thus, any element in this data flow can be the root cause of policy deployment failures.
When a network policy is not rendered in the network as expected, network admins should first understand which part of the policy has been affected. This is challenging because the admins can end up examining tens of thousands of low-level rules. In the existing policy management frameworks [1, 3], low-level rules are built from policy objects (in short, objects) such as marketing group, DB tier, filter, and so on. Our study on a production cluster reveals that even one object can be used to create TCAM rules for over thousands of endpoints (§III-A and Figure 3). This implies that a fault of that single object can lead to a communication outage for those numerous endpoints, and the admins observe too many failures. Examining all of the TCAM rules associated with the endpoints would be tedious. Thus, the admins require a fully-automated means that quickly nails down to the part of the policy they should look into or further diagnose to fix a large number of the observed failures.
We call this problem of finding out the impaired parts of the policy as a network policy fault localization problem, which we tackle via risk modeling [8]. We model risks as simple bipartite graphs that capture dependencies between risks (i.e., objects) and nodes (e.g., endpoints or end user applications) that rely on those risks. We then annotate the risk models for those risks and nodes associated with the observed failures. Using the annotated risk models, we devise a greedy fault localization algorithm that outputs a hypothesis, a minimum set of most-likely faulty policy objects (i.e., risks) that explains most of the observed failures.
At first glance, solving this policy fault localization problem looks straightforward as a similar problem has been studied for IP networks [8]. However, as this paper tries to address the problem in a new operating domain — SDN-enabled data center and enterprise networks, there are two key challenges. First, it is difficult to represent risks in the network policy as a single model. Solving many risk models can be computationally expensive. In our modeling, we fortunately require two risk models only: switch risk model and controller risk model (§III-B). We make the two models based on our observation that faults of policy objects occur at two broad layers (controller and switch). If the controller malfunctions, unsuccessful policy deployment can potentially affect all the switches in the network (thus, controller risk model). In contrast, a policy deployment failure can be limited to a switch if that switch only becomes faulty (thus, switch risk model).

Our second challenge stems from the fact that the degree of impact on endpoints caused by a faulty object varies substantially. When a fault event occurs, a subset of objects are responsible for all of the impacted endpoints. In contrast, another subset of objects cause trouble to a small fraction of the whole endpoints that rely on them. This variety makes accurate fault localization difficult. An existing algorithm [8] tends to choose policy objects in the former case while it treats objects in the latter case as input noise. However, in our problem, some objects do belong to the latter case. To handle this issue, Scout employs a 2-stage approach; it first picks objects only if all of their dependent endpoints are in failure; next, for (typically a small number of) objects left unexplained in the risk model, it looks up the change logs (maintained at a controller) and selects the objects to which some actions are recently applied (§IV). Despite its simplicity, this heuristic effectively localizes faulty objects. (§VI).
Overall, this paper makes the following main contributions.
-
1.
We introduce and study a network policy fault localization problem (§II) in the context of SDN. This is a new problem that gained little attention but is of utmost importance in operating a network policy management framework safely.
-
2.
We introduce two risk models (switch and controller risk models) that precisely capture the characteristics of the problem and help its formulation (§III).
-
3.
We devise a network policy fault localization algorithm that quickly narrows down a small number of suspicious faulty objects (§IV). We then design and implement Scout (§V), a system that conducts an end-to-end automatic fault localization from failures on policy objects to physical-level failures that made the objects faulty.
-
4.
We evaluate Scout using a real production cluster and extensive simulations (§VI). Our evaluations show that Scout achieves 20-50% higher accuracy than an existing solution and is scalable. Scout runs a large-scale controller risk model of a network with 500 leaf switches, under 130 seconds in a commodity machine.
II Policy deployment by example
In this section we first introduce network policy, its abstraction model, and its deployment. We then discuss network state inconsistency caused by failures of elements involved in the network policy management.
II-A Network policy
In general network policies dictate the way traffic should be treated in a network. In managing network policies, tenant/admins should be able to express their intent on traffic via a model and to enforce the policies at individual network devices. To enable more flexible composition and management of network policies, several frameworks [1, 3, 7] present the network policies in an abstracted model (e.g., a graph) that describes communication relationships among phyiscal/logical entities such as servers, switches, middleboxes, VMs, etc.
Intent illustration. As an example, consider a canonical 3-tier web service that consists of Web, App and DB servers (or VMs) as shown in Figure 1(a). Here the tenant intent is to allow communication on specific ports between the application tiers, i.e., port 80 between Web and App, ports 80 and 700 between App and DB. A network policy framework transforms intent of users (tenant, network admins, etc.) into an abstracted policy as illustrated in Figure 1(b).
Network policy presentation. For driving our discussion, we here apply a network policy abstraction model used in Cisco’s application-centric policy infrastructure controller (APIC) [3], which is quite similar to other models (e.g., GBP [7], PGA [1]); and our work for localizing faults in network policy management is agnostic to policy abstraction model itself. Figure 1(b) illustrates a network policy (as a graph represented with policy objects) transformed from the tenant intent shown in Figure 1(a). We discuss each of those policy objects next.
An endpoint group (EPG) represents a set of endpoints (EPs), e.g., servers, VMs, and middleboxes, that belong to the same application tier. A filter governs access control between EPGs. This policy entity takes a whitelisting apporach, which by default blocks all traffic in the absence of mapping between EPGs and filters.
The mapping between EPGs and filters are indirectly managed by an object called contract, which serves as a glue between EPGs and filters. A contract defines what filters need to be applied to which EPGs. Thus, a contract enables easy modification of filters. For example, in Figure 1(b), let us assume EPG:App and EPG:DB no longer require communication between them on port 700. This only requires to remove “Filter: port 700/allow” from the Contract:App-DB; no update between EPGs and their contract is necessary.
Finally, the scope of all EPGs in a tenant policy is defined using a layer-3 virtual private network, realized with a virtual routing and forwarding (VRF) object.
Network policy deployment. A network policy should be realized through deployment. A centralized controller maintains the network policy and makes changes on it. When updates (add/delete/modify) on a network policy are made, the controller compiles the new policy and produces instructions that consist of policy objects and the update operations associated with the objects. The controller then distributes the instructions to respective switch agents. The switch agents also keep a local view on the network policy to which the instructions from the controller are applied. The switch agents transform any changes on the logical view into low-level TCAM rules. Note that there are multiple technologies to link controller and switch agents like OpenFlow, OpFlex [9], etc. Also, TCAM could have matching rules based on either typical IP packet header fields or custom proprietary header fields. Our work on fault localization is agnostic to both linking technologies and the format of TCAM rules.
| No. | Rule | Action |
|---|---|---|
| 1 | VRF:101,Web,App,Port80 | Allow |
| 2 | VRF:101,App,Web,Port80 | Allow |
| 3 | VRF:101,App,DB,Port80 | Allow |
| 4 | VRF:101,DB,App,Port80 | Allow |
| 5 | VRF:101,App,DB,Port700 | Allow |
| 6 | VRF:101,DB,App,Port700 | Allow |
| 7 | *,*,*,* | Deny |
Consider a network topology (Figure 1) where is attached to switch , to and to . Let us assume that , and . Putting it altogether, the controller sends out the instructions about to switch (as is connected to ), those about to switch , and so forth. As the three switches receive the instructions on those EPGs for the first time, they build a logical view from scratch (see Figure 1(c) for example). Hence, a series of add operations invoke TCAM rule installations in each switch. Figure 2 shows access control list (ACL) rules rendered in TCAM of .
II-B Network state inconsistency
Network policy enforcement is by nature a distributed process and involves the management of three key elements: (i) a global network policy at controller, (ii) a local network policy at switch agent, and (iii) TCAM rules generated from the local policy. Ideally, the states among these three elements should be equivalent in order for the network to function as intended by admins.
In reality, these elements may not be in an equivalent state due to a number of reasons. A switch agent may crash in the middle of TCAM rule updates. A temporal disconnection between the controller and switch agent during the instruction push. TCAM has insufficient space to add new ACL rules, which renders the rule installation incomplete. The agent may run a local rule eviction mechanism, which even worsens the situation because the controller may be unaware of the rules deleted from TCAM. Even TCAM is simply corrupted due to hardware failure. All of these cases can create a state mismatch among controller, switch agent and TCAM level, which compromises the integrity of the network.
One approach to this issue is to make network policy management frameworks more resilient against failures. However, failures are inevitable, so is the network state inconsistency.
III Shared Risks in Network Policy
We exploit shared risk models for our network policy fault localization problem. The shared risk model has been well studied in IP networks [8]. For instance, when a fiber optic cable carries multiple logical IP links, the cable is recognized as a shared risk for those IP links because the optical cable failure would make the IP links fail or perform poorly.
Deploying a network policy also presents shared risks. A network policy comprises policy objects (such as VRF, EPGs, contract, filter, etc). The relationship among those objects dictates how a network policy must be realized. If an object is absent or ill-represented in any of controller, switch agent and TCAM layers, all of EPG pairs that rely on that object would be negatively impacted. Thus, these policy objects on which a set of EPG pairs rely are shared risks in the network policy deployment.
Figure 2 depicts that a TCAM rule is expressed as a combination of objects presented in a logical model at switch . If the 5th and 6th TCAM rules in the figure are absent from TCAM, all the traffic between EPG:App and EPG:DB via port 700 would be dropped. The absence of correct rules boils down to a case where one or more objects are not rendered correctly in TCAM; a corrupted TCAM may write a wrong VRF identifier (ID) or EPG ID for those rules; may drop the filter ‘port 700/allow’ from its logical view due to software bug. Such absence or mispresentation of objects directly affect the EPG pairs that share the objects. Thus, shared risk objects for App-DB EPG pair are VRF:101, EPG:App, EPG:DB, Contract:App-DB, Filter:80/allow, and Filter:700/allow.
III-A A case study in a production cluster
A key aspect of shared risks is that they can create different degree of damages to EPG pairs. If an incorrect VRF ID is distributed from the controller to switch agents, all pairs of EPGs belonging to the VRF would be unable to communicate. In contrast, if one filter is incorrectly deployed in one switch, the impact would be limited to the endpoints in the EPG pairs that are directly connected to the switch (and to other endpoints that might attempt to talk to those endpoints).
In a network policy, a large number of EPG pairs may depend on a shared risk (object) and/or a single EPG pair may rely on multiple shared risk objects. These not only signify the criticality of a shared risk but also the vulnerability of EPG pairs. More importantly, a dense correlation between shared risks and EPG pairs makes it promising to apply risk modeling techniques to fault localization of network policy deployment.
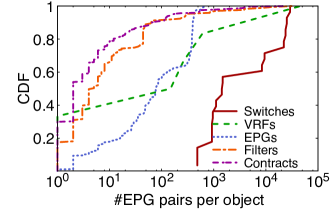
To understand the degree of sharing between EPG pairs and policy objects, we analyze policy configurations from a real production cluster that comprises about 30 Cisco’s nexus 9000 series switches, one APIC, and hundreds of servers. Figure 3 shows the cumulative distribution function on the number of EPG pairs sharing a policy object, from which we make the following observations:
-
•
A failure in deploying VRF would lead to a breakdown of a number of EPG pairs. A majority of VRF objects has more than 100 EPG pairs. 10% VRFs are shared by over 1,000 EPG pairs and 2-3% VRFs by over 10,000 EPG pairs.
-
•
EPGs are configured to talk to many EPGs. About 50% of EPGs belong to more than 100 EPG pairs, which implies that the failure of an EPG is communication outage with a significant number of EPGs.
-
•
The failure of a physical object such as switch would create the biggest impact on EPG pairs. About 80% of switches maintain at least 1,000s of EPG pairs.
-
•
Contract and filter are mostly shared by a small number of EPG pairs. 70% of the filters and 80% of the contracts are used by less than 10 EPG pairs.
From these observations, it is evident that failures in a shared risk affect a great number of EPG pairs. Consider a problematic situation where admins see numerous high alerts that indicate a communication problem between a number of EPG pairs, all because of a few shared risk failures. In this case, it is notoriously hard to inspect individual EPG pairs and find out the underlying faulty risk objects. However, this high dependency also makes spatial correlation hold promise in localizing problematic shared risks among a huge number of shared risks in large-scale networks.
III-B Risk models
We adopt a bipartite graph model that has been actively used to model risks in the traditional IP network [8]. A bipartite graph demonstrates associations between policy objects and the elements that would be affected by those objects. At one side of the graph are policy objects (e.g., VRF, EPG, filter, etc.); and the affected elements (e.g., EPG pairs) are located at the other side. An edge between a pair of nodes in the two parties is created if an affected element relies on a policy object under consideration.
In modeling risks for network policy, one design question is how to represent risks in the 3-tier deployment hierarchy that involves controller, switch agent and TCAM. During rule deployment, there are two major places that eventually cause the failure of TCAM rule update—one from controller to switch agent and the other from switch agent to TCAM. The former may cause global faults whereas the latter does local faults. For instance, if the controller cannot reach out to a large number of switches for some reason, the policy objects across those unreachable switches are not updated. On the other hand, when one switch is unreachable, a switch agent misbehaves, or TCAM has hardware glitches, the scope of risk model should be restricted to a particular switch level. Thus, in order to capture global- and local-level risks properly, we propose two risk models: (i) switch and (ii) controller risk model.
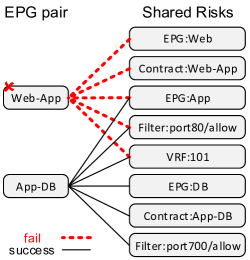
Switch risk model. A switch risk model consists of shared risks (i.e., policy objects) and the elements (i.e., EPG pair) that can be impacted by the shared risks on a per-switch basis. The model is built from a network policy and the physical locations of endpoints belonging to EPGs in the network. Figure 4(a) shows an example of switch risk model for switch given the local view on network policy in Figure 1(c). The left-hand side in the model shows all EPG pairs deployed in switch . Each EPG pair has an edge to those policy objects (on the right-hand side in the model) that it relies on in order to allow traffic between endpoints in the EPG pair. For instance, the Web-App EPG pair has outgoing edges to EPG:Web, EPG:App, VRF:101, Filter:port80/Allow, and Contract:Web-App. An edge is flagged as either success or fail, soon discussed in §III-C.
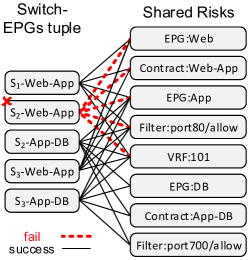
Controller risk model. A controller risk model captures shared risks and their relationships with vulnerable elements across all switches in the network. A controller risk model is constructed in a similar manner of a switch risk model. In the controller risk model, a switch ID and an EPG pair form a triplet. A triplet has edges to policy objects that the EPG pair relies on in that specific switch. Since the same policy object can be present in more than one switch, an EPG pair in multiple switches can have an edge to the object. Figure 4(b) shows the controller risk model for tenant network policy presented in Figure 1(b).
III-C Augmenting risk models
In a conventional risk model, when an element affected by shared risks experiences a failure, it is referred to as an observation. In case of switch risk model, an EPG pair is an observation when endpoints in the EPG pair are allowed to communicate but fail to do so.
In our work, an observation is made by collecting the TCAM rules (T-type rules) deployed across all switches periodically and/or in an event-driven fashion, and by conducting an equivalence check between logical TCAM rules (L-type rules) converted from the network policy at the controller and the collected T-type rules. For this, we use an in-house equivalence checker. The equivalence check is to compare two reduced ordered binary decision diagrams (ROBDDs); one from L-type rules, and the other from T-type rules. If both ROBDDs are equivalent, there is no inconsistency between the desired state (i.e., the network policy) and actual state (i.e., the collected TCAM rules). If not, the tool generates a set of missing TCAM rules that explains the difference and that should have been deployed in the TCAM but absent from the TCAM). Those missing rules allow to annotate edges in the risk models as failure, thereby providing more details on potentially problematic shared risks. Note that simply reinstalling those missing rules is a stopgap, not a fundamental solution to address the real problem that creates state inconsistency.
Potentially, the L-T equivalence checker can produce a large number of missing rules. As demonstrated by our study on dependencies between objects (§III-A and Figure 3), one ill-presented object at controller and/or switch agent can cause policy violations for over thousands of EPG pairs and make thousands of rules missing from the network. Unfortunately, it is expensive to do object-by-object checking present in the observed violations. Thus, we treat all objects in the observed violations as a potential culprit. We then mark (augment) the edges between the malfunctioning EPG pair (due to the missing rule) and its associated objects in the violation as fail.
Figure 4(a) illustrates how the switch risk model is augmented with suspect objects if the 1st rule is missing from the TCAM in in Figure 2. To pinpoint culprit object(s), one practical technique is to pick object(s) that explains the observation best (i.e., the famous Occam’s Razor principle); in this example, EPG:Web and Contract:Web-App would explain the problem best as they are solely used by the Web-App EPG pair. The lack of the augmented data would make it hard to localize fault policy objects as it suggests that all objects appear equally plausible. Note that the example is deliberately made simple to ease discussion. In reality many edges between EPG pairs and shared risks can be marked as fail (again, see the high degree of dependencies between objects from Figure 3).
IV Fault Localization
We now build a fault localization algorithm that exploits the risk models discussed in §III. We first present a general idea, explain why the existing approach falls short in handling the problem at hand and lastly describe our proposed algorithm.
IV-A General idea
In the switch risk model, for instance, an EPG pair is marked as fail, if it has at least one failed edge between the pair and a policy object (see Figure 4(a)). Otherwise, the EPG pair is success. Each EPG pair node marked as fail is an observation. A set of observations is called a failure signature. Any policy object shared across multiple EPG pairs becomes a shared risk.
If all edges to an object are marked as fail, it is highly likely that the failure of deploying that object explains the observations present in the failure signature, and such an object is added to a set called hypothesis. Recall in Figure 4(a) that the EPG:Web and Contract:Web-App objects best explain the problem of Web-App EPG pair. On the other hand, other objects such as VRF:101 and EPG:App are less likely to be the culprit because they are also shared by App-DB EPG pair which has no problem. An ideal algorithm should be able to pick all the responsible policy objects as a hypothesis.
In many cases, localizing problematic objects is not as simple as shown in Figure 4(a). Multiple object failures can take place simultaneously. In such a case, it is prohibitive to explore all combinations of multiple objects that are likely to explain all of the observations in a failure signature. Therefore, the key objective is to identify a minimal hypothesis (in other words, a minimum number of failed objects) that explains most of the observations in the failure signature. An obvious algorithmic approach would be finding a minimal set of policy objects that covers risk models presented as a bipartite graph. This general set cover problem is known to be NP-complete [10].
IV-B Existing algorithm: SCORE
We first take into account a greedy approximation algorithm used by SCORE [8] system that attempts to solve the min set coverage problem and that offers -approximation to the optimal solution [8], where is the number of affected elements (e.g., EPG pairs in our problem). We first explain the SCORE algorithm and further discuss its limitation.
Algorithm. The greedy algorithm in the SCORE system picks policy objects to maximize two utility values—(i) hit ratio and (ii) coverage ratio—computed for each shared risk. We first introduce a few concepts in order to define them precisely under our switch risk model. The same logic can be applied to the controller risk model.
Let be a set of EPG pairs that depend on a shared risk , be a subset of in which EPG pairs are marked as fail (observations) due to failed edges between the EPG pairs and the shared risk , and be the failure signature, a set of all observations, i.e., for all . For shared risk , a hit ratio, is then defined as:
In other words, a hit ratio is a fraction of EPG pairs that are observations out of all EPG pairs that depend on a shared risk. A hit ratio is 1 when all EPG pairs that depend on a shared risk are marked as fail. And a coverage ratio, is defined as:
A coverage ratio denotes a fraction of failed EPG pairs associated with a shared risk from the failure signature.
The algorithm chooses shared risks whose hit ratio is above some fixed threshold value. Next, given the set of selected shared risks, the algorithm outputs those shared risks that have the highest coverage ratio values and that maximize the number of explained observations.
Limitation. The algorithm treats a shared risk with a small hit ratio as noise and simply ignores it. However, in our network policy fault localization problem, we observe that while some policy objects such as filter have a small hit ratio ( 0.01), they are indeed responsible for the outage of some EPG pairs. The algorithm excludes those objects, which results in a huge accuracy loss (results in §VI-B).
It turns out that not all EPG pairs that depend on the object are present in the failure signature. For instance, suppose that 100 EPG pairs depend on a filter, which needs 100 TCAM rules. In this case, if one TCAM rule is missing, a hit ratio of the filter is 0.01. This can happen if installing rules for those EPG pairs is conducted with a time gap. For instance, 99 EPG pairs are configured first, and the 100th EPG pair is a newly-added service, hence configured later.
To make it worse, in reality the hit ratio can vary significantly too. In the previous example, if 95 TCAM rules are impacted, the hit ratio is 0.95. The wide variation of hit ratio values can occur due to (1) switch TCAM overflow; (2) TCAM corruption [11] that causes bit errors on a specific field in a TCAM rule or across TCAM rules; and (3) software bugs [12] that modify object’s value wrong at controller or switch agent. While the SCORE algorithm allows change of a threshold value to handle noisy input data, such a static mechanism helps little in solving the problem at hand, confirmed by our evaluation results in §VI.
IV-C Proposed algoirthm: Scout
We propose Scout algorithm that actively takes into account policy objects whose hit ratio percentage is less than 100% and thus overcomes the limitation of the SCORE algorithm. Basically, our algorithm also greedily picks the faulty objects and outputs hypothesis that has a minimal set of objects most likely explains all the observations in a failure signature.
Algorithm 1 shows the core part of our fault localization algorithm. The algorithm takes failure signature and risk model as input. has a set of observations, e.g., EPG pairs marked as fail in the switch risk model. For each observation in , the algorithm obtains a list of policy objects with fail edges to that observation and computes the utility values (i.e., hit and coverage ratios) for all those objects (lines 6-10). Then, based on the utility values of shared risks in the model, the algorithm picks a subset of the shared risks and treats them as faulty (line 11 and Algorithm 2). In Algorithm 2, if the hit ratio of a shared risk is 1, the risk is included in a candidate risk set (lines 3-7); and then from the set, the shared risks that have the highest coverage ratio values are finally chosen; i.e., a set of shared risks that covers a maximum number of unexplained observations (line 8).
If is not empty, all EPG pairs that have an edge to any shared risk in the are pruned from the model (lines 15-16), and failed EPG pairs (observations) are moved from unexplained to explained (line 17). Finally, all the shared risks in the are added to the hypothesis set, . This process repeats until either there are no more observations left unexplained or when is empty.
Some observations may remain unexplained because the shared risks associated with those observations have a hit ratio less than 1 and thus are not selected during the above candidate selection procedure. To handle the remaining unexplained observations, the Scout algorithm searches logs about changes made to objects (which are obtained from the controller), and selects the objects to which some actions are recently applied (lines 21-24 in Algorithm 1). Despite its simplicity, this heuristic makes huge improvement in accuracy (§VI-B).

Example. Figure 5 shows an example of how the Scout algorithm works. The lines 4-19 in Algorithm 1 cover the following: (i) filter F2 is identified as a candidate because it has the highest coverage ratio among the shared risks with a hit ratio of 1; (ii) all the EPG pairs that depend on F2 are pruned from the model; (iii) and F2 is added to hypothesis. The lines 21-24 ensure that the algorithm adds filter F3 (assuming F3 is lately modified) to the hypothesis since there are no shared risks with a hit ratio of 1.

V Scout System
We present Scout system that can conduct an end-to-end analysis from fault localization of policy objects to physical-level root cause diagnosis. The system mainly consists of (i) fault localization engine and (ii) event correlation engine. The former runs the proposed algorithm in §IV-C and produces policy objects (i.e., hypothesis) that are likely to be responsible for policy violation of EPG pairs. The latter correlates the hypothesis and two system-level logs from the controller and network devices, and produces the most-likely root causes at physical level that caused object failures. Our prototype is written in about 1,000 lines of Python code. We collect the logical network policy model and its change logs from Cisco’s application centric controller, and switch TCAM rules and the device fault logs from Nexus 9000 series switches. Figure 6 illustrates the overall architecture of Scout system.
V-A Physical-level root cause diagnosis
Knowing root causes at a physical level such as control channel disruption, TCAM overflow, bugs, system crashes, etc. is as equally important as fixing failed objects in the network policy. In general, when a trouble ticket is raised, the current practice is to narrow down possible root causes by analyzing system logs such as fault logs from network devices. However, a majority in a myriad of log data is often irrelevant to the caused failure. Filtering out such noises can be done to some extent by correlating the logs with the generation time of the trouble ticket, but not effective enough to reduce search space.
To quickly narrow down the root cause of a failure, we rely on the hypothesis reported by the fault localization algorithm. We inspect only a small set of failures (based on timestamps in fault logs) that are active around the same time when changes are made to the faulty policy objects in the hypothesis.
The event correlation engine shown in Figure 6 is a systematic and automated approach to the above approach. The engine correlates the fault logs from network devices, the change logs from the network policy controller and the hypothesis generated from the fault localization engine. It then infers the most likely physical-level root causes through the correlation.
The engine works in three simple steps: (i) Using the hypothesis, it first identifies a set of change logs that it has to examine; (ii) with the timestamps of those change logs, it then narrows down the relevant faulty logs (those that are logged before the policy changes and keep alive); and (iii) it finally associates impacted policy objects with the fault(s) found in the relevant fault logs and outputs them.
The engine is pre-configured with signatures for known faults (e.g., disconnected switch, TCAM overflow), composed by network admins with their domain knowledge and prior experience. When fault logs match a signature, faults are identified and associated with the impacted policy objects. Otherwise, the objects are tagged with ‘unknown’. Note that signatures can be flexibly added to the engine, and the system’s ability would be naturally enhanced with more signatures.
V-B Example usecases
We explain three realistic use cases in a testbed and demonstrate the workflow of our system and its efficacy on fault localization. For this purpose, we use the network policy for the 3-tier web service shown in Figure 1(a). We mimic a dynamic change of the network policy by continously adding one new filter after another to the Contract:App-DB object. This would eventually cause TCAM overflow. As a second case, we make a switch not respond to the controller in the middle of updates, by silently dropping packets to the switch.
TCAM overflow. Due to TCAM overflow, several filters were not deployed at TCAM. The switch under test generated fault logs that indicate TCAM overflow when its TCAM utilization was beyond a certain level. Our system first localized the faulty filter objects with risk models, correlated them with the change logs for ‘add filter’ instruction, and subsequently the change logs with the fault logs. Our system had the fault signature of TCAM overflow, so it was able to match the fault logs with that signature and tag those failed filters accordingly.
Unresponsive switch. In this use case, the switch under test became unresponsive while the controller was sending the ‘add filter’ instructions to the switch. The equivalence checker reported that the rules associated with some filters are missing. Then, the Scout algorithm localized those filters as faulty objects. Using filter creation times from the change logs and the fault logs that indicate the switch was inactive (both maintained at the controller), the correlation engine was able to detect that filters were created when the switch was inactive.
Too many missing rules. As a variant of the above scenario, we pushed a policy with a large number of policy objects onto the unresponsive switch. We found out that more than 300K missing rules were reported by the equivalence checker. Without fault localization, it is extremely challenging for network admins to correlate and identify the set of underlying objects that are fundamentally responsible for the problem. Scout narrowed it down and reported the unresponsive switch as the root cause behind these huge number of rule misses.
VI Evaluation
We evaluate Scout in terms of (i) suspect set reduction, (ii) accuracy, and (iii) scalability. We mean by suspect set reduction a ratio, between the size of hypothesis (a set of objects reported by Scout) and the number of all objects that failed EPG pairs rely on; the smaller the ratio is, the less objects network admins should examine. As for accuracy, we use precision () and recall () where is hypothesis and is a set for ground truth. A higher precision means fewer false positives and a higher recall means fewer false negatives. Finally, we evaluate scalability via measuring running times across different network sizes.
VI-A Evaluation environment
Setup. We conduct our evaluation under two settings.
Simulation: We build our simulation setup with network policies used in our production cluster that comprises about 30 switches and 100s of servers. The cluster dataset contains 6 VRFs, 615 EPGs, 386 contracts, and 160 filters.
Testbed: We build a network policy that consists of 36 EPGs, 24 contracts, 9 filters, and 100 EPG pairs, based on the statistics of the number of EPGs and their dependency on other policy objects obtained from the above cluster dataset.
Fault injection. We define two types of faults that cause inconsistency between network policy and switch TCAM rules. (i) Full object fault means that all TCAM rules associated with an object are missing. (ii) Partial object fault is a fault that makes some of the EPG pairs that depend on an object fail to communicate. That is, some TCAM rules associated with the object are missing. For both simulation and experiment, we randomly generate the two types of faults with equal weight.


VI-B Results
Suspect set reduction. We first compare the size of hypothesis with the number of policy objects (a suspect set) that EPG pairs in failure depend on. We use the metric defined earlier for this comparison. Figure 7 shows the suspect set reduction ratio in the simulation and testbed. We generate 1,500 faults of object in the simulation and 200 faults of object in the testbed; for each object fault, we compute the total number of objects, that the EPG pairs impacted by the faulty object depend on. From the figure, we see is less than 0.08 in most cases. Scout reports at maximum 10 policy objects in the hypothesis whereas without fault localization there are as many as a thousand policy objects to suspect. This smaller value means that network admins need to examine a relatively small number of objects to fix inconsistencies between a network policy and deployed TCAM rules. Therefore, Scout can greatly help reduce repair time and necessary human resources.
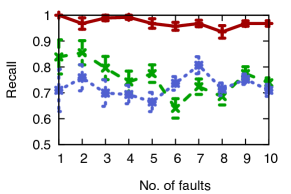
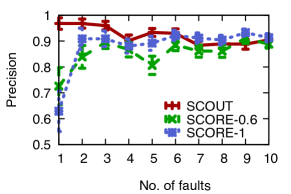
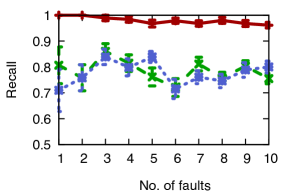
Accuracy. While it is great that Scout produces a handful of objects that require investigation, a more important aspect is that the hypothesis should contain more number of truly faulty objects and less number of non-faulty objects. We study this using precision and recall. In addition, we compare Scout’s accuracy with SCORE’s. We use two different error threshold values for SCORE to see if changing parameters would help improve its accuracy.
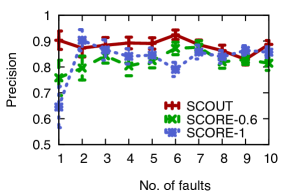
Figures 8(a) and 8(b) show recall and precision of fault localization with multiple number of simultaneous faulty objects (x-axis) in the switch risk model. From the figures, we observe Scout’s recall is 20-30% better than SCORE’s without any compromise on precision. The error threshold values make little change in the performance of SCORE. Also, the high recall of Scout suggests that Scout can always find most faulty objects. Moreover, high precision (close to 0.9) suggests fewer false positives. For instance, with 10 faulty objects in the network policy, Scout reports on average one additional object as faulty. In Figures 9(a) and 9(b) we observe similar trends for the controller risk model.
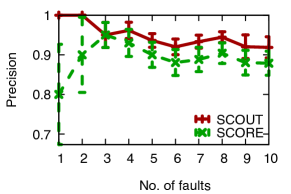
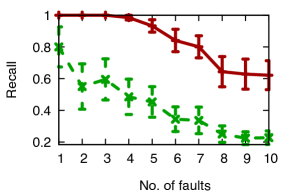
Figures 10(a) and 10(b) compare the accuracy of Scout and SCORE with up to 10 simultaneous faults in the testbed. SCORE’s error threshold is set to 1. From the figures, we observe Scout’s recall is much better (20-50%) than SCORE’s while its precision is comparable to SCORE’s. Scout detects all faulty objects when there are less than four faults, i.e., with 100% recall and about 98% precision. When there are five or more faults, Scout’s accuracy (especially, recall) begins to decrease. The difference in accuracy between the simulation and testbed setup is mainly because of a low degree of risk sharing among EPG pairs in the testbed, when compared to the simulation dataset obtained from the production cluster.
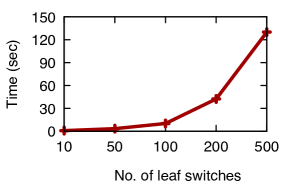
Scalability. We measure running time of Scout under a controller risk model from the network policy deployed in 10 switches in the production cluster. We scale the model up to 500 switches by adding new EPG and switch pairs. As shown in Figure 11, we observe that Scout takes about 45 and 130 seconds with 200 and 500 switches respectively, on a machine with a 4-core 2.6 GHz CPU and 16GB memory.
VII Related work
A large body of research work has been conducted for network fault localization [8, 13, 14, 15, 16, 17, 18, 19, 20]. Most of them focus on failures involving physical components such as fibre-optic cable disruption, interface down, system crash, etc. Our work focuses on fault localization of the network policy configuration process rather than that of low-level physical components. Thus, the context of our work is quite different from that of these prior works.
A number of recent approaches [21, 22, 23, 24, 25, 26, 27, 11] enable data plane debugging. Some of them [21, 26, 11] collect debugging information by installating low-level rules in the network switch either dynamically or statically. PathQuery [21] executes SQL-like queries on switches while storing the query state in the packet header. PathDump [26] needs a small set of flow rules to embed path information into packet header. Everflow [11] installs rules for selectively mirroring the packets. In contrast, Scout system does not install low-level rules to collect debugging information. Instead, it relies on already available policy change logs at the controller and failure logs at network switches.
Network provenance systems [28, 29] keep track of events associated with packets and rules while Scout only compares network policies with actual rules deployed in the network.
Systems like Anteater [25], Veriflow [24], and Header Space Analysis [27] check for violation of invariants in network policies on a data plane snapshot. The snapshot includes ACLs and forwarding rules. In particular, Anteater shares some similarity with the equivalence checker used by Scout in that both of them require access to TCAM rules. Unlike these systems, Scout focuses on localizing the part of the policy that is not deployed correctly. Overall, Scout compliments such approaches as it assists debugging in management plane via fault localization.
Other works [1, 3, 4, 5, 2, 30, 31, 32] focus on the automation of conflict-free, error-free composition and deployment of network policies to reduce the likelihood of network problem occurrences. While these frameworks are greatly useful in managing network policies, it is hard to completely shield their management plane from failures, which may cause the inconsistency between the policies and the actual network state. Scout can identify the impacted network policies. Thus, Scout can be useful in reinstating the network policies when these frameworks may not work correctly.
VIII Conclusion
Network policy abstraction enables flexible and intuitive policy management. However it also makes network troubleshooting prohibitively hard when network policies are not deployed as expected. In this paper we introduced and solved a network policy fault localization problem where the goal is to identify faulty policy objects that have low-level rules go missing from network devices and thus are responsible for network outages and policy violations. We formulated the problem with risks models and proposed a greedy algorithm that accurately pinpoints faulty policy objects and built Scout, an end-to-end system that automatically pinpoints not only faulty policy objects but also physical-level failures.
References
- [1] C. Prakash, J. Lee, Y. Turner, J.-M. Kang, A. Akella, S. Banerjee, C. Clark, Y. Ma, P. Sharma, and Y. Zhang, “PGA: Using Graphs to Express and Automatically Reconcile Network Policies,” in ACM SIGCOMM, 2015.
- [2] R. Soulé, S. Basu, P. J. Marandi, F. Pedone, R. Kleinberg, E. G. Sirer, and N. Foster, “Merlin: A Language for Provisioning Network Resources,” in ACM CoNEXT, 2014.
- [3] “Cisco Application Centric Infrastructure,” https://goo.gl/WQYqnv, 2017.
- [4] N. Foster, R. Harrison, M. J. Freedman, C. Monsanto, J. Rexford, A. Story, and D. Walker, “Frenetic: A Network Programming Language,” in ACM ICFP, 2011.
- [5] C. Monsanto, J. Reich, N. Foster, J. Rexford, and D. Walker, “Composing Software-defined Networks,” in USENIX NSDI, 2013.
- [6] A. Voellmy, J. Wang, Y. R. Yang, B. Ford, and P. Hudak, “MAPLE: Simplifying SDN Programming Using Algorithmic Policies,” in ACM SIGCOMM, 2013.
- [7] “OpenDaylight Group Policy,” https://wiki.opendaylight.org/view/Group_Policy:Main.
- [8] R. R. Kompella, J. Yates, A. Greenberg, and A. C. Snoeren, “Fault localization via risk modeling,” IEEE Transactions on Dependable and Secure Computing, vol. 7, no. 4, pp. 396–409, 2010.
- [9] “OpFlex: An Open Policy Protocol,” https://tinyurl.com/yabacsdj.
- [10] D. S. Johnson, “Approximation algorithms for combinatorial problems,” Journal of computer and system sciences, vol. 9, no. 3, pp. 256–278, 1974.
- [11] Y. Zhu, N. Kang, J. Cao, A. Greenberg, G. Lu, R. Mahajan, D. Maltz, L. Yuan, M. Zhang, B. Y. Zhao, and H. Zheng, “Packet-Level Telemetry in Large Datacenter Networks,” in ACM SIGCOMM, 2015.
- [12] Z. Yin, M. Caesar, and Y. Zhou, “Towards understanding bugs in open source router software,” SIGCOMM CCR, vol. 40, no. 3, 2010.
- [13] S. Kandula, D. Katabi, and J.-P. Vasseur, “Shrink: A tool for failure diagnosis in ip networks,” in ACM SIGCOMM workshop on Mining network data, 2005.
- [14] P. Bahl, R. Chandra, A. Greenberg, S. Kandula, D. A. Maltz, and M. Zhang, “Towards highly reliable enterprise network services via inference of multi-level dependencies,” in ACM SIGCOMM, 2007.
- [15] R. N. Mysore, R. Mahajan, A. Vahdat, and G. Varghese, “Gestalt: Fast, Unified Fault Localization for Networked Systems,” in USENIX ATC, 2014.
- [16] A. Dhamdhere, R. Teixeira, C. Dovrolis, and C. Diot, “NetDiagnoser: Troubleshooting Network Unreachabilities Using End-to-end Probes and Routing Data,” in ACM CoNEXT, 2007.
- [17] S. Kandula, R. Mahajan, P. Verkaik, S. Agarwal, J. Padhye, and P. Bahl, “Detailed Diagnosis in Enterprise Networks,” in ACM SIGCOMM, 2009.
- [18] R. R. Kompella, J. Yates, A. Greenberg, and A. C. Snoeren, “Detection and localization of network black holes,” in IEEE INFOCOM, 2007.
- [19] M. Steinder and A. S. Sethi, “Probabilistic Fault Localization in Communication Systems Using Belief Networks,” IEEE/ACM ToN, vol. 12, no. 5, 2004.
- [20] ——, “A survey of fault localization techniques in computer networks,” Science of Computer Programming, vol. 53, no. 2, pp. 165–194, 2004.
- [21] S. Narayana, M. Tahmasbi, J. Rexford, and D. Walker, “Compiling Path Queries,” in USENIX NSDI, 2016.
- [22] N. Handigol, B. Heller, V. Jeyakumar, D. Mazières, and N. McKeown, “I Know What Your Packet Did Last Hop: Using Packet Histories to Troubleshoot Networks,” in USENIX NSDI, 2014.
- [23] P. Kazemian, M. Chang, H. Zeng, G. Varghese, N. McKeown, and S. Whyte, “Real Time Network Policy Checking Using Header Space Analysis,” in USENIX NSDI, 2013.
- [24] A. Khurshid, X. Zou, W. Zhou, M. Caesar, and P. B. Godfrey, “VeriFlow: Verifying Network-Wide Invariants in Real Time,” in USENIX NSDI, 2013.
- [25] H. Mai, A. Khurshid, R. Agarwal, M. Caesar, P. B. Godfrey, and S. T. King, “Debugging the Data Plane with Anteater,” in ACM SIGCOMM, 2011.
- [26] P. Tammana, R. Agarwal, and M. Lee, “Simplifying Datacenter Network Debugging with Pathdump,” in USENIX OSDI, 2016.
- [27] P. Kazemian, G. Varghese, and N. McKeown, “Header Space Analysis: Static Checking for Networks,” in USENIX NSDI, 2012.
- [28] W. Zhou, M. Sherr, T. Tao, X. Li, B. T. Loo, and Y. Mao, “Efficient Querying and Maintenance of Network Provenance at Internet-scale,” in ACM SIGMOD, 2010.
- [29] A. Chen, Y. Wu, A. Haeberlen, W. Zhou, and B. T. Loo, “The Good, the Bad, and the Differences: Better Network Diagnostics with Differential Provenance,” in ACM SIGCOMM, 2016.
- [30] A. D. Ferguson, A. Guha, C. Liang, R. Fonseca, and S. Krishnamurthi, “Participatory networking: An api for application control of sdns,” in ACM SIGCOMM, 2013.
- [31] N. Kang, Z. Liu, J. Rexford, and D. Walker, “Optimizing the "one big switch" abstraction in software-defined networks,” in ACM CoNEXT, 2013.
- [32] L. Ryzhyk, N. Bjørner, M. Canini, J.-B. Jeannin, C. Schlesinger, D. B. Terry, and G. Varghese, “Correct by construction networks using stepwise refinement,” in USENIX NSDI, 2017.
