Doping-induced redistribution of magnetic spectral weight
in substituted hexaborides CeLaxB and CeNdxB
Abstract
We investigate the doping-induced changes in the electronic structure of CeB6 on a series of substituted CeB6 samples ( = La, Nd) using diffuse neutron scattering. We observe a redistribution of magnetic spectral weight across the Brillouin zone, which we associate with the changes in the Fermi-surface nesting properties related to the modified charge carrier concentration. In particular, a strong diffuse peak at the corner of the Brillouin zone ( point), which coincides with the propagation vector of the elusive antiferroquadrupolar (AFQ) order in CeB6, is rapidly suppressed by both La and Nd doping, like the AFQ order itself. The corresponding spectral weight is transferred to the point, ultimately stabilizing a long-range AFM order at this wave vector at the Nd-rich side of the phase diagram. At an intermediate Nd concentration, a broad diffuse peak with multiple local maxima of intensity is observed around the point, evidencing itinerant frustration that gives rise to multiple ordered phases for which Ce1-xNdxB6 is known. On the La-rich side of the phase diagram, however, dilution of the magnetic moments prevents the formation of a similar -type order despite the presence of nesting. Our results demonstrate how diffuse neutron scattering can be used to probe the nesting vectors in complex -electron systems directly, without reference to the single-particle band structure, and emphasize the role of Fermi surface geometry in stabilizing magnetic order in rare-earth hexaborides.
pacs:
71.27.+a, 75.20.Hr, 75.30.Kz, 75.40.Gb, 78.70.NxI Introduction
Although knowing the electronic structure plays a crucial role for understanding macroscopic properties of any crystalline material, there are very few experimental techniques that can be used to probe it. Standard macroscopic measurements that are usually used for reconstruction of the Fermi-surface geometry are quantum oscillations (de Haas – van Alphen and Shubnikov – de Haas effects), but both of them require very high purity of samples with a long mean free path, which is difficult to achieve for nonstoichiometric chemical compositions, and high magnetic fields, which may significantly change the electronic structure itself in the case of materials with strong spin-orbit coupling or superconductors. In addition, the resulting information is limited to the areas of extremal electron orbits and is therefore insufficient to extract precise values of Fermi momenta. A more direct source of information about Fermi surface geometry is angle-resolved photoelectron spectroscopy (ARPES), which is able to probe the 4-dimensional (, , and ) electronic structure, but in turn, this technique is very sensitive to the quality of the sample surface and has poor resolution along the momentum axis perpendicular to the cleavage plane. This limits its applicability to materials with highly 3-dimensional (3D) band structures. Extraction of Fermi-surface nesting vectors from ARPES data is possible and has been successful in many earlier works Straub et al. (1999); Schäfer et al. (2003); Inosov et al. (2008); Terashima et al. (2009); Evtushinsky et al. (2010); He et al. (2011); Inosov et al. (2009); Koitzsch et al. (2016), but it usually relies on a technically demanding fit of the whole low-energy band structure to a tight-binding model with a consequent momentum integration to extract the peaks in a two-particle correlation function. This method is, therefore, indirect.
A handful of earlier works on magnetic heavy-fermion metals, where conduction electrons are involved in the formation of magnetic order, suggest that the low-energy dynamic spin susceptibility , measured with diffuse neutron scattering, provides direct information about the nesting vectors Inosov et al. (2009); Koitzsch et al. (2016); Sinha et al. (1981); Aeppli et al. (1986); Stockert et al. (2004); Kadowaki et al. (2004); Wiebe et al. (2007); Stock et al. (2012); Portnichenko et al. (2015); Butch et al. (2015). Due to the bulk sensitivity of neutron scattering, it therefore serves as a complementary method for probing the 3D electronic structure. In this paper, we apply this method to probe the evolution of the electronic properties of cerium hexaboride, CeB, upon La and Nd substitutions and discuss the changes in its Fermi-surface nesting properties that correlate with the appearance of different ordered phases in the magnetic phase diagram.
Heavy-fermion compounds are a class of correlated -electron materials, which continue to attract close attention despite decades of intense investigations due to a number of intriguing physical phenomena, such as unconventional superconductivity Steglich et al. (1984); Schlabitz et al. (1986); Zhang and Shelton (2000); Pfleiderer (2009); Stewart (2017), quantum criticality Si and Steglich (2010); Stockert and Steglich (2011), and multipolar ordered phases Sakai et al. (2005); Nagao and Igarashi (2006); Santini et al. (2009); Paschen and Larrea (2014); Portnichenko et al. (2016). A model example of intriguing heavy-fermion physics is CeB, which exhibits a very complex magnetic phase diagram and a rich spectrum of excitations, indicating a delicate balance between different microscopic interactions despite very simple crystal and electronic structures Effantin et al. (1985); Sluchanko et al. (2007); Cameron et al. (2016). Zero-field phase diagram of CeB consists of a complex double- antiferromagnetic (AFM) phase below K Zaharko et al. (2003) and the so-called “hidden order” phase II between and K, which results from a G-type antiferroquadrupolar (AFQ) ordering of the and quadrupolar moments of Ce3+ ions Kusunose (2008); Sakai et al. (1997); Shiina et al. (1997, 1998); Sera and Kobayashi (1999). Most recently, an additional crossover was found in the behavior of the anisotropic magnetoresistance inside phase II, separating this phase into two regions characterized by opposite signs of the resistance anisotropy with respect to the field direction Demishev et al. (2017). In contrast to the spectrum of a conventional antiferromagnet with Goldstone modes stemming from magnetic Bragg peaks, the excitation spectrum of CeB contains several novel features, such as a resonant mode at the point Friemel et al. (2012), which corresponds to the propagation vector of the AFQ phase, and an intense ferromagnetic (FM) excitation with a parabolic dispersion at the point Jang et al. (2014).
Generally, in heavy-fermion materials, isovalent substitution of magnetic ions with non-magnetic ones leads to a crossover from a coherent Kondo lattice to the dilute Kondo impurity regime, as it was shown for CeLaxCu Ōnuki et al. (1985); Sumiyama et al. (1986); Kato et al. (1987); Satoh et al. (1989). Lanthanum doping of CeB suppresses both AFM and AFQ phases and induces a new multipolar-ordered phase IV beyond a quantum critical point (QCP) at , presumably of octupolar character Lovesey et al. (2007); Kuwahara et al. (2007, 2009). Non-Fermi-liquid behavior has been observed in the vicinity of the QCP Nakamura et al. (2006), and a recent specific-heat investigation of substituted CeLaxB emphasizes the importance of multipolar fluctuations that are directly linked to the effective mass of charge carriers Jang et al. (2017). However, the nature of the ordered multipoles in phase IV, as well as the underlying interactions Shiba et al. (1999, 2000); Hanzawa and Takasaki (2002); Hanzawa (2004); Sakurai and Kuramoto (2005), are still a matter of debate.
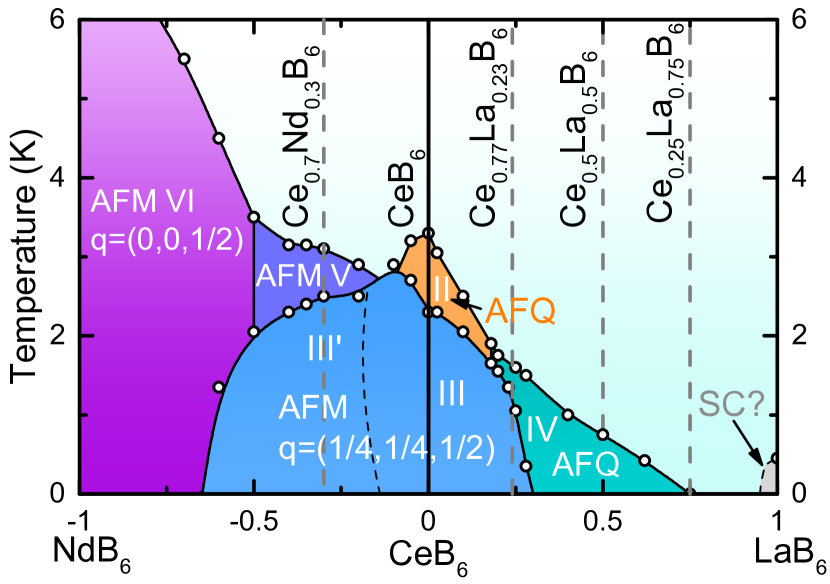
A substitution of Ce3+ with other magnetic rare-earth ions, like Pr3+ or Nd3+, significantly enriches the phase diagram Kondo et al. (2007); Kishimoto et al. (2005); Kobayashi et al. (2003); Yoshino et al. (2004); Mignot et al. (2009); Matsumura et al. (2014a). In the simplest case of Nd doping, even a rather low Nd concentration of 0.1 suppresses the AFQ phase at zero field, makes the AFM propagation vector of phase III slightly incommensurate, and creates a new AFM phase V. At , the order finally changes to conventional AFM stacking of FM layers with the ordering wave vector , like in the pure NdB6 Kobayashi et al. (2003); Yoshino et al. (2004); Mignot et al. (2009). The zero-field magnetic phase diagram of both CeLaxB and CeNdxB is summarized in Fig. I.
Investigations of the electronic structure of light rare-earth hexaborides have shown that the shape of the Fermi-surface, effective mass of charge carriers, and the number of conduction electrons per unit cell are very similar for both NdB6 and LaB6, due to a strong localization of electrons in NdB6 Onuki et al. (1989); Arko et al. (1976). On the other hand, hybridization of Ce electrons with the conduction band qualitatively modifies the Fermi surface of CeB as compared to LaB6 Neupane et al. (2015). Therefore, both La and Nd doping of CeB do not simply change the number or magnitude of localized magnetic moments, but also induce an effective hole doping, decreasing the number of conduction electrons and modifying the Fermi surface geometry.
In a recent work Koitzsch et al. (2016), some of us have investigated electronic structure of pure CeB using both ARPES and inelastic neutron scattering (INS). We observed strong spectral intensity at the points, which correspond to the propagation vectors of the AFQ and AFM phases, and additional intensity maxima at the and points. Our analysis of the ARPES data has shown that both order parameters of AFM and AFQ phases are dictated by nesting instabilities of the Fermi surface, and therefore electronic and magnetic structures of CeB are closely connected with each other. In this paper, we extend this approach to a series of La and Nd substituted CeB6 solid solutions and use INS to uniformly cover the phase diagram shown in Fig. I in order to demonstrate that the doping-induced changes in the nesting properties of the Fermi surface correlate with the changes of the ordered phases for compounds with various substitution levels.
II Experimental results
II.1 Details of the experiments
In this work we used single crystals of CeLaxB () and CeNdB with a typical mass of 3 – 4 g, specially grown using isotope-enriched 11B to minimize neutron absorption, as described elsewhere Friemel et al. (2012). The crystal structure is cubic, with a lattice constant of 4.14 Å for pure CeB6, and belongs to the space group. For thermodynamic measurements of CeNdB we used small pieces of the same single crystal that was used for INS measurements, cut along . Specific heat and magnetization of CeNdB were measured using the physical-property measurement system PPMS-6000 and the vibrating-sample magnetometer MPMS3-VSM, respectively.
For neutron scattering measurements, we oriented all samples with their crystal axes perpendicular to the scattering plane in order to have access to all high-symmetry directions in the plane. INS measurements of the parent compound CeB were performed using the cold-neutron time-of-flight spectrometer IN5 Ollivier and Mutka (2011) at the high-flux research reactor of the Institute Laue-Langevin (ILL) at a temperature of K, just above . The incident neutron wavelength was fixed at 5 Å ( meV), which corresponds to an energy resolution (full width at half maximum) of meV at zero energy transfer.
Measurements of substituted samples were performed using the MACS spectrometer at NIST Rodriguez et al. (2008). The measurement temperature was fixed just above for each sample. The MACS spectrometer operates a system of multiple analyzers and detectors that comprise 20 identical channels surrounding the sample. Each channel contains a vertically focusing double-crystal analyzer with two detectors. Such a design implies that one can simultaneously collect data with the given final neutron energy, , for the spectroscopic channel, and without energy selection for the diffraction channel. This allows us to collect energy-integrated data in parallel to any spectroscopic measurement at no extra cost in acquisition time. In our measurements, we fixed the incident neutron energy to 3.2 meV, which implies an energy resolution of meV at the elastic position, and chose an energy transfer of 0.2 meV for the spectroscopic channel to map out the diffuse quasielastic magnetic scattering (QEMS) intensity just above the incoherent elastic line. We used cold Be filters both before and after the sample to suppress higher-order contamination from the monochromator. To distinguish the diffuse magnetic signal from nonmagnetic background scattering on the sample and cryogenic environment, we mapped out the same area in momentum space at an elevated temperature of K for La-doped or at K for Nd-doped samples. According to earlier measurements Friemel et al. (2012), the quasielastic signal is suppressed at this temperature below the detection limit, so by using the high-temperature datasets as background, we could obtain clean momentum-space distributions of the magnetic intensity by subtraction. The data were analyzed and symmetrized using Dave Azuah et al. (2009) and Horace Ewings et al. (2016) software.
II.2 Magnetic phase diagram of CeNdB
The La-substituted cerium hexaborides CeLaxB have been a subject of active research for a long time Cameron et al. (2016); Sera et al. (1987); Tomita and Kunii (1992); Tayama et al. (1997); i. Kobayashi et al. (2000); Nakamura et al. (2006); Nagao and Igarashi (2006); Schenck et al. (2007); Lovesey et al. (2007); Kuwahara et al. (2007); Kondo et al. (2007); Kuwahara et al. (2009); Kunimori et al. (2010); Anisimov et al. (2013); Matsumura et al. (2014b); Friemel et al. (2015); Jang et al. (2017), and complete characterization of all La substituted CeLaxB single crystals, which we used in this work, was already done previously Friemel et al. (2015); Jang et al. (2017). However, there have been only very few works devoted to the magnetic phase diagrams of Nd-substituted CeNdxB Mignot et al. (2009); Kobayashi et al. (2003); Yoshino et al. (2004). We therefore start with a detailed investigation of the magnetic phase diagram of our sample, CeNdB, using specific heat and magnetization measurements.
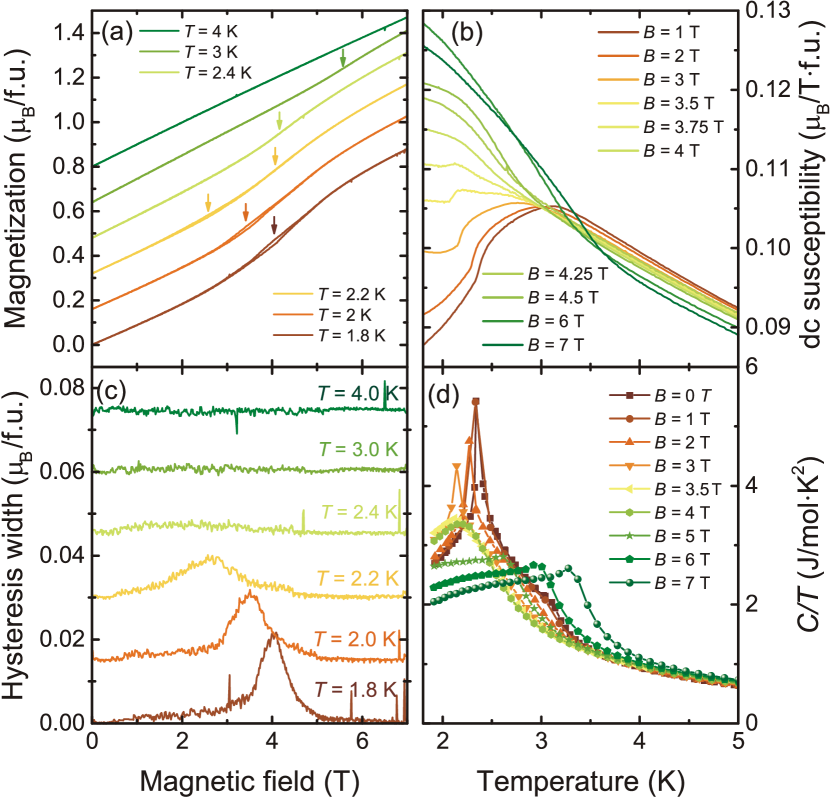
Figure II.2 shows a summary of thermodynamic data which we used to reconstruct the magnetic-field – temperature phase diagram of CeNdB. First of all, let us consider magnetic-field dependencies of magnetization measured up to T, which are shown in Fig. II.2 (a). High-temperature ( K) magnetization is exactly linear in the whole available field range, and a small change of slope appears at high fields, when sample is cooled down below K. This critical field decreases with temperature, and below K, we observe a hysteresis, which indicates a first-order phase transition from the AFQ phase II to the AFM phase III, consistently with previously published results on Ce0.8Nd0.2B6 Yoshino et al. (2004). Field dependencies of the hysteresis width, calculated by subtraction , are shown in Fig. II.2 (c), and one can see that below K, upon decreasing temperature, the maximum of the hysteresis shifts to higher fields and increases in amplitude.
Temperature dependencies of the DC magnetic susceptibility are shown in Fig. II.2 (b). First of all, we discuss the low-field curves, T. One can clearly see a well pronounced maximum at K upon entering the phase V and a kink at K, which corresponds to the III–V phase boundary. Increasing the magnetic field smears out this behaviour, and one can see almost constant dependencies for T. The high-field phase was previously identified as the AFQ phase II Yoshino et al. (2004), and we extracted the boundary as a locus of minima in the curves.
Similar features have been observed in the specific-heat measurements shown in Fig. II.2 (d). The temperature dependence of the zero-field specific heat consists of a sharp -shape anomaly at K and a small peak at K. Application of magnetic field gradually suppresses both and until at a field T they merge into a single broad peak centered at K, which remains at the same position up to T. At higher fields, we observe a new peak, which corresponds to the I–II phase boundary.
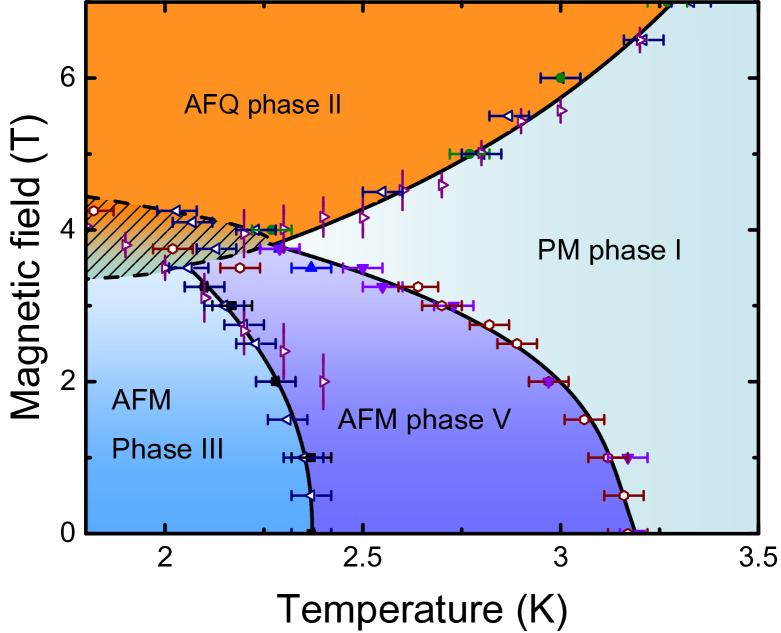
Combining results of specific heat and magnetization measurements, we have reconstructed the magnetic-field – temperature phase diagram of CeNdB, which is shown in Fig. II.2. In spite of the perfect agreement between specific-heat and magnetization data in both high-field and low-field limits, intermediate region around T, where all 3 phase boundaries intersect, is rather ambiguous. Taking into account that the phase transition from the AFM phase III to the field-induced AFQ phase II is first order, we consider that this critical area corresponds to the coexistence of phases II, III and V. Our results are reasonably consistent with previously published phase diagrams of CeNdxB Kobayashi et al. (2003); Yoshino et al. (2004), and here we have presented the magnetic phase diagram for another composition with , which we used in our INS measurements.
II.3 Neutron scattering
In this section we discuss our experimental approach to mapping the QEMS intensity distribution and the results of our INS measurements. The magnetic quasielastic line has its maximum of intensity near zero energy transfer, where strong nonmagnetic background intensity from incoherent scattering on the sample and sample environment is also present. However, the quasielastic line is usually broader than the energy resolution, and therefore can be measured away from the elastic line Robinson (2000). When mapping the dependence of QEMS intensity, one usually chooses a small but nonzero energy transfer to have a compromise between magnetic and incoherent intensity that maximizes the signal-to-noise ratio. This approach has been successfully applied in many earlier studies of -electron compounds Rossat-Mignod et al. (1988); Regnault et al. (1988); Schröder et al. (1998); Stockert et al. (1998); Kadowaki et al. (2004); Stock et al. (2011); Singh et al. (2011); Kimura et al. (2013). Here, because of the specifics of the MACS spectrometer that always measures energy-integrated scattering in parallel to the spectroscopic measurements, we had a possibility to compare this method to the brute-force subtraction of the signals measured in the diffraction channel during the same acquisition time.
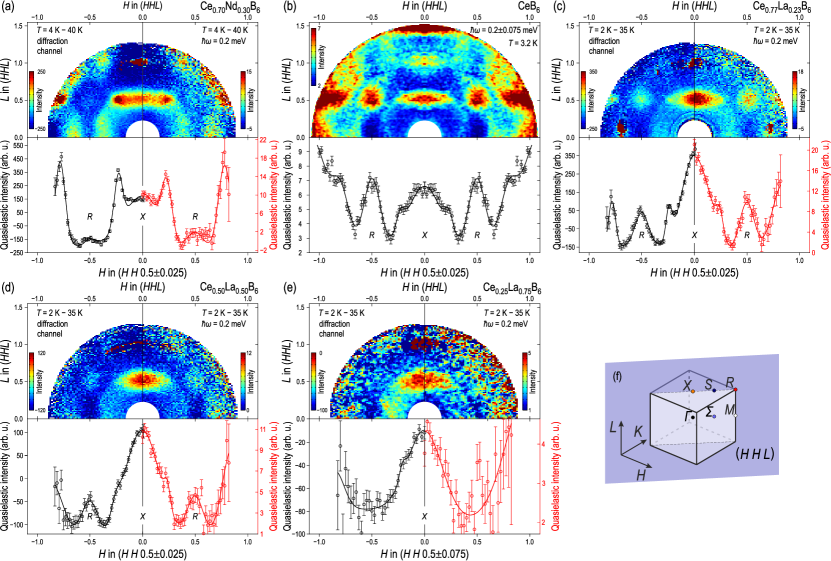
The main results of our neutron-scattering measurements are presented in Fig. II.2. Sample compositions are shown above the corresponding panels. The top part of every panel shows QEMS intensity distributions in the scattering plane as a color map. The bottom parts show one-dimensional cuts taken through these slices along the line in the reciprocal space. Figures II.2 (a,c–e) show background-subtracted data, measured at the MACS spectrometer on CeNdB and CeLaxB as described above. Every color map is split into the left and right parts to show the data obtained in the diffraction (energy-integrated) and spectroscopic ( meV) channels. However, because pure CeB was measured earlier at the IN5 spectrometer without high-temperature background, Fig. II.2 (b) shows only a symmetrized QEMS signal at a finite energy transfer, integrated in the meV energy window without background subtraction.
First of all, let us discuss the QEMS map measured on the pure CeB [Fig. II.2(b)]. For a simple antiferromagnet, just above , one would expect smeared QEMS intensity concentrated around the AFM wavevectors. However, CeB shows a very different picture. A lot of magnetic spectral weight is concentrated at the and points, which correspond to the propagation vector of the AFQ phase and the unconventional FM mode, respectively. Also, one can see a large elliptical hump around the -point that connects additional weaker peaks at the AFM wavevectors , seen as a central maximum with two shoulders at the bottom of Fig. II.2 (b).
La substitution strongly suppresses the inelastic-scattering intensity at the zone center and at the AFM wavevectors and , so that it can be recognized in the QEMS maps only for the pure CeB and Ce0.77La0.23B6 compounds. Remarkably, the peak at the point can be clearly seen up to a rather high La concentration of and gets completely suppressed only in the most diluted Ce0.25La0.75B6 sample. All the spectral weight is accumulated at the point, where the intensity (per mole Ce) goes up with increasing La concentration. In highly La-diluted samples, the elliptical feature at the point dominates the QEMS intensity distribution.
Now we turn to the discussion of the Nd-substituted compound. As known from the literature Mignot et al. (2009), pure NdB6 develops AFM order with the propagation vector , which coincides with the point. This order persists in the magnetic phase diagram of CeNdB up to (see Fig. I). Knowing that both La and Nd substitutions lead to an effective hole doping and should therefore cause similar changes of the Fermi surface, it is natural to expect a strong rise of intensity at the point with simultaneous suppression of excitations at the and points also in CeNdxB. At high Nd concentrations, the peak at the point would represent critical paramagnon fluctuations of phase VI above , whereas on the La-rich side of the phase diagram similar fluctuations are also present, but never condense into a long-range magnetically ordered phase because of the strong dilution of the moments Koitzsch et al. (2016). We are therefore interested in looking at an intermediate Nd concentration, shortly before reaching the phase VI, to see if the spectral-weight transfer to the point takes place in a similar fashion as on the La-doped side. Figure II.2 (a) shows the QEMS intensity maps measured on CeNdB. Indeed, one can see a strong reduction of magnetic intensity at the point, which is consistent with the rapid suppression of the AFQ phase by Nd. Instead, we find a narrow diffuse peak, centered at the point, that connects the strong intensity maxima at the equivalent AFM wavevectors, , and an elongated broad peak extending along . The presence of extended peaks in momentum space with multiple local maxima of QEMS intensity is a signature of itinerant frustration in this system, which can explain the proximity of multiple AFM phases in a small region of the phase diagram.
As the last technical remark, we would like to compare the background-subtracted datasets in Figs. II.2(a,c-e), measured in the diffraction (left) and spectroscopic (right) channels. It is seen that the data measured by both channels look very similar, and the signal-to-noise ratio is somewhat better for the diffraction channel. This came out as a surprise, because the magnetic signal at zero energy transfer is expected to be of approximately the same amplitude as at 0.2 meV Jang et al. (2014), whereas the background level at the elastic position is higher by a factor of 250. However, because the diffraction channel is not restricted to elastic scattering, but integrates over all neutron energies that do not fulfill the Bragg condition on the analyzer, the amplitude of the magnetic signal is enhanced due to the broad width of the quasielastic Lorentzian peak as compared to the elastic line. Hence, our results imply that the magnetic intensity in the diffraction channel is strongly dominated by inelastic scattering, whereas the background comes predominantly from the incoherent elastic line.
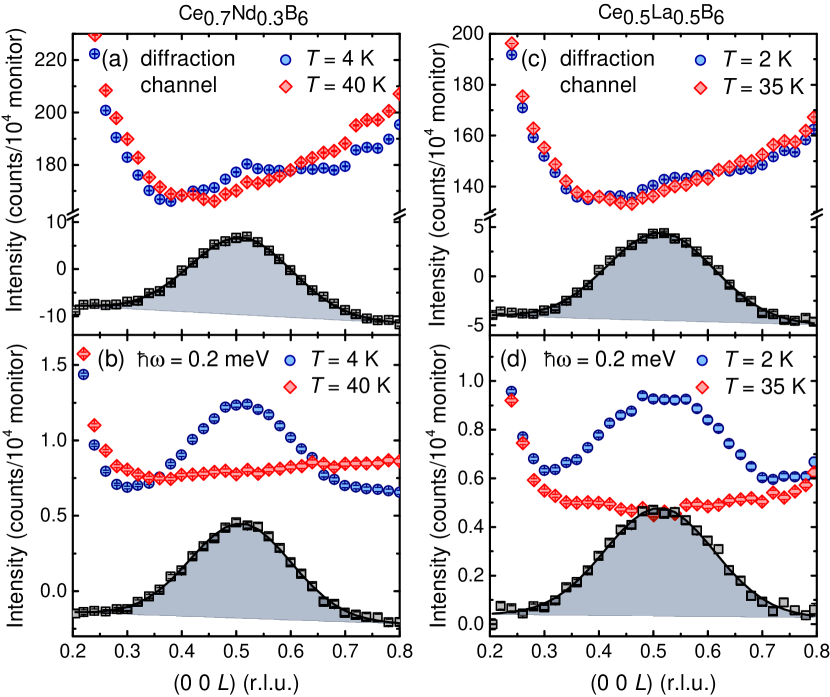
To put this discussion on a more quantitative ground, in Fig. II.3 we show intensity profiles for two of our samples, with 30% Nd and 50% La doping, obtained by integrating the data in the diffraction (top) and spectroscopic (bottom) channels within . We see that the diffuse magnetic peak at the point is clearly seen in the spectroscopic channel already in the raw data, with an amplitude of 0.5–0.6 units on top of a similarly intense background. In the diffraction channel, the peak can be barely recognized in the raw data on top of the huge background, but the subtraction shows that its amplitude is increased to 16 and 9 for the Nd- and La-doped samples. At the same time, the background at the peak position is increased to 170 and 140, respectively. However, the corresponding signal-to-noise ratios, which we estimate as the peak amplitude divided by the statistical standard deviation of the count rate near the peak maximum in the background-subtracted data, are 50 for the diffraction channel and 32 for the spectroscopic channel. In other words, in spite of the high background level, the diffraction channel provides a signal with a 1.5 times better signal-to-noise ratio. This would hold for any sample with a similarly low incoherent scattering cross-section and approximately the same quasielastic line width as those of CeB6. The good agreement between the signals in both channels confirms that the spectral shape of the quasielastic line is independent of and can be described by a quasielastic Lorentzian function with a single energy width for every given temperature and doping level. We expect that setting the spectroscopic channel to zero energy transfer could improve the signal-to-noise ratio in the diffraction channel even further, as the analyzer would then act as a band-stop filter for the incoherent elastic line. We suggest this as a possible method for an effective momentum-space mapping of QEMS intensity using the MACS spectrometer, which could be especially useful for dilute samples with weak magnetism.
III Discussion and conclusions
Before we start the discussion of our results, we would like to recall some experimental facts concerning the electronic structures of light rare-earth hexaborides. Previously we already argued that the propagation vectors of both AFM and AFQ phases in pure CeB are dictated by the nesting properties of its Fermi surface Koitzsch et al. (2016). In nonmagnetic LaB6 and antiferromagnetic NdB6, dHvA measurements found no significant difference in the size of the Fermi surface due to a strong localization of the Nd3+ electrons Onuki et al. (1989); Arko et al. (1976). The stoichiometric NdB6 has an AFM structure (phase VI) with the propagation vector , which persists in CeNdxB about halfway across the phase diagram (see Fig. I). Therefore, even in the CeB parent compound, a remnant diffuse peak in neutron scattering is seen at the point, which we could previously associate with a Fermi-surface nesting vector by a direct comparison with ARPES data Koitzsch et al. (2016). Apparently, hole doping of CeB with either Nd or La enhances the nesting at the point. From the similarity of electronic structures in LaB6 and NdB6, one expects that the dominant nesting vector in nonmagnetic LaB6 should also coincide with the point, even if it can no longer lead to any magnetic order due to the absence of local magnetic moments.
We want to point out that neutron scattering directly probes the imaginary part of the dynamic spin susceptibility . In linear response theory for an electron gas, it is proportional to the Lindhard function χ_q=∑_knF(ϵk+q)-nF(ϵk)ϵk-ϵk+q, where is the dispersion relation for the conduction electrons, and is the Fermi function. On the one hand, the same Lindhard function contains information about Fermi-surface nesting properties, as its real part at is peaked at the nesting vectors and determines the propensity towards Fermi-surface instabilities in charge- or spin-density-wave systems Chan and Heine (1973); Fawcett (1988); Borisenko et al. (2008). On the other hand, it also enters the expression for the oscillatory Ruderman-Kittel-Kasuya-Yosida (RKKY) interaction between localized Kondo spins in metals, which is mediated by the conduction electrons over long distances Ruderman and Kittel (1954); Kasuya (1956); Yafet (1987); Kim et al. (1996); Aristov (1997); Litvinov and Dugaev (1998). Therefore, when localized magnetic impurities are added to a nonmagnetic metal, they tend to develop short-range dynamic correlations that are seen as QEMS scattering in neutron spectroscopy or even lead to a long-range magnetic ordering of the impurity spins Brown et al. (1985); Fretwell et al. (1999). The QEMS intensity can therefore develop maxima at the Fermi-surface nesting vectors in space even in dilute Kondo allows that are far from any ordering instability.
This general principle is nicely demonstrated by our results on the La-diluted CeB, which shows a pronounced QEMS peak at the point. As we follow the evolution of the diffuse magnetic intensity distribution from the CeB parent compound towards the dilute Kondo-impurity limit, we observe a continuous suppression of the critical scattering associated with the AFQ and AFM phases, peaked at the , , and points, whereas the spectral weight at the point gradually accumulates.
On the other hand, substitution of Nd for Ce has a dual effect on the system. First, as already mentioned, it reduces the 4f – 5d hybridization and shrinks the electron-like Fermi surfaces, that is equivalent to an effective hole doping. Second, it introduces large magnetic moments of Nd3+ into the system, increasing its propensity towards magnetic ordering, which is an opposite effect to the nonmagnetic La3+ dilution of the Ce3+ moments. As follows from our results presented in Fig. II.2, the evolution of the Fermi-surface nesting properties in both systems is similar, leading to an enhanced QEMS intensity near the point at the expense of the suppressed peak at the point. However, in contrast to CeLaxB that tends to develop an elusive “hidden order” phase IV, three distinct AFM phases are found in CeNdxB, which compete in the intermediate doping range. The corresponding fluctuations are observed above as extended diffuse peaks with several local maxima at the corresponding wave vectors.
In magnetic insulators, a variety of magnetic phases may arise from the competition among different interactions, such as frustrated Heisenberg exchange, antisymmetric Dzyaloshinskii-Moriya interaction, single-ion anisotropy, compass-type interactions, etc. This is why frustrated magnets usually exhibit complex magnetic phase diagrams in which multiple thermodynamic phases are found in close proximity Rau et al. (2014); Iqbal et al. (2015); Bieri et al. (2016); Tymoshenko et al. (2017); Schmidt and Thalmeier (2017). Our present results indicate that the similarly rich phase diagram of CeNdxB and CeLaxB, which comprises at least two different multipolar phases and a number of AFM phases, could be the result of a similar competition among different Fermi-surface nesting vectors, where the charge-carrier doping and magnetic-moment concentration play the role of tuning parameters. It is natural to describe this situation as a typical example of itinerant frustration. Taking into account the easily accessible temperature and magnetic-field ranges, the CeNdxB compounds provide an excellent playground for future investigations of the interplay between electronic and magnetic degrees of freedom in rare-earth hexaborides.
ACKNOWLEDGMENTS
We thank O. Stockert for discussions and for the critical reading of our manuscript. This work has been funded in part by the German Research Foundation (DFG) under the individual grant IN 209/3-2, through the Research Training Group GRK 1621, and the Collaborative Research Center SFB 1143 (project C03). The first author acknowledges support from the International Max Planck Research School for Chemistry and Physics of Quantum Materials (IMPRS-CPQM). Access to MACS was provided by the Center for High Resolution Neutron Scattering, a partnership between the National Institute of Standards and Technology and the National Science Foundation under Agreement No. DMR-1508249.
References
- Straub et al. (1999) T. Straub, T. Finteis, R. Claessen, P. Steiner, S. Hüfner, P. Blaha, C. S. Oglesby, and E. Bucher, Phys. Rev. Lett. 82, 4504 (1999).
- Schäfer et al. (2003) J. Schäfer, M. Sing, R. Claessen, E. Rotenberg, X. J. Zhou, R. E. Thorne, and S. D. Kevan, Phys. Rev. Lett. 91, 066401 (2003).
- Inosov et al. (2008) D. S. Inosov, V. B. Zabolotnyy, D. V. Evtushinsky, A. A. Kordyuk, B. Büchner, R. Follath, H. Berger, and S. V. Borisenko, New J. Phys. 10, 125027 (2008).
- Terashima et al. (2009) K. Terashima, Y. Sekiba, J. H. Bowen, K. Nakayama, T. Kawahara, T. Sato, P. Richard, Y.-M. Xu, L. J. Li, G. H. Cao, Z.-A. Xu, H. Ding, and T. Takahashi, Proc. Natl. Acad. Sci. 106, 7330 (2009).
- Evtushinsky et al. (2010) D. V. Evtushinsky, D. S. Inosov, G. Urbanik, V. B. Zabolotnyy, R. Schuster, P. Sass, T. Hänke, C. Hess, B. Büchner, R. Follath, P. Reutler, A. Revcolevschi, A. A. Kordyuk, and S. V. Borisenko, Phys. Rev. Lett. 105, 147201 (2010).
- He et al. (2011) R.-H. He, M. Fujita, M. Enoki, M. Hashimoto, S. Iikubo, S.-K. Mo, H. Yao, T. Adachi, Y. Koike, Z. Hussain, Z.-X. Shen, and K. Yamada, Phys. Rev. Lett. 107, 127002 (2011).
- Inosov et al. (2009) D. S. Inosov, D. V. Evtushinsky, A. Koitzsch, V. B. Zabolotnyy, S. V. Borisenko, A. A. Kordyuk, M. Frontzek, M. Loewenhaupt, W. Löser, I. Mazilu, H. Bitterlich, G. Behr, J.-U. Hoffmann, R. Follath, and B. Büchner, Phys. Rev. Lett. 102, 046401 (2009).
- Koitzsch et al. (2016) A. Koitzsch, N. Heming, M. Knupfer, B. Büchner, P. Y. Portnichenko, A. V. Dukhnenko, N. Y. Shitsevalova, V. B. Filipov, L. L. Lev, V. N. Strocov, J. Ollivier, and D. S. Inosov, Nature Commun. 7, 10876 (2016).
- Sinha et al. (1981) S. K. Sinha, G. H. Lander, S. M. Shapiro, and O. Vogt, Phys. Rev. B 23, 4556 (1981).
- Aeppli et al. (1986) G. Aeppli, H. Yoshizawa, Y. Endoh, E. Bucher, J. Hufnagl, Y. Onuki, and T. Komatsubara, Phys. Rev. Lett. 57, 122 (1986).
- Stockert et al. (2004) O. Stockert, E. Faulhaber, G. Zwicknagl, N. Stüßer, H. S. Jeevan, M. Deppe, R. Borth, R. Küchler, M. Loewenhaupt, C. Geibel, and F. Steglich, Phys. Rev. Lett. 92, 136401 (2004).
- Kadowaki et al. (2004) H. Kadowaki, M. Sato, and S. Kawarazaki, Phys. Rev. Lett. 92, 097204 (2004).
- Wiebe et al. (2007) C. R. Wiebe, J. A. Janik, G. J. MacDougall, G. M. Luke, J. D. Garrett, H. D. Zhou, Y.-J. Jo, L. Balicas, Y. Qiu, J. R. D. Copley, Z. Yamani, and W. J. L. Buyers, Nature Phys. 3, 96 (2007).
- Stock et al. (2012) C. Stock, C. Broholm, F. Demmel, J. Van Duijn, J. W. Taylor, H. J. Kang, R. Hu, and C. Petrovic, Phys. Rev. Lett. 109, 127201 (2012).
- Portnichenko et al. (2015) P. Y. Portnichenko, A. S. Cameron, M. A. Surmach, P. P. Deen, S. Paschen, A. Prokofiev, J.-M. Mignot, A. M. Strydom, M. T. F. Telling, A. Podlesnyak, and D. S. Inosov, Phys. Rev. B 91, 094412 (2015).
- Butch et al. (2015) N. P. Butch, M. E. Manley, J. R. Jeffries, M. Janoschek, K. Huang, M. B. Maple, A. H. Said, B. M. Leu, and J. W. Lynn, Phys. Rev. B 91, 035128 (2015).
- Steglich et al. (1984) F. Steglich, C. D. Bredl, W. Lieke, U. Rauchschwalbe, and G. Sparn, Physica B+C 126, 82 (1984).
- Schlabitz et al. (1986) W. Schlabitz, J. Baumann, B. Pollit, U. Rauchschwalbe, H. M. Mayer, U. Ahlheim, and C. D. Bredl, in Ten Years of Superconductivity: 1980–1990 (Springer, 1986) pp. 89–95.
- Zhang and Shelton (2000) L. Zhang and R. N. Shelton, in Magnetism in Heavy Fermion Systems, edited by H. B. Radousky (World Scientific, Singapore, 2000) Chap. 2, pp. 11–146.
- Pfleiderer (2009) C. Pfleiderer, Rev. Mod. Phys. 81, 1551 (2009).
- Stewart (2017) G. R. Stewart, Adv. Phys. 66, 75 (2017).
- Si and Steglich (2010) Q. Si and F. Steglich, Science 329, 1161 (2010).
- Stockert and Steglich (2011) O. Stockert and F. Steglich, Annu. Rev. Condens. Matter Phys. 2, 79 (2011).
- Sakai et al. (2005) O. Sakai, R. Shiina, and H. Shiba, J. Phys. Soc. Jpn. 74, 457 (2005).
- Nagao and Igarashi (2006) T. Nagao and J.-i. Igarashi, Phys. Rev. B 74, 104404 (2006).
- Santini et al. (2009) P. Santini, S. Carretta, G. Amoretti, R. Caciuffo, N. Magnani, and G. H. Lander, Rev. Mod. Phys. 81, 807 (2009).
- Paschen and Larrea (2014) S. Paschen and J. Larrea, J. Phys. Soc. Jpn. 83, 061004 (2014).
- Portnichenko et al. (2016) P. Y. Portnichenko, S. Paschen, A. Prokofiev, M. Vojta, A. S. Cameron, J.-M. Mignot, A. Ivanov, and D. S. Inosov, Phys. Rev. B 94, 245132 (2016).
- Effantin et al. (1985) J. M. Effantin, J. Rossat-Mignod, P. Burlet, H. Bartholin, S. Kunii, and T. Kasuya, J. Magn. Magn. Mater. 47, 145 (1985).
- Sluchanko et al. (2007) N. E. Sluchanko, A. V. Bogach, V. V. Glushkov, S. V. Demishev, V. Y. Ivanov, M. I. Ignatov, A. V. Kuznetsov, N. A. Samarin, A. V. Semeno, and N. Y. Shitsevalova, J. Exp. Theor. Phys. 104, 120 (2007).
- Cameron et al. (2016) A. S. Cameron, G. Friemel, and D. S. Inosov, Rep. Prog. Phys. 79, 066502 (2016).
- Zaharko et al. (2003) O. Zaharko, P. Fischer, A. Schenck, S. Kunii, P.-J. Brown, F. Tasset, and T. Hansen, Phys. Rev. B 68, 214401 (2003).
- Kusunose (2008) H. Kusunose, J. Phys. Soc. Jpn. 77, 064710 (2008).
- Sakai et al. (1997) O. Sakai, R. Shiina, H. Shiba, and P. Thalmeier, J. Phys. Soc. Jpn. 66, 3005 (1997).
- Shiina et al. (1997) R. Shiina, H. Shiba, and P. Thalmeier, J. Phys. Soc. Jpn. 66, 1741 (1997).
- Shiina et al. (1998) R. Shiina, O. Sakai, H. Shiba, and P. Thalmeier, J. Phys. Soc. Jpn. 67, 941 (1998).
- Sera and Kobayashi (1999) M. Sera and S. Kobayashi, J. Phys. Soc. Jpn. 68, 1664 (1999).
- Demishev et al. (2017) S. V. Demishev, V. N. Krasnorussky, A. V. Bogach, V. V. Voronov, N. Y. Shitsevalova, V. B. Filipov, V. V. Glushkov, and N. E. Sluchanko, Sci. Rep. 7, 17430 (2017).
- Sera et al. (1987) M. Sera, N. Sato, and T. Kasuya, J. Magn. Magn. Mater. 63, 64 (1987).
- Tayama et al. (1997) T. Tayama, T. Sakakibara, K. Tenya, H. Amitsuka, and S. Kunii, J. Phys. Soc. Jpn. 66, 2268 (1997).
- i. Kobayashi et al. (2000) S. i. Kobayashi, M. Sera, M. Hiroi, N. Kobayashi, and S. Kunii, Physica B 281–282, 557 (2000).
- Kobayashi et al. (2003) S. Kobayashi, Y. Yoshino, S. Tsuji, M. Sera, and F. Iga, J. Phys. Soc. Jpn. 72, 25 (2003).
- Yoshino et al. (2004) Y. Yoshino, S. Kobayashi, S. Tsuji, H. Tou, M. Sera, F. Iga, Y. Zenitani, and J. Akimitsu, J. Phys. Soc. Jpn. 73, 29 (2004).
- Mignot et al. (2009) J. M. Mignot, J. Robert, G. André, M. Sera, and F. Iga, Phys. Rev. B 79, 224426 (2009).
- Schenck et al. (2007) A. Schenck, F. N. Gygax, and G. Solt, Phys. Rev. B 75, 024428 (2007).
- Kunimori et al. (2010) K. Kunimori, H. Tanida, T. Matsumura, M. Sera, and F. Iga, J. Phys. Soc. Jpn. 79, 073703 (2010).
- Friemel et al. (2015) G. Friemel, H. Jang, A. Schneidewind, A. Ivanov, A. V. Dukhnenko, N. Y. Shitsevalova, V. B. Filipov, B. Keimer, and D. S. Inosov, Phys. Rev. B 92, 014410 (2015).
- Matthias et al. (1968) B. T. Matthias, T. H. Geballe, K. Andres, E. Corenzwit, G. W. Hull, and J. P. Maita, Science 159, 530 (1968).
- Arko et al. (1975) A. J. Arko, G. Crabtree, J. B. Ketterson, F. M. Mueller, P. F. Walch, L. R. Windmiller, Z. Fisk, R. F. Hoyt, A. C. Mota, R. Viswanathan, D. E. Ellis, A. J. Freeman, and J. Rath, Int. J. Quant. Chem. 9, 569 (1975).
- Bat’ko et al. (1995) I. Bat’ko, M. Bat’ková, K. Flachbart, V. B. Filippov, Y. B. Paderno, N. Shicevalova, and T. Wagner, J. Alloy. Compd. 217, L1 (1995).
- Friemel et al. (2012) G. Friemel, Y. Li, A. V. Dukhnenko, N. Y. Shitsevalova, N. E. Sluchanko, A. Ivanov, V. B. Filipov, B. Keimer, and D. S. Inosov, Nature Commun. 3, 830 (2012).
- Jang et al. (2014) H. Jang, G. Friemel, J. Ollivier, A. V. Dukhnenko, N. Y. Shitsevalova, V. B. Filipov, B. Keimer, and D. S. Inosov, Nature Mater. 13, 682 (2014).
- Ōnuki et al. (1985) Y. Ōnuki, Y. Shimizu, M. Nishihara, Y. Machii, and T. Komatsubara, J. Phys. Soc. Jpn. 54, 1964 (1985).
- Sumiyama et al. (1986) A. Sumiyama, Y. Oda, H. Nagano, Y. Ōnuki, K. Shibutani, and T. Komatsubara, J. Phys. Soc. Jpn. 55, 1294 (1986).
- Kato et al. (1987) M. Kato, K. Satoh, Y. Maeno, Y. Aoki, T. Fujita, Y. Ōnuki, and T. Komatsubara, J. Phys. Soc. Jpn. 56, 3661 (1987).
- Satoh et al. (1989) K. Satoh, T. Fujita, Y. Maeno, Y. Ōnuki, and T. Komatsubara, J. Phys. Soc. Jpn. 58, 1012 (1989).
- Lovesey et al. (2007) S. W. Lovesey, J. Fernández-Rodríguez, J. A. Blanco, and Y. Tanaka, Phys. Rev. B 75, 054401 (2007).
- Kuwahara et al. (2007) K. Kuwahara, K. Iwasa, M. Kohgi, N. Aso, M. Sera, and F. Iga, J. Phys. Soc. Jpn. 76, 093702 (2007).
- Kuwahara et al. (2009) K. Kuwahara, K. Iwasa, M. Kohgi, N. Aso, M. Sera, F. Iga, M. Matsuura, and K. Hirota, Physica B 404, 2527 (2009).
- Nakamura et al. (2006) S. Nakamura, M. Endo, H. Yamamoto, T. Isshiki, N. Kimura, H. Aoki, T. Nojima, S. Otani, and S. Kunii, Phys. Rev. Lett. 97, 237204 (2006).
- Jang et al. (2017) D. J. Jang, P. Y. Portnichenko, A. S. Cameron, G. Friemel, A. V. Dukhnenko, N. Y. Shitsevalova, V. B. Filipov, A. Schneidewind, A. Ivanov, D. S. Inosov, and M. Brando, npj Quant. Mater. 2, 62 (2017).
- Shiba et al. (1999) H. Shiba, O. Sakai, and R. Shiina, J. Phys. Soc. Jpn. 68, 1988 (1999).
- Shiba et al. (2000) H. Shiba, O. Sakai, and R. Shiina, Physica B 281–282, 477 (2000).
- Hanzawa and Takasaki (2002) K. Hanzawa and K. Takasaki, J. Phys. Soc. Jpn. 71, 2953 (2002).
- Hanzawa (2004) K. Hanzawa, J. Phys. Soc. Jpn. 73, 1228 (2004).
- Sakurai and Kuramoto (2005) G. Sakurai and Y. Kuramoto, J. Phys. Soc. Jpn. 74, 975 (2005).
- Kondo et al. (2007) A. Kondo, H. Tou, M. Sera, F. Iga, and T. Sakakibara, J. Phys. Soc. Jpn. 76, 103708 (2007).
- Kishimoto et al. (2005) S. Kishimoto, A. Kondo, M.-S. Kim, H. Tou, M. Sera, and F. Iga, J. Phys. Soc. Jpn. 74, 2913 (2005).
- Matsumura et al. (2014a) T. Matsumura, K. Kunimori, A. Kondo, K. Soejima, H. Tanida, J.-M. Mignot, F. Iga, and M. Sera, J. Phys. Soc. Jpn. 83, 094724 (2014a).
- Onuki et al. (1989) Y. Onuki, A. Umezawa, W. K. Kwok, G. W. Crabtree, M. Nishihara, T. Yamazaki, T. Omi, and T. Komatsubara, Phys. Rev. B 40, 11195 (1989).
- Arko et al. (1976) A. J. Arko, G. Crabtree, D. Karim, F. M. Mueller, L. R. Windmiller, J. B. Ketterson, and Z. Fisk, Phys. Rev. B 13, 5240 (1976).
- Neupane et al. (2015) M. Neupane, N. Alidoust, I. Belopolski, G. Bian, S.-Y. Xu, D.-J. Kim, P. P. Shibayev, D. S. Sanchez, H. Zheng, T.-R. Chang, H.-T. Jeng, P. S. Riseborough, H. Lin, A. Bansil, T. Durakiewicz, Z. Fisk, and M. Z. Hasan, Phys. Rev. B 92, 104420 (2015).
- Ollivier and Mutka (2011) J. Ollivier and H. Mutka, J. Phys. Soc. Jpn. 80, SB003 (2011).
- Rodriguez et al. (2008) J. A. Rodriguez, D. M. Adler, P. C. Brand, C. Broholm, J. C. Cook, C. Brocker, R. Hammond, Z. Huang, P. Hundertmark, J. W. Lynn, N. Maliszewskyj, J. Moyer, J. Orndorff, D. Pierce, T. D. Pike, G. Scharfstein, S. A. Smee, and R. Vilaseca, Meas. Sci. Technol. 19, 034023 (2008).
- Azuah et al. (2009) R. T. Azuah, L. R. Kneller, Y. Qiu, P. L. W. Tregenna-Piggott, C. M. Brown, J. R. D. Copley, and R. M. Dimeo, J. Res. Natl. Inst. Stan. Technol. 114, 341 (2009).
- Ewings et al. (2016) R. A. Ewings, A. Buts, M. D. Le, J. van Duijn, I. Bustinduy, and T. G. Perring, Nucl. Instrum. Methods Phys. Res., Sect. A 834, 132 (2016).
- Tomita and Kunii (1992) A. Tomita and S. Kunii, J. Magn. Magn. Mater. 108, 165 (1992).
- Anisimov et al. (2013) M. A. Anisimov, V. V. Glushkov, A. V. Bogach, S. V. Demishev, N. A. Samarin, S. Y. Gavrilkin, K. V. Mitsen, N. Y. Shitsevalova, A. V. Levchenko, V. B. Filippov, S. Gabani, K. Flachbart, and N. E. Sluchanko, J. Exp. Theor. Phys. 116, 760 (2013).
- Matsumura et al. (2014b) T. Matsumura, S. Michimura, T. Inami, T. Otsubo, H. Tanida, F. Iga, and M. Sera, Phys. Rev. B 89, 014422 (2014b).
- Robinson (2000) R. A. Robinson, in Magnetism in Heavy Fermion Systems, edited by H. B. Radousky (World Scientific, Singapore, 2000) Chap. 4, pp. 197–282.
- Rossat-Mignod et al. (1988) J. Rossat-Mignod, L. P. Regnault, J. L. Jacoud, C. Vettier, P. Lejay, J. Flouquet, E. Walker, D. Jaccard, and A. Amato, J. Magn. Magn. Mater. 76–77, 376 (1988).
- Regnault et al. (1988) L. P. Regnault, W. A. C. Erkelens, J. Rossat-Mignod, P. Lejay, and J. Flouquet, Phys. Rev. B 38, 4481 (1988).
- Schröder et al. (1998) A. Schröder, G. Aeppli, E. Bucher, R. Ramazashvili, and P. Coleman, Phys. Rev. Lett. 80, 5623 (1998).
- Stockert et al. (1998) O. Stockert, H. v. Löhneysen, A. Rosch, N. Pyka, and M. Loewenhaupt, Phys. Rev. Lett. 80, 5627 (1998).
- Stock et al. (2011) C. Stock, D. A. Sokolov, P. Bourges, P. H. Tobash, K. Gofryk, F. Ronning, E. D. Bauer, K. C. Rule, and A. D. Huxley, Phys. Rev. Lett. 107, 187202 (2011).
- Singh et al. (2011) D. K. Singh, A. Thamizhavel, J. W. Lynn, S. Dhar, J. Rodriguez-Rivera, and T. Herman, Sci. Rep. 1, 117 (2011).
- Kimura et al. (2013) K. Kimura, S. Nakatsuji, J.-J. Wen, C. Broholm, M. B. Stone, E. Nishibori, and H. Sawa, Nature Commun. 4, 1934 (2013).
- Chan and Heine (1973) S.-K. Chan and V. Heine, J. Phys. F: Metal Physics 3, 795 (1973).
- Fawcett (1988) E. Fawcett, Rev. Mod. Phys. 60, 209 (1988).
- Borisenko et al. (2008) S. V. Borisenko, A. A. Kordyuk, A. N. Yaresko, V. B. Zabolotnyy, D. S. Inosov, R. Schuster, B. Büchner, R. Weber, R. Follath, L. Patthey, and H. Berger, Phys. Rev. Lett. 100, 196402 (2008).
- Ruderman and Kittel (1954) M. A. Ruderman and C. Kittel, Phys. Rev. 96, 99 (1954).
- Kasuya (1956) T. Kasuya, Prog. Theor. Phys. 16, 45 (1956).
- Yafet (1987) Y. Yafet, Phys. Rev. B 36, 3948 (1987).
- Kim et al. (1996) J. G. Kim, E. K. Lee, and S. Lee, Phys. Rev. B 54, 6077 (1996).
- Aristov (1997) D. N. Aristov, Phys. Rev. B 55, 8064 (1997).
- Litvinov and Dugaev (1998) V. I. Litvinov and V. K. Dugaev, Phys. Rev. B 58, 3584 (1998).
- Brown et al. (1985) P. J. Brown, R. Caudron, A. Fert, D. Givord, and P. Pureur, J. Physique Lett. 46, 1139 (1985).
- Fretwell et al. (1999) H. M. Fretwell, S. B. Dugdale, M. A. Alam, D. C. R. Hedley, A. Rodriguez-Gonzalez, and S. B. Palmer, Phys. Rev. Lett. 82, 3867 (1999).
- Rau et al. (2014) J. G. Rau, E. K.-H. Lee, and H.-Y. Kee, Phys. Rev. Lett. 112, 077204 (2014).
- Iqbal et al. (2015) Y. Iqbal, H. O. Jeschke, J. Reuther, R. Valentí, I. I. Mazin, M. Greiter, and R. Thomale, Phys. Rev. B 92, 220404 (2015).
- Bieri et al. (2016) S. Bieri, C. Lhuillier, and L. Messio, Phys. Rev. B 93, 094437 (2016).
- Tymoshenko et al. (2017) Y. V. Tymoshenko, Y. A. Onykiienko, T. Müller, R. Thomale, S. Rachel, A. S. Cameron, P. Y. Portnichenko, D. V. Efremov, V. Tsurkan, D. L. Abernathy, J. Ollivier, A. Schneidewind, A. Piovano, V. Felea, A. Loidl, and D. S. Inosov, Phys. Rev. X 7, 041049 (2017).
- Schmidt and Thalmeier (2017) B. Schmidt and P. Thalmeier, Phys. Rep. 703, 1 (2017).