Interaction between U/UO2 bilayers and hydrogen studied by in-situ X-ray diffraction
Abstract
This paper reports experiments investigating the reaction of H2 with uranium metal-oxide bilayers. The bilayers consist of 100 nm of epitaxial -U (grown on a Nb buffer deposited on sapphire) with a UO2 overlayer of thicknesses of between 20 and 80 nm. The oxides were made either by depositing via reactive magnetron sputtering, or allowing the uranium metal to oxidise in air at room temperature. The bilayers were exposed to hydrogen, with sample temperatures between 80 and 200 C, and monitored via in-situ x-ray diffraction and complimentary experiments conducted using Scanning Transmission Electron Microscopy - Electron Energy Loss Spectroscopy (STEM-EELS). Small partial pressures of H2 caused rapid consumption of the U metal and lead to changes in the intensity and position of the diffraction peaks from both the UO2 overlayers and the U metal. There is an orientational dependence in the rate of U consumption. From changes in the lattice parameter we deduce that hydrogen enters both the oxide and metal layers, contracting the oxide and expanding the metal. The air-grown oxide overlayers appear to hinder the H2-reaction up to a threshold dose, but then on heating from 80 to 140 C the consumption is more rapid than for the as-deposited overlayers. STEM-EELS establishes that the U-hydride layer lies at the oxide-metal interface, and that the initial formation is at defects or grain boundaries, and involves the formation of amorphous and/or nanocrystalline UH3. This explains why no diffraction peaks from UH3 are observed. 22footnotetext: ©British Crown Owned Copyright 2017/AWE
1 Introduction
The safe, long term, storage of metallic uranium samples requires a fundamental understanding and predictive capability regarding the uranium-hydrogen reaction [1]. Its storage in the presence of either moisture or organic material in sealed containers is known to produce hydrogen over time, which goes on to react with the uranium. As described elsewhere, the reaction proceeds through four characteristic phases: induction, acceleration, linear and terminal [2] and the last three phases can produce finely divided, highly reactive (pyrophoric) radioactive powder in the form of UH3. Generally a mixture of and -UH3 is formed between ambient temperatures and 100 C with the concentration of -UH3 increasing to significant proportions at room temperature and below [3]. This uranium hydride presents a significant safety hazard on opening the container to air and knowing the amount of hydride produced allows a quantification of the hazard [4].
There are, however, many unanswered questions remaining, despite a fairly well-developed literature, and at least part of the problem stems from the complexity of the real-world metallic uranium system (containing inclusions, defects, stress and many oxide variables etc). In this work, we have attempted to simplify the system as much as possible. To this end we have prepared model UO2/U metal bilayers on a sapphire (Al2O3) substrate (11.0 orientation) with a Nb buffer [5]. We have then exposed these samples to a hydrogen containing gas whilst probing the structure with synchrotron X-rays. This experimental arrangement has the advantages of a very clean, nominally epitaxial uranium, well-defined model structure, from which certain reflections (both in the metal and oxide) can be followed with precision as the hydrogen interacts with the sample.
The areas of greatest uncertainty in our understanding relate to the earliest part of the reaction, i.e. when hydrogen traverses the oxide, enters the metal, builds to some terminal concentration at a given point and nucleates as UH3. We build on previous work with coupon samples and follow intensities and lattice parameters of the metal and oxide of our model system. Our observations from the synchrotron experiments are supported by Scanning Transmission Electron Microscopy (STEM) and Electron Energy-Loss Spectroscopy (EELS) measurements on additional samples exposed to hydrogen.
2 Experimental Details
2.1 Sample preparation
Samples of three types were prepared using the method of DC magnetron sputtering at the University of Bristol according to a method described elsewhere [5]. The U metal layers of between 60 and 100 nm were deposited on a Nb buffer at 600 C, giving a predominantly U(110) orientation epitaxial film [5]. Differing oxide overlayers were produced through either depositing an oxide through reactive sputter deposition or leaving the metal to oxidise in air. In the deposited case, by DC magnetron reactive sputtering, an oxide thickness of 20nm was created at 7 x 10⁻³ mbar Ar/2 x 10-5 mbar O2, 25-30 C on top of the uranium metal. In the air-grown case, the oxide overlayer was allowed to develop by exposure to laboratory air at room temperature over two days. A sample was also produced with no intentional oxide grown where the prepared uranium thin film was transferred to the vacuum system with a few minutes. This ‘uncapped’ sample was exposed to hydrogen and used for STEM analysis. A table detailing the samples depicted in each figure is contained in the appendix.
The Nb and U are deposited at high temperature to allow epitaxy and this results in a uranium film exhibiting predominantly -U (110) crystallites, with a minor contribution from those oriented with the -U (002) planes [5]. The crystallites of -U (110) orientation are probably as thick as the film (60 nm) but the -U (002) crystallites may extend no more than 20 nm in the growth direction. Importantly, there is no epitaxy between the uranium metal and the oxide.
2.2 Synchrotron experimental configuration
XMaS (Beamline BM28) is a bending magnet beamline at the European Synchrotron Radiation Facility (ESRF) and we used photons of incident energy of 8 keV ( = 0.15498 nm) with a 6-circle diffraction-geometry goniometer [6].
![[Uncaptioned image]](/html/1712.07387/assets/BeDome.jpg)
Samples for the XRD experiments were loaded into a gas-cell consisting of a resistively heated sample stage (controlled remotely via thermocouples attached to the stage and a Proportional Integral Derivative controller) within an X-ray transparent beryllium dome. The cell could be evacuated to a base pressure of 10-3 mbar and refilled with gas to 1000 mbar. Gas was supplied and extracted through a gas manifold attached to the cell. This allowed manual delivery of 4H2 in Ar (N5.5 purity); cell pressure could be monitored by means of pressure gauges. All subsequent reporting of pressure within this paper relates to the partial pressure of H2 (P) delivered. A schematic of the arrangement is shown in Figure 1. XRD patterns were characterised by very intense reflections from the substrate (Al2O3) at 2 = 38.02∘. Samples were always aligned to maximize the -U(110) peak using a omega rocking curve leading to small changes in alignment during the experiment and a change of intensity from the narrow substrate (Al2O3) reflection.
Prior to hydrogen exposure samples were subject to a vacuum thermal pre-treatment (12.6 hrs in the case of the deposited oxide and 1.5 hrs for the air grown sample) at 200 C/10-3 mbar during which X-ray spectra were largely unchanged.
Due to the range of doses and temperatures explored throughout this investigation it is pertinent to compare them via a product of pressure and time. Therefore we have utilised the term dose to refer to the product of the partial pressure of hydrogen and the time of exposure (units min.bar). We are aware that an exact equivalence of the factors of time and pressure may not be wholly justified, especially in the case of saturation effects, but gives a simple definition of dose that may be used to compare experiments. In the two samples examined with synchrotron radiation, there were also intentional changes in temperature during the hydrogen exposure: these are indicated on later graphs with vertical lines.
2.3 Atomic Resolution Microscope
The TEM foil (of approximate dimensions 20x10x0.02 m) was produced via Focused Ion Beam (FIB) using a Pt protective layer to protect the sample during milling and thinning. The foils were prepared on a FEI Helios Nanolab 600i dual-beam at Bristol before being transported to Oxford for STEM and EELS measurements. STEM and EELS was undertaken at the University of Oxford with a JOEL ARM 3000F. Measurements taken at 200 kV allowed EELS spectra to be obtained simultaneously with high-annular imaging. All EELS data are calibrated in energy and normalised for thickness using the zero-loss peak obtained as part of, or simultaneously with, the spectra of interest. The energy resolution of the EELS system is determined via the full width at half maximum of the zero-loss peak and is of the order of 0.6 eV.
3 Results
The results section is organised in terms of experiments carried out at the ESRF on an as-deposited oxide sample and an air grown oxide sample. STEM and EELS experiments on further samples not exposed in-situ then follow. A full-width at half maximum (FWHM) analysis of the two samples used for diffraction is included just before the Discussion.
3.1 Deposited Oxide
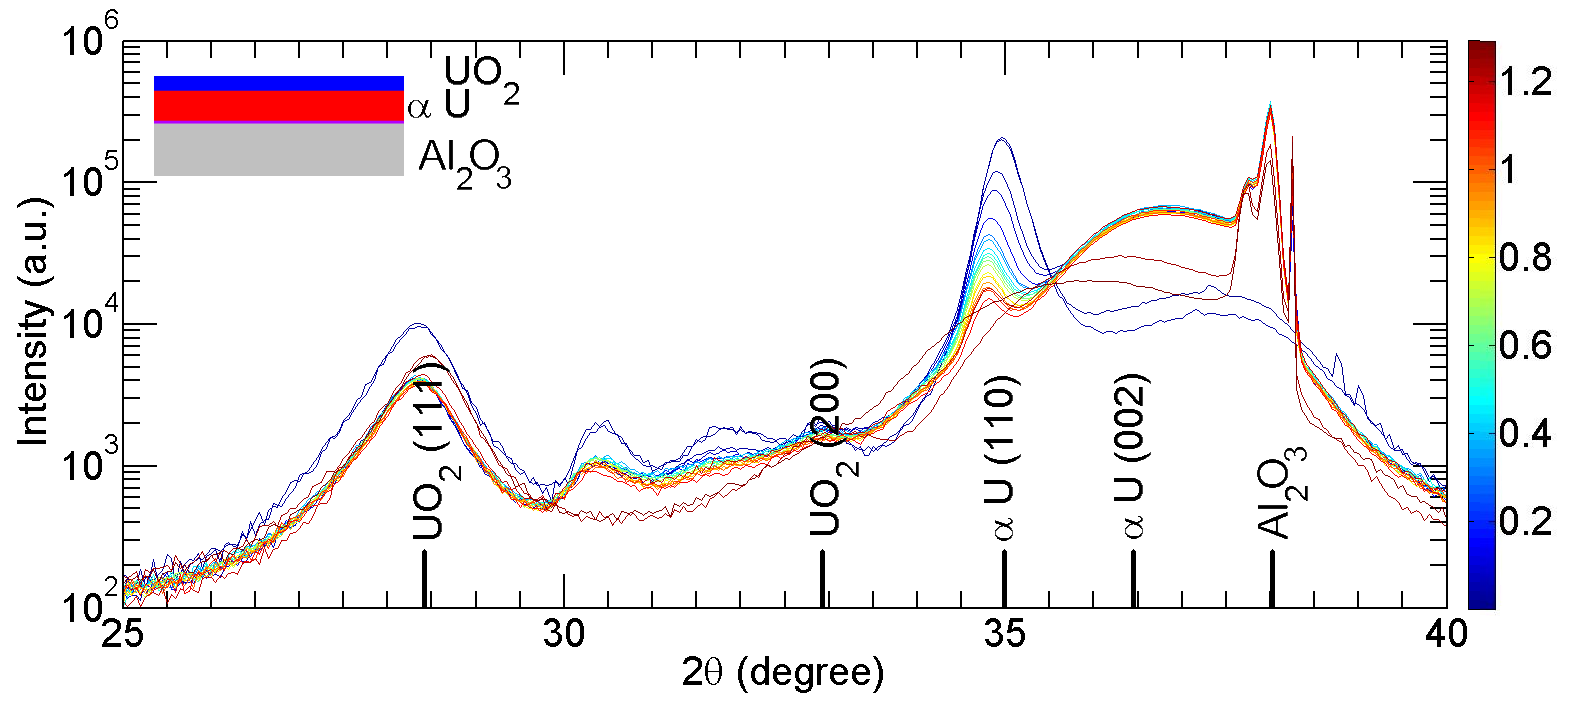
The first series of experiments were conducted on a bilayer of -uranium with a reactively sputtered uranium dioxide overlayer deposited at room temperature, thus producing an oxide from pure oxygen and without consumption of the metal. There is no epitaxy at the oxide/metal interface.
The XRD pattern (Figure 2) is characterised by strong reflections of the -U (110) at 2 = 35.2∘ and that of UO2 (111) at 2 = 28.5∘. In addition to these reflections, there is broad intensity around the -U (002), but a quantitative analysis of this is prevented by the interference with intensity oscillations from thickness fringes from the buffer and metal layer. Finally, there are two minor reflections at 30.5∘, and 32∘ (both of which change with exposure to hydrogen), and a weak contribution from the UO2 (200).
Upon exposure to hydrogen the intensity of the major -U (110) reflection is steadily decreased over the 80 C hydrogen exposures. For the final two scans the temperature was raised to 200 C, but by this time the reflections from the metal were very weak. In as-deposited UO2 films, we find a strong texturing, which is different from that found in air-grown films (see following section), so the dominance in this case of the UO2 (111) over the UO2 (200) is not surprising. The weak reflection at 30.5∘ is the -U (020), which is calculated at 30.7∘, and this is consumed by hydrogen dosing, as expected. The weak intensity and the breadth of the peak suggest only very small amounts are present.
![[Uncaptioned image]](/html/1712.07387/assets/SN782_2.png)
The peak at 32∘ is related to the formation of UO2+x [7] and implies that cubic type reflections in UO2 start to split as the tetragonal nature of U3O7 (x = 0.33) makes reflections separated by 1∘ appear (at this wavelength). As expected, these reflections disappear with hydrogen dosing, as the UO2 is reduced to stoichiometry, and thus cubic. There are no indications of in-growths of reflections attributable to either of the polymorphs of UH3; the strongest reflection of the expected -UH3 (210) would be observable at 2 = 30.2∘.
Our main aim is to consider the -U (110) and UO2 (111) reflections as a function of dosing. We do this by analysing the intensities and positions of these reflections and presenting the results in Figure 3. The behaviour of the full-widths at half maximum (FWHM) with dose of all the reflections will be discussed later due to the association with crystallite size, section 4.
The drop in intensity of the -U (110) after the first point almost certainly arises from a change in alignment. However, the initial increase of d/d in both materials is close to that expected from thermal expansion when heating from 25 to 80 C [8, 9]. In contrast, the UO2 (111) does not change in intensity, but the lattice contracts towards the bulk value. The opposite behaviour of the U and UO2 lattices strongly increases the strain at the smooth interface between these two layers.
3.2 Air grown oxide
Oxide overlayers were allowed to grow naturally, by removing the -uranium sample from the sputtering machine and leaving it in air for 2 days at room temperature, in this case oxide growth is the result of consumption of uranium metal.
The air-grown oxide sample is fundamentally different to that discussed above for the as-deposited sample. The oxide-metal interface is now not smooth, as it is the result of a conversion of the metal, rather than a layer added on top.
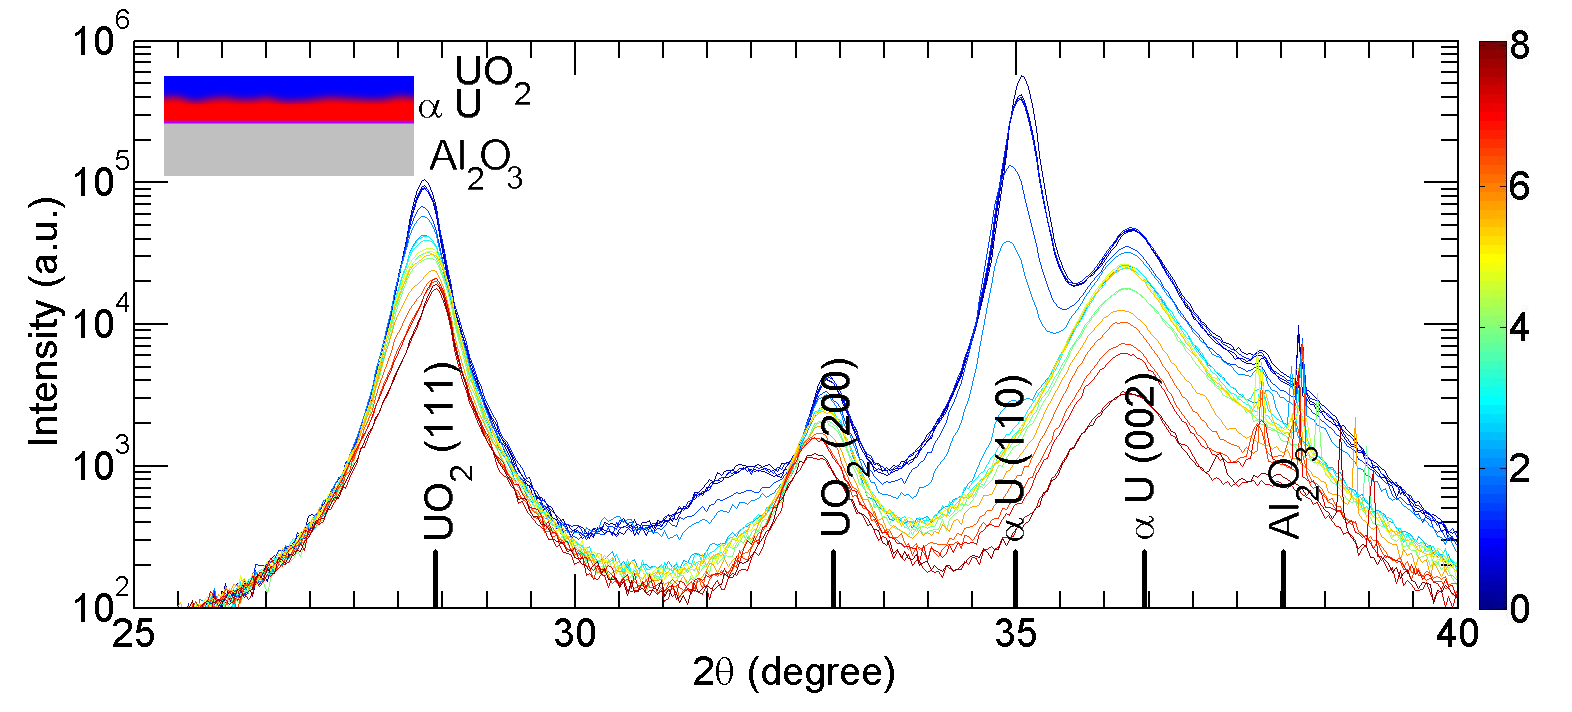
The rough oxide/metal interface reduces dramatically the reflectivity, and the intensity oscillations associated with the substrate and buffer. This allows a much better observation of the -U (002) reflection in the air-grown oxide sample (Figure 4), which was not possible with the as-deposited oxide sample (Figure 2). The reflection near 32∘ is associated with hyperstoichiometric UO2+x and is removed as the oxide is reduced in stoichiometry by hydrogen exposure (as was seen for the as-deposited oxide sample, see Figure 2).
Plotting the intensity and d/d in Figure 5 for all major reflections illustrates differences in the effect of H2 dosing on different crystallographic orientations.
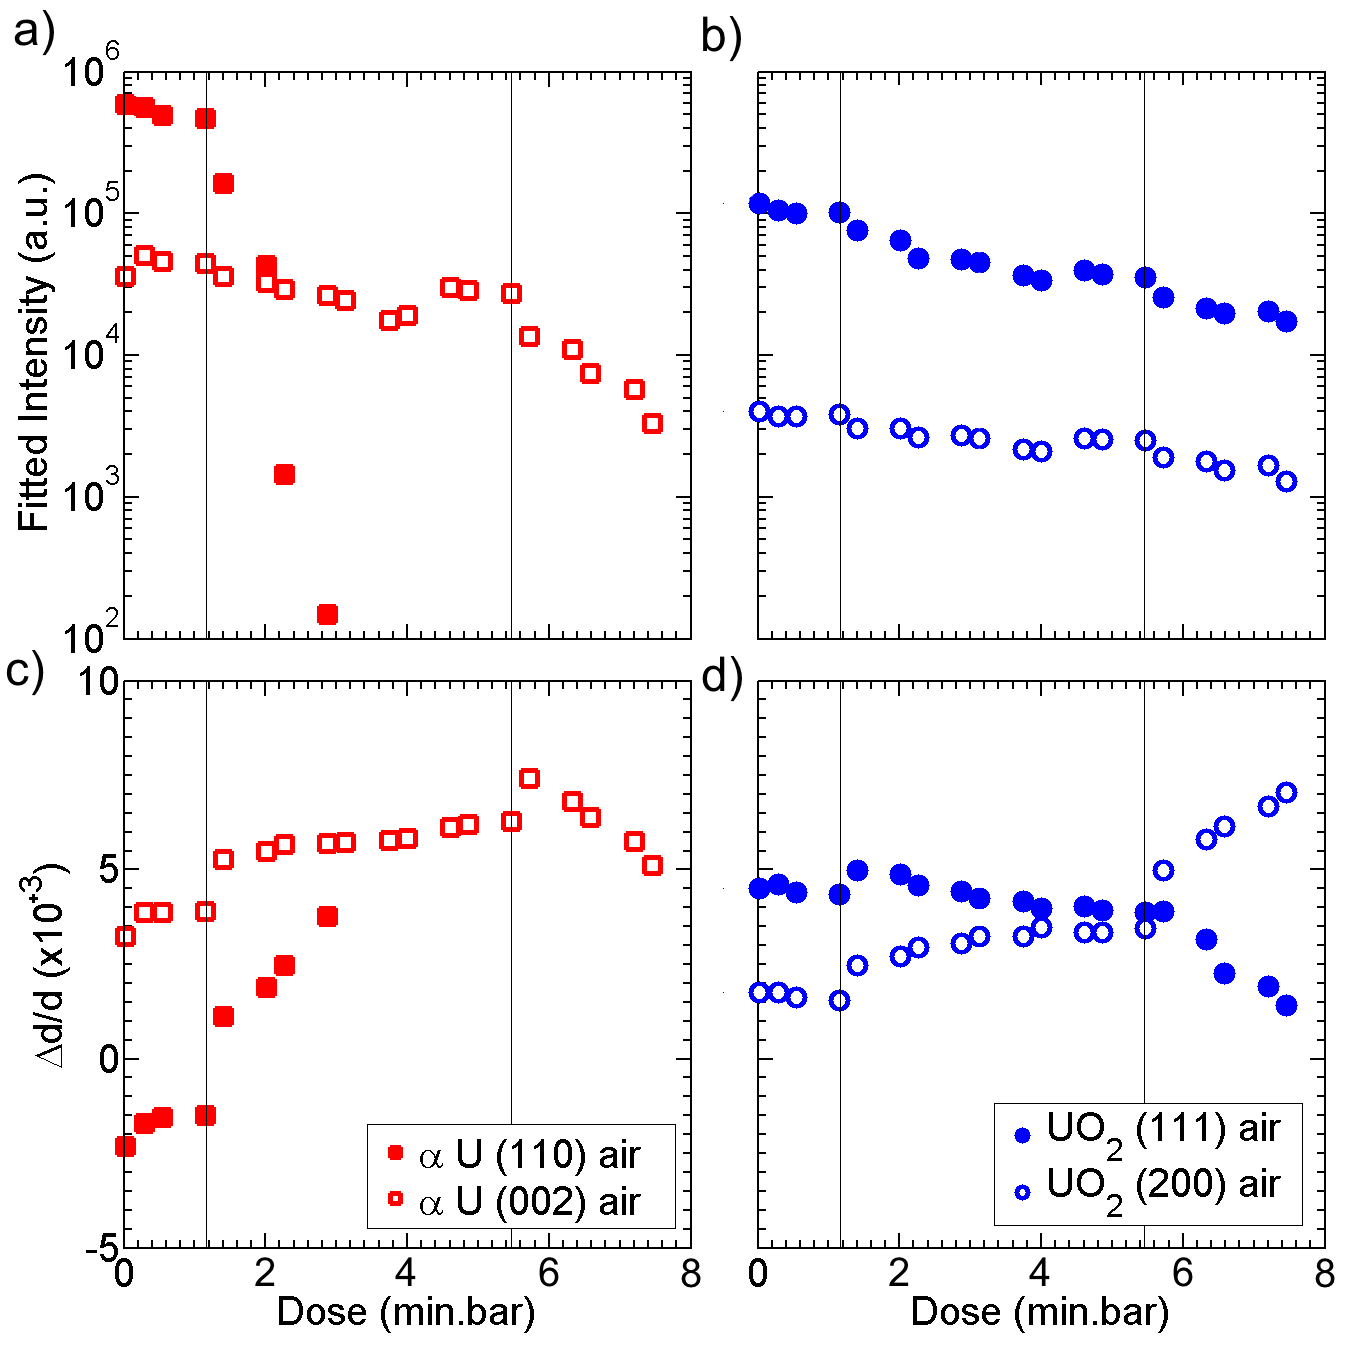
With exposure to H2 gas there is clearly a difference in the consumption of the metal depending on the orientation. The required dose to consume the uranium metal is also greater in the air-grown oxide case than the deposited oxide case. To increase the reactivity and thus kinetics of the dose the temperature was raised, first to 140, and then to 200 C. The vertical lines in Figure 5 indicate where the temperature was raised. The dose that resulted in complete consumption of uranium for the as-deposited oxide sample (1.2 min.bar) had little effect on the intensities or positions of metal or oxide Bragg peaks for the air-grown oxide sample. This suggests the air-grown oxide layer has formed a protective layer over the metal resulting in a lower rate of consumption of crystalline uranium via reaction with H2. The increase of d/d for both U-metal and oxide peaks after the 1st point is due to thermal expansion [8, 9], but after that both d-spacings show no change; no H2 is entering the metal lattice. However, when the sample temperature is raised from 80 to 140 C (at first vertical line in Figure 5), a dramatic change takes place, with rapid expansion of the U lattice, and consumption of metal. A strong orientational dependence is observed; with the -U (110) Bragg peaks decreasing much faster in intensity than the -U (002) as is clear in Figure 4.
As discussed above, for the as-deposited oxide sample there was no change in UO2(111) intensity over the experiment. However, as shown in Figure 5, for the air-grown oxide sample a decrease in intensity was observed over the entire experiment (also observable in Figure 4). The intensities of both UO2(111) and UO2(200) start to decrease at around 1.2 min.bar when the temperature is increased to 140 C. Also at this increased temperature, the respective d-spacings show different behaviour: the UO2(111) decreasing (after an initial increase due to the change in temperature) and the UO2(200) increasing. Later in the experiment at around 5.6 min.bar, when the temperature is further increased to 200 C, the changes in these two d-spacings are further accentuated with a more rapid decrease and increase in d/d for UO2(111) and UO2(200) respectively.
It should be pointed out that such behaviour in one single crystallite cannot occur, but the diffraction experiments along the specular direction (as reported here) probe only crystallites with their respective axes parallel to the overall film growth direction, so these results come from different crystallites, and are subject to different strain.
3.3 Scanning Transmission Electron Microscopy
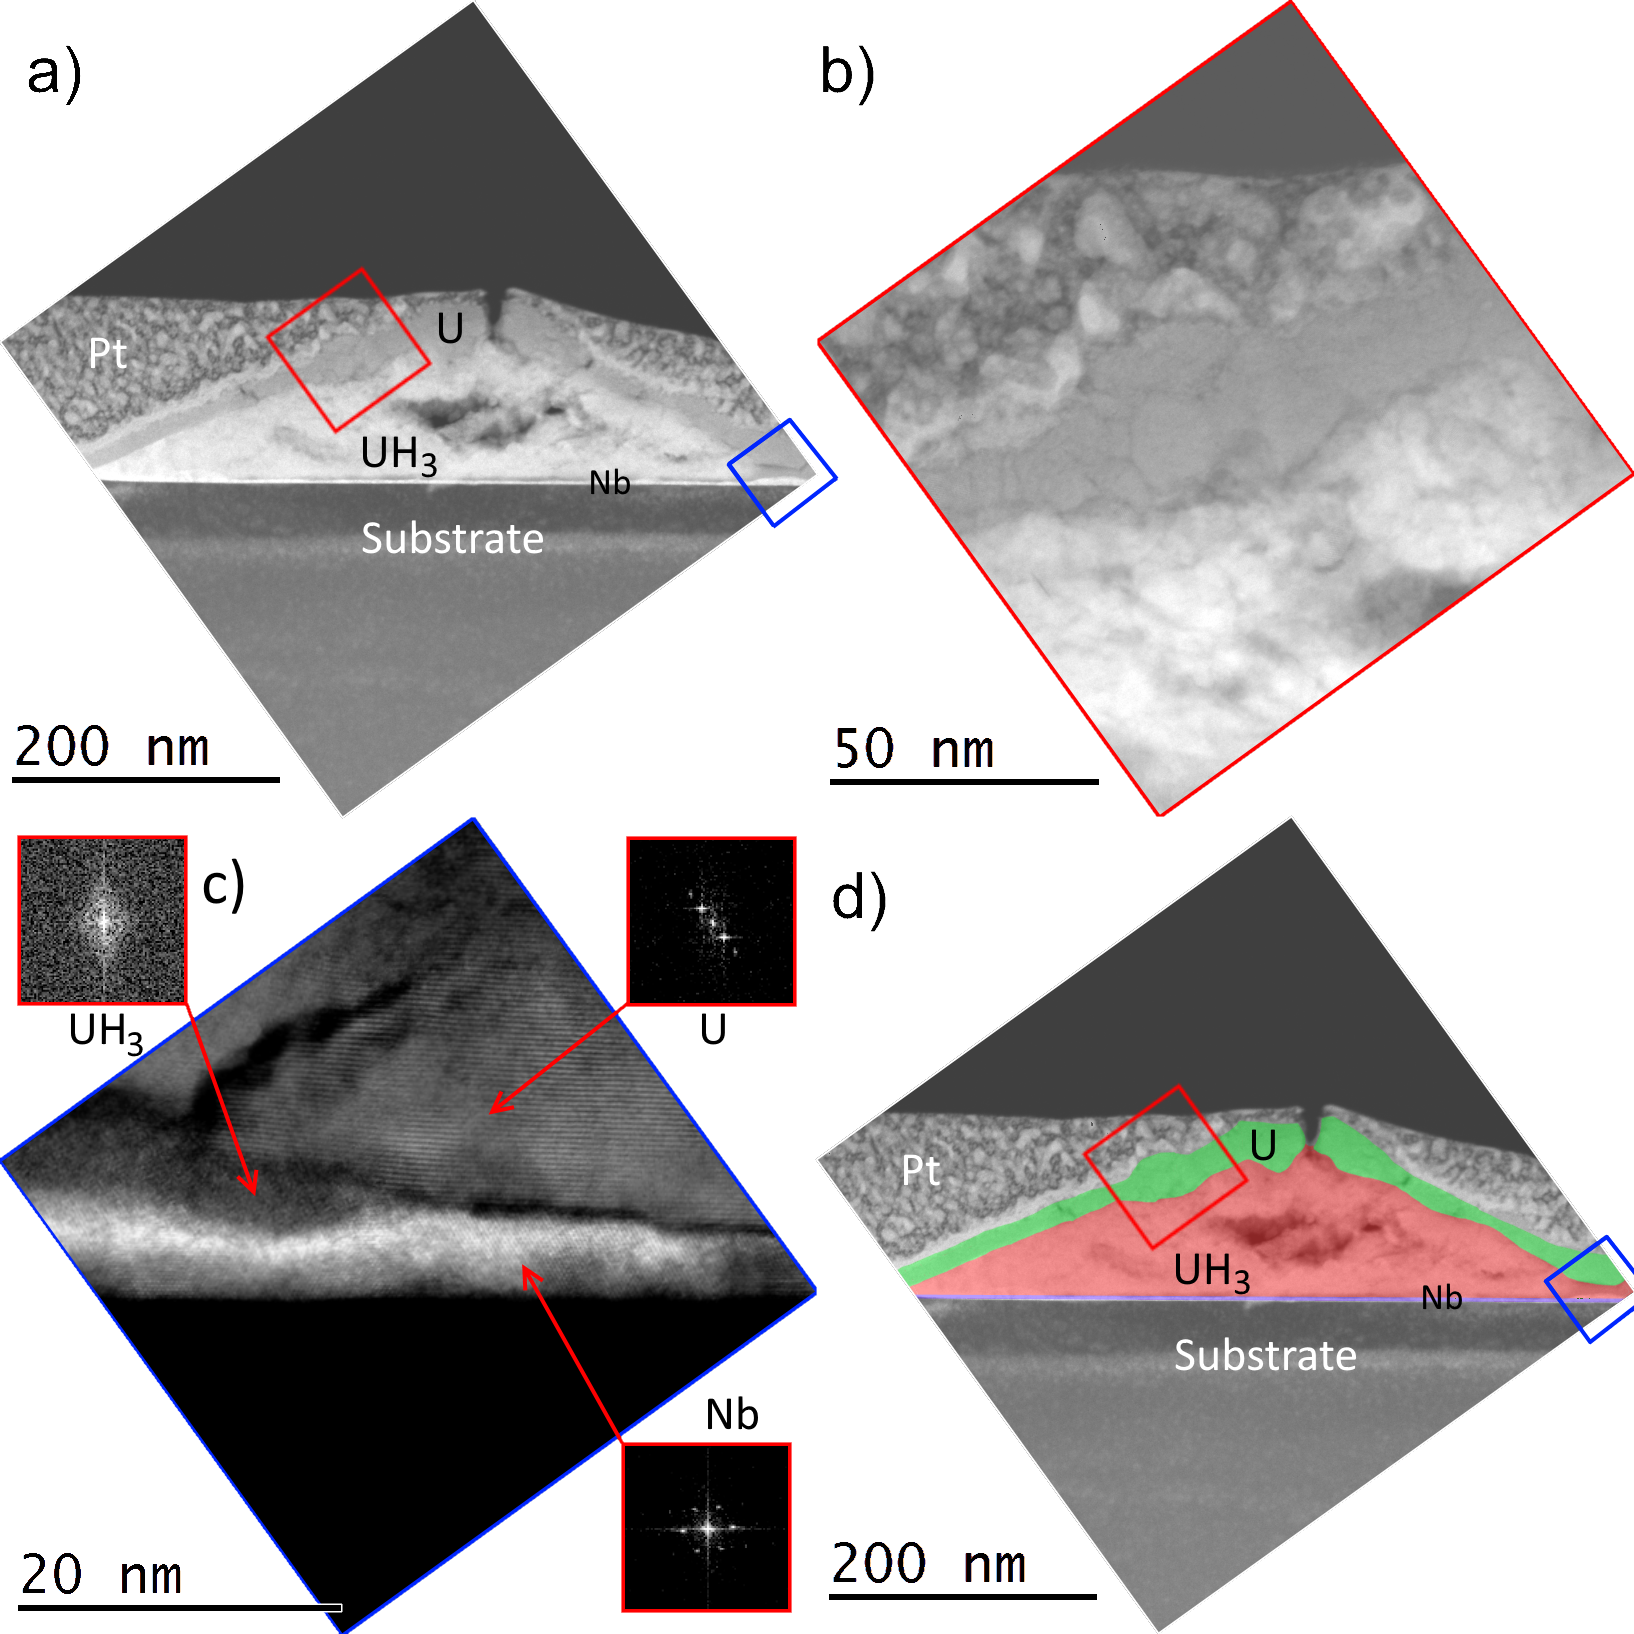
A third type of sample, without any intentionally deposited or grown oxide (i.e. uncapped), was exposed to hydrogen and examined with STEM. This uncapped sample of 45 nm was subjected to 0.5 bar of pure hydrogen at 140 C for 20 minutes before the hydrogen was removed and the sample was allowed to cool. With this dose level (10 min.bar) blisters were formed and the blister example shown in Figure 6a) was observed to be coincident with a crack through the uranium film. It is not clear whether the presence of a pre-existing crack caused the precipitation here or whether the precipitation of low density corrosion product caused the crack in the uranium metal. At the edges, where the blister is expanding laterally, the hydride is not crystalline suggesting that under some circumstances its formation will not give rise to sharp diffraction peaks. It is also noticeable from this figure that the blister appears to have formed at the interface between the uranium and the buffer layer, rather than at the free surface. This suggests that to form hydride requires a concentration of hydrogen in uranium and a nucleation point such as a defect. However this sample has seen a high hydrogen dose and recall that this sample has no (or very little) oxide, so that it is not representative of the earlier samples discussed above.
3.4 Electron Energy Loss Spectroscopy
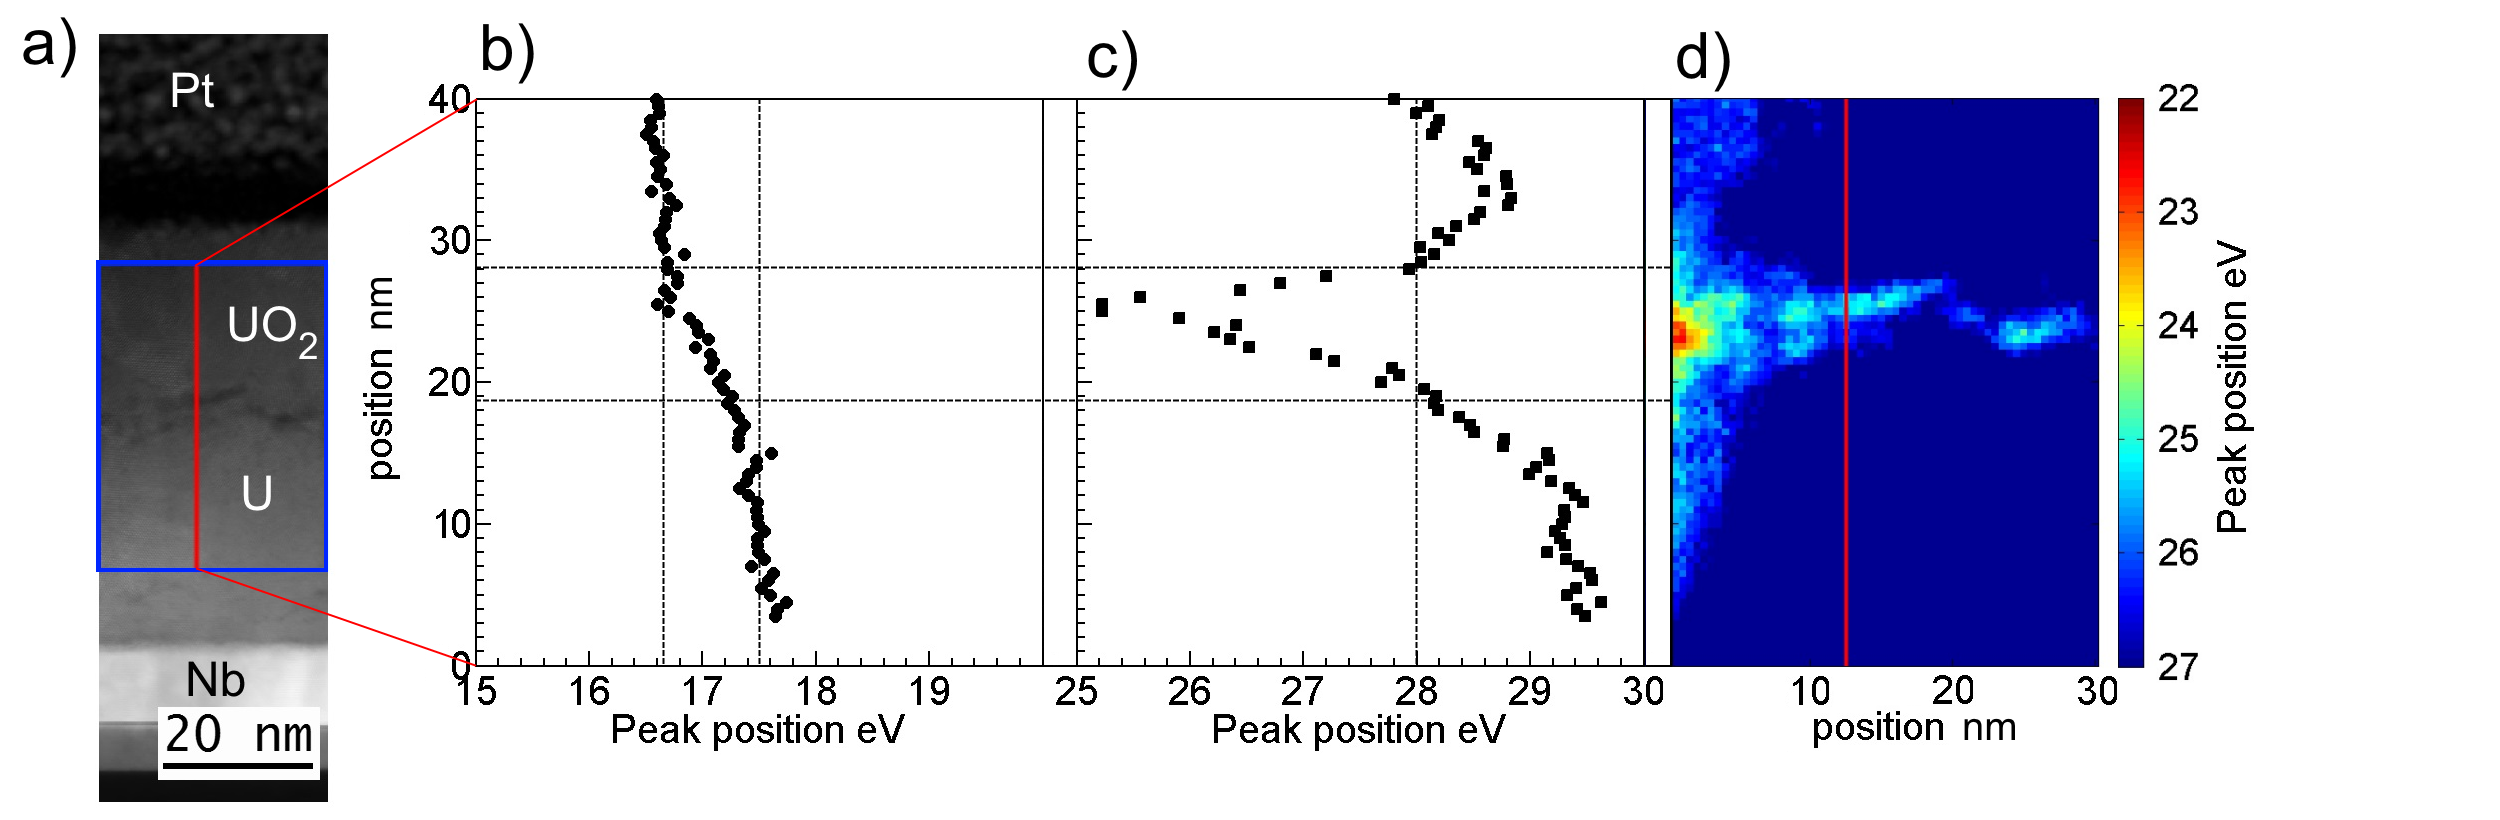
Hydriding an as-deposited oxide/uranium bilayer at 80 C in 0.5 bar of 4 H2 mix for 30 mins (0.6 min.bar equivalent dose) does not show complete consumption of the uranium metal and gives an opportunity to observe where early hydride precipitation occurs, Figure 7. Conducting EELS collection over an energy region of 10-60 eV interrogates the P2 and P3 absortion edges which equate to the 6p to 6d transitions in uranium.
Fitting the edge positions for every pixel collected can help to build up a picture of the uranium bonding in different regions of the sample. For clarity the fitted peak positions are shown Figure 7b-c) for a line profile, shown in Figure 7a), across the interface between the metal and the oxide. The peak position of the P3 edge, Figure 7b), shifting from 16.6eV (oxide) to 17.5eV (metal) shows a distinct difference in the environment of the uranium metallic and ceramic and is in line with the observation of others [10, 11]. This is mimicked in the uranium O4,5 edges measured at 111.4eV (oxide) and 112.2eV (metal) [12]. There is also a difference in the P2 edge peak position, Figure 7c), between oxide (28-28.3eV) and metal (29.2eV) with a large shift to a distinct lower energy at the interface between the metal and the oxide indicating a different uranium environment and possible valence state. Mapping the regions where the fitted peak position of the P2 edge is less than 27eV, and so neither oxide nor metal results in highlighting the interface region shown in Figure 7d). In summary, after only a low dose of H2 at 80 C (0.6 min.bar) we have good evidence for a distinctly different uranium environment (perhaps a different compound) at the interface region. This would suggest that our first UH3 precipitation (initiation) is in this interface region between the U and UO2, where there are many defects.
4 Analysis of full-width half maximum of diffraction peaks
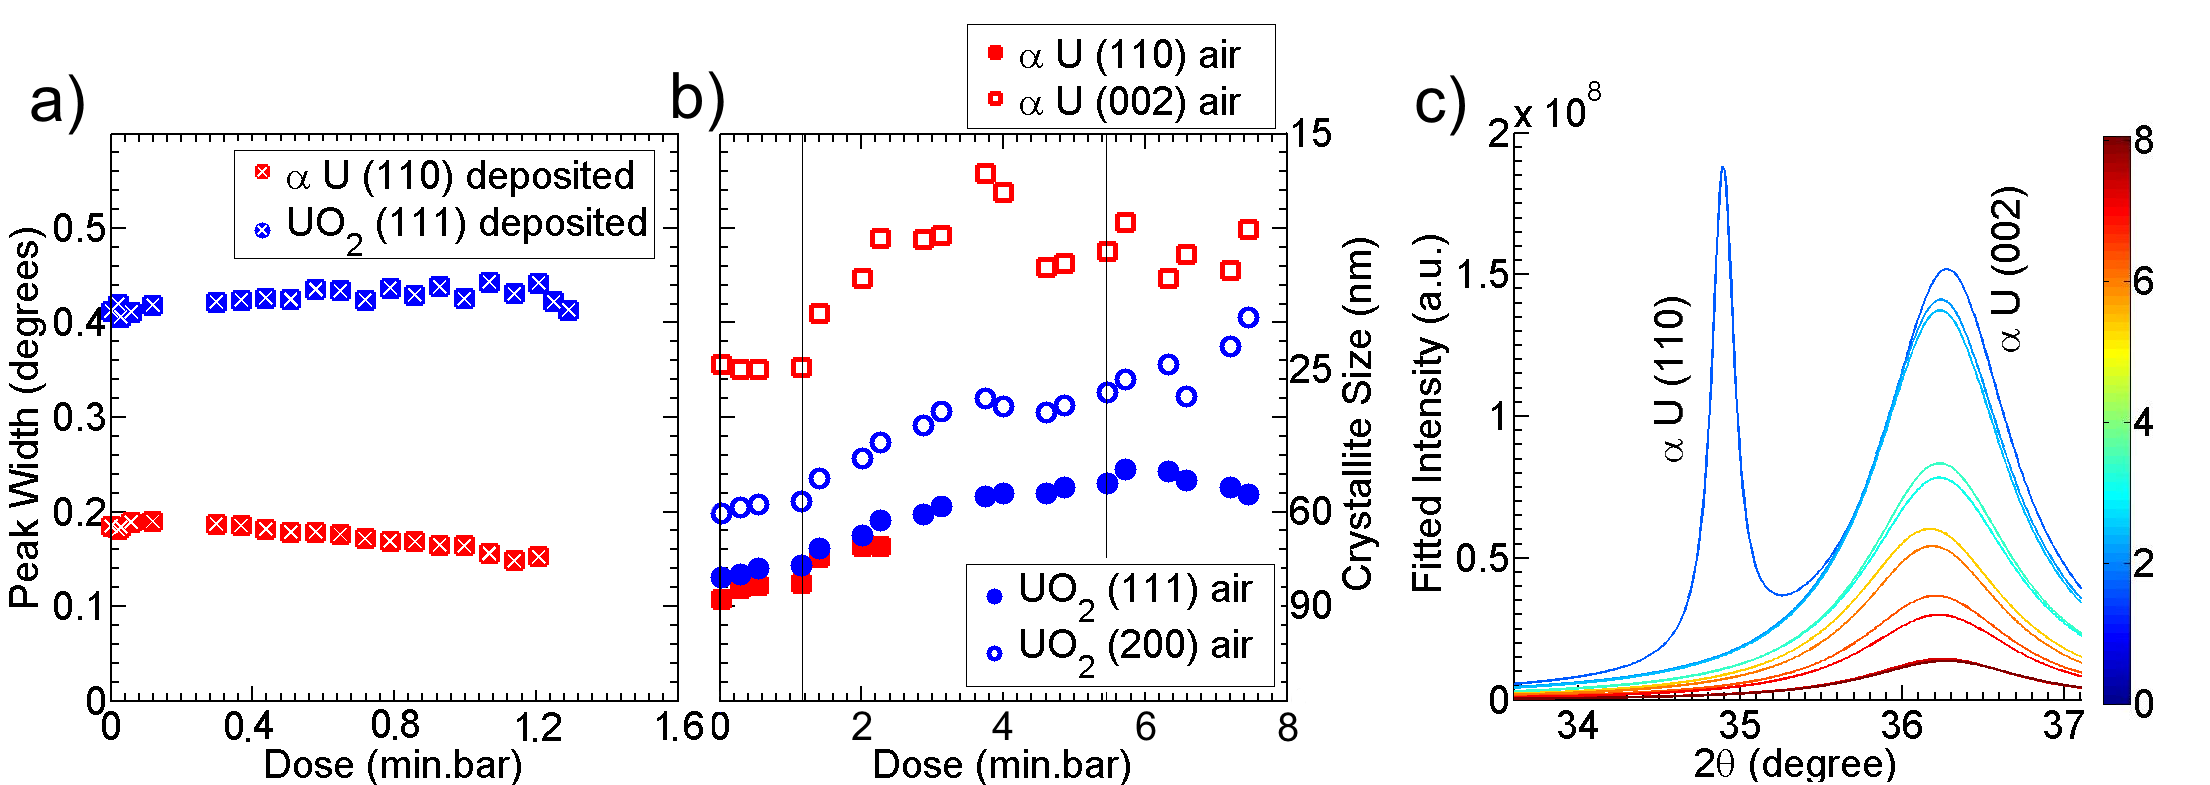
The full-width at half maximum (FWHM) is directly related to the size of the crystallites giving rise to the diffraction peak. The specular geometry of the experiment dictates the probing direction is perpendicular to the bilayer surface, i.e. in the growth direction. This crystallite size is limited by the bilayer dimension of 100 nm, leading to the FWHM being much broader than the instrumental resolution. In this case we have an experimental determination of the resolution width from the substrate sapphire peak, which has a FWHM =0.02∘. Normally one should perform a convolution of the measured FWHM with the instrumental resolution to obtain the observed FWHM, but in this case the peaks from the bilayer are so much wider than the resolution, that they may be used directly as the observed values. The FWHM of the major U and UO2 reflections for the as-deposited and air grown oxide samples observed by the X-ray experiments, as a function of H2 dose, are shown in Figure 8.
Using the Scherrer formula:
| (1) |
where is the coherence length, is a shape factor, which we take as unity, and is the Bragg angle, we determine the relationship between FWHM and crystallite size. This relationship is shown on the right-hand side of the center panel of Figure 8. These are dimensions in the growth direction. We are less concerned here with the absolute values, but more with changes as a function of H2 dosing. Since a number of different mechanisms can contribute to the width of a reflection, for example inhomogeneous strain across the crystallite, the Scherrer formula gives a lower bound to the crystallite size. The values of crystallite size derived from the Scherrer equation are broadly in line or smaller than the film thicknesses themselves justifying our use of = 1.
For the as-deposited oxide, there is little change in the FWHM as a function of H2 dose, and the widths correspond approximately to the nominal ones of 60 nm U metal, and 30 nm of dioxide. This absence of any broadening as the uranium is consumed (in both samples) puts important constraints on the mechanism of uranium conversion to hydride. However, for the air-grown oxide there are profound effects when the second stage (at T = 140 C) dosing occurs. For both the -U(110) and -U(002) grains the crystallite size is relatively unchanged during the 80 C part of the experiment. For the subsequent part of the experiment at 140 C the uranium is consumed steadily and the crystallite size then decreases by some 20-30 up to a dose of 2.5 min.bar.
5 Discussion
5.1 Changes in the uranium metal
Intensity from uranium metal reflections decreases substantially in the diffraction patterns in both samples (Figures 2 and 4) during hydrogen exposure. Since no change occurs during the annealing treatment before hydriding, this change can be attributed to hydrogen exposure. The absence of diffraction lines from the UH3 will be discussed later, but is related to the amorphous and/or nanocrystalline form found by the TEM investigation shown in Figure 6.
The reduction in metal intensity of -U(110) is different for the as-deposited and air-grown samples, as shown in Figure 9a), where we have plotted the normalised intensities of the two samples as a function of dose. The rate of removal of -U(110) in the as-deposited sample (80 C) would appear to follow a parabolic relationship with time where the rate of removal is initially fast, slowing as the experiment progresses (Figure 9a). If the intensity is plotted against log of the dose, Figure 9b), then we should expect a straight line with the slope related to the rate, as is observed. This form of kinetics is consistent with the corrosion product forming an adherent product layer which itself throttles hydrogen transport to the metal; in such a scenario the growing UH3 layer itself acts as a barrier to hydrogen flux and slows the hydriding reaction. This explanation firstly requires product formation between the source of hydrogen and the uranium metal (it is generally accepted in the literature that this occurs at the UO2-U interface) and, secondly, a non-spalling UH3 product layer. Alire et al [13] have reported the effect of adherent hydride layers on initial take-up of hydrogen with an initial rapid rate followed by a reduction in rate as an adherent layer grows in thickness. Based on the quantity of uranium consumed in their experiments in order to reach a steady, initial minimum reaction rate, we could estimate that Alire had an adherent layer of UD3 of 10 m at 175 C, i.e. more than two orders of magnitude larger than our films (30 nm). It is thus likely that the hydride product in both samples discussed here will be adherent and therefore will provide a barrier to slow the hydriding rate.
![[Uncaptioned image]](/html/1712.07387/assets/Combined8.png)
For the air-grown sample (Figure 4) during the 80 C portion of the experiment the rate of loss of -U(110) intensity is both less and approximately linear over dose, as shown in Figure 9a). If we remember that the uranium films in the two samples are nominally identical, it becomes apparent that there should be no reason why the air-grown sample would not ultimately form such an adherent barrier: but this type of kinetics is not observed. It appears that, in the case of the air-grown sample, the flux of hydrogen through the air-grown oxide is much lower and this then is the rate-determining step for hydrogen delivery to the UH3-U interface; thus the air-grown oxide forms a partial barrier. Presumably at some point in this scenario the UH3 layer will thicken to an extent where it will become the rate-limiting barrier and consequently after this point parabolic-like kinetics should take over, and this is indeed observed when the temperature is raised to 140 C.
We will discuss further the differences between these two oxide layers below; it should be remembered that the oxide overlayer in the air-grown sample is some 3-4 times thicker than that in the as-deposited sample.
Note that if we plot the intensities on a log plot, Figure 9b), the change in intensity of the -U(110) with the air-grown oxide layer at low doses cannot be observed easily, but this figure does emphasise the considerable change that occurs in the hydriding process when the air-grown sample is heated to 140 C, as well as showing the large differences between the hydriding of the -U(110) and -U(002) crystallites. The differences in consumption rates of -U(110) and -U(002) we also observed in a further sample although these data are not shown in the present paper.
For the air-grown oxide sample (Figure 4) we observe that the intensity of the -U(002) is some 10% of the -U(110), but that the decrease in this reflection with H2 dose is far slower than the -U(110), see Figure 9b).
In considering the differences between these two reflections it is important to consider their respective FWHM values, which are shown expressly in Figure 8. As shown in Figure 8c) on a linear scale the reflections are quite different. The -U(002) intensity is diminished steadily over 80 C, then 140 C, and then 200 C such that it becomes the majority of observed uranium intensity after only a short period at 140 C.
Figure 8 gives information on the vertical (i.e. along the growth direction) size of the crystallites as a function of H2 dosing. In all cases the -U(110) FWHM stays essentially constant as a function of dosing, which is quite different to the -U(002) FWHM, and the latter is obviously much smaller than the former, and does not extend over the whole film. We do not have information on the exact spatial position of the -U(002) crystallites, and it could be that they are near the bottom of the film, which might suggest it takes longer for them to be consumed. However, the constancy of the -U(110) FWHM puts constraints on the type of uranium consumption mechanism that can be considered valid.
Whereas it may be simple to think that the hydriding of uranium occurs here through a lateral hydriding front corroding into the metal grains (i.e. top-down), this does not agree with the evidence, since the crystallite size (probing vertically) does not change markedly during the corrosion. Instead, we must imagine a mechanism where the grains are being corroded without thinning them in a vertical dimension. This evidence then suggests a hypothesis where the uranium is largely consumed from the side, i.e. for instance from a grain boundary. Hydriding of metal at grain boundaries is not a novel idea and examples have been identified in terms of initiation at grain boundaries [14, 15, 16] and also propagation of reaction fronts in the related plutonium-hydrogen reaction [17, 18].
The -U(002) crystallites in the air-grown sample are initially unchanged until a large proportion of the -U(110) is consumed at which point their crystallite size decreases markedly. Given that the oxide is polycrystalline we may assume that the hydrogen may be delivered effectively to many points at the U-UO2 interface, as also demonstrated in Figure 7 where hydrogen is inferred along the U-UO2 interface, and yet corrosion only takes place at a face perpendicular to the U(110) plane.
We can also conclude that the -U(002) faces are also apparently less reactive than some of the planes perpendicular to U(110) (Figure 9), but we should remember that their delay in consumption may also be a function of their location in the film. Presumably the factors that govern the propensity of a given face to react to form UH3 may be related to how easily that uranium face can accommodate significant amounts of hydrogen and the ease with which those local uranium atoms can rearrange to take up a UH3 structure. In addition the reactivity may be inversely related to the hydrogen permeability through that face, because if hydrogen delivered to the U-UH3 interface can be readily dispersed into the metal, then it is less likely to build to a high concentration required to precipitate UH3.These aspects have been considered by Taylor et al. [19], who assumed that -UH3 was the initial product. Further information on this anisotropy can be obtained by future experiments in which a highly epitaxial -U (002) sample can be examined [20]. We have also considered whether there could be a channeling effect. The orthorhombic structure is sufficiently distorted from either bcc or hcp [21] that such channelling seems very unlikely.
A major question in these studies is related to the location of the initial hydride precipitation. The STEM work (Figure 6) shows that the hydride formation is non-crystalline suggesting why we would not observe diffraction peaks at the initial stages of hydriding. The EELS spectroscopy efforts (Figure 7) have indeed shown that there is a layer different from oxide or U metal at the interface, and it is tempting to assign this to a thin layer of UH3, although we have no direct proof.
We had hoped that some evidence for the spatial formation of the hydride might be obtained from X-ray reflectivity studies. Scattering cross sections in X-ray reflectivity are related to the electronic density (electrons per unit volume), and whereas this is 4.44 e/Å3 for U metal, and 2.64 e/Å3 for UO2, the value for the hydride is 2.59 e/Å3, so with X-ray reflectivity the hydride is indistinguishable from the oxide. Neutron reflectivity would be a possibility, provided a large enough sample area can be made, as H and O have quite different scattering amplitudes with neutrons.
The uranium metal reflections are also seen to shift in the diffraction patterns to larger d-spacings (Figures 3b and 5c). For the -U(110) reflection this increase in the d-spacing is around 0.6% (as-deposited oxide) and 0.65% (air-grown oxide); for -U(002) the change is slightly less but over a longer dosing period. Whereas it is tempting to explain this increase in d-spacing in terms of increasing concentration of hydrogen in the uranium lattice such an explanation has to be taken with caution. There is a strong correlation between the d-spacing of the uranium metal with the amount of uranium consumed. This could be attributed to a number of effects, the correct answer of which is not clear from these data. If this effect is caused by hydrogen dissolved in the uranium lattice it is in a dilute regime, full saturation is apparently not achieved.
5.2 Changes in the uranium oxide overlayers
There are differences between the as-deposited and air-grown oxide overlayers and this has a profound influence on how the hydriding reaction unfolds. Compared to the strong UO2(111) reflection the proportion of UO2(200) is around 10% in the as-deposited oxide (Figure 2), and in air-grown oxide (Figure 4), although it initially appears more, it is in fact much lower at around 4%. According to Waber et al. [22] and Chernia et al. [23] a larger fraction would be expected as the texture of UO2 on U-metal is . For a randomly oriented sample the ratio UO2(200)/UO2(111) 1/3, but to determine the exact texture we should also measure the UO2(220), which we have not done in our experiments. No doubt the different textures relate to the fact that the UO2 is deposited (either in the sputtering chamber or by air-growth) on mostly epitaxial flat uranium metal. The oxide overlayers we have produced are textured, probably favoring rather than .
Moreover, whereas in the work by Jones et al. [24], the air-grown oxide crystallites were found to be about 12 nm in extension when grown on polycrystalline uranium, Figure 8 shows that they are 20 nm in the as-deposited sample and as large as 80 nm (in the vertical direction) in the air-grown sample.
In addition to the UO2(111) and UO2(200) described above we observe a reflection at 2 = 32∘ which we assign to a higher UO2+x oxide structure. Higher oxides of UO2 are, of course, well known and studied; a review is given by McEachern and Taylor [25], and more specific information on the diffraction spectra is given by Rousseau et al. [7] – see Figures 5 and 6 in that paper. On the basis of that work we assign the reflection at 32∘ to U3O7(002). Other U3O7 reflections are coincident with those of UO2 reflections and thus difficult to observe, and the 32∘ reflection is observed to disappear with hydrogen dosing over about 3 hours for the as-deposited (P 2-4 mbar, 80 C) and over about 3.5 hours for the air-grown (PH2 16 mbar, 80 then 140 C) as would be expected if U3O7 is reduced to UO2.0. It should be noted that the reduction of U3O7(002) occurs over the same period as uranium is consumed indicating that the presence of U3O7(002) does not appear to impact on the hydriding reaction.
The intensity of the UO2(111) reflection is particularly stable for the as-deposited sample (Figure 3a) with no change throughout the hydrogen exposure experiment. For the air-grown sample the picture is more complex with a slight reduction (Figure 5b) in UO2 intensity with hydrogen exposure. This might be explained in part by the reduction of any U3O7 components of the film although one might expect it to be replaced by UO2.0 intensity; but in any case this points to considerable changes ocurring within the air-grown oxide film over this period.
Consideration of the FWHM of the oxide reflections shows a similar picture with the as-deposited (Figure 8a) showing no changes throughout the dosing experiment and with the air-grown oxide showing considerable change (Figure 8b). The FWHM of the air-grown oxide reflections (see Figure 8b) suggest that the crystallite size of UO2(111) and (200) decrease steadily (by around 50%) as a function of hydrogen dose; this happens over the same period where the UO2(111) intensity is reduced (Figure 5b)) and is independent of the consumption of uranium. The reason for this loss of intensity is not understood but points to some significant changes within the oxide film during this period. All these changes alter the overlayer, breaking it up and forming a structure with smaller crystallites than in the original sample. At the same time a great acceleration is observed in the rate of metal consumption, shown in Figure 9. In future studies some of these films will be examined with microscopic methods – such as TEM – to try to determine the exact nature of the air-grown oxide and how it reacts to temperatures above 100 C.
Finally, analysis of the position of the UO2(111) reflection shows that this d-spacing decreases during hydrogen exposure. The contraction of these d-spacings as a consequence of the hydrogen exposure are significant in size at 0.10% (as-deposited, 0-1.2 min.bar) and 0.38% (air-grown, 0-8 min.bar) and would appear to be independent of whether, or how much uranium (underlying the oxide) has been consumed. Higher temperatures are responsible for greater changes in the d-spacing.
The most likely explanation for the contraction of the d-spacings is the absorption of hydrogen into the UO2 lattice; the change is of an order observed when additional oxygen enters the UO2 lattice to form UO2+x [26]. This thesis is consistent with the decreases in d-spacing and with the temperature dependence of the effect.
This last observation, of a decreasing UO2(111) d-spacing as a result of H2 dosing, is of significance as it provides some evidence at last that hydrogen may enter the UO2 lattice and therefore presumably may traverse it during hydrogen corrosion reactions [1]. We have observed the effect (and the parabolic-like form) with other samples not reported here, and the observation leaves the way open to use the measurement to probe the kinetics of hydrogen introduction into these UO2 films. However, despite providing evidence that the hydrogen is introduced into the UO2 lattice, the cumulative evidence here is that the uranium is almost quantitatively consumed (95% complete) by 0.96 (as-deposited) and 2.2 (air-grown) min.bar early in the reaction and the amount of uranium remaning has no effect on the changing UO2(111) d-spacing. This would suggest that the consumption of uranium is unrelated to the absorption of hydrogen into the oxide overlayer. Given that the oxide overlayer is polycrystalline with grains of the order of 20 nm (as-deposited) and 20-80 nm (air-grown), then we can imagine UO2 grain boundaries as a viable alternative route for hydrogen to enter the metal. Lastly, it is noteworthy that at high doses on the air-grown sample the UO2(200) d-spacing is observed to increase as the UO2(111) decreases and this may provide an indication as to the environment(s) in which the hydrogen resides.
5.3 Observations of UH3
As discussed above, there is overwhelming evidence for consumption of metallic uranium during the hydrogen exposure period; a period where the UO2 XRD reflections do not increase in intensity and indeed the U3O7(002) reflection is removed indicating a reducing environment. However, despite the fact that uranium is consumed the inferred product (either -UH3 or -UH3) has not been observed in the diffraction patterns (Figures 2 and 4). In related work of hydriding exposure of polycrystalline uranium at 80 C (R.M. Harker unpublished) -UH3(210) was readily identified at a d-spacing of 2.99Å( 29.8∘ = 2, slightly expanded from the tabulated value expected at 30.24∘ = 2). In order to be unobservable in the diffraction pattern the compound product would need to be either amorphous or as nanocrystalline as to be effectively amorphous over the XRD length scale.
Transmission Electron Microscopy (Figure 6) of a lift-out foil from a sample exposed to a 10 min.bar hydrogen dose confirms that a compound (presumably UH3) distinct from the oxide is formed in this thin film system, and also confirms that this product is amorphous.
This supports the view that precipitated UH3 in these studies may be unobservable on account of its level of crystallinity. Nanocrystalline -UH3 was recently observed in a hydrided U-Mo0.18 alloy where the product was non-crystalline by XRD but grain sizes of 1-2 nm were determined using Partial Distribution Function analysis [27, 28]. UHx has also been observed when H2O reacts with uranium metal [29] showing that various stoichiometries can exist at the interface between metal and oxide.
6 Conclusions
Grains of -U(110) are consumed at a faster rate than the minor component grains of -U(002). The rate of consumption of -U(110) in as-deposited oxide at 80 C follows a logarithmic law (Figure 9b)) indicating the generation of an adherent UH3 ‘barrier’ that slows subsequent hydriding. The consumption of -U(110) in air-grown oxide is both slower and approximately linear at 80 C. However, when the temperature is increased with the air-grown oxide layer to above 100 C there is a very rapid consumption of uranium (Figure 9). The available evidence (from changes in the FWHM/inferred crystallite size) suggests that the -U(110) grains are not thinned appreciably in the vertical direction during uranium consumption (Figure 8b)) suggesting a face perpendicular to U(110) is rapidly consumed in these samples as compared to the U(110) face. This leads to a model of consumption in this system of grain-boundary corrosion with the corrosion interface moving laterally into the grains. A consequence of the consumption of uranium is a proportional increase in the d-spacing of U(110), and to a lesser extent the U(002), in the direction of film thickness.
There are considerable differences in the as-deposited and air-grown oxides in these samples and this is responsible for profound differences in how the samples react with hydrogen. Minor reflections of U3O7(002) are removed during the hydrogen exposure at temperature but this does not appear to impact on the uranium corrosion rates. Also there appears to be considerable changes in the air-grown oxide overlayer when heated to 140 C as indicated by changes in the intensity and FWHM of UO2(111) and UO2(200). Finally, there is considerable evidence for a contraction of the UO2(111) d-spacings during H2 exposure providing evidence of hydrogen absorption into the UO2 lattice; the contractions are parabolic-like with higher temperatures resulting in faster rates and greater extent of change. This provides evidence that hydrogen may enter the UO2 lattice and may thereby traverse the oxide in this way. However this mechanism of hydrogen transport across the oxide appears to not be dominant in this system as the changes in oxide d-spacings change over a longer timescale than is seen for uranium consumption.
Interrogation of these thin film samples by synchrotron X-radiation provides a powerful tool to understand the changes ocurring in the metal and oxide components of this model system.
7 Acknowledgments
AWE is thanked for the supply of low carbon uranium metal material for use as magnetron sputtering target. The authors thank the EPSRC grant code EP/K040375/1 ‘South of England Analytical Electron Microscope’. This work was undertaken in part due to the funding of the DISTINCTIVE consortium EP/L014041/1. We thank Patrick Colomp and the Radiation Protection Group at the ESRF for cooperation during our experiments, Tom Scott of Bristol for his support and encouragement. Additional thanks for Peter Morrall and James Petherbridge for comments on the manuscript.
8 Appendix
| Thickness(nm) | |||
| Sample | Metal | Oxide | Figures |
| As-deposited | 70(5) | 20(5) | 2, 3, 8, 9 |
| Air-grown | 80 | 80 | 4, 5, 8, 9 |
| STEM | 45 | 1 | 6 |
| EELS | 30(5) | 30(5) | 7 |
9 References
References
- [1] Joseph Glascott. A model for the initiation of reaction sites during the uranium hydrogen reaction assuming enhanced hydrogen transport through thin areas of surface oxide. Philosophical Magazine, 94(3):221–241, 2014.
- [2] Robert M. Harker. The influence of oxide thickness on the early stages of the massive uranium hydrogen reaction. Journal of Alloys and Compounds, 426(1):106 – 117, 2006.
- [3] Robin Orr, Hugh Godfrey, Chris Broan, Dave Goddard, Guy Woodhouse, Peter Durham, Andrew Diggle, and John Bradshaw. Formation and physical properties of uranium hydride under conditions relevant to metallic fuel and nuclear waste storage. Journal of Nuclear Materials, 477(Supplement C):236 – 245, 2016.
- [4] Joseph Glascott. Hydrogen and uranium; interactions between the first and last naturally occurring elements. Discovery, The Science and Technology of AWE, 6:16 – 27, 2003.
- [5] R C C Ward, R A Cowley, N Ling, W Goetze, G H Lander, and W G Stirling. The structure of epitaxial layers of uranium. Journal of Physics: Condensed Matter, 20(13):135003, 2008.
- [6] S. D. Brown, L. Bouchenoire, D. Bowyer, J. Kervin, D. Laundy, M. J. Longfield, D. Mannix, D. F. Paul, A. Stunault, P. Thompson, M. J. Cooper, C. A. Lucas, and W. G. Stirling. The XMaS beamline at ESRF: instrumental developments and high-resolution diffraction studies. Journal of Synchrotron Radiation, 8(6):1172–1181, 2001.
- [7] G. Rousseau, L. Desgranges, F. Charlot, N. Millot, J.C. Ni pce, M. Pijolat, F. Valdivieso, G. Baldinozzi, and J.F. B rar. A detailed study of UO2 to U3O8 oxidation phases and the associated rate-limiting steps. Journal of Nuclear Materials, 355(1):10 – 20, 2006.
- [8] D.G Martin. The thermal expansion of solid UO2 and (U, Pu) mixed oxides a review and recommendations. Journal of Nuclear Materials, 152(2):94 – 101, 1988.
- [9] Lowell T. Lloyd and C.S. Barrett. Thermal expansion of alpha uranium. Journal of Nuclear Materials, 18(1):55 – 59, 1966.
- [10] Claude Degueldre, Robin Schaeublin, Julijana Krbanjevic, and Eugenia Minikus. Electron energy loss spectroscopy investigation through a nano ablated uranium dioxide sample. Talanta, 106:408 – 413, 2013.
- [11] Claude Degueldre and Evgeny V. Alekseev. Uranium trioxide behavior during electron energy loss spectroscopy analysis. Radiation Physics and Chemistry, 108:7 – 12, 2015.
- [12] Kevin T. Moore and Gerrit van der Laan. Accurate labeling of the light-actinide O4,5 edges. Ultramicroscopy, 107(12):1201 – 1206, 2007.
- [13] R. M. Alire, B. A. Mueller, Charles L. Peterson, and John R. Mosley. Reaction kinetics of uranium and deuterium. The Journal of Chemical Physics, 52(1):37–46, 1970.
- [14] T. B. Scott, G. C. Allen, I. Findlay, and J. Glascott. UD3 formation on uranium: Evidence for grain boundary precipitation. Philosophical Magazine, 87(2):177–187, 2007.
- [15] N.J. Harker, T.B. Scott, C.P. Jones, J.R Petherbridge, and J. Glascott. Altering the hydriding behaviour of uranium metal by induced oxide penetration around carbo-nitride inclusions. Solid State Ionics, 241(Supplement C):46 – 52, 2013.
- [16] Christopher P. Jones, Thomas B. Scott, James R. Petherbridge, and Joseph Glascott. A surface science study of the initial stages of hydrogen corrosion on uranium metal and the role played by grain microstructure. Solid State Ionics, 231:81–86, 2013.
- [17] Martin Brierley, John Philip Knowles, Andrew Sherry, and Michael Preuss. The anisotropic growth morphology and microstructure of plutonium hydride reaction sites. Journal of Nuclear Materials, 469:145 – 152, 2016.
- [18] L.N. Dinh, J.M. Haschke, C.K. Saw, P.G. Allen, and W. McLean. Pu2O3 and the plutonium hydriding process. Journal of Nuclear Materials, 408(2):171 – 175, 2011.
- [19] Christopher D. Taylor, Turab Lookman, and R. Scott Lillard. Ab initio calculations of the uranium hydrogen system: Thermodynamics, hydrogen saturation of -U and phase-transformation to UH3. Acta Materialia, 58(3):1045 – 1055, 2010.
- [20] R. Springell, R. C. C. Ward, J. Bouchet, J. Chivall, D. Wermeille, P. S. Normile, S. Langridge, S. W. Zochowski, and G. H. Lander. Malleability of uranium: Manipulating the charge-density wave in epitaxial films. Phys. Rev. B, 89:245101, 2014.
- [21] J.D. Axe, G. Grübel, and G.H. Lander. Structure and phase transformations in uranium metal. Journal of Alloys and Compounds, 213:262 – 267, 1994.
- [22] J. T. Waber, J. A. O’Rourke, and R. Kleinberg. Oriented dioxide films on uranium. J. Electrochem. Soc., 106(96), 1959.
- [23] Z. Chernia, Y. Ben-Eliyahu, G. Kimmel, G. Braun, and J. Sariel. The initial stage of uranium oxidation: Mechanism of UO2 scale formation in the presence of a native lateral stress field. The Journal of Physical Chemistry B, 110(46):23041–23051, 2006.
- [24] Christopher P. Jones, James R. Petherbridge, Sean A. Davis, Jonathon A. Jones, and Thomas B. Scott. The crystallographic structure of the air-grown oxide on depleted uranium metal. Corrosion Science, 111:486 – 493, 2016.
- [25] R.J. McEachern and P. Taylor. A review of the oxidation of uranium dioxide at temperatures below 400C. Journal of Nuclear Materials, 254(2):87 – 121, 1998.
- [26] C.A. Colmenares. Oxidation mechanisms and catalytic properties of the actinides. Progress in Solid State Chemistry, 15(4):257 – 364, 1984.
- [27] I. Tkach, S. Mašková, Z. Matěj, N.-T. H. Kim-Ngan, A. V. Andreev, and L. Havela. Ferromagnetism with K in the amorphous compound UH3Mo0.18. Phys. Rev. B, 88:060407, 2013.
- [28] Ladislav Havela, Mykhaylo Paukov, Ilya Tkach, Volodymyr Buturlim, Zdenek Matej, Silvie Maskova, Ilja Turek, Martin Divis, Daria Drozdenko, Miroslav Cieslar, and et al. Strong 5f ferromagnetism in uh3-based materials. MRS Advances, 1(44):2987– 2992, 2016.
- [29] T. L. Martin, C. Coe, P. A J Bagot, P. Morrall, G. D W Smith, T. Scott, and M. P. Moody. Atomic-scale Studies of Uranium Oxidation and Corrosion by Water Vapour. Scientific Reports, 6(April):1–10, 2016.