Direct simulation of liquid-gas-solid flow with a free surface lattice Boltzmann method
Abstract
Direct numerical simulation of liquid-gas-solid flows is uncommon due to the considerable computational cost. As the grid spacing is determined by the smallest involved length scale, large grid sizes become necessary – in particular if the bubble-particle aspect ratio is on the order of 10 or larger. Hence, it arises the question of both feasibility and reasonability. In this paper, we present a fully parallel, scalable method for direct numerical simulation of bubble-particle interaction at a size ratio of 1-2 orders of magnitude that makes simulations feasible on currently available super-computing resources. With the presented approach, simulations of bubbles in suspension columns consisting of more than fully resolved particles become possible. Furthermore, we demonstrate the significance of particle-resolved simulations by comparison to previous unresolved solutions. The results indicate that fully-resolved direct numerical simulation is indeed necessary to predict the flow structure of bubble-particle interaction problems correctly.
keywords:
lattice Boltzmann method; free surface flow; particle suspension simulation; liquid-gas-solid flow; bubble simulation1 Introduction
Due to the computational complexity of fluid-solid and liquid-gas-solid flow problems, numerical solutions are usually based on homogenized models (Pan et al., 2016; Panneerselvam, Savithri, and Surender, 2009; Li and Zhong, 2015). Homogenized models do not resolve all involved scales and model the phase interaction based on closure relations (drag correlations) instead. The closure relations, in turn, are obtained from experiments, or – with the advent of high-speed computers – by direct numerical simulation (DNS) of systems of smaller size. DNS techniques allow the most accurate predictions by resolving even the smallest relevant length scales. For fluid-solid, particulate flows the smallest typical length scale is the particle diameter. For the case of fluid-solid flows, new drag correlations have been derived from numerical data (Beetstra, van der Hoef, and Kuipers, 2007; Tenneti, Garg, and Subramaniam, 2011; Bogner, Mohanty, and Rüde, 2014; Tang et al., 2015). Also, DNS has helped to investigate the behavior of particle suspensions and to study hydrodynamic interaction in particulate flows (Aidun and Clausen, 2010; Tenneti and Subramaniam, 2014) in full detail. Due to computational costs, the system sizes that can be realized by DNS are limited compared to unresolved and homogenized models. Nevertheless, DNS is an important tool that allows the study of flow structures in every detail, and provides the most accurate solutions.
To date, only few direct numerical simulation models for liquid-gas-solid flows (LGS) can be found in literature. A numerical method for this class of flows must combine a two-phase flow solver (Scardovelli and Zaleski, 1999; Tryggvason, Scardovelli, and Zaleski, 2011) with a structural solver for the suspended solid phase. Most LGS simulation approaches (Li, Zhang, and Fan, 1999; Chen and Fan, 2004; van Sint Annaland, Deen, and Kuipers, 2005b; Xu, Liu, and Tang, 2013; Sun and Sakai, 2015; Li and Zhong, 2015) do not fully resolve the particle geometry within the flow. This means that hydrodynamic interaction between particles cannot be captured fully in these models which thus do not count as DNS models according to the narrower definition applied here. Nevertheless, these approaches make use of discrete particle methods (Bićanić, 2004; Deen et al., 2007) to resolve particle-particle collisions. The first models to resolve both bubble and particle geometries have been presented by Deen, van Sint Annaland, and Kuipers (2009) and Baltussen et al. (2013). These DNS models combine a front-tracking liquid-gas method with an immersed boundary approach (Mittal and Iaccarino, 2005) to couple the flow with the particle simulation. Recently, the same group applied their methodology to study the effective drag on bubbles and particles in liquid flow (Baltussen, Kuipers, and Deen, 2017). Presumably due to computational limitations, the simulated systems contain bubbles and particles of similar size only. In many situations of practical relevance, however, the particle size is much smaller than the bubble size. Alternatively, there are efforts to combine diffusive multiphase models with particle models (Stratford et al., 2005; Jansen and Harting, 2011; Joshi and Sun, 2009). These DNS models work with fully resolved particles, but additional limitations arise from the necessity to resolve also the liquid-gas interface – especially at a high density difference. The density ratio is on the order of in these models, which is much smaller than the density ratio of most liquid-gas two-phase flows. Only recently, Connington2015 have reached high density ratios for special cases.
In the following, we present a DNS model for liquid-gas-solid flow that allows the simulation of bubble-particle interaction in containing liquid. The model is based on the free surface lattice Boltzmann method (FSLBM) of (Körner et al., 2005) for high liquid-gas density ratios combined with the particulate flow model of (Ladd, 1994; Ladd and Verberg, 2001). Based on a previous effort (Bogner and Rüde, 2013), we have developed a model that is inherently parallel and allows bubble sizes one order of magnitude larger than the particle size while still fully resolving the single particle geometries. Since the grid spacing must be smaller than the particle diameter, the total number of lattice sites is necessarily large and the computational cost is considerable. Therefore, the model is implemented based on a parallel software framework (Feichtinger et al., 2011), that has already been used to realize massively parallel simulations of suspensions (Götz et al., 2010) and bubbly flows (Donath et al., 2009). The new liquid-gas-solid model enables detailed studies of particle transport in the wake of rising bubbles. We demonstrate that our model is capable of predicting important suspension properties, such as increased effective viscosity with solid volume fraction correctly. The terminal rise velocity of a gas bubble decreases accordingly in simulations. Furthermore, we validate the free surface model for different bubble regimes according to the classification of Grace (spherical, ellipsoidal, skirted, dimpled), and present examples of particle transport and mixing in the wake of a single rising bubble for the different regimes. The cost of the DNS is considerable. However, a comparison of the results to previous unresolved simulations indicates the necessity of DNS to predict the full characteristics of the flow and the induced particle transport.
2 Method
In the following, we use a hybrid method based on the free surface lattice Boltzmann method (FSLBM) of Körner et al. (2005) and the particulate flow model of Ladd (1994); Ladd and Verberg (2001). The computational domain is subdivided into the three disjoint regions, corresponding each to the space occupied by liquid, gas, or solid phase, respectively.
2.1 Hydrodynamic Lattice Boltzmann Model
To solve the hydrodynamic equations for the liquid region, we use a DQ lattice Boltzmann model (Wolf-Gladrow, 2005; Qian, d’Humieres, and Lallemand, 1992) on a Cartesian grid. The lattice velocities are denoted by with and have units of grid spacing per time step . The data with of the scheme is also called particle distribution function (PDF). The lattice Boltzmann equation of the model can be written as,
| (1a) | ||||
| (1b) | ||||
where has been substituted, and is referred to as the post-collision state. The upper-indices “/” denote the even/odd parts of the respective function. The right hand side of Eq. 1b corresponds to the two relaxation time collision operator of Ginzburg, Verhaeghe, and d’Humieres (2008), with the odd and even eigenvalues . These eigenvalues thus control the relaxation of the even and odd parts of the non-equilibrium,
| (2) |
defined as the deviation from the equilibrium function , given as the polynomial
| (3) |
where the , , are a set of lattice weights, and the constant is called the lattice speed of sound. The macroscopic flow variables of pressure and velocity are moments of the PDF, that is,
| (4a) | ||||
| (4b) | ||||
It can be shown that the velocity field is a second order accurate solution to the incompressible Navier-Stokes equations (Frisch et al., 1987; Holdych et al., 2004; Junk, Klar, and Luo, 2005) with kinematic viscosity
| (5) |
While the first relaxation parameter is chosen according to the desired flow viscosity, the second parameter is fixed to satisfy the equation,
| (6) |
This “magic” parameterization is optimal for straight axis aligned wall boundaries (Ginzbourg and Adler, 1994), and yields viscosity independent solutions in general geometries (Ginzburg and d’Humieres, 2009).
2.2 Free Surface Lattice Boltzmann Method (FSLBM)
The FSLBM is an interface capturing scheme that is based on the volume of fluid (Hirt and Nichols, 1981; Tryggvason, Scardovelli, and Zaleski, 2011) approach. The fill level or volume fraction serves as indicator function. For each node , the fill level is defined as the volume fraction of liquid within the cubic cell volume around . Figure 1 shows that three different types of cells can be distinguished:
-
•
: the set of gas nodes, where .
-
•
: the set of liquid nodes, where .
-
•
: the set of interface nodes, where . An interface node always has a liquid neighbor and a gas neighbor for some .
The nodes in are active lattice Boltzmann nodes. Introducing further the set of obstacle nodes that are not part of the fluid domain (e.g., walls or nodes that are blocked out by particles), forms the set of inactive nodes within the simulation domain.
The set of interface nodes is exactly the set of boundary nodes that possess a neighbor in the gas subdomain. If an interface node has a gas neighbor , then the boundary condition of Körner et al. (2005),
| (7) |
is applied for the opposite direction with . Here, defines the boundary value for pressure, and represents the flow velocity at the boundary. It can be shown that Eq. 7 yields a first order approximation of a free boundary (Bogner, Ammer, and Rüde, 2015).
The interface capturing scheme is updated according to the flow simulation in every time step. The indicator function is updated directly from the lattice Boltzmann data.
| (8a) | |||
| with the direction-dependent exchange mass | |||
| (8b) | |||
The sets , , and are updated according to the rules illustrated in Fig. 2, where each arrow corresponds to a possible state transition: The transitions between gas, liquid, and interface state, are triggered according to the fill levels of the interface cells. Whenever the fill level of an interface cell becomes equal to 0 (equal to 1), then a conversion into a gas cell (liquid cell) is triggered. If needed, inverse transitions from liquid (gas) into interface state are performed in order to close the layer of interface cells. If a gas node changes to interface state, then its LBM data is initialized based on the equilibrium, Eq. 3. Details can be found in Körner et al. (2005) and in (Bogner and Rüde, 2013) for moving particles.
Since the flow of the gas phase is not simulated in the free surface model, a special treatment of the individual bubbles, i.e., connected regions of gas, is necessary (cf. Anderl et al., 2014; Caboussat, 2005; Körner et al., 2005). Such a bubble model conserves the mass in the gas phase and provides the local gas pressure needed to define the boundary condition Eq. 7.
For the simulation of capillary flows, the Laplace pressure jump across the interface can be included in Eq. 7. The boundary value for the pressure is then
| (9) |
where is the pressure in the gas bubble and is the local curvature of the interface. Following Brackbill, Kothe, and Zemach (1992), the curvature can be computed from the fill levels, based on the equations,
| (10a) | |||
| (10b) |
To evaluate these expressions, we use an optimized finite difference scheme according to Parker and Youngs (1992). At the solid particles, perfect wettability is assumed. Further details and alternative curvature computation schemes can be found in Cummins2005; Popinet2009; Bogner, Rüde, and Harting (2016).
2.3 Particulate Flow Simulation
Each (spherical) particle is defined by its radius , specific density , and a Lagrangian description consisting of position , velocity , and angular velocity . Any grid node inside of a particle is called obstacle node. Whenever a liquid node is next to an obstacle node covered by particle , then the bounce-back rule with velocity term,
| (11) |
is used to impose the particle surface velocity,
| (12) |
at the boundary. In Eq. 11, is substituted with the density value of the boundary point from the previous time step.
For the time integration of the particle data, the hydrodynamic force and torque are computed from the lattice Boltzmann data. Based on the momentum exchange principle, one computes
| (13) | ||||
| (14) |
where
| (15) |
is used to approximate the momentum transferred along a single boundary-intersecting link at a boundary node (Ladd, 1994; Ladd and Verberg, 2001). In Eqs. 13 and 14, the set is the set of all nodes surrounding the particle with a nonempty set of particle surface intersecting links. If contains lattice nodes on the inside of another particle, the equilibrium distribution is assumed in Eq. 15.
The hydrodynamic lubrication forces obtained by Eq. 13 are valid only if the gap between two particles , is sufficiently resolved. Hence, if the gap size becomes smaller than , then a lubrication correction,
| (16) |
is added to the net force , where is the relative position of the particles (Ladd and Verberg, 2001). Here, is the dynamic viscosity. This improves the simulation of hydrodynamic interaction between particles (Aidun and Clausen, 2010). Since Eq. 16 diverges for , the gap size is limited from below to be at least . Furthermore, to increase stability at higher solid volume fractions, the time integration of the particles proceeds in up to time steps per LBM step.
3 Validation of the Numerical Model
The simulations of bubbles in moderately dense suspensions and bubble-particle interaction are found in Sec. 4. Here, we first validate the correct behavior of solid-liquid suspension simulations (Sec. 3.1) and gas-liquid simulations (Sec. 3.2) with our model.
3.1 Validation of Particle Suspension Model
It has been demonstrated in the past that the LBM is valid in the simulation of particle suspensions, e.g., Aidun and Clausen (2010); Ladd and Verberg (2001); Harting et al. (2014); Kromkamp et al. (2006). Here, we reproduce as validation experiment the relative shear viscosity of a spherical particle suspension in a shear flow between plates. Similar to Kromkamp et al. (2006), a domain is initialized with a random particle bed of spherical particles of radius and specific density . The domain size is fixed to , altering to realize different solid volume fractions
| (17) |
where is the particle volume. The flow is initially at rest, and driven by imposing a constant velocity on the boundary planes at and in opposed directions, while applying periodicity along and directions. The effective viscosity of the numerical suspension model is evaluated by measuring the net force on the boundary walls,
| (18) |
where is the shear rate. The resulting force values oscillate due to non-trivial interaction between particles, and must be averaged over a number of time steps (typically ). The (particle) Reynolds number is defined as
| (19) |
where is the fluid density. In Bogner (2017), the same setup was repeated with various solid volume fractions and Reynolds numbers. As shown in Fig. 3, the model correctly predicts the expected increase of effective viscosity with increased solid volume fraction and Reynolds number. Figure 3(a) also displays the empirical correlation of Eilers (Stickel and Powell, 2005),
| (20) |
where is assumed as the maximal packing fraction for random sphere packings.
3.2 Validation of Free Surface Model
The FSLBM described in Sec. 2.2 has been validated for the case of single rising bubbles in liquid columns in Bogner (2017), from which the following results are adopted. The behavior of single rising bubbles in a quiescent (infinite) liquid is characterized by three dimensionless numbers (Clift, Grace, and Weber, 1978; Fan and Tsuchiya, 1990). The Morton number is defined as
| (21) |
where is the gravitational constant, and are the viscosity and density of the surrounding liquid, and is the density difference of gas and liquid. The Eötvös number,
| (22) |
where is the diameter of the bubble, characterizes the ratio of buoyancy and surface tension forces. Finally, the bubble Reynolds number is defined as
| (23) |
where is the terminal rise velocity of the bubble. The bubble diameter is understood as the diameter of a volume-equivalent spherical bubble, unless otherwise noted. Based on Grace (1973), the behavior of gas bubbles rising in a liquid column can be classified and allows a prediction of the bubble shape, e.g., spherical, ellipsoidal, spherical cap, skirted, dimpled, etc., or can be used to estimate the terminal rise velocity of the bubble, if and are given. Alternatively, one can work with the correlation of Fan and Tsuchiya (1990),
| (24) |
where is the nondimensional rise velocity. Velocity and diameter are made nondimensional using
| (25) |
In Eq. 24, the parameters , , and , are chosen to account for special material properties not covered by , , and . The parameter ranges from to depending on the liquid purity, while is chosen as (single-component liquid) or (multi-component liquid). The value of is adapted as
| (26) |
where depends on the liquid (e.g., for water). Like the Grace diagram, correlation Eq. 24 is obtained from experimental data, and can predict with an error of about .
| case | |||||||
|---|---|---|---|---|---|---|---|
| A (spherical) | 0.25 | 0.145 | 0.981 | ||||
| B (ellipsoidal) | 0.42 | 0.145 | 9.81 | ||||
| C (skirted) | 0.13211 | 0.014545 | 9.81 | ||||
| D (dimpled) | 0.75 | 0.014545 | 9.81 |
van Sint Annaland, Deen, and Kuipers (2005a) suggest four different bubble regimes for the validation of a two-phase volume of fluid solver, that are used as a reference in the following. The and numbers used in the following simulations (Table 1) have been chosen to represent the test cases suggested by van Sint Annaland, Deen, and Kuipers (2005a). In this reference, the surface tension modeling is based on Brackbill, Kothe, and Zemach (1992), similar to our finite difference model. The authors suggest free-slip boundary conditions for all lateral directions, no-slip at the bottom, and a pressure boundary at the top of the domain. A sketch of the domain and initial conditions is shown in Fig. 4. The fluid parameters for the simulation collected in Tab. 1 are given with respect to a liquid of density . The grid spacing is and the time step is . As a compromise between computational cost and influence of the finite domain size on the bubble dynamics, a domain size of nodes is recommended by the authors. Here, we directly adopt the resolution and the domain size of the original. The initial condition consists of a spherical bubble of centered around the position in a column of quiescent liquid.
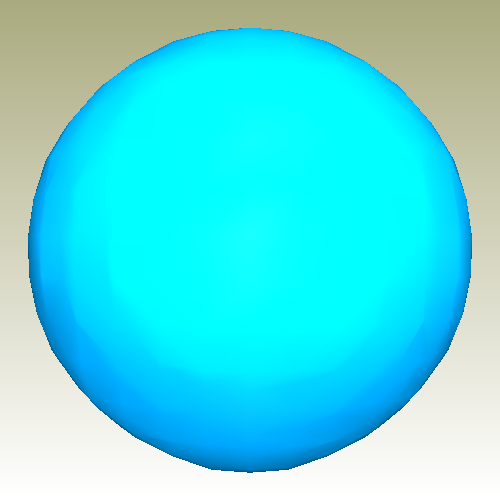
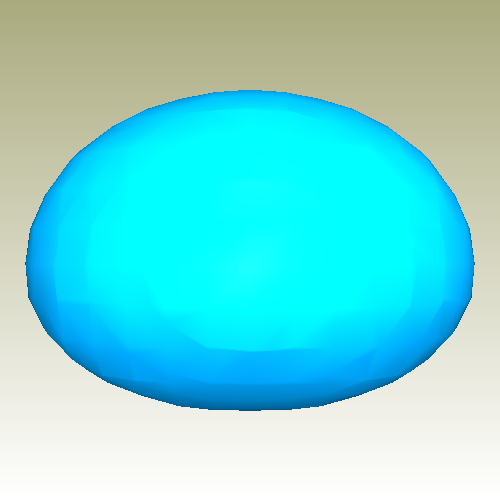
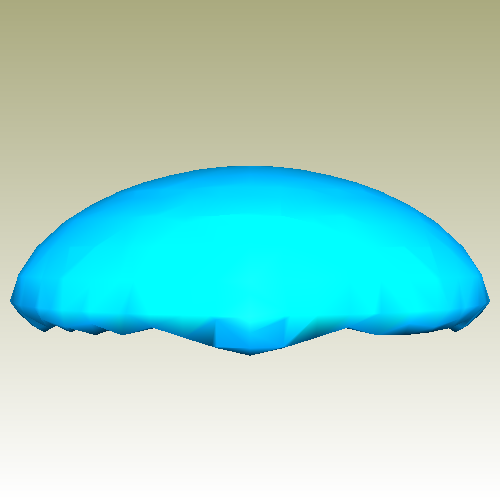
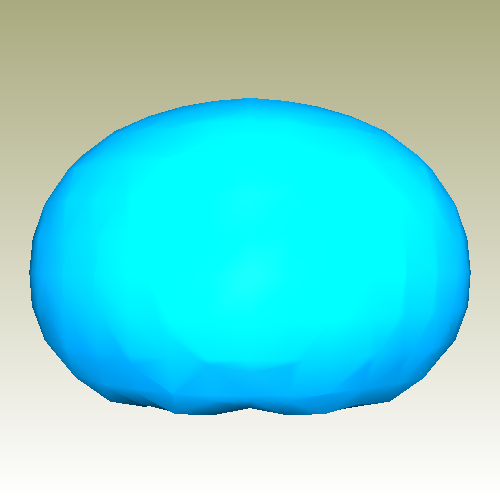
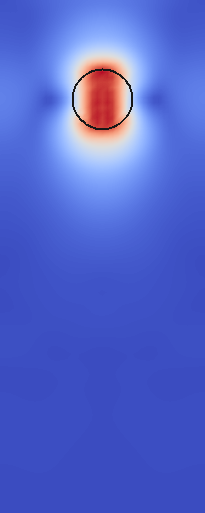
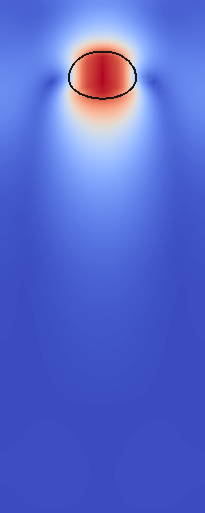
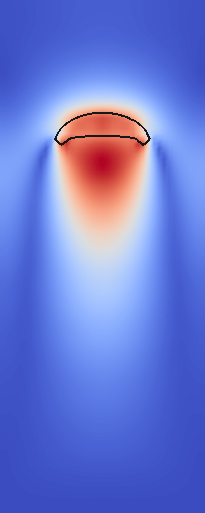
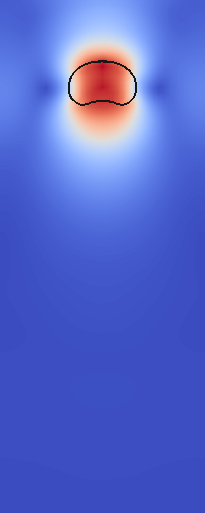
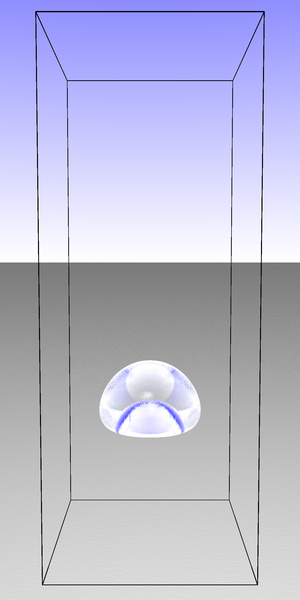
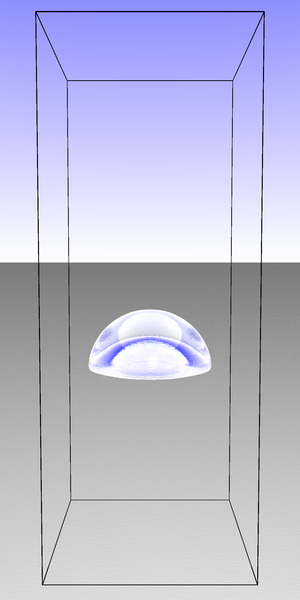
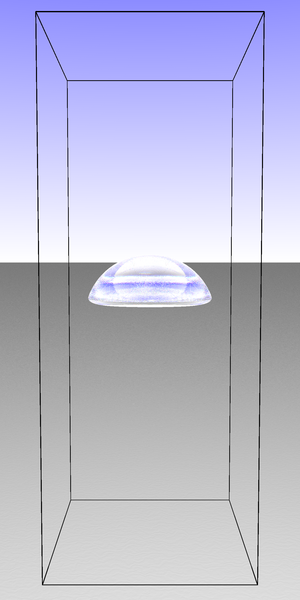
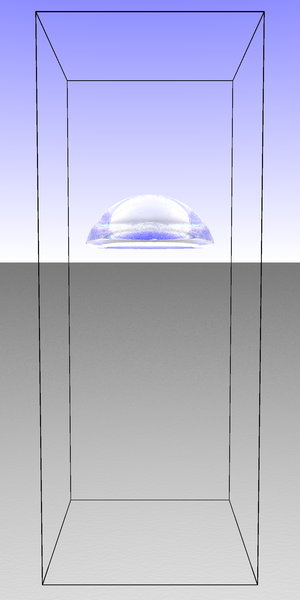
For , the initially spherical bubble starts to accelerate due to the pressure gradient until it reaches a terminal velocity and the bubble shape does not change any more. Figure 5 shows the simulated bubble shapes using a triangulation of the smoothed indicator function contour surface . For each case, the simulated bubble shape agrees well with the predictions according to the Grace diagram. The velocity field around the bubble is shown in Fig. 6. As reported also by van Sint Annaland, Deen, and Kuipers (2005a), the terminal velocities obtained from simulations agree reasonably well with the predictions of experimental relations. Table 1 lists the simulated terminal Reynolds number in comparison to the prediction according to Eq. 24.
4 Results
4.1 Bubble Particle Interaction
We now study cases of bubble-particle interaction. Again, the basic setup consists of a liquid column containing a single bubble of radius rising within a bed of spherical particles of radius . Using a grid spacing of , the size of the computational domain is lattice cells surrounding the initially spherical bubble at . This means that each particle is resolved by lattice cells per diameter. The surface tension is and the gravity is assumed to be , such that the spherical bubble regime is expected, in a fluid of density is and viscosity . Within the liquid column, a homogeneous particle bed is initialized by choosing random positions. The bed density varies with the particle number ,
| (27) |
where is the particle volume and is the bubble volume. The solid mass density is . At the given bubble-particle size ratio, the liquid-solid system surrounding the bubble can be viewed as a homogeneous medium of increased density and viscosity. Notice, that the effective time scale of particle sedimentation is low compared to the expected rise velocity of the bubble.
In a series of simulations the bubble is released within the particle bed, and the terminal rise velocity depending on the bed solid volume fraction is evaluated. Figure 7 shows the decrease of bubble velocity with increased bed density. Due to the presence of the particles, the average mass density of the particle suspension around the bubble increases, and the buoyancy force on the bubble is increased. This explains the small increase in velocity from to solid volume fraction. More significantly, with higher solid volume fraction, the higher effective viscosity of the suspension reduces the terminal velocity reached. This is in agreement with experiments from literature, that reports a decreasing rise velocity with increased suspension thickness (Tsuchiya et al., 1997).
We remark that the model is currently limited to low solid volume fractions. For the spatial resolution applied in this work, solid volume fractions of often developed instabilities and nonphysical behavior. The reason seems to be the distribution of particles next to the liquid-gas interface that can make the free-surface algorithm ineffective by covering the cells containing the liquid-gas interface. This is currently a limitation of the model, which might be improved by altering the surface tension model to satisfy the perfect wettability of particles more accurately.
4.2 Simulation of Bubble-Induced Particle Mixing
The particle bed is now limited to the range that includes the initially spherical bubble. We assume a liquid density of , viscosity , liquid-gas surface tension , and a gravity along the -axis. Choosing the time step as , the lattice relaxation time becomes . The dimensionless numbers for the bubble are and , with an expected terminal Reynolds number according to Eq. 24 (with , ). This setup has been chosen similar to a test case of Deen, van Sint Annaland, and Kuipers (2007).
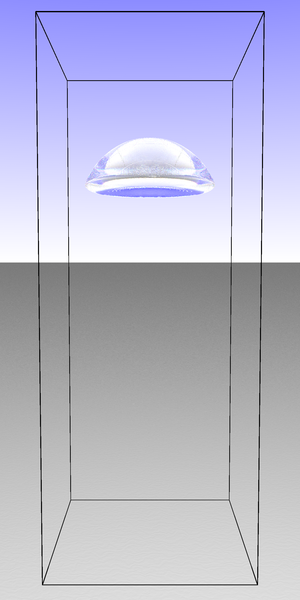
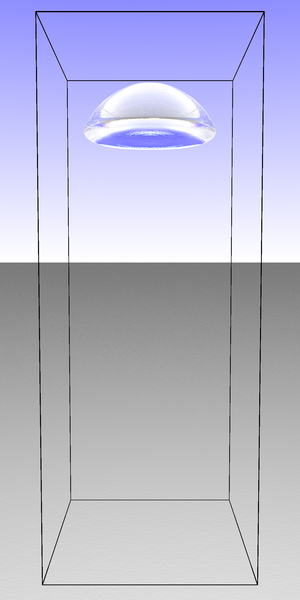
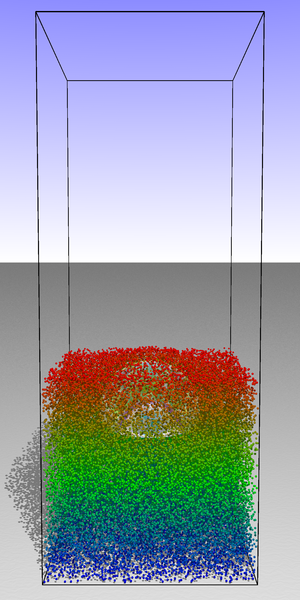
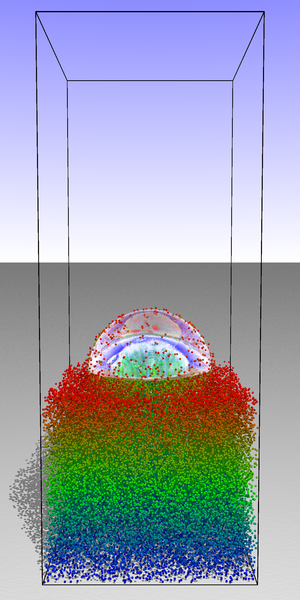
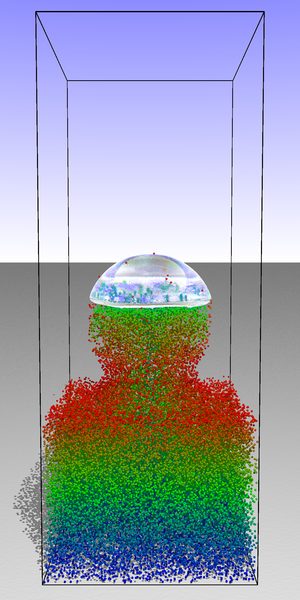
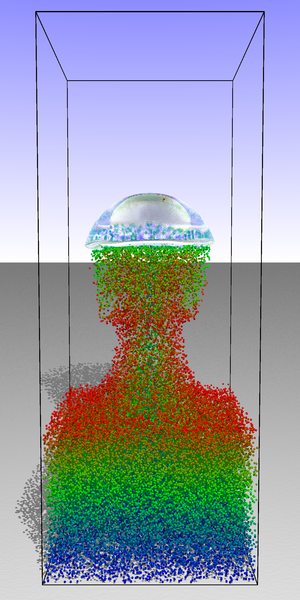
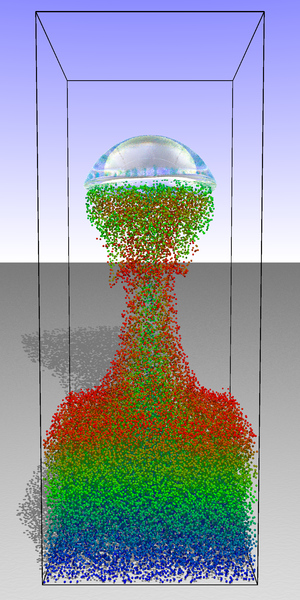
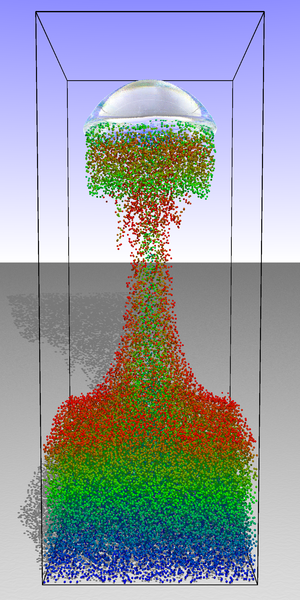
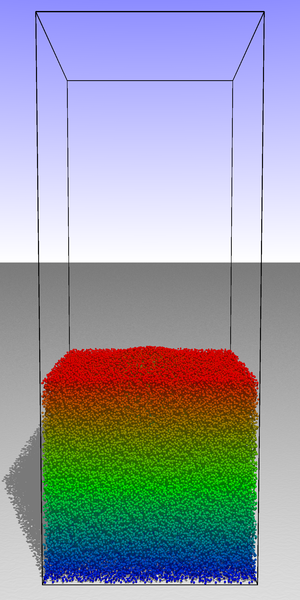
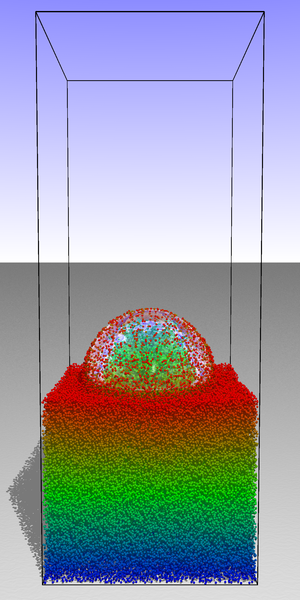
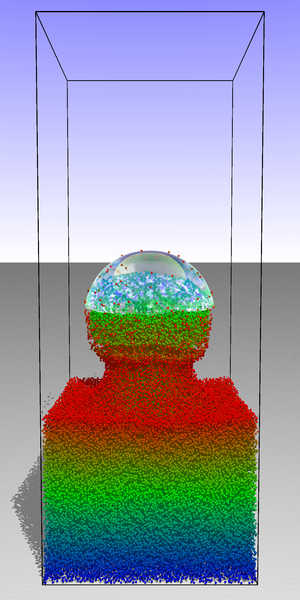
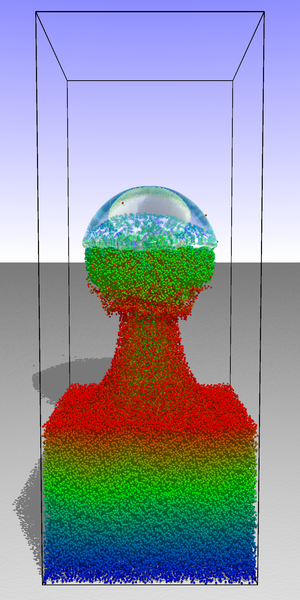
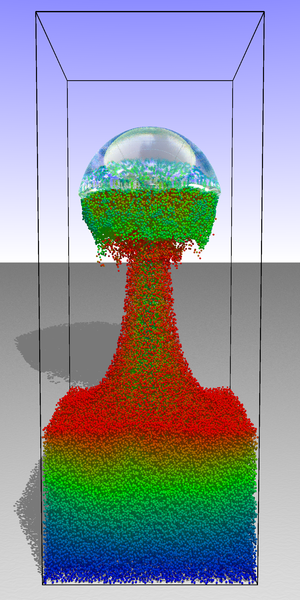
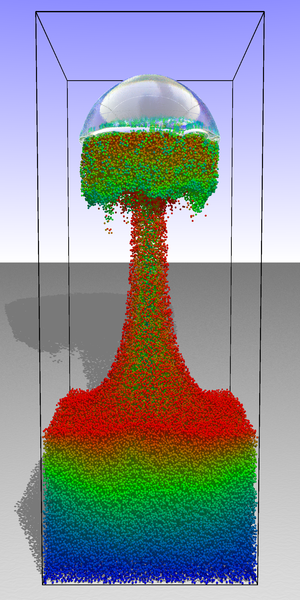
Without any particles (), the terminal rise Reynolds number obtained from simulations is . Again, the lower velocity can be attributed to wall effects. Figures 8, 9 and 10 show the process without particles and at bed densities and . The terminal rise velocity is hardly affected by the presence of the particles in this case, after the top of the bubble is uncovered from particles. In these images, the particle color indicates the initial - position of the particle, to show the mixing of different bed layers in the wake of the bubble. A circulating motion is observable in the wake of the bubble. This effect seems to be absent in the unresolved simulations of Deen, van Sint Annaland, and Kuipers (2007), where the recirculation region seems to have no influence on the particles. Also a large number of particles from the middle and lower layer of the bed are carried in the wake of the bubble. That is, we can observe substantial changes in the relative positions of particles during the mixing process.
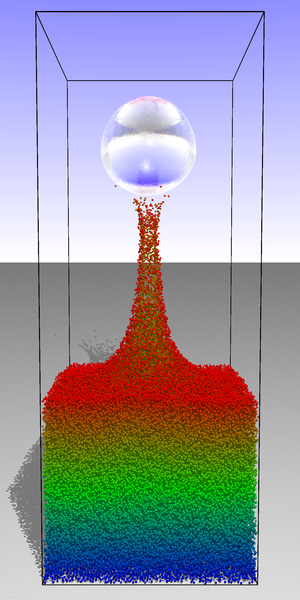
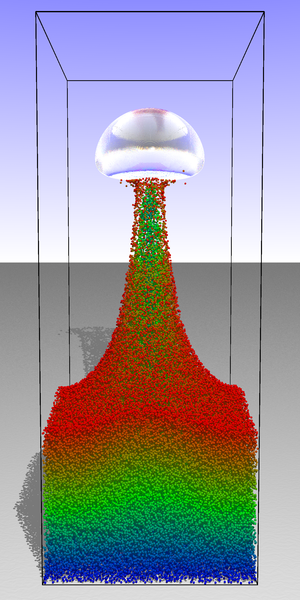
Figure 11 shows the same setup with altered fluid properties corresponding to different bubble regimes. The wake and particle structure differs significantly in the different regimes. The bubble wake is strongest for the skirted regime that generates the largest recirculation region that also displays the highest solid mass transport. At the other extreme, we find that the spherical case has the least mixing effect and generates only a thin cone of lifted particles.
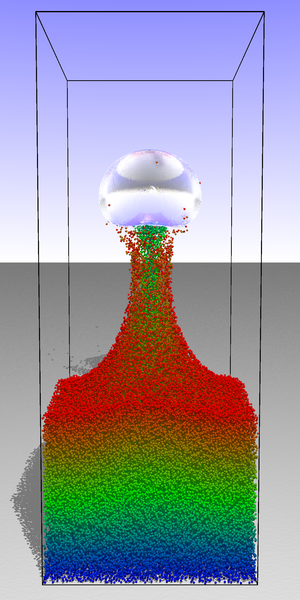

Scenarios of this complexity require a considerable amount of computational cost. The run time in each of the above cases is approximately hours when utilizing cpu cores of a distributed system in parallel. The considerable complexity stems from the high resolutions required by the DNS. Here, we have used grid points, whereas the unresolved simulations of Deen, van Sint Annaland, and Kuipers (2007) require only grid points.
5 Conclusion
Direct numerical simulation of liquid-gas-solid flows offers the possibility of detailed studies of bubble-particle interaction in liquids. The parallel model proposed in this paper allows, to the best of our knowledge, for the first time particle-resolved simulations of gas bubbles within slurry columns. This is possible thanks to the parallel design of the model that allows the exploitation of the parallelism of modern supercomputers. It has been demonstrated that the model can simulate particle mixing in the wake of rising gas bubbles. The structures formed by particles in the wake of the bubbles can be studied in great detail. The effect of different bubble regimes, i.e., bubble size and surface tension, on the particle transport can be analyzed. A comparison with previous, unresolved simulations indicates that particle-resolved DNS is indeed necessary to predict this flow structure correctly.
Future research may include particle wettability and structures at liquid-gas interfaces. Also, systematic studies of bubble-particle interactions could be used in improving existing drag correlations for bubbles in particle solutions.
References
- Aidun and Clausen (2010) Aidun, C. K., and J. R. Clausen. 2010. “Lattice-Boltzmann Method for Complex Flows.” Annual Review of Fluid Mechanics 42: 439–472.
- Anderl et al. (2014) Anderl, D., S. Bogner, C. Rauh, U. Rüde, and A. Delgado. 2014. “Free surface lattice Boltzmann with enhanced bubble model.” Computers and Mathematics with Applications 67 (2): 331–339. http://arxiv.org/abs/1604.01632.
- Baltussen et al. (2013) Baltussen, M.W., L.J.H. Seelen, J.A.M. Kuipers, and N.G. Deen. 2013. “Direct Numerical Simulations of gas–liquid–solid three phase flows.” Chemical Engineering Science 100: 293 – 299.
- Baltussen, Kuipers, and Deen (2017) Baltussen, M. W., J. A. M. Kuipers, and N. G. Deen. 2017. “Direct numerical simulation of effective drag in dense gas-liquid-solid three-phase flows.” Chemical Engineering Science 158: 561.
- Beetstra, van der Hoef, and Kuipers (2007) Beetstra, R., M. A. van der Hoef, and J. A. M. Kuipers. 2007. “Drag Force of Intermediate Reynolds Number Flow Past Mono- and Bidisperse Arrays of Spheres.” Fluid Mechanics and Transport Phenomena 53 (2): 489–501.
- Bićanić (2004) Bićanić, N. 2004. “Discrete Element Methods.” In Encyclopedia of Computational Mechanics, John Wiley & Sons, Ltd.
- Bogner (2017) Bogner, S. 2017. “Direct Numerical Simulation of Liquid-Gas-Solid Flows Based on the Lattice Boltzmann Method.” Ph.D. thesis. University of Erlangen-Nuremberg.
- Bogner, Ammer, and Rüde (2015) Bogner, S., R. Ammer, and U. Rüde. 2015. “Boundary Conditions for Free Interfaces with the Lattice Boltzmann Method.” Journal of Computational Physics http://arxiv.org/abs/1409.5645.
- Bogner, Mohanty, and Rüde (2014) Bogner, S., S. Mohanty, and U. Rüde. 2014. “Drag correlation for dilute and moderately dense fluid-particle systems using the lattice Boltzmann method.” International Journal of Multiphase Flow 68: 71–79. http://arxiv.org/abs/1401.2025.
- Bogner and Rüde (2013) Bogner, S., and U. Rüde. 2013. “Simulation of floating bodies with the lattice Boltzmann method.” Computers and Mathematics with Applications 65: 901–913. http://arxiv.org/abs/1201.0351.
- Bogner, Rüde, and Harting (2016) Bogner, S., U. Rüde, and J. Harting. 2016. “Curvature estimation from a volume of fluid indicator function for the simulation of surface tension and wetting with a free surface lattice Boltzmann method.” Physical Review E 93 (4): 043302. http://arxiv.org/abs/1509.07691.
- Brackbill, Kothe, and Zemach (1992) Brackbill, J. U., D. B. Kothe, and C. Zemach. 1992. “A Continuum Method for Modeling Surface Tension.” Journal of Computational Physics 100: 335–354.
- Caboussat (2005) Caboussat, A. 2005. “Numerical Simulation of Two-Phase Free Surface Flows.” Archives of Computational Methods in Engineering 12 (2): 165–224.
- Chen and Fan (2004) Chen, C., and L.-S. Fan. 2004. “Discrete simulation of gas-liquid bubble columns and gas-liquid-solid fluidized beds.” AIChE Journal 50 (2): 288–301.
- Clift, Grace, and Weber (1978) Clift, R., J. R. Grace, and M. E. Weber. 1978. Bubbles, Drops and Particles. New York: Academic Press.
- Deen et al. (2007) Deen, N.G., M. Van Sint Annaland, M.A. Van der Hoef, and J.A.M. Kuipers. 2007. “Review of discrete particle modeling of fluidized beds.” Chemical Engineering Science 62 (1-2): 28 – 44.
- Deen, van Sint Annaland, and Kuipers (2007) Deen, N. G., M. van Sint Annaland, and J.A.M. Kuipers. 2007. “Numerical Simulation of Particle Mixing in Dispersed Gas-Liquid-Solid Flows using a Combined Volume of Fluid and Discrete Particle Approach.” In 6th International Conference on Multiphase Flow, ICMF 2007, Leipzig. Paper no. 271. http://doc.utwente.nl/68811/.
- Deen, van Sint Annaland, and Kuipers (2009) Deen, N. G., M. van Sint Annaland, and J.A.M. Kuipers. 2009. “Direct numerical simulation of complex multi-fluid flows using a combined front tracking and immersed boundary method.” Chemical Engineering Science 64 (9): 2186 – 2201.
- Donath et al. (2009) Donath, S., C. Feichtinger, T. Pohl, J. Götz, and U. Rüde. 2009. “Localized Parallel Algorithm for Bubble Coalescence in Free Surface Lattice-Boltzmann Method.” In Euro-Par 2009 Parallel Processing, Vol. 5704 of Lecture Notes in Computer Science edited by H. Sips, D. Epema, and H.-X. Lin. 735–746. Springer.
- Fan and Tsuchiya (1990) Fan, L.-S., and K. Tsuchiya. 1990. Bubble Wake Dynamics in Liquids and Liquid-Solid Suspensions. Boston, London, Singapore, Sydney, Toronto, Wellington: Butterworth-Heinemann.
- Feichtinger et al. (2011) Feichtinger, C., S. Donath, H. Köstler, J. Götz, and U. Rüde. 2011. “WaLBerla: HPC software design for computational engineering simulations.” Journal of Computational Science 2(2): 105–112.
- Frisch et al. (1987) Frisch, U., D. d’Humieres, B. Hasslacher, P. Lallemand, Y. Pomeau, and J.-P. Rivet. 1987. “Lattice Gas Hydrodynamics in Two and Three Dimensions.” Complex Systems 1: 649–707.
- Ginzbourg and Adler (1994) Ginzbourg, I., and P.M. Adler. 1994. “Boundary Flow Condition Analysis for three-dimensional lattice Boltzmann model.” Journal of Physics II France 4: 191–214.
- Ginzburg and d’Humieres (2009) Ginzburg, I., and D. d’Humieres. 2009. “Viscosity independent numerical errors for Lattice Boltzmann models: From recurrence equations to ”magic” collision numbers.” Computers and Mathematics with Applications 58 (5): 823–840.
- Ginzburg, Verhaeghe, and d’Humieres (2008) Ginzburg, I., F. Verhaeghe, and D. d’Humieres. 2008. “Two-Relaxation-Time Lattice Boltzmann Scheme: About Parametrization, Velocity, Pressure and Mixed Boundary Conditions.” Communications in Computational Physics 3 (2): 427–478.
- Götz et al. (2010) Götz, J., K. Iglberger, M. Stürmer, and U. Rüde. 2010. “Direct numerical simulation of particulate flows on 294912 processor cores.” In Proceedings of the 2010 ACM/IEEE International Conference for High Performance Computing, Networking, Storage and Analysis, 1–11. IEEE Computer Society.
- Grace (1973) Grace, J. R. 1973. “Shapes and Velocities of Bubbles Rising in Infinite Liquids.” Transactions of the Institution of Chemical Engineers 51: 116–120.
- Harting et al. (2014) Harting, J., S. Frijters, M. Ramaioli, M. Robinson, D.E. Wolf, and S. Luding. 2014. “Recent advances in the simulation of particle-laden flows.” The European Physical Journal Special Topics 223 (11): 2253–2267.
- Hirt and Nichols (1981) Hirt, C. W., and B. D. Nichols. 1981. “Volume of fluid (VOF) method for the dynamics of free boundaries.” Journal of Computational Physics 39: 201–225.
- Holdych et al. (2004) Holdych, D. J., D. R. Noble, J. G. Georgiadis, and R. O. Buckius. 2004. “Truncation error analysis of lattice Boltzmann methods.” Journal of Computational Physics 193 (2): 595–619.
- Jansen and Harting (2011) Jansen, F., and J. Harting. 2011. “From bijels to Pickering emulsions: A lattice Boltzmann study.” Physical Review E 83: 046707–1 – 046707–11.
- Joshi and Sun (2009) Joshi, A. S., and Y. Sun. 2009. “Multiphase lattice Boltzmann method for particle suspensions.” Physical Review E 79: 066703.
- Junk, Klar, and Luo (2005) Junk, M., A. Klar, and L.-S. Luo. 2005. “Asymptotic analysis of the lattice Boltzmann equation.” Journal of Computational Physics 210: 676–704.
- Körner et al. (2005) Körner, C., M. Thies, T. Hofmann, N. Thürey, and U. Rüde. 2005. “Lattice Boltzmann Model for Free Surface Flow for Modeling Foaming.” Journal of Statistical Physics 121 (1/2): 179–196.
- Kromkamp et al. (2006) Kromkamp, J., D. van den Ende, D. Kandhai, R. van der Sman, and R. Boom. 2006. “Lattice Boltzmann simulation of 2D and 3D non-Brownian suspensions in Couette flow.” Chemical Engineering Science 61 (2): 858–873.
- Ladd (1994) Ladd, A. J. C. 1994. “Numerical simulations of particulate suspensions via a discretized Boltzmann equation. Part 1. Theoretical foundation.” Journal of Fluid Mechanics 271: 285–309.
- Ladd and Verberg (2001) Ladd, A. J. C., and R. Verberg. 2001. “Lattice-Boltzmann Simulations of Particle-Fluid Suspensions.” Journal of Statistical Physics 104: 1191–1251.
- Li and Zhong (2015) Li, W., and W. Zhong. 2015. “CFD simulation of hydrodynamics of gas-liquid-solid three-phase bubble column.” Powder Technology 286: 766 – 788.
- Li, Zhang, and Fan (1999) Li, Y., J. Zhang, and L.-S. Fan. 1999. “Numerical simulation of gas-liquid-solid fluidization systems using a combined CFD-VOF-DPM method: bubble wake behavior.” Chemical Engineering Science 54 (21): 5101–5107.
- Mittal and Iaccarino (2005) Mittal, R., and G. Iaccarino. 2005. “Immersed Boundary Methods.” Annual Review of Fluid Mechanics 37: 239–261.
- Pan et al. (2016) Pan, H., X.-Z. Chen, X.-F. Liang, L.-T. Zhu, and Z.-H. Luo. 2016. “CFD simulations of gas-liquid-solid flow in fluidized bed reactors — A review.” Powder Technology 299: 235 – 258.
- Panneerselvam, Savithri, and Surender (2009) Panneerselvam, R., S. Savithri, and G.D. Surender. 2009. “CFD simulation of hydrodynamics of gas-lquid-solid fluidised bed reactor.” Chemical Engineering Science 64 (6): 1119 – 1135.
- Parker and Youngs (1992) Parker, B. J., and D. L. Youngs. 1992. Two and Three Dimensional Eulerian Simulation of Fluid Flow with Material Interfaces. Tech. rep.. UK Atomic Weapons Establishment.
- Qian, d’Humieres, and Lallemand (1992) Qian, Y. H., D. d’Humieres, and P. Lallemand. 1992. “Lattice BGK Models for Navier-Stokes Equations.” Europhysics Letters 17 (6): 479–484.
- Scardovelli and Zaleski (1999) Scardovelli, R., and S. Zaleski. 1999. “Direct numerical simulation of free-surface and interfacial flow.” Annual Review of Fluid Mechanics 31: 567–603.
- Stickel and Powell (2005) Stickel, J. J., and R. L. Powell. 2005. “FLUID MECHANICS AND RHEOLOGY OF DENSE SUSPENSIONS.” Annual Review of Fluid Mechanics 37: 129–149.
- Stratford et al. (2005) Stratford, K., R. Adhikari, I. Pagonabarraga, J.-C. Desplat, and M. E. Cates. 2005. “Colloidal Jamming at Interfaces: A Route to Fluid-Bicontinuous Gels.” Science 309 (5744): 2198–2201.
- Sun and Sakai (2015) Sun, X., and M. Sakai. 2015. “Three-dimensional simulation of gas-solid-liquid flows using the DEM-VOF method.” Chemical Engineering Science 135: 531–548.
- Tang et al. (2015) Tang, Y., E. A. J. F. Peters, J. A. M. Kuipers, S. H. L. Kriebitzsch, and M. A. van der Hoef. 2015. “A new drag correlation from fully resolved simulations of flow past monodisperse static arrays of spheres.” AIChE Journal 61 (2): 688–698.
- Tenneti, Garg, and Subramaniam (2011) Tenneti, S., R. Garg, and S. Subramaniam. 2011. “Drag law for monodisperse gas-solid systems using particle-resolved direct numerical simulation of flow past fixed assemblies of spheres.” International Journal of Multiphase Flow 37 (9): 1072–1092.
- Tenneti and Subramaniam (2014) Tenneti, S., and S. Subramaniam. 2014. “Particle-Resolved Direct Numerical Simulation for Gas-Solid Flow Model Development.” Annual Review of Fluid Mechanics 46: 199–230.
- Tryggvason, Scardovelli, and Zaleski (2011) Tryggvason, G., R. Scardovelli, and S. Zaleski. 2011. Direct Numerical Simulations of Gas-Liquid Multiphase Flows. Cambridge University Press.
- Tsuchiya et al. (1997) Tsuchiya, K., A. Furumoto, L.-S. Fan, and J. Zhang. 1997. “Suspension viscosity and bubble rise velocity in liquid-solid fluidized beds.” Chemical Engineering Science 52 (18): 3053 – 3066.
- van Sint Annaland, Deen, and Kuipers (2005a) van Sint Annaland, M., N.G. Deen, and J.A.M. Kuipers. 2005a. “Numerical simulation of gas bubbles behaviour using a three-dimensional volume of fluid method.” Chemical Engineering Science 60 (11): 2999 – 3011.
- van Sint Annaland, Deen, and Kuipers (2005b) van Sint Annaland, M., N.G. Deen, and J.A.M. Kuipers. 2005b. “Numerical simulation of gas–liquid–solid flows using a combined front tracking and discrete particle method.” Chemical Engineering Science 60 (22): 6188 – 6198.
- Wolf-Gladrow (2005) Wolf-Gladrow, D. 2005. Lattice-Gas Cellular Automata and Lattice Boltzmann Models - An Introduction. Springer.
- Xu, Liu, and Tang (2013) Xu, Y., M. Liu, and C. Tang. 2013. “Three-dimensional CFD-VOF-DPM simulations of effects of low-holdup particles on single-nozzle bubbling behavior in gas-liquid-solid systems.” Chemical Engineering Journal 222: 292–306.