French SKA White Book
The French community towards the Square Kilometre Array
![[Uncaptioned image]](/html/1712.06950/assets/Figures/Cover3.jpeg)
Editor in Chief:
C. Ferrari
Editors:
G. Lagache, J.-M. Martin, B. Semelin — Cosmology and Extra-galactic astronomy
M. Alves, K. Ferrière, M.-A. Miville-Deschenes, L. Montier — Galactic Astronomy
E. Josselin, N. Vilmer, P. Zarka — Planets, Sun, Stars and Civilizations
S. Corbel, S. Vergani — Transient Universe
S. Lambert, G. Theureau — Fundamental Physics
S. Bosse, A. Ferrari, S. Gauffre — Technological Developments
G. Marquette — Industrial Perspectives and Solutions
Published by the SKA France Coordination in collaboration with AS SKA-LOFAR
We acknowledge financial support of Université Paris-Saclay and AS SKA-LOFAR for the first “French SKA White Book” organisation meeting. We are grateful to the MPIfR colleagues, editors of the German “White Paper”, who provided the adopted latex macro
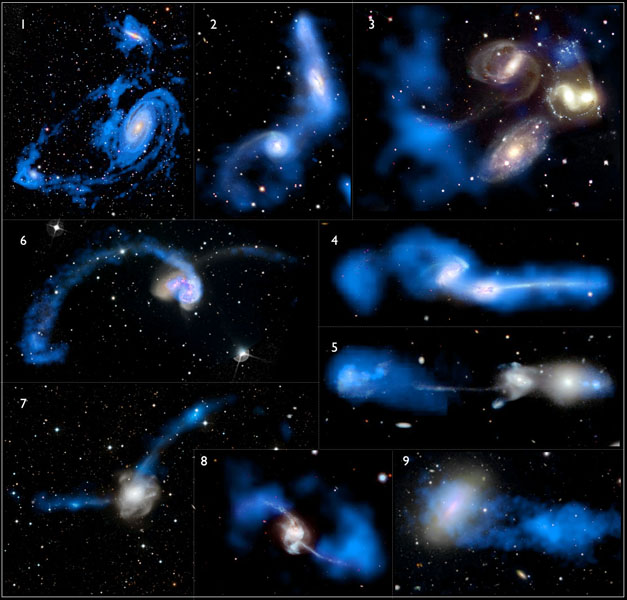
Cover images show: (a) an artist’s impression of the Square Kilometre Array (SKA) and of its different antenna types, (b) an artist’s impression of the Epoch of Re-ionisation, (c) numerical simulations of the magnetised cosmic web, (d) two paintings of the “Shared Sky” SKA Indigenous Art/Astronomy Exhibition
Image courtesy: (a, d) SKAO; (b) A. Loeb (CfA) (c) F. Vazza (INAF)
This White Book is available on-line at the SKA France web page:
https://ska-france.oca.eu/images/SKA-France-Media/FWB_051017.pdf
Résumé exécutif
Introduction
Le “Square Kilometre Array” (SKA) est un projet de radiotélescope géant, de surface collectrice équivalente de un kilomètre carré comme son nom l’indique, constitué de plusieurs réseaux interférométriques dans les longueurs d’onde métriques et centimétriques. Il est prévu de déployer SKA sur deux sites, en Afrique du Sud et en Australie. Le déploiement se déroulera en deux phases séparées dans le temps:
-
•
La Phase 1, dont le coût estimé est de 674 M€, le début de construction prévu pour 2020 pour une mise en service à l’horizon 2024+, consiste à installer environ 10% du réseau final, sous forme d’environ 200 antennes paraboliques en Afrique du Sud et 130 000 antennes phasées fixes travaillant aux basses fréquences dans l’ouest australien. Dans cette configuration, SKA1 représentera un saut qualitatif immense par rapport aux instruments existants, et permettra des avancées décisives dans toutes les thématiques de l’astrophysique et de la physique modernes, comme la cosmologie, l’origine des champs magnétiques cosmiques, le milieu interstellaire, la formation des étoiles aux différentes époques de l’univers, les ondes gravitationnelles, …
-
•
La Phase 2 est envisagée pour les années 2030+. Dans cette configuration finale, SKA2 sera l’instrument ultime de la radioastronomie basse-fréquence du 21ème siècle.
Dès la phase 1 SKA sera l’une des plus formidables machines jamais déployées par l’homme, et de loin la plus impressionnante en termes de débit de données et de puissance de calcul engagée.
Le projet est pour l’instant piloté par un “project office” (SKA Organisation, SKAO), auquel doit succéder une organisation intergouvernementale (IGO), l’Observatoire SKA, qui devrait se mettre en place progressivement à partir de fin 2017. Dans la phase initiale de mise en place de l’IGO les éléments de gouvernance et les règles de fonctionnement seront négociés par les membres.
Communauté concernée en France
La France, membre fondateur de SKA, a quitté fin 2011 l’organisation chargée de préparer sa construction, pour des raisons budgétaires et programmatiques. Les activités scientifiques autour du projet ne se sont pas arrêtées cependant. La communauté astronomique française a réaffirmé son intérêt majeur pour le projet SKA lors de son exercice quinquennal de prospective en 2014, et en a organisé depuis 2016 la préparation scientifique et technique autour de la structure de coordination nationale SKA France. Cette structure est pilotée par cinq établissements (CNRS-INSU, Observatoires de Paris et de la Côte d’Azur, Universités de Bordeaux et d’Orléans).
La publication de ce livre blanc, avec la participation de presque 200 auteurs français et de plus de 40 laboratoires de recherche, démontre bien le fort investissement de notre communauté astronomique, et celui, rapidement croissant, d’acteurs scientifiques et technologiques majeurs des domaines des Big Data et du calcul très haute performance.
Les actions initiées par la coordination SKA France, relevant tout autant de la préparation scientifique de SKA que des activités de R&D nécessaires à son développement, sont donc menées aussi bien dans les établissements qui pilotent SKA France qu’en dehors de ceux-ci. L’exploitation d’instruments éclaireurs comme LOFAR et NenuFAR en France et en Europe, ou précurseurs comme MeerKAT, ASKAP, MWA en Afrique du Sud et Australie, démontre très clairement que la radioastronomie du 21ème siècle n’est plus l’affaire exclusive des radioastronomes ”classiques”, mais implique toute la communauté astronomique, exploitant des données réduites et calibrées mises à disposition. Ainsi une estimation prudente du nombre de chercheurs concernés par l’exploitation de SKA1 s’élève à 400 personnes en France, et plus de 4000 au niveau mondial. Cette estimation recouvre les chercheurs de la communauté astronomique française, de la communauté HPC et d’autres domaines applicatifs, ainsi que de l’industrie qui est prête à investir des efforts à long terme dans SKA.
Retour industriel
Des règles de retour industriel seront définies au moment de la mise en place de l’IGO. Dans ce contexte, la France a une place essentielle à revendiquer, notamment dans des domaines où SKA présente des défis technologiques majeurs : production et stockage d’énergie renouvelable ; infrastructures de calcul ; récepteurs dans les différentes bandes de fréquences ; traitement du signal et des données ; ingénierie système. Notre ambition est que le succès de SKA soit enrichi par l’expertise française.
De grands groupes industriels à forte composante française ont déjà manifesté leur intérêt pour ces développements; parmi ces groupes, la coordination SKA France a dèjà reçu des lettres de soutien d’Air Liquide, Ariane Group, ATOS-Bull, Callisto, DDN Storage, ENGIE, FEDD, NVIDIA, Thales Alenia Space. Les laboratoires français sont également très bien placés dans les domaines des récepteurs et du traitement du signal et des données.
Ainsi, ce positionnement permettra de mettre en avant la haute technologie française, ce qui facilitera potentiellement l’accès à d’autres marchés pour les industriels français, en particulier dans les domaines très compétitifs de l’énergie intelligente, de l’électronique et du calcul très haute performance, ainsi que celui de l’exploitation des masses de données à l’échelle dite Exa.
Conclusion
Suite à la recommandation récente du Haut Conseil des Très Grandes Infrastructures de Recherche (HC TGIR) de poursuivre la préparation du projet SKA en France, la communauté astronomique nationale a redoublé d’efforts sous la coordination de SKA France. La réinscription de SKA sur la feuille de route française des TGIR dès 2018, et le retour de la France dans SKAO, préparant son entrée dans l’IGO, nous placeraient dans une position favorable pour recueillir les fruits du fort investissement intellectuel consenti ces dernières années, en nous permettant de participer à des avancées scientifiques majeures pendant les 50 prochaines années.
Dans ce cadre, la coordination SKA France, avec ses partenaires privés, a décidé d’évoluer vers la “Maison SKA France”, destinée à être non seulement un forum pour ses membres afin d’organiser leur participation aux travaux préparatoires de SKA et de son IGO, mais aussi un précurseur d’un nouveau paradigme pour les relations entre les mondes de l’industrie et de la recherche, ayant le même calendrier et les même objectifs, avec cependant différentes perspectives d’utilisation finale. La dimension transversale et multi-usage de SKA en font un cas d’étude parfait pour une approche nouvelle et innovante des modalités de financement des TGIR.
Executive summary
Introduction
The “Square Kilometre Array” (SKA) is a large radio telescope project characterised, as suggested by its name, by a total collecting area of approximately one square kilometre, and consisting of several interferometric arrays to observe metric and centimetric wavelengths. The deployment of the SKA will take place in two sites, in South Africa and Australia, and in two phases separated in time:
-
•
Phase 1, with an estimated cost of €674 million, the start of construction planned for 2020 and of commissioning by 2024+, consists of installing approximately 10% of the final arrays. It will include about 200 dishes in South Africa and slightly more than 130,000 low-frequency simple antennas organised in phased arrays in Western Australia. In this configuration, SKA1 will represent a huge qualitative leap with respect to existing instruments, and will allow decisive advances in all the domains of modern astrophysics and physics, such as cosmology, the origin of cosmic magnetic fields, the physics of the interstellar medium, the formation of stars at different epochs of the universe, the detection of gravitational waves, …
-
•
Phase 2 is envisaged for 2030+. In this final configuration, SKA2 will be the ultimate instrument of low-frequency radio astronomy of the 21st century.
From its Phase 1, the SKA will be one of the most formidable machines ever deployed by mankind, and by far the most impressive in terms of data throughput and required computing power.
The project is currently being led by a project office (SKA Organisation, SKAO), to be succeeded by an intergovernmental organisation (IGO), the SKA Observatory, which is expected to be gradually implemented from the end of 2017. In the initial phase of the implementation of the IGO, the members will negotiate governance elements and operating rules.
Community in France
France, a founding member of the SKA, left the organisation in charge of preparing its construction at the end of 2011, for budgetary and programmatic reasons. Scientific activities around the project did not stop, though. The French astronomical community restated its major interest in the SKA project in 2014, during its five-year perspective exercise, and, since 2016, has organised the French scientific and technical preparation to the SKA through the national coordination SKA France. This structure is managed by five institutions (CNRS National Institute for Earth Sciences and Astronomy (CNRS-INSU), Observatories of Paris and of Côte d’Azur, Universities of Bordeaux and Orléans).
The publication of this white paper, with the participation of almost 200 French authors and more than 40 research institutes, demonstrates the strong investment of our astronomical community and of a rapidly growing number of major scientific and technological players in the fields of Big Data and high performance computing.
The actions initiated by the SKA France coordination, concerning both the scientific preparation of the SKA and the R&D activities necessary for its development, are therefore carried out both within and outside the research institutes founding of SKA France. The exploitation of pathfinder instruments such as LOFAR and NenuFAR in France and Europe, or precursors as MeerKAT, ASKAP, MWA in South Africa and Australia, shows very clearly that radio astronomy of the 21st century is no longer the exclusive business of “classical” radio astronomers, but involves the whole astronomical community that is interested to exploit available reduced and calibrated data. Based on this, a conservative estimate of the number of researchers interested to SKA1 is of about 400 in France and more than 4000 in the world. These numbers include researchers from the French astronomical community, from the HPC community, as well as from private companies that are ready to lasting efforts in the SKA project.
Industrial return
Rules of industrial return will be defined when the IGO will become operational. In this context, France has an essential place to claim, particularly in those areas where the SKA presents major technological challenges: production and storage of renewable energy; computing infrastructures; receivers in various frequency bands; signal and data processing; system engineering. Our ambition is that the success of the SKA will benefit from the French expertise.
Large industrial groups with a strong French component have already expressed interest in these developments; SKA France has received letters of support from Air Liquide, Ariane Group, ATOS-Bull, Callisto, DDN Storage, ENGIE, FEDD, NVIDIA, Thales Alenia Space. French laboratories have also a wide expertise in the domains of receivers and signal and data processing.
French high technology will also strongly benefit from the participation to the SKA, which will facilitate potential access to other markets for French manufacturers, particularly in the highly competitive fields of intelligent energy, electronics and very high performance computing, as well as that of the exploitation of Exa-scale Big Data.
Conclusion
Following the recent recommendation by the Haut Conseil des Très Grandes Infrastructures de Recherche (HC-TGIR, High level committee for large research infrastructures) to continue the French participation to the preparation of the SKA instrument, the French astronomical community has redoubled efforts under the coordination of SKA France. Having the SKA on the French roadmap of large research infrastructures in 2018 and France joining the SKA Organisation, preparing for its entry into the IGO, would put us in a favourable position for exploiting the strong intellectual investment made in recent years, and enable France to participate in major scientific breakthroughs over the next 50 years.
In this framework, the SKA France Coordination, together with the companies engaged, has decided to evolve towards the “Maison SKA France”, intended to be not only a forum for its members to organise their participation to the preparatory work for the SKA and its IGO, but also a precursor of a new paradigm for industry and research relations, sharing the same calendar and performance agenda, but with different final use perspectives. The multi-usage, transversal domain dimension of the SKA makes it a perfect case study for such new and innovative financial approach of large research infrastructures.
1 Introduction
C. Ferrari [Université Côte d’Azur, Observatoire de la Côte d’Azur, CNRS, Laboratoire Lagrange, Nice, France], G. Marquette [CNRS-INSU, Institut National des Sciences de l’Univers], M. Pérault [LERMA, Observatoire de Paris, École normale supérieure, PSL Research University, CNRS, Sorbonne Universités, UPMC Univ. Paris 06, Paris, France]
1.1 The Square Kilometre Array
1.1.1 The telescopes
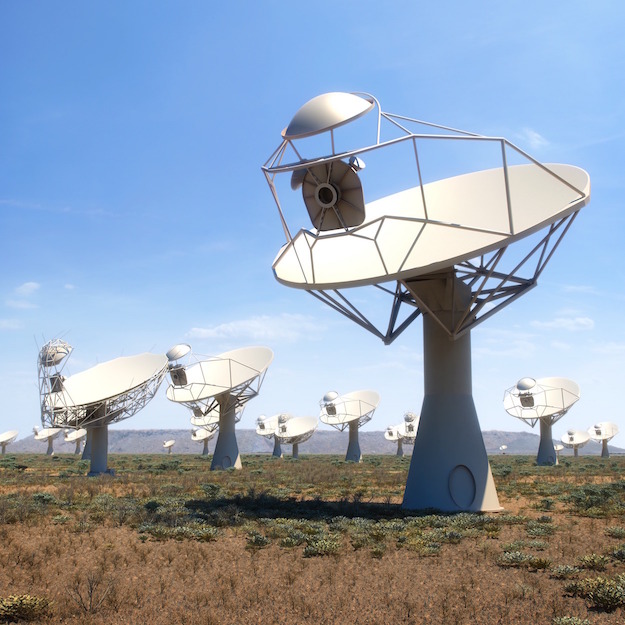
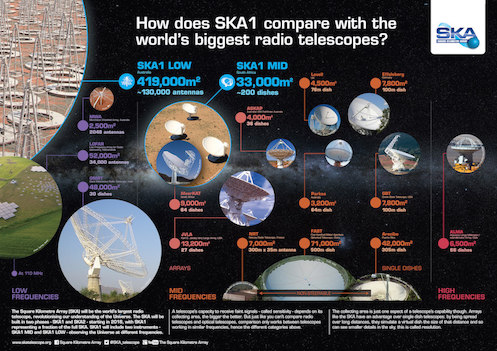
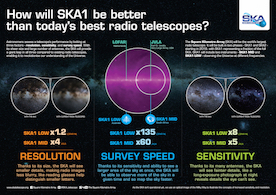
The Square Kilometre Array (SKA) is an ambitious international project to develop the world’s largest radio telescope that, when complete, is planned to reach 1 million square metres of collecting area (hence its name). The full array will be built over two sites in Australian and African deserts, as far as possible from the origin of disturbing radio-frequency interferences (RFI), mostly of human origins. The frequency range that the SKA is expected to cover is unprecedented, going from approximately 50 MHz to 15 GHz (and, possibly, more in its final phase - up to about 30 GHz), thus requiring a variety of antenna designs (see Fig. 1). This, together with the expected gain in survey speed and image quality compared to current radio telescopes (Figs. 2 and 3), will enable transformational science at centimetre and metre wavelengths. Its status as an ESFRI Landmark Project recognises the SKA as a major research infrastructure for Europe.
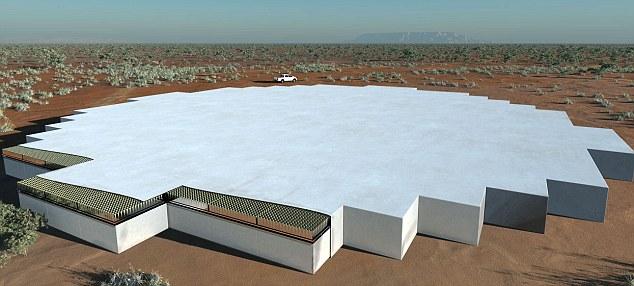
In its lowest frequency part (50 to 350 MHz), the telescope will be made up by hundreds of thousands of simple antenna elements (e.g. dipoles or log–periodic elements), which will be arranged in hundreds of stations of a few metres in diameters. The signal of all elements within one station will be combined numerically and all the stations will work together forming a so called “aperture array”. The station separation will go from a few tens of meters in a central core area, to several tens (up to hundreds) of kilometres in the outer distribution, which will include a few spiral arms. This low-frequency part of the telescope is going to be built in the Murchison desert of Western Australia. At the higher frequencies covered by the SKA (above 350 MHz), the array will consist of hundreds of 15 m diameter dishes, to be initially distributed within the Karoo desert (about 500 km North of Cape Town) and subsequently extending to different states in central up to northern Africa, going from maximum baselines of hundreds to thousands of kilometres. Further technical developments are planned, aiming to cover the intermediate frequency part of the SKA also with dense aperture arrays.

These numbers alone prove to the reader with an idea of why the SKA is considered as a fully “Big Data” project. These numerous elements generate a huge data rate of several Tb/s already in the first phase of the project (called “SKA1”, see Sect. 1.1.2), when the total collecting area will be approximately one tenth of the final expected array. The SKA1 data rate is expected to exceed the total global internet traffic at present day rate. Even after data reduction, the archived data rate for astronomical exploitations will be of the order of 50 to 300 Pbytes per year. Data processing and storage will require by early 2020’s super-computers about 10 times more powerful than the fastest machines available today.
1.1.2 The project organisation
A so big and ambitious international project is the result of a quite long development history. The SKA project, originally conceived in the late 1980’s / early 1990’s (see Ekers 2012 for a complete overview), formally began with signing a first Memorandum of Agreement in 2000, followed by the establishment of the SKA International Project Office with R. Schilizzi as the first Project Director (2003). An early design study (called “SKADS”) started in 2005, and a preparatory work (“PrepSKA”) in 2008, paving the way to the birth of the SKAO legal entity in 2011. Since 2011, a UK Company Limited by Guarantee, called SKA Organisation (SKAO), has been adopted as a temporary solution to enable the SKA project to proceed. In order to provide a long-term government commitment and funding stability, the SKAO is currently evolving towards an intergovernmental organisation (IGO), similar to other big research infrastructures (such as ESO, ESA and CERN).
SKAO includes today ten formal members (Australia, Canada, China, India, Italy, New Zealand, South Africa, Sweden, the Netherlands and the United Kingdom), with in addition several countries that have expressed their potential interest in joining the Organisation. Without entering in a detailed description of the SKA Governance, a General Director is appointed by a Board of Directors, which includes voting representatives of the 10 member countries (as well as one person per observer countries) and which is called to take all relevant decisions for the development of the project.
In 2012 the SKA board proceeded to the selection of the SKA construction sites. Both Australia and South African deserts, sites of the three technological and scientific precursors telescopes (MWA, ASKAP and MeerKAT, see Sect. 1.2.2), were considered as excellent locations for building the arrays covering the low- and mid-frequency part of the e.m. spectrum. At that phase, in particular, both the precursors going to GHz frequencies (ASKAP and MeerKAT) were planned to be integrated to the future SKA antennas. In 2015, however, a redefinition of the design needed to be developed (known as “re-baselining”) due to cost issues. This lead to the definition of the design Baseline for the first phase of SKA (generally referred to as “SKA1”) that, within the set cost cap of 674M (2016 euros), will consist of two arrays:
-
•
SKA1-LOW in Australia, including 131,000 simple antennas covering the frequency range from 50 MHz to 350 MHz. The array will be in the same region as ASKAP and will have a maximum baseline of approximately 65 km;
-
•
SKA1-MID in South Africa, including 133 15 m diameter dishes and observing frequencies from 350 MHz to 15.5 GHz, divided in five frequency bands (from Band 1 to Band 5). The instrument will integrate the MeerKAT antennas, for a total number of 197 dishes, separated by a maximum distance of 150 km.
After the Cost Control Project (CCP) initiated at the November 2016 Board of Directors meeting, in July 2017 the Board decided that the Design Baseline remains the long-term ambition of the SKA1 project and the focus should be on the Critical Design Review of the project, expected in 2018. At that occasion, the Board approved though the definition of a “Deployment Baseline”, which corresponds to the telescopes currently deliverable at that funding level and takes advantage of the scalable nature of interferometers111All information in the SKA Organisation eNewsletter edition 35 August 2017..
Based on these decisions, the construction of SKA1, which corresponds to 10% of the full final instrument, is planned to start in 2019, with the first science operations beginning in early 2020’s. SKA1 will be a single observatory built over three sites, among which one will host the headquarters (at Jodrell Bank, in UK, site decision taken in 2015) and the others two telescopes, SKA1-LOW in Australia and SKA1-MID in South Africa. After 2025, the instrument is planned to be further developed towards the full square kilometre total collecting area. This will of course require the necessary preparation from the technological and scientific point of view, for which SKA1 will play a crucial role, but also a likewise important budget and managing strategy.
1.2 General overview of the SKA science and technology
1.2.1 An instrument designed for a wide range of astronomical and general physics studies
The SKA is a long-standing project, whose original conception dates back to the late 1980’s – early 1990’s. The telescope was originally conceived as an optimised instrument to measure the 21 cm rest-frame emission of neutral hydrogen (H i) gas at cosmological distances (see Ekers 2012 and references therein; Fig. 4). Indeed, the SKA is still a wonderful “H i machine”, which will provide us with the possibility to study how galaxies acquire and loose their hydrogen gas, how it is transformed into stars, how it is related to the possible presence of an active nucleus and to the density of the environment. Going from current facilities to SKA1, we will be able to perform this kind of studies along the history of the Universe: we will measure the H i content of hundreds of thousands galaxies, up to look-back times of approximately 5 to 6 billion years, while with present telescopes we are limited to a very few gas-rich galaxies observed, at the maximum, about 2-2.5 billion years ago (Staveley-Smith & Oosterloo 2015).
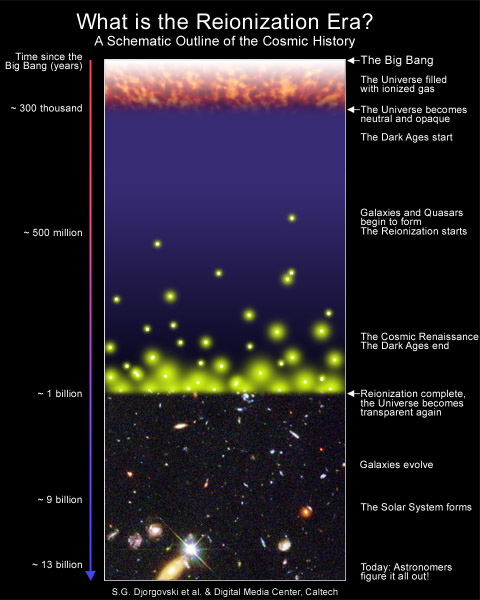
In the early 2000’s, another exceptional scientific application of SKA H i measurements started to emerge: the study of the Cosmic Dawn (CD) and the Epoch of Re-Ionisation (EoR). These phases of the Universe started around 100 and 280 million years after the Big Bang, respectively, when, after the Dark Ages in which the matter of the Universe was completely dominated by neutral hydrogen, the first sources (stars, galaxies, …) began to form (see Fig. 5). These luminous objects, intrinsically faint and suffering absorption by their medium, were able to ionise their surrounding gas, but at the same time they are extremely difficult to detect. The SKA will instead be able to map the structure of the H i gas from which these sources formed, whose distribution will therefore be characterised by voids (i.e. the bubbles of ionised medium surrounding luminous objects). This kind of measurements, which require exquisite sensitivity and the capacity to get rid of all kind of foreground sources, are extremely challenging. However, it is definitely worth investing telescope time and resources, since we will have a unique access to the phases during which the very initial seeds of structures observed by other telescopes (Planck, being the latest large mission) in the Cosmic Microwave Background (CMB) are transformed into the panoply of sources that we observe in the more local Universe (see e.g. Koopmans et al. 2015).
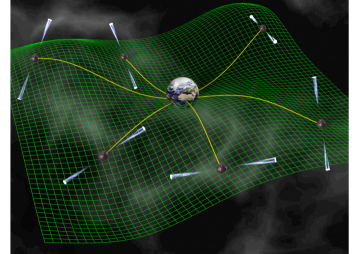
A third major science case for the present SKA project is the study of pulsars, highly magnetised, rotating neutron stars, whose beamed radio emission is detected as a pulse of radiation each time the beam sweeps across our line-of-sight; a pulsar is therefore a “cosmic light-house”, whose light blinks on and off to our view with a constant and extremely short pulse period (observed values for different pulsars go from 1.4 ms to 10 seconds). Pulsar research has acquired more and more weight over time. The first reason is that they are extreme, and thus exquisite, physics laboratories, with properties very far from what can be available on Earth (deep gravitational potentials, densities exceeding nuclear densities, magnetic field strengths as high as Gauss, see e.g. the excellent NRAO “Essential Radio Astronomy” series of lectures by Jim Condon and collaborators, Condon & Ransom 2016). The second reason, whose weight can be fully understood today, after the first direct detection of Gravitational Waves (GW; LIGO Scientific Collaboration & Virgo Collaboration 2016), is that a network of pulsars can be used as a giant GW detector in space. Pulses from these neutron stars are extremely regular (accuracies approach 1 part in ). This means that even small perturbations in the fabric of space-time, as those created by the propagation of a GW, can be detected through pulsar distance measurements: when they propagate through our network of observed pulsars, perturbations can indeed increase our distance from some of these neutron stars and decrease the distance from others, thus slightly increasing or decreasing the pulse arrival time. Extremely precise measurements of the detection time of the different signals can therefore be used to detect GW propagation in space. This is the work performed by researchers involved in Pulsar Timing Array (PTA) studies (e.g. Janssen et al. 2015; see Fig. 6).
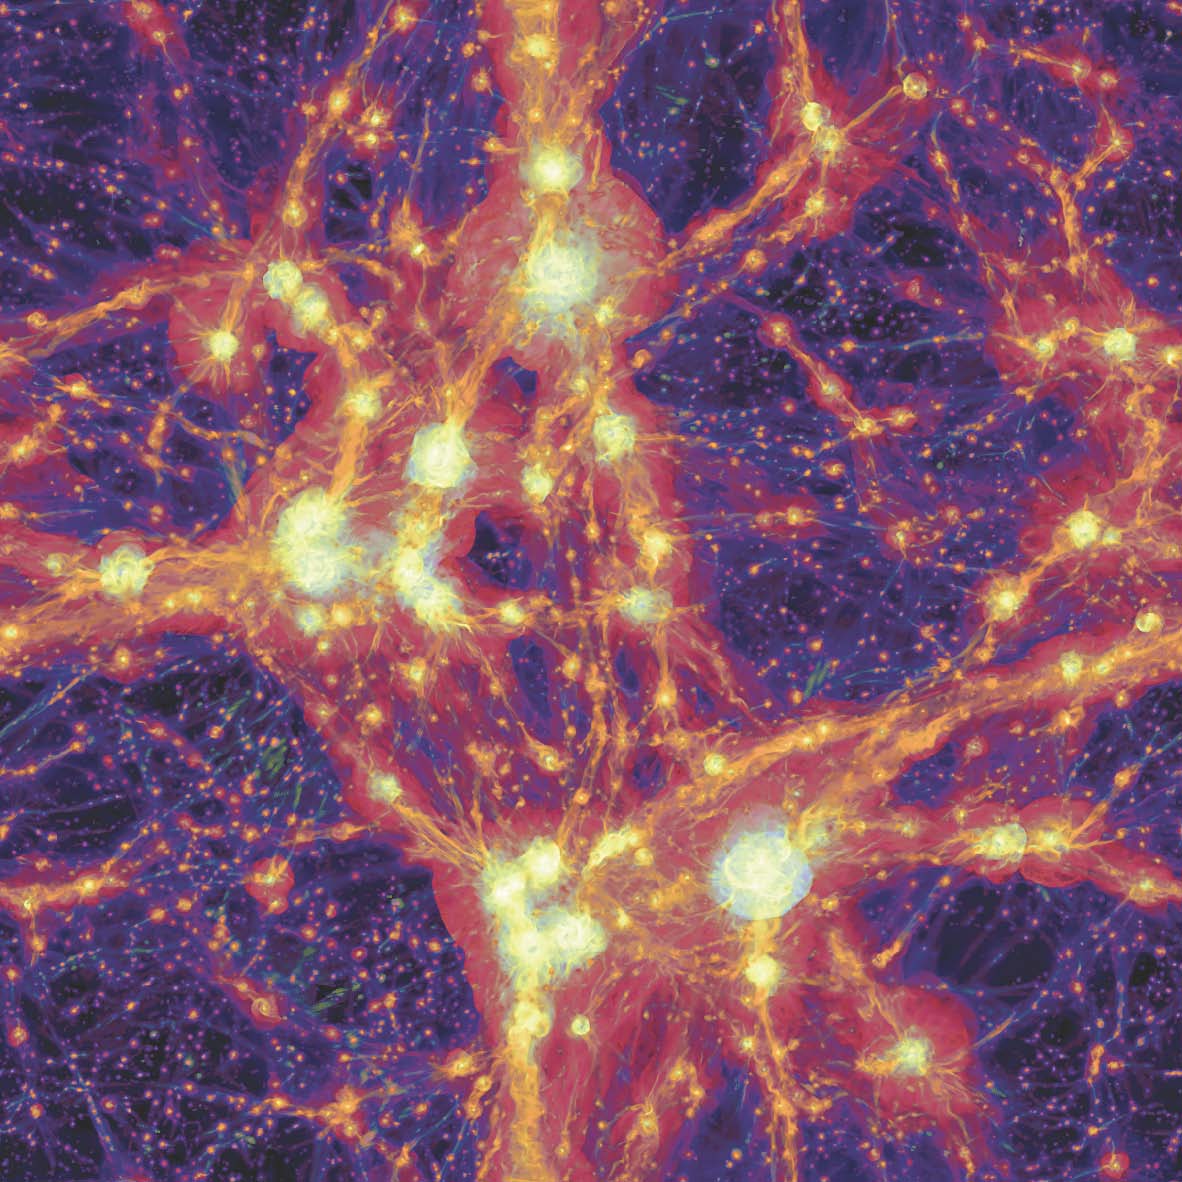
The SKA will also give us the unique opportunity to study magnetic fields in all kinds of sources, on spatial scales ranging from the few millions of kilometres of heliospheric coronal mass ejections to the dozens of Mpc ( km, 1 parsec (pc) corresponding to km) of the cosmic filaments that connect galaxies and galaxy clusters within the Universe (Fig. 7). This will be possible mostly through Faraday Rotation Measure (RM) studies. In a very simplified way, the synchrotron signal from radio sources is linearly polarised and its polarisation direction is rotated when it passes through a foreground magnetised plasma before reaching our telescopes on Earth. Very usefully, this rotation scales with the square of the observed wavelength and with a quantity (the RM) that depends on the intensity of the traversed magnetic field. Basically, if we detect a huge amount of background radio sources, multi-wavelength observations allows us to trace the 3D structure of magnetic fields in their foreground. The big advantage of the SKA compared to current state-of-the-art radio telescopes is that we will increase the number of detected background radio sources with measured RM from about 40 000 to several millions (Johnston-Hollitt et al. 2015).
If these are the major science drivers for the SKA in terms of transformational science, which can be achieved only with this instrument, other astrophysical sectors will enormously benefit from it. The evolution of galaxies will not only be addressed through H i-line studies, but also thanks to the analysis of diffuse radio emission. This is a powerful tracer of active galaxies, in terms of both on-going star-formation and presence of a massive central black-hole accreting mass. In both cases, we detect continuum synchrotron radiation, related to the presence of relativistic electrons and magnetic fields. In star-forming galaxies, supernovae explosions are responsible for cosmic ray acceleration, while in Active Galactic Nuclei (AGN) the relativistic plasma is ejected by the central compact nucleus hosting a black-hole. Through radio observations, we can therefore unveil magnetic fields within galaxies, study star formation from within our own Milky Way to high-z ( 4) galaxies, as well as analyse the role of BH in galaxy evolution up to cosmological distances (Prandoni & Seymour 2015; Johnston-Hollitt et al. 2015; Umana et al. 2015).
In the very local Universe, one of the most exciting science cases of the SKA, complementary to other instruments, is the so called “Cradle of Life”. The SKA is expected to be able to examine planet-forming disks around young stars, the organic chemistry of Earth-like terrestrial planets, and even detect signs of possible extra-terrestrial life from planets in nearby solar systems (Search for Extraterrestrial Intelligence (SETI) experiment).
New scientific discoveries, as well as technological developments, have therefore enormously widened the scientific ambitions of the SKA, which will address open questions covering a variety of astronomy and physics fields, across a huge range of scales and over a big fraction of the history of the Universe, schematically represented in Fig. 5.
We can interestingly follow the evolution of SKA related science cases through major comprehensive publications, starting with the first science case document (Taylor & Braun 1999), followed by the “Science with the Square Kilometre Array” book which appeared in 2004 (Carilli & Rawlings 2004). Ten years after, in summer 2014, the SKA Organisation, in collaboration with institutes and researchers participating to the SKA effort, has organised the meeting “Advancing Astrophysics with the Square Kilometre Array” (AASKA14, in the rest of this Volume), held in Giardina Naxos, Sicily. This resulted in an impressive two volume book, containing 135 chapters from 1,231 contributors spread over 31 countries (Braun et al. 2015).
The SKA Office is organised to take full profit of this enthusiastic international participation to the preparation of the SKA. In order to conceive the best instrument to address the open questions mentioned above, a number of Science Working Groups (SWG) have been settled. They are listed below, together with the reference papers written, generally, by their chairs222In order to bring new ideas and have a very open approach, the chairs of the SWG change approximately every four years. and published in the AASKA14 book:
-
•
Epoch of Reionisation (Koopmans et al. 2015);
-
•
Cosmology (Maartens et al. 2015);
-
•
Fundamental Physics with Pulsars (Kramer & Stappers 2015);
-
•
Radio Transients (Fender et al. 2015);
-
•
Extragalactic Continuum (Prandoni & Seymour 2015);
-
•
Cosmic Magnetism (Johnston-Hollitt et al. 2015);
-
•
Cradle of Life/Astrobiology (Hoare et al. 2015);
-
•
H I Galaxy Science (Staveley-Smith & Oosterloo 2015);
-
•
Extragalactic Spectral Line (Beswick et al. 2015);
-
•
Our Galaxy (Umana et al. 2015);
-
•
Solar and Heliospheric Physics (Nakariakov et al. 2015).
To be noted that the last three SWG were part of other groups before and have been added after the Giardini Naxos meeting in 2014, based on the need of specific science cases that emerged during that extremely interesting and useful conference. It is also worth stressing that the SKA will be developed in parallel to other major astronomical facilities. Interesting sections both of the 2014 SKA book (see Sect. 9 of Braun et al. 2015) and of this Volume (Sect. 3) are therefore devoted to the developing synergies and contact points with other projects.
The main activities of the different SWG include providing advice on the science requirements for the SKA, collaborating with the technical consortia described in Sect. 1.2.2 to achieve an instrument optimised for the expected goals, as well as communicating with the rest of the astronomical community about SKA developments. Scientists interested to have more information about the different SWG and the possibility to join them can visit the SKA Organisation web page. In addition to the SWG, a Science and Engineering Advisory Committee (SEAC) was established by the SKA Board to advise the Director-General and the Board on matters related to scientific and technical issues.
1.2.2 Design of SKA components
Similarly to other Earth and space science large projects, the SKA design has been broken down in various work packages (WPs) managed by international consortia responsible for specific elements of the final observatory.
These consortia were formed after 2013, when a request for proposal (RfP) was sent out by SKAO to all research institutes and potential industrial partners. The leading organisation or entity in all proposals answering to this call had to be in a member country of the SKA Organisation; no restrictions were placed on the other partners of a proposing consortium nor in any of the subcontracting. While the SKA Board and SKAO played a key role in selecting and, still now, coordinating the consortia, the latter operate independently and are responsible to fullly funding their work. Since 2014, a yearly SKA Engineering Meeting with all consortia participating is organised, with the aim of providing a global overview of the status, progress and way forward for the project in terms of science, governance, engineering and management.
At the moment of the RfP, eleven WPs were defined by SKAO, which are listed below, grouped into two main categories. To be noted that, with a few exceptions, the name of each consortium is the same as the one of the corresponding WP.
-
•
Elements of the SKA1 programme, including the following WPs:
-
–
Dish ( DSH)333At the time of the RfP, this WP included the design of phased array feeds, which is now part of a separate WP of the Advanced Instrumentation programme, as described below.;
-
–
Low frequency aperture array ( LFAA)444In this case, the name of the consortium in charge of the WP is “Aperture Array Design and Construction” (AADC).;
-
–
Telescope manager ( TM);
-
–
Science data processor ( SDP);
-
–
Central signal processor ( CSP);
-
–
Signal and data transport ( SaDT);
-
–
Assembly Integration Verification ( AIV);
-
–
Infrastructure, both in Australia and in South Africa ( INFRA AUS & INFRA SA).
-
–
-
•
Advanced Instrumentation programme, including:

Two stages were identified for each WP: Stage 1, a requirements analysis and preliminary design stage, and Stage 2, a detailed design stage. While Stage 1 for the Elements of the SKA1 programme included both to derive the functional and performance requirements, and to elaborate the Element preliminary designs, in order to prepare for the detailed designs and procurement specifications necessary for the construction of the SKA telescope in Stage 2, the final aim for the second WP category (Advanced Instrumentation programme) was to elaborate preliminary design for future developments, beyond SKA1.
After having passed the PDR (Preliminary Design Review) between the end of 2015 and the first half of 2016, the consortia are now in the detailed definition phase, preparing the Critical Design Reviews (CDR), which are expected in 2018. We will summarise in the following their main tasks in the framework of the Design Baseline set in March 2015.
Several consortia are responsible for the construction of two telescopes, SKA1-LOW and SKA1-MID. The design of the different types of antennas, their structure, receivers and verification is the responsibility of the LFAA and DSH consortia respectively. In the case of SKA1-LOW, the 131 000 antennas that will constitute the telescope will be grouped into 512 stations (of which about half in a central core of 1 km and the rest on spiral arms up to a maximum distance of 65 km between stations). The LFAA consortium is also responsible for the signal processing chain and hardware to combine the antenna signal within each station to form the equivalent of a single larger receiving system (phased arrays). The use of phased arrays for higher frequency observations (above 350 MHz) is currently limited mostly by energy consumption issues, but its implementation, planned in a second phase of the SKA project, is the subject of the developments within the MFAA consortium. The other consortium that is conducting studies for the SKA Advanced Instrumentation Program is the WBSPF, involved in the design of very broadband receivers, covering ranges of four to eight in frequency instead of the factors of two of conventional (“octave”) radio astronomy receivers.
All infrastructures (roads, buildings, vehicles, …) will be delivered by the two INFRA consortia in the host countries of the SKA (Australia and South Africa), while the AIV consortium is responsible for planning all activities necessary to incorporate SKA elements into existing infrastructure and to verify their compliance with the SKA specifications.
The data rates produced by SKA1 will be enormous (several Tbit/s). The SaDT consortium is in charge of the hardware and software necessary for the data transmission between the elements of the telescopes. It is also responsible for providing the time reference, which is essential for an interferometer.
The biggest challenge in terms of computing performance and storage capacity is related to the steps between the acquisition of raw data at the telescopes, the production of multi-dimensional images of the sky and their distribution to the astronomical community. The two main consortia in charge of data processing are the CSP and the SDP. Very briefly, the first is the SKA “central brain”. It is responsible for a) removing terrestrial radio-frequency interferences (RFIs) from data, b) detecting and providing accurate timing of pulsars and c) converting the electrical signals received by SKA antennas into interferometric visibilities. At this point, visibilities will be transported from the telescope sites to big data centres in Perth and Cape Town, where it is the responsibility of the SDP consortium to build up the hardware platforms, software and algorithms needed to produce and distribute to the community scientific products ready for the analysis of the scientists (image cubes, catalogs of sources, time-domain spectral data, …). Typical processing powers of 50 and 100 Pflop will be requested for CSP and SDP activities, with an increasing rate of archival capacity of a few hundreds of TBytes/yr.
Importantly, consortia have to face the “Big Data” challenge of the SKA not only in terms of computing power and data rate, but also concerning energy consumption, with a proposed ceiling of about 5MW per telescope. Concerning the organisation of clever solutions for the crucial energy issue of the SKA project, a “Power Supply Options Workgroup” (PSOW) has been set up in 2016. This SKAO-managed advisory group is in charge of investigating energy supply (preferentially green) solutions, both in Australia and in South Africa. The members of this international team are directly interacting with industry in Member and Observer countries.
To complete our panorama of the SKA WPs and consortia defined at the time of the RfP, the Telescope Manager, in charge of all hardware and software required to control the telescope and associated infrastructure, is particularly important for planning all SKA operations (from observations to data storage) and to evaluate their online performance.
At the time of the RfP, the development of Phased Array Feeds (PAF) was part of the DSH WP. After the Design Baseline decision in 2015, which does not include the use of the PAF technology in Phase 1 of the SKA, a separate PAF consortium has been created for developing current designs of these receiver arrays placed at the focus of each parabolic dish, replacing single receiver elements employed by most current radio telescopes. This technology, which can enhance the telescope field of view by a factor of a few dozens, is currently used in the case of two pathfinder/precursor instruments: ASKAP (AUS) and APERTIF (NL).
Before concluding this quick overview of the huge technical work behind the construction of such an amazing “machine”, we stress that, as in the case of PAF, the technical consortia work is largely based on the construction and operation of precursors and pathfinders instruments. The SKA is going to become a reality since, in the last years, through the huge progress in antenna design and wide bandwidth feeds, as well as in the ability to transport and process massive amounts of data, a new generation of radio telescopes is being built.
At low frequencies, instruments such as the Low-Frequency Array (LOFAR, in Europe, with its major extension NenuFAR, in France) and the Murchison Widefield Array (MWA, in Australia) employ several thousands of inexpensive dipole antennas arranged within stations without moving parts; the signals from these stations are digitised, transported to a central processor and combined to emulate a conventional dish antenna. These telescopes process the signal on sufficiently short time scales to correct for the ionospheric changes, severely affecting radio observations below a few hundreds MHz. At higher frequencies (from hundreds of MHz to a few GHz), two major arrays are being built, which are formed by tens of big (12-15 m diameter) dishes: ASKAP in Australia and MeerKAT in South Africa. In addition, several major radio facilities have been recently upgraded to improve their performance, including, for instance the Jansky Very Large Array (JVLA, in New Mexico), the Giant Meterwave Radio Telescope (GMRT, in India) and the Westerbork Synthesis Radio Telescope (WSRT, in the Netherlands).
The reader should keep in mind that SKA precursors are the three instruments that are located on the future SKA sites (MWA, ASKAP and MeerKAT), while the pathfinder status is given to radio telescopes engaged in SKA related technology and science studies (a census of these instruments is available at the SKA web page).
1.2.3 Beyond the SKA Observatory: the regional data centres
The data archive operated directly by the SKA Observatory will only have the capacity to manage a portion of the enormous scientific output from the SKA telescopes. In addition, within the current construction costs, no provision is made for the distribution of data to users, nor for computational facilities to enable data analyses beyond the SDP standard data products.
A Data Flow Advisory Panel (DFAP) was thus initiated by the SKA Board in July 2015 to advise SKAO on how to optimise the telescopes data flow. Based on DFAP recommendations, other research infrastructures are being organised all over the world, called “Regional Data Centres”, which will include public and private organisations and will operate in agreement with the SKA Observatory but not under its control. In this case, “regions” are widely identified as large areas in the world. At the moment, six Regional Centres are being planned, in Europe (see Sect. 4.2.2 for more information), Canada, Africa, India, China and Australia. Each regional data centre will probably be a network of several nodes in different countries.
The centres will provide the necessary additional massive archiving capability, as well as the computational power to help researchers with the scientific analysis. In particular, three components have been identified by the DFAP that, being not provisioned within the current scope of the SKA Observatory, are the main responsibilities of regional data centres:
-
•
computational capacity for re-processing and science analysis;
-
•
long-term storage capacity for archiving of standard SKA and derived data products;
-
•
local user support for post-processing and science analysis.
1.3 Overview of the SKA situation in France
1.3.1 The organisation of the French community towards the SKA
Despite being amongst the founding partners in the first stages of SKA development (see Sect. 4.2.1), for programmatic and financial reasons France did not join the group of countries which formed the SKA Organisation at the end of 2011. The SKA project is thus completing the pre-construction phase without France as a formal partner, which is nevertheless invited as an observer to the SKA Board meetings.
French scientific and technological implications in the project did not stop after 2011, assisted amongst others by the initiatives of the Action Spécifique SKA-LOFAR (AS SKA-LOFAR), a structure set up in 2009 by CNRS-INSU to promote activities related to low-frequency radio astronomy in France. During 2014, the French community worked on the 2015-2020 CNRS-INSU astronomical roadmap and an expression of the undeniable scientific and technological interest for the SKA emerged. As a result, in 2016 the CNRS-INSU, together with national institutes already involved in the SKA project (Paris and Côte d’Azur Observatories, and Bordeaux and Orléans Universities), created the SKA France Coordination, in charge of organising the technological and scientific activities preparing a future French participation to the SKA project, within both research institutes and potentially interested industrial partners.
The current organisation of SKA France includes:
-
•
a steering committee, responsible for the strategic coordination of activities related to SKA between the various institutes involved in France;
-
•
a coordinator, who chairs the SKA France Advisory Committee (see below), coordinates the technical and industrial initiatives towards the SKA, facilitates the connections between the various French scientific groups working on the SKA project, reports to the steering committee on the status of the SKA and on the progress of activities of SKA France;
-
•
an advisory committee, in charge of facilitating the activities and communication between the various scientific groups working in France on the SKA.
The establishment of SKA France as a national project is intended to complement the work done by the AS SKA-LOFAR, which has a mandate to encourage scientific involvement in all current radio astronomical facilities. SKA France has the specific responsibility to prepare and coordinate the French contributions to the international SKA project in the period before the SKA construction phase. This includes the communication of technical, strategic and political information amongst all the SKA participants in France.
1.3.2 French participation to the SKA preparation
Several institutes in France are involved at various levels in the design and pre-construction phase of the SKA, with engineers and researchers participating in five of the eleven technical design consortia and in all the science working groups (SWG) established by the SKA Organisation.
The ramping scientific interest in the SKA exploitation is demonstrated by the fact that, while at the end of 2016 approximately 30 French researchers were officially participating to the SKA SWG, today about 170 astrophysicists, from more than 40 different research institutes, are co-authors of this Volume. Their fields of interest cover the whole topics of the international SWG, going from the far Universe through cosmology and extra-galactic astronomy, to the study of our own Galaxy, of its stars and planets, without forgetting the investigation of the transient universe and the fascinating and extreme objects that allow fundamental physics studies (Sect. 2).
Some of the contributions of this White Book reflects the yearly implication of French researchers in the international definition of the key scientific performances of the SKA: sixteen French researchers were authors or co-authors of more than 30 out of the 135 chapters of the AASKA14 SKA Science Book published in 2015, with five of them being in the core-teams of SWG. Françoise Combes (Observatoire de Paris and Collège de France) has recently been nominated co-chair of the Extragalactic spectral line SKA Science Working Group (SWG), together with Robert Beswick (Manchester University). This group was created after the 2014/2015 SKA re-baselining related activities in order to address the SKA capability for galaxy evolution studies through (non-H i) extragalactic spectral lines, a topic of great interest for the French community, in particular due to the synergy with higher-frequency radio telescopes. A French researcher has also served as chair for one of the Science Assessment Teams organised during the recent Cost Control Project in spring 2017.
“Synergy” has been the keyword that has allowed to make the interest of French astronomers exploding in the last months. Through seminars, workshops and discussions organised in France, researchers non-expert of radioastronomical techniques have realised that this will not be a handicap at all in the SKA-era, since images, spectra and catalogs will be provided to the whole community that wants to derive physical informations about the sky from radio photons. It is this aspect that, together with the fact that the SKA will nicely complement most of the main present and future astronomical projects, has significantly increased the number of French astronomers interested to fully exploit its observations. To be noted that, in addition to the co-authors of this White Book, an expression of interest for the SKA has been signed by about one hundred researchers, who, even if not yet ready to contribute to this Volume, are conscious of the expected impact of this project for their future work. Their names are listed at the end of the White Book.
Next sections will allow the reader to discover interesting and sometimes innovative ideas related to the four fields on which the SKA will be a unique instrument (i.e. Epoch of Reionisation, H i studies, cosmic magnetic fields and fundamental physics with pulsars), but also a very rich overview of what the SKA will be able to do together with other projects in which France is deeply involved, both space missions and telescopes on Earth, covering the whole electromagnetic spectrum. This is clearly the main object of the very rich “Scientific synergies with other instruments” chapter (Sect. 3), but it emerges too from some topics on which the French community has particularly innovative ideas compared to international SKA partners, such as on the study of the Interstellar Medium (Sect. 2.3).
The technical participation of France to the SKA preparation is also of great value and described in this Volume (Sect. 4). The French community is actively involved on pathfinders and prototypes of the world’s largest project in radio astronomy for the 21st century, namely NenuFAR and EMBRACE (Sect. 4.1).
As detailed in Sect. 4.3, several French institutes are officially involved in five of the eleven SKA design consortia (Sect. 1.2.2). The Nançay Radio Observatory (Unité Scientifique de Nançay, USN, a department of Paris Observatory) has a leading role in the design of Application Specific Integrated Circuits (ASIC) for the conception of dense aperture arrays within the Advanced Instrumentation WP MFAA and is thus part of the AAMID consortium. Within the Advanced Instrumentation programs, it is important to mention the participation of the Laboratoire d’Astrophysique de Bordeaux (LAB) on the design of wideband receivers (4.6-24 GHz). Based on its expertise developed on the ALMA project, LAB has also been solicited to work on Analog-to-Digital conversion technology for the DSH consortium, in particular for the highest-frequency band of SKA1 (Band 5). Two French institutes, Paris and Côte d’Azur Observatories, are involved in the AADC consortium. Paris Observatory, through the USN expertise, has made several development proposals for realisation of Low Noise Delay to decrease the power consumption, with the same performances. Observatoire de la Côte d’Azur works on the development of algorithms for image reconstruction. The signal processing expertise of the French community is of great interest for the SKA data challenge. At the moment, Paris Observatory is involved in the SDP consortium for the development of algorithms for the mitigation of Radio Frequency Interferences, imaging and calibration.
It is important to stress that the French activity related to the optimisation of data processing is ramping up, both at academic and industry level in France, through a joint approach coordinated by SKA France (see Sect. 4.3.1). A major achievement of the SKA France coordination has indeed been the interest raised in big companies and small/medium size enterprises. As developed in Sect. 5, the SKA France coordination has performed a joint comprehensive analysis of both the expertise available in France and the needs of the SKA project not yet covered by the partnering countries. Based upon this analysis, an ensemble of workshops grouping industry and academic experts has led to the identification of four key axes of interest for French companies, including high-frequency digitalisation technologies and HPC, signal processing, renewable energy production, distribution and storage, and system engineering. This joint public-private research approach has recently lead to discuss the evolution of SKA France towards a contractual structure, called “Maison SKA France”, which is described in Sect. 7.
France participates to several other key fields of the SKA project, through the implications of internationally recognised experts. The French SKA Industry Liaison Officer (ILO), Gabriel Marquette (General Manager of “EUROGIA”, a Cluster for Low carbon energy technologies developed within the “EUREKA” IGO that groups 44 countries), is one of the eight members of the SKA Power Solutions Options Workgroup. France is also participating through CNRS-INSU to the organisation of the European SKA data centre within the H2020 AENEAS project (Sect. 4.2.2), and, despite the fact of being a non-member partner666The institutes or organisations participating to AENEAS are considered full member or non-member partners if they are from countries that are current SKA members or non-members of the SKA Organisation, respectively. In the first case they lead the AENEAS work-packages and are responsible for their delivery. In the second case they are keen to develop their technological experience and may host a node of the European data centre. These partners are funded at a lower level than the full members., some key roles in the project are played by French researchers: C. Ferrari, SKA France coordinator, is the elected chair of the AENEAS General Assembly, and J.-P. Vilotte, coordinator of HPC activities within CNRS-INSU, is one of the members of the External Advisory committee of AENEAS, together with Ian Bird (LHC Computing Grid Project Leader at CERN) and Martin Zwaan (Head of the ALMA Regional Centre at ESO).
We now leave the reader to discover more details about the wide scientific and technological interests of the French community in the SKA project that we have shortly summarised above.
References:
Beswick, R. J., et al., 2015, AASKA14, 70;
Braun, R. et al. 2015, “Proceedings of Advancing Astrophysics with the Square Kilometre Array” (AASKA14), 9-13 June, 2014, Giardini Naxos, Italy, PoS, id.174
Carilli, C. & Rawlings, S., 2004, Science with the Square Kilometer Array, New Astronomy Reviews, 48 (Nos 11-12), 979 (Elsevier, Amsterdam), eds. C. Carilli & S. Rawlings;
Condon, J. J. & Ransom, S. M., 2016, Essential Radio Astronomy, Princeton University Press;
Duc, P.-A. & Renaud, F., 2013, LNP, 861, 327;
Ekers, R., 2012, in Proceedings of the meeting ”Resolving The Sky - Radio Interferometry: Past, Present and Future”. April 17-20,2012 Manchester, UK. Published online at http://pos.sissa.it/cgi-bin/reader/conf.cgi?confid=163, id.7;
Fender, R., et al., 2015, AASKA14, 51;
Hoare, M., et al., 2015, AASKA14, 115;
Janssen, G., et al., 2015, AASKA14, 37;
Johnston-Hollitt, M., et al., 2015, AASKA14, 92;
Koopmans, L. et al., 2015, AASKA14, 1;
Kramer, M. & Stappers, B., 2015, AASKA14, 36;
LIGO Scientific Collaboration & Virgo Collaboration, 2016, PRL, 116, 061102;
Prandoni, I. & Seymour, N., 2015, AASKA14, 67;
Maartens, R., et al., 2015, AASKA14, 16;
Nakariakov, V., et al., 2015, AASKA14, 169;
Staveley-Smith, L. & Oosterloo, T., 2015, AASKA14, 167;
Taylor, A. R. & Braun, R., 1999, Science with the Square Kilometer Array, eds. A. R. Taylor & R. Braun;
Umana, G., et al., 2015, AASKA14, 118;
Vazza, F., et al., 2015, A&A, 580, 119
2 Science
2.1 Early Universe, cosmology and large scale structures
Contributors of this section in alphabetic order:
R. Ansari [Laboratoire de l’Accélérateur Linéaire, IN2P3-CNRS, Université de Paris-Sud, Orsay Cedex, France], D. Aubert [Université de Strasbourg, CNRS, Observatoire astronomique de Strasbourg, UMR 7550, Strasbourg, France], M. Bucher [Astroparticule et Cosmologie APC, Université Paris Diderot, CNRS/IN2P3, CEA/IRFU, Observatoire de Paris, Sorbonne Paris Cité, Paris, France], J. Cohen-Tanugi [Laboratoire Univers et Particules de Montpellier, Université de Montpellier, CNRS/IN2P3, Montpellier, France], F. Combes [LERMA, Observatoire de Paris, Collège de France, École normale supérieure, PSL Research University, CNRS, Sorbonne Universités, UPMC Univ. Paris 06, Paris, France], H. Courtois [Université Claude Bernard Lyon I, Institut de Physique Nucléaire, Lyon, France], C. Ferrari [Université Côte d’Azur, Observatoire de la Côte d’Azur, CNRS, Laboratoire Lagrange, Nice, France], K. Ferrière [IRAP, Université de Toulouse, CNRS, UPS, CNES, Toulouse, France], G. Lagache [Aix Marseille Univ, CNRS, LAM, Laboratoire d’Astrophysique de Marseille, Marseille, France], M. Langer [Institut d’Astrophysique Spatiale, CNRS, UMR 8617, Université Paris-Sud, Université Paris-Saclay, Orsay, France], G. Lavaux [Sorbonne Universités, UPMC Univ Paris 6 et CNRS, UMR 7095, Institut d Astrophysique de Paris, Paris, France], M. Limousin [Aix Marseille Univ, CNRS, LAM, Laboratoire d’Astrophysique de Marseille, Marseille, France], C. Magneville [IRFU, CEA, Université Paris-Saclay, Gif-sur-Yvette, France], P. Noterdaeme [Sorbonne Universités, UPMC Univ Paris 6 et CNRS, UMR 7095, Institut d Astrophysique de Paris, Paris, France], P. Ocvirk [Université de Strasbourg, CNRS, Observatoire astronomique de Strasbourg, UMR 7550, Strasbourg, France], M. Pandey-Pommier [Université Lyon, Université Lyon1, Ens de Lyon, CNRS, Centre de Recherche Astrophysique de Lyon UMR5574, France], C. Peroux [Aix Marseille Univ, CNRS, LAM, Laboratoire d’Astrophysique de Marseille, Marseille, France], J. Richard [Université Lyon, Université Lyon1, Ens de Lyon, CNRS, Centre de Recherche Astrophysique de Lyon UMR5574, France], F. Rincon [IRAP, Université de Toulouse, CNRS, UPS, CNES, Toulouse, France], C. Schimd [Aix Marseille Univ, CNRS, LAM, Laboratoire d’Astrophysique de Marseille, Marseille, France], B. Semelin [LERMA, Observatoire de Paris, École normale supérieure, PSL Research University, CNRS, Sorbonne Universités, UPMC Univ. Paris 06, Paris, France], S. Torchinsky [Astroparticule et Cosmologie APC, Université Paris Diderot, CNRS/IN2P3, CEA/IRFU, Observatoire de Paris, Sorbonne Paris Cité, Paris, France]
2.1.1 Constraining astrophysical models of the Cosmic Dawn and the Epoch of Reionisation with the 21 cm signal
The reionisation of the universe starts with the formation of the first stars and ends around (as revealed by the observation of the Gun-Peterson trough in Quasar spectra, e.g. Fan et al. 2006). During this period, bubbles of ionised intergalactic medium (IGM) grow around primordial galaxies until they overlap. All the while, regions of the IGM that have not been reionised yet emit in the 21 cm line, tracing a distinctive pattern on the sky. The intensity of the signal against the background of the CMB is:
where is the local ionised fraction of hydrogen (fluctuations on scales smaller than kpc are smoothed by a convolution with the line profile along the line of sight), is the overdensity of the gas, is the local spin temperature of hydrogen, the CMB temperature at that redshift, the Hubble parameter, the velocity gradient along the line of sight and the redshift. The mK typical amplitude depends on the cosmology, see e.g. Mellema (2013) for more details. Astrophysical processes mainly have an impact on and . A loose definition of the Epoch of Reionisation (EoR) vs Cosmic Dawn (CD) is whether the fluctuations of the signal are dominated by the fluctuations of (late) or the fluctuations of (early on). The redshift of the transition between these two periods is very uncertain based on current observations, but likely lies between and . The SKA is expected to measure the signal between Hz () and Hz () statistically through the power spectrum of the fluctuations but also by building a full tomography with a typical sensitivity of 1 mK at a resolution of . Koopmans et al. (2015) discuss in detail the impact of the SKA design on the expected capability to detect the signal. In this contribution we focus on some of the physical processes that determine the strength of the signal and how to constrain these processes using the upcoming observations.
Three parameters regulating the signal during the Cosmic Dawn
During the CD, the strength of the signal depends mainly on the spin temperature, that is itself determined mainly by the local temperature of the gas and the flux in the Lyman-alpha line. Through the Wouthuysen-Field mechanism, the Lyman- photons couple to the kinetic temperature of the gas, pulling it away from (see, e.g., Furlanetto et al. 2006). However, since cosmological distances are involved between the sources of the Lyman- photons and the location where the 21 cm signal is emitted in the IGM, these Lyman- photons were actually emitted in the whole band between Lyman- and the Lyman limit and underwent cosmological redshifting. Thus the local strength of the coupling is decided by the source formation efficiency (fraction of halo mass converted into sources within a Hubble time) and the sources emissivity in the full Lyman band. The source formation efficiency is the main parameter that connects the growth of structures dictated by cosmology and the actual production of photons. This fundamental parameter is crucial both during the CD and the EoR. On the other hand, the emissivity in the Lyman band is relevant only during the CD. Later on, the Lyman- flux becomes large enough so that and becomes insensitive to the exact value of the local Lyman- flux. We explored the influence of actually including the effect of the Lyman- coupling with detailed Lyman lines radiative transfer simulations in several works (Baek et al. 2009; Baek et al. 2010; Vonlanthen et al. 2011). Once the transfer is performed correctly in a model where the source formation history is fixed, only the ratio (see Semelin et al. 2017) between the emissivity in the Lyman band and the emissivity above the ionisation threshold is still a free parameter. is an effective parameter that depends in the initial mass function of the stellar populations. It can hopefully be constrained by the observations (see next paragraph).
We mentioned that is driven to by the Wouthuysen-Field coupling. But what determines the local value of ? If the local evolution of was the result of a simple adiabatic evolution, it would be fully determined by the cosmology and initial conditions, without the need of additional astrophysical parameters. However, as soon as the first sources are formed, there is the possibility that X-ray are emitted (by X-ray binaries, SNs, AGNs) and travel far into the neutral IGM where they heat up the gas. Thus a parameterisation of the production of X-rays is required. A simple parameter has been widely used. It quantifies how much energy is emitted in the form of X-ray per unit of stellar mass formed (see Furlanetto et al. 2006). However, X-rays can be emitted in a large range of energies and their mean-free path in the neutral IGM is proportional to . X-rays with energies of several KeV actually have little chance to interact with the IGM before the end of reionisation. Thus the spectral properties of the X-ray emission is important in determining its heating efficiency (Fialkov et al. 2014). In Semelin et al. (2017) we define , the ratio of the energy emitted as Hard X-rays by X-ray binaries (using the template spectra of Fragos et al. 2013) to the energy emitted as Soft X-rays by QSOs. We show that varying this ratio between and is similar, in terms of effective heating, to decreasing by a factor of 3. This however applies to the spatially averaged heating. If we increase and to keep the average heating similar, the spatial fluctuations of the heating decrease in amplitude. Thus and cannot be collapsed in a single parameter when we study the 21 cm signal fluctuations. Thus , and form a basic 3-parameter set that regulates the 21 cm signal during the CD, for a fixed source formation history. The ability of SKA1 to constrain these parameters characterising CD is still under investigation: preliminary results can be found in Semelin et al. (2017). Due to its large low frequency coverage, SKA1 is however the only instrument likely to yield constraints. More detailed prediction are available for other parameters characterising the EoR (e.g. Grieg et al. 2015; Grieg et al. 2017; Shimabukuro and Semelin 2017). The modelling could be improved further by including more detailed physics: for example adding a parameter to describe the efficiency of H2 formation in primordial gas.
Machine Learning as a method to derive constraints on the model parameters
Semi-numerical and full numerical simulations predicting the 21 cm signal have been used mainly to explore the range of possible signals. This has been an important step in formulating scientific requirements for the SKA EoR project and adjust the instrument design accordingly. In the future however, the main task of both kind of simulations will be to extract astrophysical information from the observed signal.
This will concretely mean putting constraints on astrophysical parameters such as defined in the previous section, in the same way the CMB was used to put constraints on the cosmological parameters. Preliminary work has been done in this direction. Greig and Mesinger (2015, 2017) have developed a MCMC method using the 21 cm power spectrum as a metric and a fast semi-numerical code to sample the parameter space.
The advantage of the method is that it relies on a well established Bayesian formalism and provides local confidence contours in the parameter space. The limitation is that it has to use fast semi-numerical simulations because it requires generating the signal for a large number () of points in the parameter space. An alternative method is to use Neural Networks (NN) to either, in a forward modelling, predict the power spectrum for a given set of parameter (work in progress, J. Pritchard, private communication) or, in backward modelling, predict the values of the parameters for an observed power spectrum (Shimabukuro and Semelin, 2017).
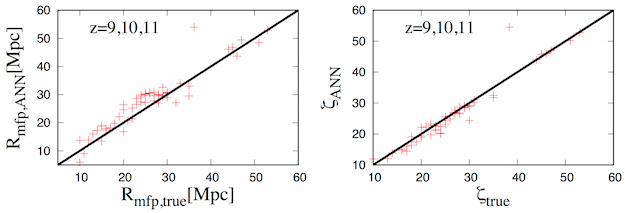
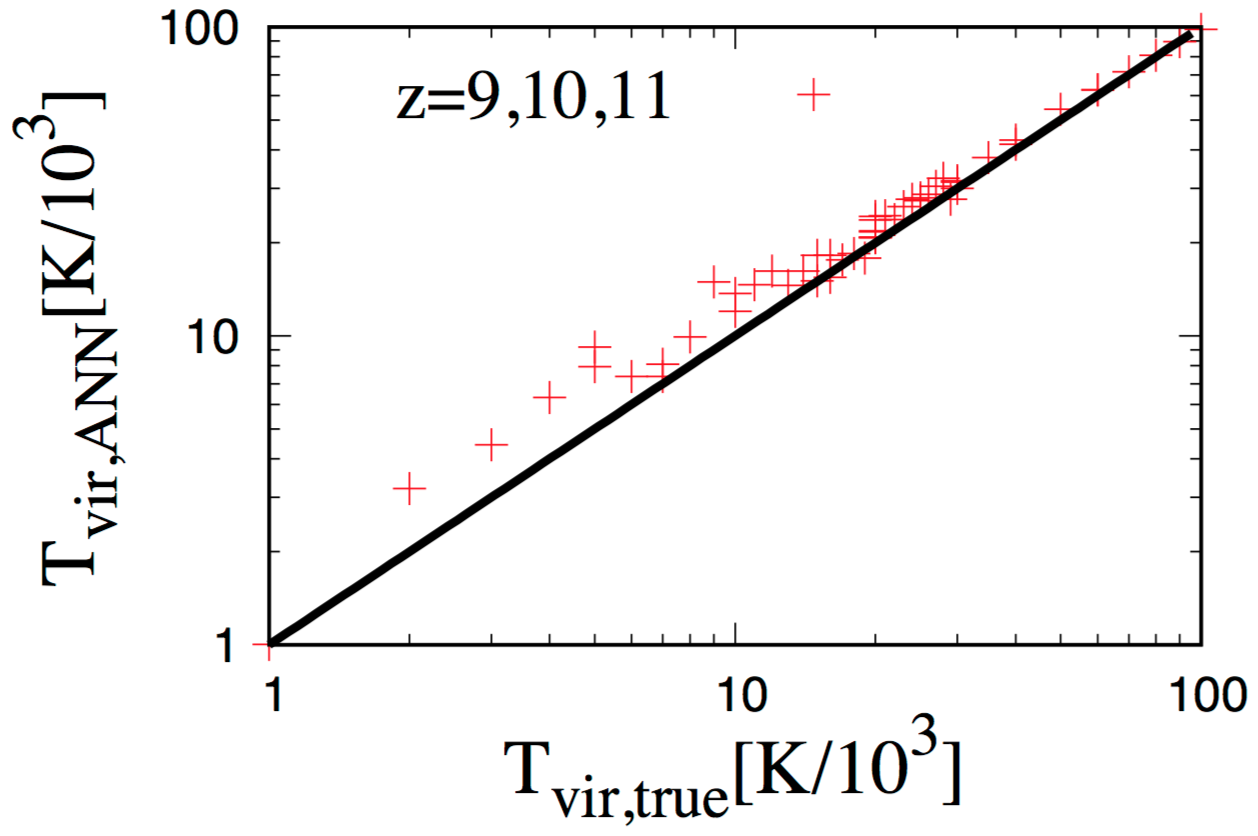
The parameters used in Shimabukuro and Semelin (2017) characterise the EoR rather than the CD: they are the same as in Greig and Mesinger works to allow comparison of the efficiency of the two methods. We have shown that using a learning sample limited to a few tens of points in the chosen 3-parameter space we can train a simple NN to reconstruct the parameters values from the power spectrum (see Fig. 9) with an accuracy only slightly worse than with the MCMC method (but with a factor of a thousand less computing time). This makes it possible to use full simulations to build the training sample and thus, hopefully, benefit from a more robust modelling. Both approaches and probably new ones will most likely be the subject of intense investigation in the years to come.
References:
Baek S. et al., 2009, A&A, 495, 389;
Baek S. et al., 2010, A&A, 523, 4;
Fan H. X. et al. 2006, ARAA, 44, 415;
Fialkov A. et al., 2014, Nature, 506, 197;
Fragos T. et al., 2013, ApJ, 776, 31;
Furlanetto S. et al., 2006, Phys Rep, 433, 181
Greig B. and Mesinger A., 2015, MNRAS, 449, 4246;
Greig B. and Mesinger A., 2017, arXiv170503471;
Koopmans L. et al., 2015, AASKA14, 1;
Mellema G. et al., 2013, Experimental Astronomy, 36, 235;
Semelin B. et al., 2017, in prep.;
Shimabukuro H. and Semelin B., 2017, MNRAS, 468, 3869;
Vonlanthen P. et al., 2011, A&A, 532, 97
2.1.2 21 cm signal from the EoR
Once the first sources of UV radiation appear in the Universe, the cosmic hydrogen experiences a global transition known as the Epoch of Reionisation (EoR). During this transformation a network of hot and ionised ’bubbles’ is established (see Fig. 10), with a topology dictated by the distribution of large scale structures and a redshift evolution set by the photons production history of the first galaxies and AGNs. Growing H ii regions eventually merge, resulting in a fully ionised inter-galactic medium. This scenario is supported by the evolution of the IGM opacity as measured in quasar spectra (see e.g. Fan et al 2006; Becker et al. 2015) with a full completion of hydrogen reionisation by . Planck latest estimates of Thompson optical depth also favour a late Reionisation with typical half-reionisation redshifts (Planck Collaboration 2016). This timing is also supported by less conclusive probes such as the reconstruction of star formation histories in dwarf galaxies (Brown et al. 2014) or the rapid evolution of Ly emitters (Konno et al. 2014) at . SKA will offer first insights on the transition through direct 3D (2D+time) tomography of the 21 cm signal (Madau et al. 1997).
These data will be used to investigate the connection between the sources (first galaxies and AGNs) and the IGM. For instance the evolving geometries of a Reionisation powered by a few bright galaxies or abundant fainter ones are expected to be different (see e.g. McQuinn et al. 2007; Chardin et al. 2012). Imaging will also provide a better view of the actual Reionisation history experienced by biased regions (and therefore galaxies): structures tend to be reionised earlier than the Universe as a whole and often on large durations (up to Myrs, see e.g. Li et al 2014). The details of these timings could be important to investigate the suppression of star formation in subhaloes by radiation (Ocvirk & Aubert 2011; Ocvirk et al. 2014).
Likewise powerful AGNs are expected to create large H ii regions with radii of 10s of Mpc (see e.g. Datta et al. 2012, 2016): detections with SKA1-LOW should be possible with 1000 hrs of observation and will provide constraints on AGNs or IGM high-z properties. Such prospects open the possibility of linking the population of H ii regions with e.g. the luminosity functions (LF) of galaxies and AGNs : first constraints on LFs are already available (e.g. Bouwens et al. 2015; Giallongo et al. 2015) and will be further refined with future experiments such as JWST or ATHENA. SKA will provide an alternate view of the first sources by putting constraints on their influence on their environment : as such, SKA will be essential component to deepen our understanding of structure formation in its earliest stages. It would also provide key insights on the relative contribution of star forming galaxies and quasars to the Reionisation of the Universe.
Remains the question of the best way to quantify the statistical properties of the Reionisation process from 21 cm maps. For instance, a large number of studies focus on the well-established power-spectrum estimator (e.g. Santos et al. 2008; Baek et al. 2010) : the frequency structure of the 21 cm signal is shown to be quite sensitive to the nature of the dominant source of UV photons and well within the capability of SKA1. Furthermore, power spectra measurements are within the capabilities of some SKA precursors. However, the power spectrum is well suited to gaussian signals whereas the structure of the ionised gas is expected to be highly non-gaussian at all scales (see e.g. Mellema et al. 2006) : 21 cm maps with the same 2-pt statistics can present quite different features (see e.g. Mellema et al. 2015). As a consequence, power spectra are unlikely to be sufficient to break degeneracies between different reionisation scenarios : imaging and 3D tomography, only achievable with SKA, appear as necessary. Maps could be analysed using techniques such as the distribution of H ii regions sizes (e.g. Zahn et al. 2007; Iliev et al. 2006; Chardin et al. 2012) or the calculation of the Euler-characteristics (Friedrich et al. 2011) : such estimators were shown to relate to the properties of the underlying sources.
Finally, 21 cm imaging could also be used to target specific objects, such as luminous quasars. Properties such as the mass or the age of these objects or even the anisotropy of their emission could be obtained (e.g. Wyithe 2008; Datta et al. 2012 or Mellema et al. 2006), providing valuable informations on the formation and the growth of supermassive blackholes at these early times.
In principle, the same kind of investigations could be conducted with galactic sources. Taking Koopmans et al. (2015) as a reference, detection of ionised bubbles with radii in the 2-10 comoving Mpc range could be envisioned at z with SKA1-LOW. According to studies based on semi-analytic and radiative hydrodynamics simulations, such sizes are expected for masses typical of progenitors of groups of galaxies and clusters. The average corresponding masses are similar to M⊙ during the Reionisation, leading to M⊙ objects at (e.g. Alvarez et al. 2009; Chardin et al. 2014).
References:
Alvarez, M., et al., 2009, ApJL, 703, 167;
Baek, S., et al., 2010, A& A, 523, A4;
Becker, G. D., et al., 2015, MNRAS, 447, 3402;
Bouwens, R. J., et al., 2015, ApJ, 803;
Brown, T. M., et al., 2014, ApJ, 796, 91;
Chardin, J., et al., A& A, 2012, 548, 9;
Chardin, J. et al., A& A, 2014, 568, 52;
Datta, K. K., et al., 2012, MNRAS, 424, 762;
Fan X., et al., 2006, AJ, 132, 117;
Friedrich, M. M., et al., 2011, MNRAS, 413, 1353;
Giallongo, A., et al., 2015, A&A, 578, 83;
Iliev, I. T., et al. MNRAS, 371, 2006;
Konno, A., et al. 2014, ApJ, 797, 16;
Li, T., et al., 2014, 785, 134;
Lidz A., et al., 2008, ApJ, 680, 962;
Madau P., et al., 1997, ApJ, 475, 429;
Mellema G., et al., 2006, MNRAS, 372, 679;
Mellema, G., et al., 2015, AASKA14, 10;
Ocvirk, P. & Aubert, D., MNRAS, 2011, 417, 93;
Ocvirk, P., et al., ApJ, 2014, 794;
Planck Collaboration, 2016, A& A, 596, 108;
Santos, M. G., et al., 2008, ApJ, 689, 1;
Wyithe, J. S. B., 2008, MNRAS, 387, 469;
Zahn, O., et al., 2007, ApJ, 654, 12
2.1.3 Cross-correlating cosmic fields in the EoR
SKA1 will deliver H i intensity maps over a broad range of frequencies (and thus redshifts) and a substantial fraction of the sky. Cross-correlating H i intensity maps with galaxy surveys, Cosmic Backgrounds (CMB, near- and far-IR backgrounds), or line surveys (Lyα, CO or CII) can provide, e.g., high precision clustering measurements, cosmological constraints (e.g. on the nature of primordial fluctuations), the statistical measure of average reionisation bubble size and the HI content of early galaxies. Cross-correlation studies are advantageous since the measurable statistics do not suffer in the same way from foregrounds and systematic effects as auto-correlation function measurements. What can be learnt from cross-correlations in the EoR is potentially huge, and we evoke hereafter only a few examples in which the French community intends to play a leading role.
The cross-correlation with CMB temperature anisotropies
Through Thomson scattering, the CMB is sensitive to the amount of free electrons in the Universe since Recombination. On the contrary, 21 cm line fluctuations trace the evolution of the amount of neutral hydrogen. Both observables are thus natural probes of reionisation. Complementary information can be in principle extracted from their cross-correlation. Several authors have studied the cross-correlation of CMB temperature anisotropies and cosmological 21 cm line fluctuations both on large (e.g. Alvarez et al. 2006) and small (e.g. Cooray, 2004) angular scales (see Tashiro et al. 2010, for additional references). On large scales, the 21 cm line fluctuations correlate with the Doppler CMB anisotropies. For a given redshift of reionisation (corresponding to an ionised fraction of ), the resulting cross-power spectrum is sensitive to the duration of reionisation . Adapting the results of Tashiro et al. (2010) to the current specification from the SKA1 System Baseline Description documents, this signal could be detectable with a signal-to-noise ratio of (for a total observing area of ), or even up to (for ), given the limits on the duration of reionisation provided by the Planck Collaboration (2016b; note that the relation between the in Tashiro et al. 2010, and the defined in the Planck Collaboration paper is not trivial).
On the other hand, before reionisation is complete, small scale secondary CMB temperature anisotropies are produced by the Sunyaev-Zeldovich (SZ) effect due to the inverse Compton scattering off the free electrons contained in the cosmological H ii regions surrounding sources of ionising photons (Aghanim et al. 1996). The kinetic SZ (kSZ) effect, due to bulk motions of those electrons, is dominant over the thermal effect during reionisation. The cross-correlation of the kSZ with the 21 cm line fluctuations produces characteristic shapes in the cross-power spectrum that may in principle be used to extract information on the size of the H ii regions, and therefore on the nature of the ionising sources (see Fig. 11 for illustration). However, depending on the dominant ionising sources and on , the detection of this signal will be difficult, even with the SKA (Tashiro et al. 2011).
The cross-correlation with CMB polarisation
The precise measurement of the CMB E-mode polarisation by the Planck-HFI has allowed the Planck Collaboration (2016a,b) to reduce significantly the uncertainty on the redshift of reionisation and to show that is substantially lower than previously thought. The CMB E-mode polarisation, as a powerful probe of reionisation, can also be cross-correlated with the 21 cm line fluctuations. As Tashiro et al. (2008) have shown, both the amplitude and the shape of the cross-power spectrum are sensitive to and , and might also be used to test for more exotic reionisation scenarios. It is interesting to note that the expected signal-to-noise ratio of this signal is essentially independent of the duration (Tashiro et al. 2010).
The cross-correlation with galaxy surveys
Lidz et al. (2009) and Wiersma et al. (2013) have undertaken theoretical studies of the cross-correlation between 21 cm measurements and galaxies detected with high-redshift surveys, in particular Ly emitters. This cross-correlation promises to be an excellent tool for inferring the topology of reionisation. On large scales, the 21 cm and galaxy fields are anti-correlated during most of the EoR. However, the two fields become roughly uncorrelated on scales smaller than the size of the H ii regions around detectable galaxies. Hence, the 21 cm galaxy cross-power spectrum provides a tracer of bubble growth during reionisation, with the signal turning over on progressively larger scales as reionisation proceeds. Measuring the turnover scale as a function of galaxy luminosity constrains the characteristic bubble size around galaxies of different luminosities (Lidz et al. 2009). At lower redshifts, the cross-correlation of 21 cm intensity maps with galaxy surveys is a measure of the H i content of galaxies and comoving H i density, - if the H i bias, bHI, can be estimated externally (Wolz et al. 2016; Masui et al. 2013).
The cross-correlation with cosmic near- and far-IR backgrounds
The lower value of the optical depth of Thomson scattering reported by the Planck collaboration (2016a,b) strengthens the likelihood that early star-forming galaxies dominated the reionisation process (e.g. Bouwens et al. 2015; Robertson et al. 2015). Consequently, any attempt at understanding reionisation is paired with an understanding of primeval star formation. In the current view, a very steep faint-end slope of the UV luminosity function is required, implying the existence of plenty of faint galaxies. These galaxies may be too faint to be detected individually but their signal is embedded in the near- and far-IR backgrounds that measure the cumulative light from all galaxies in the near-IR – which probes the redshifted starlight (e.g. Cooray et al. 2012; Kashlinsky et al. 2012; Fernadez & Zaroubi 2013) – and in the far-IR/sub-millimeter – which probes the light reprocessed by dust (e.g. Lagache et al. 2005; Planck Collaboration 2014). The H i and IR backgrounds result from different, mutually exclusive regions, resulting in a strong anti-correlation (Fernandez et al. 2014). Indeed, the cross-correlation coefficients are the most negative during the mid-stages of reionisation. There are many free parameters that can change the intensity of the high-redshift component of the IR backgrounds. However, Fernandez et al. (2014) have shown that the cross-correlation is not sensitive to the detailed physics of high-redshift galaxies, but to the reionisation history, such as and . This cross-correlation will also help answering the question of which types of galaxies are mostly responsible for reionisation (Jelić et al. 2015).
The cross-correlation with CII intensity mapping experiments
Instrumental concepts for reionisation CII experiments are emerging, with the Tomographic Ionized-Carbon Mapping Experiment (TIME-Pilot, Crites et al., 2014), and CONCERTO project (CarbON CII line in post-reionisation and ReionisaTiOn epoch, Lagache et al., in prep). These intensity mapping experiments will measure the 3D fluctuations of the [CII] line emission at redshifts . The atomic [CII] line is one of the most valuable tracers of star formation at high redshift. Like the aforementioned probes (IR background, galaxy surveys), CII and H i fluctuations are strongly anti-correlated at large angular scales. As shown by Gong et al. (2012), the CII-21 cm cross-power spectrum will capture the topology of the end of EoR, including the ionised bubble sizes and the mean ionisation fraction. It will help us understand how reionisation proceeded.
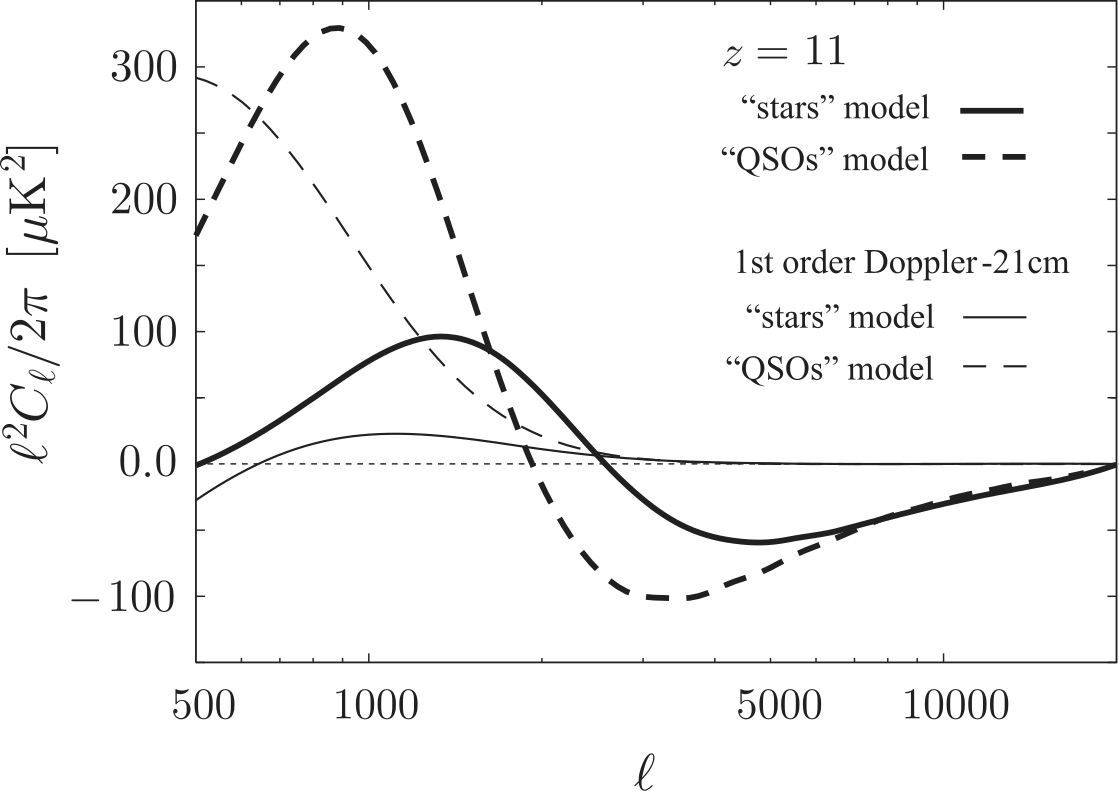
References:
Aghanim, N., et al., 1996, A&A, 311, 1;
Alvarez, M. A., et al., 2006, ApJ, 647, 840;
Bouwens, R.J., et al., 2015, ApJ, 811, 140;
Cooray, A. 2004, Phys. Rev. D, 70, 63509;
Cooray, A., et al., 2012, ApJ, 756, 92;
Crites, A.T., et al., 2014, SPIE, 9153, 1;
Fernandez, E.R. & Zaroubi S., 2013, MNRAS, 433, 2047;
Fernandez, E.R., et al., 2014, MNRAS, 440, 298;
Gong, Y., et al., 2012, ApJ, 745, 49;
Jelić, V., et al., 2015, AASKA14, 8;
Kashlinsky, A., et al., 2012, ApJ, 753, 63;
Lagache, G., et al., 2005, ARAA, 43, 727;
Lidz, A., et al., 2009, ApJ, 690, 252;
Masui, K.W., et al., 2013, ApJ, 763, 20;
Planck collaboration, 2014, A&A, 571, 30;
Planck collaboration, 2016a, A&A, 596, 107;
Planck collaboration, 2016b, A&A, 596, 108;
Robertson, B.E., et al., 2015, ApJ, 802, 19;
SKA1 System Baselinev2 Description (SKA-TEL-SKO-0000308);
SKA1 Level 0 Science Requirements (SKA-TEL-SKO-0000007);
Tashiro, H., et al., 2008, MNRAS, 389, 469;
Tashiro, H., et al., 2010, MNRAS, 402, 2617;
Tashiro, H., et al., 2011, MNRAS, 414 3424;
Wiersma, R.P.C., et al., 2013, MNRAS, 432, 2615;
Wolz, L., et al., 2016, MNRAS, 458, 3399
2.1.4 Cosmic magnetism
Magnetic fields seem ubiquitous in the Universe. Their presence has been detected not only at present times, but also in the distant past, up to a redshift 4. The origin of these fields remains unconstrained, and their role in the formation and evolution of cosmic structures, from sub-parsec to cosmological scales, is still a matter of intense investigation. Future generation radio-telescopes, and especially the SKA, will offer wonderful capabilities to answer many of the outstanding questions pertaining to cosmic magnetism.
Introduction
Magnetic fields are a familiar component of our everyday life. Quantum and statistical physics explain magnetism in materials on small scales. In contrast, the problem of the origin of magnetic fields in cosmology and astrophysics on large scales is still not settled. What are the mechanisms that generated magnetic fields in the Universe? Were the first magnetic fields created at high energies in the primordial era, or were they generated later on by astrophysical processes? Are present-day magnetic fields, measured in galaxies and galaxy clusters, the result of turbulent dynamos, or are they persistent relics of the Big Bang? What role did they play in the formation of cosmic structures? SKA1 and (some of) its precursors will provide crucial elements for answering those and related questions. Indeed, the origin and evolution of cosmic magnetism is one of the main science drivers of the SKA, and Cosmic Magnetism is already Key Science for LOFAR and the ASKAP. A very short review of the topic is presented here, and the reader is referred for instance to Beck et al. (2013), Johnston et al. (2008), Beck (2015) and Johnston-Hollitt et al. (2015) for more information.
Origin of large-scale magnetic fields
While the presence of large-scale magnetic fields in cosmic structures has been established for a long time, their origin is still unclear. Many possibilities have been put forward and examined in detail in the literature. The possible magnetogenesis mechanisms can be roughly divided into two kinds. Those of the first kind rely on the high-energy physics of the primordial, pre-recombination universe, namely inflation or phase transitions (e.g. Long et al. 2014; Bamba 2015). Those of the second kind rely on astrophysical batteries that occurred in the classical, post-recombination universe within formed structures or during their formation (e.g. Gnedin et al. 2000; Durrive & Langer 2015). For a review, we refer the reader to Widrow et al. (2012) and Ryu et al.= (2012). The only consensus reached so far is that cosmic magnetic fields must have been generated with relatively weak strengths (, and up to the nanoGauss, according to current estimates; e.g. Durrer & Neronov, 2013), otherwise they would have noticeably affected the structure formation process itself. These initial weak fields have then evolved to reach the observed magnitudes, scales, and shapes, during and after the formation of structures, by mechanisms that we evoke below.
Evolution of cosmic magnetic fields
Due to the high conductivity of the cosmic plasma and to the large scales involved, magnetic fields are frozen in matter. This ensures that, on the largest scales, magnetic field strengths decay as the inverse of the scale factor squared. On smaller, gravitationally unstable scales, the initial weak magnetic fields are amplified by several concurring effects. First, there is an adiabatic compression that operates during the gravitational collapse of structures. Second, further amplification can be provided by the stretching of field lines by shearing, swirling motions and compression in localised shocks. In particular, small-scale turbulence can amplify magnetic fields on small scales through a dynamo. A turbulent dynamo mechanism amplifying and sustaining magnetic fields up to levels on cosmologically fast timescales may notably be at work in the intra-cluster medium (ICM; e.g. Rincon et al. 2016). The cosmic history of this process, as well as the dynamics of field-amplifying magnetised convective processes relevant to the ICM, such as the magnetothermal and heat-flux driven buoyancy instabilities, are far from fully understood. The SKA provides the opportunity to learn a lot about magnetised dynamics in the ICM. Within rotating galaxies, large-scale differential rotation and small-scale turbulence combine in order to amplify, order and sustain large-scale magnetic fields through a large-scale dynamo. A review of the current status of the dynamo theory is available in Brandenburg et al. (2012). The flip-side is that present observations do not allow us to distinguish between magnetogenesis mechanisms of the primordial universe and astrophysical batteries as the characteristics of the initial fields are essentially erased by the powerful turbulent dynamo mechanisms acting upon them. There is one place, though, where the latter is possibly absent, or weak at most, and where we should look for clues about the origin of magnetic fields: the intergalactic space, and notably cosmic voids. The detection of intergalactic magnetic fields (IGMFs) is therefore one of the major objectives of the SKA.
Magnetic fields of the Milky Way
Interstellar magnetic fields in the Milky Way exist over wide ranges of sizes and strengths. They play a crucial role in the Galactic environment, where they govern the structure and dynamics of the interstellar gas, regulate the process of star formation, affect the evolution of supernova remnants and superbubbles, accelerate cosmic rays and channel their trajectories…Observation methods include dust polarisation, Zeeman splitting, Faraday rotation, and synchrotron emission, all of which are complex and indirect. Our current observational picture is that of a global spiral magnetic field with a significant turbulent component (e.g. Ferrière 2015). However, many open questions remain regarding both the global field (azimuthal structure, vertical parity, number and locations of radial reversals…) and the turbulent field (energy spectrum, structure functions, outer scale…). The reader may consult Haverkorn (2015) for reference. Using the SKA1 to improve our knowledge of magnetic fields in the Milky Way (e.g. Haverkorn et al. 2015) will not only lead to a better understanding of our own Galaxy(see, e.g., Sects. 2.3.6 and 2.3.7), but it will also help us define and remove Galactic foregrounds for a multitude of extragalactic and cosmological studies (e.g. Planck Collaboration, 2016).
Future observations with the SKA
Currently, we know that magnetic fields are present in galaxies of all
types (Beck & Wielebinski, 2013) as well as in galaxy clusters
(Feretti et al. 2012). There are hints indicating that intergalactic
filaments, too, may be magnetised, and recent analyses of high-energy
gamma-ray experiments suggest that so could the entire intergalactic
space (e.g. Haverkorn, 2015). Future magnetic field radio measurements
with the SKA1 and its precursors rely on Faraday rotation, synchrotron
radiation and full-sky polarisation measurements. The construction of
rotation measure (RM) grids of both Galactic pulsars and unresolved
polarised extragalactic sources will make it possible to unravel the
3D structure of magnetic fields in the Milky Way, on sub-parsec to
Galactic scales. The extragalactic-source RM
grid will also be essential for the detection and characterisation of
IGMFs. Both RM and extended synchrotron polarimetry measurements with the SKA1 will provide new information on the spatial distribution, structure and evolution of magnetic fields of the ICM (Bonafede et al. 2015), and possibly in the cosmic web (Giovannini et al. 2015). Such measurements, possibly used in synergy with velocity-field measurements with future X-ray observatories such as Athena, will be extremely valuable to diagnose dynamical field amplification processes in clusters. In addition, Faraday tomography (or RM synthesis) will allow us to reconstruct the 3D structure of magnetic fields in nearby galaxies. Finally, deep polarisation surveys will make it possible to
detect the magnetic fields present in the filamentary structure of the
Warm Hot Intergalactic Medium and measure their properties (Taylor et al. 2015, see also Sect. 2.2.1.1).
References:
Bamba, K., 2015, Phys. Rev. D, 91, 043509;
Beck, R., 2015, in Magnetic Fields in the Universe: From Laboratory and Stars to Primordial Structures, Eds.; A. Lazarian, E. M. de Gouveia dal Pino, C. Melioli, 3–17 (Springer);
Beck, R., et al., 2013, Astron. Nach., 557, 548;
Beck, R. & Wielebinski, R., 2013, in Planets, Stars Stellar Systems – Vol. 5: Galactic Structure and Stellar Populations, Eds. T. D. Oswalt & G. Gilmore, 641–723 (Springer);
Brandenburg, A., et al., 2012, SSRv, 169, 123;
Durrer, R. & Neronov, A., 2013, A&ARv, 21, 62;
Durrive, J.-B. & Langer, M., 2015, MNRAS, 453, 345;
Feretti, L., et al., 2012, A&ARv, 20, 54;
Gnedin, N., et al., 2000, ApJ, 539, 505;
Haverkorn, M., 2015, in Magnetic Fields in Diffuse Media, Astrophysics and Space Science Library, Eds. A Lazarian, E. M. de Gouveia Dal Pino & C. Melioli, 483–506 (Springer);
Haverkorn, M., et al., 2015, AASKA14, 96;
Johnston, S., et al., 2008, Exp. Astron., 22, 151;
Johnston-Hollitt M., et al., 2015, AASKA14, 92;
Ferrière, K., 2015, J. Phys.: Conf. Ser., 577, 012008;
Giovannini, G., et al., 2015, AASKA14, 104;
Long, A. J., et al., 2014, JCAP, 2014, 036;
Planck Collaboration 2016, A&A, 596, A105;
Rincon, F., et al., 2016, PNAS, 113, 3950;
Ryu, D., et al., 2012, SSRv, 166, 1;
Taylor, A. M., et al., 2011, A&A, 529, A144;
Taylor. A. R., et al., 2015, AASKA14, 113;
Widrow, L. M., et al., 2011, SSRv, 166, 37
2.1.5 Cosmological Evolution of the Neutral and Cold Gas Mass Density
The physical processes driving the dramatic change in star formation rate between and today remain to be identified (Fig 12). In order to address this issue, we need to target the fuel for star formation, i.e., the neutral and cold phase of the interstellar medium in high-redshift galaxies which account for the bulk of all star formation. Such studies are essential to understand the formation of galaxies and the growth of structures.
Instead of starlight, SKA will use the 21 cm line emission of neutral hydrogen to trace the matter. The expected number of accurate H i 21 cm redshift measurements in the SKA survey exceeds that from planned optical and infrared surveys by at least an order of magnitude. Yet these approaches are complementary to study the relationship between the luminous stellar populations and the gas from which they form.
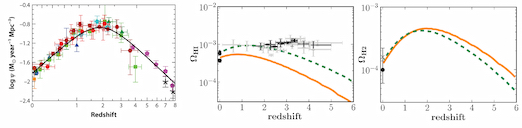
Observations of the 21 cm line of HI, either in absorption against background radio sources or in emission, probe neutral gas, and trace the gravitationally dominated galaxy dynamics rather well. Neutral gas constitutes most of the total interstellar gas mass in galaxies and tends to segregate in a warm ( a few K) and a cold ( 100 K) component.
H i Emission Line Surveys
In the optically thin regime, the 21 cm emission traces the neutral gas independently of its temperature. The SKA will be able to map the H i distribution and kinematics at ISM cloud-size resolution in many galaxies, and will be be complementarity with ALMA and the E-ELT to improve our understanding of star formation, gas flows into and out of galaxies. The roadmap towards achieving the observation of H i at cosmological redshifts and the imaging of more nearby objects at increasing spatial resolution and sensitivity involves the SKA Precursor instruments, ASKAP and MeerKAT, plus APERTIF in the northern hemisphere, SKA1 and ultimately SKA2. During the SKA Precursor phase, ASKAP and APERTIF will perform two concerted all-sky H i surveys (WALLABY and WNSHS), thanks to their large FoV (8-30 deg2), with an angular resolution of 8-30 arcsec and a velocity resolution of a few km/s. It is expected that a million galaxies will be detected, with an average redshift , and 3D H i maps produced for thousands of objects. At the same time, MeerKAT, which has a smaller FoV than ASKAP (1 deg2) but higher sensitivity, will perform a high-sensitivity survey (MHONGOOSE) of 60 selected nearby galaxies, aimed at probing low-density halo gas and a very high-sensitivity survey of part of the Fornax cluster, aimed at detection of cosmic web filaments. It will also perform an ultra-deep H i survey (LADUMA) aimed at detecting 6000 galaxies at the highest achievable redshifts, on average (but going out to for the most massive objects). For the SKA1 phase, observations will include the imaging of several millions of galaxies at a few arcsec resolution, at an average redshift of 0.4. The ultimate goal of SKA2 is the observation of a billion galaxies with an average redshift of at a resolution of 0.1 arcsec or (much) less.
21 cm Intensity mapping
The SKA H i emission line surveys discussed above has the advantage of determining the source redshift by a direct comparison of the observed radio frequency with the intrinsic emission frequency (). However, the relatively low radio brightness of these objects has limited their detection to the cosmological neighbourhood of our galaxy with the current instrument. Even with SKA, the detection of H i galaxies at higher redshifts, and beyond would remain a challenge, and be only for the brightest H i galaxies would be detected by SKA at . Intensity mapping provides a way to economically map huge cosmic volumes in three dimensions. Indeed, the total H i emission from 3D cosmic volume cells of , from the combined emission of hundreds of galaxies and H i clouds would be large enough to be detected by an instrument with a collecting area of few 10 000 , and with few hours integration time. Intensity mapping up to redshifts will thus require an instrument with a wide field of view , large collecting area and high sensitivity, but with a modest angular resolution ( arcmin). SKA aperture arrays will be well suited to carry intensity mapping surveys, covering a wide redshift range, up to . Intensity mapping technique and expected results are discussed in Sect. 2.1.7 of this book.
H i Absorption Line Surveys
Neutral gas is efficiently traced by Damped Lyman- Absorption systems (DLAs) against bright background sources such as quasars. Since the Lyman- line is insensitive to the temperature of the gas, DLAs can arise from both the warm and cold neutral interstellar medium (WNM and CNM, respectively). While the WNM dominates the absorption cross-section, it is possible to estimate the CNM fraction by deriving the physical conditions through e.g. the excitation of different species (e.g. Neeleman et al. 2015) or use tracers of cold gas, such as H2 (e.g. Noterdaeme et al. 2008). Despite the fact that about thirty thousand DLAs have been detected so far (e.g. Noterdaeme et al. 2012), these are mostly limited to , where the Lyman- lines becomes easily observable from the ground. In addition, current DLA samples are likely biased against the high metallicity/dusty gas which is more likely to be cold.
In the radio domain, not only flux-limited radio samples are unaffected by the presence of dust but there is a strong weighting of the CNM to the detectability of the 21 cm line. Indeed, the observed 21 cm optical depth () of a homogeneous cloud in thermal equilibrium is related to both its column density, (H i) and its spin temperature () as
| (1) |
However, the search of 21 cm absorption has currently been limited to small sub-samples of optically-selected absorbers, thereby adding selection effects to the dust bias inherited from the optical selection. Indeed, only a small fraction of the quasars are bright enough in the radio for current facilities that also have limited frequency coverage and poor RFI environment. Only a small number of 21 cm absorption systems have been detected to date (e.g. Gupta et al. 2012) and the evolution of the cold gas in galaxies is poorly constrained. The extreme sensitivity of SKA will change the situation dramatically, allowing to carry out blind (i.e. without optical selection) sensitive 21 cm absorption measurements against thousands of background radio sources and over the the full range of redshifts from out to .
-
Incidence of cold gas: The undergoing MeerKAT Absorption Line Survey (PIs Gupta/Srianand) should already detect several hundred intervening 21 cm absorbers at towards 1000 compact background sources, constraining the evolution of the amount of cold gas in the Universe at 10% accuracy in 5 redshift bins.
-
Gas kinematics and physical conditions: The 21 cm line is intrinsically very narrow (a few km/s) so that different velocity components in a given intervening galaxy are easily resolved, allowing for detailed studies of the gas kinematics (in the optical, only the total H i column density is available due to the saturation of the Lyman- line). The width of the each line component also provides a direct measure of the gas temperature.
-
Spatial mapping: An exciting prospect will be to use extended background radio sources (i.e. galaxies) to spatially map the intervening cold gas (Biggs et al. 2016).
We finally note that associated 21 cm absorbers, i.e. at the redshift of the background source will allow us to study the presence and properties of cold gas close to the central engine of quasars and in their host galaxy.
References:
Biggs, A., et al., 2016, MNRAS, 462;
Gupta N., et al., 2012, A&A, 544, 21;
Neeleman M., et al., 2015, ApJ, 800, 7;
Noterdaeme et al., 2008, A&A, 481, 327;
Noterdaeme et al., 2012, A&A, 547, L1;
Popping, G., et al., 2014, MNRAS, 442;
Zafar, T., et al., 2013, A&A, 556
2.1.6 Large scale structure through H i velocity fields
For the past 30 years considerable effort has been put into improving the quality of numerical simulations and galaxy redshift surveys to unveil the nature of the Dark Matter and its role in the clustering of cosmic structures. However, the dynamics of this process is not totally understood yet; we are still unable to successfully reproduce even the well-known structures and empty regions in the nearby Universe, let alone determine their masses.
A global effort is recently pursued to improve the detailed modelling of these processes using new analysis techniques (Libeskind et al. 2015; Carrick et al. 2015; Lavaux & Jasche 2016) and observational programs in optical and near-infrared bands, e.g. Cosmicflows (Courtois & Tully 2014; Tully et al. 2016) and TAIPAN (Kuehn et al. 2014). In Fig. 13, we illustrate the inference procedure from observations to gravitational and structuration models of our Local Universe. Using SKA capabilities we would enter into a new era of extragalactic velocity surveys, permitting to reconstruct the largest cosmographic maps of dark matter at an unprecedented level of accuracy. These will allow us the study of the accurate measurement of the expansion rate of the universe and the growth-rate of structures the standard methods based on the baryonic acoustic oscillations (BAO) and redshift space distortions (RSD) statistics, two of the best probes to test the cosmological model and General Relativity on large scales.
Observations
We will measure BAO and RSD by a H i redshift survey, the distinctive profile of the H i line allowing very accurate redshift measurement (). With the radio-telescope today having the largest collecting area, Arecibo, H i redshifts can only be measured in the local universe, (Freudling et al. 2011). Cosmological applications will require detecting enough galaxies to beat shot-noise and over a large enough area to reduce cosmic variance. As shown in Raccanelli et al. (2015), with 10,000 hours of observation time and a large optimal survey area of at least 5,000 deg2, SKA1 will produce redshifts using band-2 from SKA1-MID, while only 104 redshifts at higher redshifts () can be observed with SKA1-MID Band 1. SKA2 would increase quite drastically those numbers with about galaxies detected in a survey of 30,000 deg2 up to , which would be the largest unprecedented redshift survey.
The upcoming pathfinders H i (imaging) surveys with ASKAP, WSRT/APERTIF and MeerKAT will improve the estimate of galaxy distances in the local universe by reducing the scatter in the Tully-Fisher relation (TFR), establishing the statistical properties of the TFR at modest redshifts () using spatially resolved HI, and up to using global H i line widths. With SKA one can analyse the slope, scatter, and zero-point of the TFR as a function of redshift, cosmic environment, morphological type, and (specific) star formation rate of galaxies. This requires adequate angular resolution and column density sensitivity to image the H i kinematics in the outer gaseous disks of galaxies at higher redshifts, and to survey volumes that encompass the cosmic environments with sufficient statistical significance to mitigate cosmic variance. A spatial resolution of 10 kpc, corresponding to an angular resolution of 1.6 arcsec at a frequency of 950 MHz, would be sufficient to assess the kinematic state of the largest H i disks in -galaxies at . Based on studies of nearby galaxies, the required column density sensitivity at this angular resolution is within reach of an ultra-deep survey using SKA1-MID. The volume surveyed by a single SKA1-MID pointing at at 950 MHz is large enough to escape the cosmic-variance limit. Pushing TFR studies based on resolved H i kinematics to even higher redshifts would require SKA2 capabilities.
Because TFR is a relation between the apparent brightness (from optical photometry observations) and the intrinsic galaxy luminosity (derived from H i line-width radio observations, accurate distances derived from the TFR require accurate photometric calibration (Courtois et al. 2011). In practice, to obtain usable peculiar velocities, galaxy distances must be more accurate than 20%, translating in 0.2 mag accuracy in photometry. Two ground-based optical surveys, PanSTARRS in Hawaii and SkyMapper in Australia, will cover the entire sky in , , , bands. During the SKA timeline, these surveys will generate increasingly deep images of the entire sky with rigorous photometric quality control. By that time we will also have near-infrared imaging from Spitzer and/or Wide-Field Infrared Survey Explorer (WISE) satellites (WISE has now completed the imaging of the entire sky). We have prepared successful proof-of-concepts for the calibration and use of the TFR at Spitzer1 and WISE2 bands for a few hundreds of galaxies (Sorce et al. 2014; Neill et al. 2014).
Dark Matter, Dark Energy, and test of the gravitational theory by the large-scale dynamics
From the independent measurement of redshift () and distance () of sources, the latter obtained e.g. by the Tully-Fisher relation (TFR), their radial peculiar velocity can be inferred in the local universe according to the first order relation , where is the Hubble constant. Strong constraints on cosmological parameters can be obtained by using SKA peculiar velocities to recover the primeval BAO signal before it was blurred by non-linear clustering (e.g. Kazin et al. 2014; Anderson et al. 2015), and to model the RSD (Koda et al. 2014). Combined with the underlying redshift distribution, the reconstructed velocity field can also be used for density-density or velocity-velocity comparisons (e.g. Erdogdu et al. 2006; Lavaux et al. 2010; Carrick et al. 2015), or for cross-correlation with the dipole moment of the galaxy distribution as done by Nusser (2017). On sufficiently large scales, where the growth rate can be approximated by with in General Relativity (GR), the low-redshift observations like the one in SKA-MAPS (Santos et al 2014) will deliver the stringent test of GR by measuring the parameter at the percent level. This measurement will complement the constraints achieved by high-redshift galaxy surveys like WiggleZ, VVDS, VIPERS, and in the future eBOSS, PFS-SuMIRe, DESI, Euclid, or WFIRST, which do not have the information on velocities.
Besides, it will be interesting to combine SKA velocities with cosmic shear measurements obtained e.g. by Euclid or internally by SKA (see the SKA German proposal by P. Schneider) to test the gravitational instability paradigm on very large scales measuring the so-called gravitational slip (Doré et al. 2003; Reyes et al. 2010). Indeed, weak-lensing by large scale structure provides complementary information since it depends on both the spatial and temporal scalar perturbations of the metric while velocities depend on the temporal part only.
Finally, a remarkable application of SKA velocities will be to probe the gravitational theory in unexplored gravitational field regimes such as at the galactic scale (Desmond et al. 2017).
It is worth to mention that the SKA pathfinders, with accurate peculiar radial velocities for more than 50,000 galaxies within a sphere of radius 600 Mpc, will prepare the field for the best direct measurement of the present-day expansion rate of the Universe, the largest maps of the density and velocity fields of local structures, and unique new tests of large-scale gravitational physics using galaxy motions, including tests of modified theories of gravity.
For this purpose, it will be crucial to realise realistic cosmological simulations that can be compared directly to the observed velocity and density fields in the Universe, eventually considering not only the standard CDM model but also different kinds of Dark Matter and different theories of gravity with the appropriate gravity solvers. Indeed, the motion of galaxies is most directly in response to the clumped distribution of Dark Matter, which is directly related to the divergence of the cosmic velocity field. More generally cosmic flows depends on the physics of the Dark Sector, which is one of the main SKA science drivers.
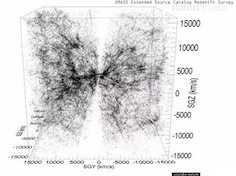
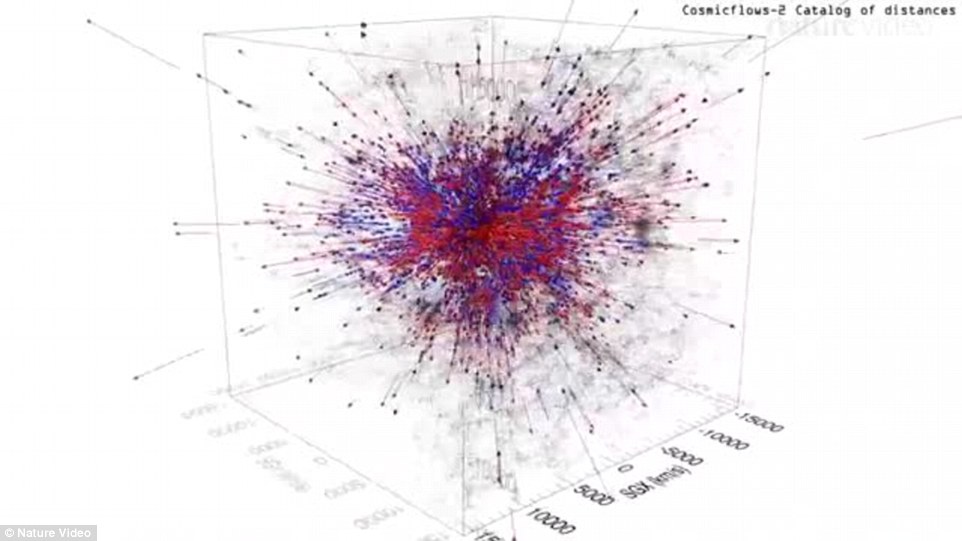
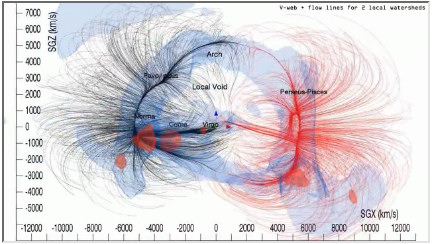
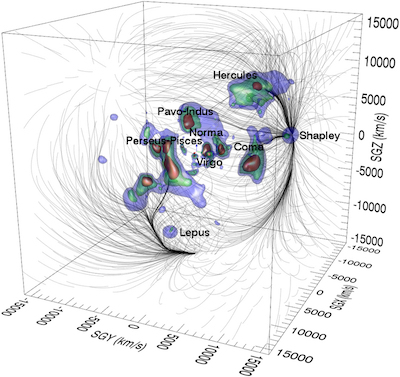
References:
Becker, R.H., et al., 2001, AJ, 122, 2850;
Carrick, J., et al., 2015, MNRAS, 450, 317;
Courtois, H. et al., 2011, MNRAS, 415, 1935;
Courtois, H. et al., 2013, AJ, 146, 69;
Courtois, H. & Tully, R. B., 2014, MNRAS, 447, 1531;
Desmond, H., et al., 2017, arXiV:02420;
Doré, O. et al., 2003, ApJL, 2, 81;
Erdogdu, P., et al., 2006, MNRAS, 373, 45;
Freudling, W., et al., 2011, ApJ, 727, 40;
Kazin, E. A. , et al.2014, MNRAS, 441, 3524;
Koda, J., et al., 2014, MNRAS, 445, 4267;
Kuehn, K., et al., 2014, SPIE, 9147, 10;
Lavaux, G., et al., 2010, ApJ, 709, 483;
Lavaux, G. & Jasche J., 2016, MNRAS, 455, 3169;
Libeskind, N., et al., 2015, MNRAS, 453, 108;
Neill, J.D., et al., 2014, AJ, 792, 129;
Nusser, A., 2017, arXiv:1703.05324;
Racanelli, A., et al., 2015, arXiV:1501.03821;
Reyes, R., et al., 2010, Nature, 464, 256;
Santos, M., et al., 2014, AASKA14; arXiV:1501.03989
Sorce, J., et al., 2014, MNRAS, 444, 527;
Tully, R.B., et al., 2016, AJ, 152, 50
2.1.7 Large Scale Structure and BAO with Intensity Mapping
The statistical properties of the matter distribution in the Universe encodes invaluable information about the cosmological parameters, such as the mean cosmic matter and energy densities, the physics underpinning the Standard Cosmological Model, especially General Relativity, Modified Gravity, and Dark Energy. Most of this information can be extracted from the large-scale statistical properties of the matter distribution on comoving length scales of 10 Mpc and above, corresponding to apparent angular scales larger than a few arcminutes. The cosmological matter distribution, dominated by dark matter, can be probed through tracers such as galaxies, which are often detected and observed through their optical emission, their position being determined by imaging and their redshifts by spectroscopy.
Since the first astronomical observation of 21 cm emission by Ewen and Purcell (1951) following the suggestion by van de Hulst (1945), galaxies are known to harbour neutral hydrogen (H i) that is destined eventually to form stars. Galaxies can thus be detected and observed in radio through the 21 cm line emission of this neutral atomic hydrogen. Moreover, the redshifted 21 cm feature pinpoints directly the galaxy positions in redshift space. In contrast, optical surveys cannot obtain accurate redshifts easily. Optical surveys rely on photometric redshifts which are not very accurate and are prone to error due to misidentification of the object type for distant objects. Alternatively, more accurate redshifts can be obtained through costly spectroscopic follow-up on a subset of the catalogue.
The SKA H i line survey provides a method similar to optical surveys to map matter distribution through compact H i cloud detection in radio, through the 21 cm hydrogen hyperfine transition. This method has the advantage of determining the source redshift by a direct comparison of the observed radio frequency with the intrinsic emission frequency of 1420 MHz (Abdalla & Rawlings et al. 2005). The expected number of such accurate redshift measurements in the SKA survey exceeds that from planned optical and infrared surveys by at least an order of magnitude (Rawlings et al. 2004). Yet these two approaches are complementary. Having both will help to clarify a number of astrophysical questions, such as the relationship between the luminous stellar populations and the gas from which they form, and the star formation history.
A large galaxy survey such as expected from the SKA H i line survey will provide precision measurements of the statistical properties of Large Scale Structure (LSS) and the corresponding power spectrum . In particular, it is possible to extract the precise measurement of the angular diameter subtended by the 110 Mpc/h baryon acoustic oscillation (BAO) feature as a function of redshift. This feature, a remnant of the tight coupling between photons and baryons in the early Universe, is imprinted on the galaxy distribution during the epoch of decoupling of photons and baryons at It is one of the most robust cosmological probes used to constrain Dark Energy properties. On intermediate angular scales the survey will resolve the cosmic web (filaments, walls, and the voids they enclose), which is emerging as a rich target for defining cosmological observables.
By using the BAO signature alone to map the expansion history of the Universe during the acceleration epoch, one can establish the onset and shape of dark energy domination (Blake & Glazebrook 2003; Seo & Eisenstein 2003). Using the H i galaxy survey and BAO, SKA1 will be able to measure the expansion rate and the angular diameter distance with a relative precision of for redshifts up to . The relative precision on measurements will reach over the redshift range with the second phase of SKA (Yahya et al. 2015). This is a conservative estimate since it uses only the information from this one scale. Analysing the entire correlation function and modelling the way galaxies trace the underlying matter distribution would further reduce the expected error bar on the Dark Energy equation of state parameters.
However, the relatively low radio brightness of these H i clumps has limited their detection to the cosmological neighbourhood of our galaxy with current instruments. SKA will significantly extend the detection redshift range thanks to its enormous collecting area combined with its large field of view. Despite the huge increase in sensitivity brought by SKA, the detection of H i galaxies at higher redshifts (i.e., and beyond) will remain a challenge, and only the brightest H i galaxies would be detected by SKA at .
A technique to further enhance the cosmological signal is to image directly the 3D structure of the cosmic H i distribution by mapping the integrated 21 cm brightness. An early suggestion of this method (Hogan & Rees 1979) and the idea to use 21 cm line observations for the determination of cosmological parameters (Scott & Rees 1990) was later proposed as a radio astronomy technique called Intensity Mapping (Battye et al. 2004; Peterson et al. 2006) and further developed for radio interferometers (Ansari et al. 2008; Ansari et al. 2012). The Intensity Mapping technique eliminates the intermediate step of constructing a galaxy catalog since all photons are used without selecting only those that come from objects detected with high significance. By eliminating the necessity to reach detection thresholds for individual galaxies, the Intensity Mapping approach will allow using early stages of SKA to measure cosmological parameters before completion of the “full instrument” (SKA Phase 2). A number of instruments are currently in development (see Bull et al. 2015 for a comparison), and in particular the TIANLAI project (Chen 2012), as well as HIRAX (Newburgh et al. 2016), has significant input from France. The proposed project called MANTIS (Cappellen et al. 2016) would be an early version of the SKA Mid Frequency Aperture Array, and ideally suited for Intensity Mapping. Using the Intensity Mapping technique, SKA1 should be able to measure the Dark Energy equation of state parameters and with precision, close to the expected precision from Euclid (Santos et al. 2015).
Intensity mapping provides the most economical way to map huge cosmic volumes in three dimensions. The total H i emission from 3D cosmic volume cells of , arising from the combined emission of hundreds of galaxies and H i clouds, would be large enough to be detected by an instrument with a collecting area of a few 10 000 m2 within a few hours integration time. Intensity Mapping up to redshifts will thus require an instrument with a wide field of view on the order of tens of square degrees, a collecting area of and high sensitivity, but with a modest angular resolution ( arcmin).
SKA aperture arrays will be well suited to perform Intensity Mapping
surveys, covering a wide redshift range, up to . The SKA Intensity
Mapping surveys will be used for competitive cosmological
studies, including, but not limited to, precise determination of the
BAO scale.
References:
Abdalla, F. & Rawlings, S., 2005, MNRAS, 360, 27;
Ansari, R., et al., 2008, arXiv:0807.3614;
Ansari, R., et al., 2012, A&A, 540 , 129;
Battye, R., et al., 2004, MNRAS, 355, 1339;
Blake, C. & Glazebrook, K., 2003, ApJ, 594, 665;
Bull, P., et al., 2015, ApJ, 803, 21;
van Cappellen, W., et al., 2016, arXiv:1612.07917;
Chen, X., 2012, Int. J. Modern Physics Conference Series, 12, 256;
Ewen, H. I. & Purcell, E.M., 1951, Nature, 168, 356;
Hogan, C. J. & Rees, M. J., 1979, MNRAS, 188, 791;
Newburgh, L. B., et al., 2016, Proc.SPIE Int.Soc.Opt.Eng. 9906, 99065X;
Peterson, J. B., et al., 2006, arXiv:0606104;
Santos, M., et al., 2015, AASKA14, 19;
Scott, D. & Rees, M. J., 1990, MNRAS, 247, 510;
Seo, H.-J. & Eisenstein, D. J., 2003, ApJ, 598, 720;
van de Hulst, H. C., 1945, Nederl. Tij. Naturkuunde, 11, 201;
Yahya, S. et al., 2015, MNRAS, 450, 2251
2.1.8 Distant Universe with Gravitational Lensing in the SKA Era
Gravitational lensing is an unique and efficient technique to observe faint distant galaxies and measure the mass distribution (including dark matter) locally as well as up to cluster-scale and beyond, thus providing a major insight into galaxy formation and evolution over cosmic timescale. Strong-gravitational lens systems, in which the gravitational field of a foreground galaxy and/or cluster of galaxies multiply images of a background distant galaxy, gives rise to a rare Einstein’s ring or giant arc-like structures respectively, as seen e.g. in the HST, VLA and e-Merlin radio observations (Biggs et al. 2004; Estrada et al. 2007; Gladders et al. 2002; Hewitt, J. et al. 1988; Hennawi et al. 2008; Scarpine et al. 2006). However, strong lensing events are rare and found around clusters, where each square-degree of sky contains only about one cluster of sufficient mass to produce a giant arc. Nevertheless, lensing clusters are preferred to study high redshift galaxies, as their weak amplification factor helps to reconstruct the remote galaxy profile with ease. The first big surveys for the identification of lens systems and lensed galaxies were carried out on galaxy-galaxy strong lensing systems (e.g. quasars) by the ESO Hamburg survey (Wisotzki et al. 1996) and CfA-Arizona-ST-LEns-Survey (CASTLES by Munoz et al. 1998; Richard et al. 2016) at optical wavelengths. In the radio domain a similar search was carried out by the Jodrell Bank-VLA Astrometric survey (Browne et al. 1998; Patnaik et al. 1992) and Cosmic Lens All Sky Survey (CLASS; Jackson et al.1995; Myers et al. 1995). Additionally, with the advent of deep and wide imaging at radio wavelengths (with the GMRT and JVLA) combined with large spectroscopic HST and MUSE survey, many more new lensed galaxies around lensing clusters have been recently discovered (see e.g. Fig. 14, Pandey-Pommier et al. 2017; van Weeren et al. 2016; Lagattuta et al. 2016). In spite of these successful attempts, the number of gravitational lenses (galaxies and clusters) known is still very small, with only a few hundreds discovered as of now (McKean et al. 2015).
Thanks to its high sensitivity, SKA will transform our understanding of the Universe with gravitational lensing, particularly at radio wavelengths where the number of gravitational lenses will increase to 105 helping to probe the distant lensed galaxy population in the Universe (McKean et al. 2015). A similar increase is expected from the future Optical/IR surveys, notably EUCLID and LSST. In this chapter we highlight the technical capability and main scientific results that will be achieved via gravitational lensing technique in the SKA era.

Compared to current instruments (such as the JVLA or eMERLIN), SKA1-MID will be the first radio telescopes with the required survey speed and sub-arcsec angular resolution for large-scale lensing searches. McKean et al. (2015) derived radio gravitational lensing estimates based on semi-analytical models for the number density of lenses, CLASS survey lensing statistics (Myers et al. 2003) and the SKADS (SKA Design Study) database for the population of background radio sources (Wilman et al. 2008). They found that a shallow wide field SKA-MID final survey with an rms noise level of Jy/beam and arcsec-scale resolution for gravitational lenses will be most efficient to increase the number of lens systems as well as lensed galaxies (AGN and starbursts) up to redshift z=1-5 (see e.g. Fig. 15). In addition, thanks to the magnification provided by lensing (factors 5-100), a deeper and smaller area survey with SKA1-MID would further detect a fainter population of sub-Jy level exotic high redshift objects, thus providing an opportunity to study their detailed radio properties - an unexplored region so far (Prandoni and Seymour 2015). These objects are expected to be detected routinely with SKA2, which will go up to a factor 5-10 deeper than SKA1-MID (McKean et al. 2015).
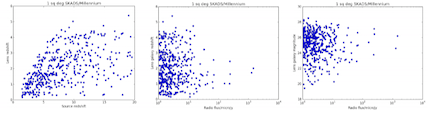
The SKA, in combination with the optical/infrared missions such as Euclid, 4MOST and LSST, will discover a whole new class of rare gravitational lenses allowing us to explore the lensed distant galaxies in the Universe. The main cosmological results expected for galaxy formation and evolution as well as lenses themselves with SKA lensing studies are:
-
•
The statistical survey data will place a firm constraint on mass distribution models of lenses in the Universe and confirm if the low-mass, early-type galaxies are dark-matter dominated. It will be also possible to confirm if all lensing galaxies have quasar-type properties
-
•
An increase in the number count of lensed galaxies by factors of 103 will provide a new population of rare and cosmologically important objects at the low mass end (Impellizzeri et al. 2008). Lensed galaxies with star-formation rates (SFR) of 1 M⊙ yr-1 at z = 3-4 and 5 M⊙ yr-1 at z = 6 (near epoch of reionisation) will be detected and used to probe the evolution of SFR w.r.t. redshift. Further, spectral properties of high redshift AGNs (discovered due to lensing) derived via broad band continuum observations will be used to study the SFR and radio-FIR luminosity correlation.
-
•
Deep H i imaging with the SKA will map the neutral hydrogen gas content in the lensed galaxies that are usually early/or late-type gas-rich galaxies. Moreover, the wide-field SKA H i spectral line survey on galaxies with H i masses of 12 M⊙, will be able to find new gravitational lens systems (approx. 0.5-5 gravitational lenses per square-degree) whose redshift will be confirmed via upcoming optical/IR survey with EUCLID, LSST (Serjeant et al. 2014; Negrello et al. 2010; Abdalla et al. 2010).
References:
Abdalla, F. B., et al. 2010 MNRAS, 401, 743;
Browne, I.,W.,A., 1998, ASSL, 226, 323B;
Biggs, A.,D., et al. 2004, MNRAS, 350, 949B;
Estrada, J., et al. 2007, ApJ, 660, 1176E;
Gladders, M., et al. 2002, AAS, 201, 5906G;
Hennawi, J. F., et al. 2008, AJ, 135, 664H;
Impellizzeri, C., et al. 2008, Nature, 456, 927;
Jackson, N., et al. 1995, MNRAS, 274L, 25J;
King, L., et al. 1997, MNRAS, 298, 450;
Lagattuta, D., et al. 2016, arXiv161101513L;
Mckean, J., et al. 2015, AASKA14, 84;
Munoz, J., et al., 1998, ApJ, 492L, 9M;
Myers, S., et al. 1995, ApJ, 447L, 5M;
Myers et al., 2003, MNRAS, 341, 1M;
Negrello et al., 2010, Sci, 330, 800N;
Pandey-Pommier, M., et al., 2017, AA, submitted;
Patnaik, A., et al., 1992, MNRAS, 259P, 1P;
Richard, J., et al., 2016, IAUFM, 29B.764R;
Scarpine, V., et al., 2006, AAS, 20921507S;
Serjeant, S., et al., 2014, ApJL, 793,10S;
van Weeren, R., et al., 2016, ApJ, 817,98V;
Wisotzki, L., et al., 1996, AA,315L,405W;
Wilman, R. et al., 2008, MNRAS, 388, 1335W
2.2 Extra-galactic astronomy
Contributors of this section in alphabetic order:
R. Adam [Université Côte d’Azur, Observatoire de la Côte d’Azur, CNRS, Laboratoire Lagrange, Nice, France], N. Aghanim [Institut d’Astrophysique Spatiale, CNRS, UMR 8617, Université Paris-Sud, Université Paris-Saclay, Orsay, France], B. Ascaso [Astroparticule et Cosmologie APC, Université Paris Diderot, CNRS/IN2P3, CEA/IRFU, Observatoire de Paris, Sorbonne Paris Cité, Paris, France], E. Athanassoula [Aix Marseille Univ, CNRS, LAM, Laboratoire d’Astrophysique de Marseille, Marseille, France], M. Béthermin [Aix Marseille Univ, CNRS, LAM, Laboratoire d’Astrophysique de Marseille, Marseille, France], S. Boissier [Aix Marseille Univ, CNRS, LAM, Laboratoire d’Astrophysique de Marseille, Marseille, France], A. Boselli [Aix Marseille Univ, CNRS, LAM, Laboratoire d’Astrophysique de Marseille, Marseille, France], A. Bosma [Aix Marseille Univ, CNRS, LAM, Laboratoire d’Astrophysique de Marseille, Marseille, France], V. Buat [Aix Marseille Univ, CNRS, LAM, Laboratoire d’Astrophysique de Marseille, Marseille, France], L. Ciesla [IRFU, CEA, Université Paris-Saclay, Gif-sur-Yvette, France;Université Paris-Diderot, AIM, Sorbonne Paris Cité, CEA, CNRS, Gif-sur-Yvette, France] F. Combes [LERMA, Observatoire de Paris, Collège de France, École normale supérieure, PSL Research University, CNRS, Sorbonne Universités, UPMC Univ. Paris 06, Paris, France], B. Comis [Laboratoire de Physique Subatomique et de Cosmologie, Université Grenoble Alpes, CNRS, Grenoble, France], E. Daddi [IRFU, CEA, Université Paris-Saclay, Gif-sur-Yvette, France;Université Paris-Diderot, AIM, Sorbonne Paris Cité, CEA, CNRS, Gif-sur-Yvette, France], M. Douspis [Institut d’Astrophysique Spatiale, CNRS, UMR 8617, Université Paris-Sud, Université Paris-Saclay, Orsay, France], W. van Driel [GEPI, Observatoire de Paris, PSL Research University, CNRS, Meudon, France], C. Ferrari [Université Côte d’Azur, Observatoire de la Côte d’Azur, CNRS, Laboratoire Lagrange, Nice, France], A. Hughes [IRAP, Université de Toulouse, CNRS, UPS, CNES, Toulouse, France], O. Ilbert [Aix Marseille Univ, CNRS, LAM, Laboratoire d’Astrophysique de Marseille, Marseille, France], G. Lagache [Aix Marseille Univ, CNRS, LAM, Laboratoire d’Astrophysique de Marseille, Marseille, France], M. Langer [Institut d’Astrophysique Spatiale, CNRS, UMR 8617, Université Paris-Sud, Université Paris-Saclay, Orsay, France], M. Lehnert [Sorbonne Universités, UPMC Univ Paris 6 et CNRS, UMR 7095, Institut d Astrophysique de Paris, Paris, France], J. Macías-Pérez [Laboratoire de Physique Subatomique et de Cosmologie, Université Grenoble Alpes, CNRS, Grenoble, France], N. Nesvadba [Institut d’Astrophysique Spatiale, CNRS, UMR 8617, Université Paris-Sud, Université Paris-Saclay, Orsay, France], M. Pandey-Pommier [Université Lyon, Université Lyon1, Ens de Lyon, CNRS, Centre de Recherche Astrophysique de Lyon UMR5574, France], G. W. Pratt [IRFU, CEA, Université Paris-Saclay, Gif-sur-Yvette, France;Université Paris-Diderot, AIM, Sorbonne Paris Cité, CEA, CNRS, Gif-sur-Yvette, France], F. Rinçon [IRAP, Université de Toulouse, CNRS, UPS, CNES, Toulouse, France], C. Tasse [GEPI, Observatoire de Paris, PSL Research University, CNRS, Meudon, France]
2.2.1 Clusters
2.2.1.1 Non-thermal emission from galaxy clusters
Galaxy clusters are the most massive objects in the Universe that have had the time to collapse under the influence of their own gravity; their number density as a function of mass and redshift is used to constrain cosmological parameters (Voit 2005). Located at the nodes of the cosmic web, galaxy clusters are not isolated systems: mass is accreted from the surrounding filamentary structure either at a smooth rate or through mergers with galaxy groups and (sub-)clusters. After a few seminal works, mostly in the 90s (Feretti 1999), in the last decade we have discovered an increasing number (from less than twenty to several dozens) of massive merging clusters that “light up” at radio wavelengths due to the presence of a non-thermal (NT) intracluster component, i.e. weak magnetic fields ( G) and cosmic ray electrons (CRes) in the ICM, giving rise to Mpc-scale synchrotron radiation detected at Jy/arcsec2 level around 1.4 GHz. Even if all clusters present some level of radio emission associated to active galaxies, in the following we will refer to “radio-loud” clusters as those systems hosting this kind of diffuse radio sources, which are usually classified as “halos”, “relics” or “mini-halos” (see Fig. 16), depending on their position, size, morphology and polarisation properties (e.g. Ferrari et al. 2008).
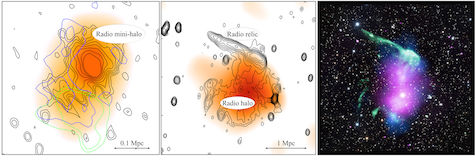
In recent years, increasing attention has been paid to study the link between the NT component of the ICM and the dynamical state and evolution of galaxy clusters. Up to now, most of the detected radio-loud clusters show signatures of recent mergers, with a radio power (Pradio) that correlates to the mass (MCl) of the cluster (e.g. Martinez-Aviles et al. 2016). These results agree with theoretical models predicting that ICM shocks and turbulence that develop during cluster mergers are responsible for electron acceleration and magnetic field compression (e.g. Dolag et al. 2008): the higher is the mass of colliding clusters, the more gravitational energy is released within the thermal and NT components of the ICM. Other theoretical models for the origin of the NT intracluster component have been proposed (e.g Pfrommer et al. 2008), which are in less good agreement with the observed properties of clusters, in particular due to the lack of gamma-ray emission from the ICM that is predicted by those models. However, with a few dozens of radio-loud clusters at low redshift discovered so far (Feretti et al. 2012), we are most likely observing just the “tip of the iceberg” of diffuse cluster radio emission. Deeper observations of richer cluster samples, in particular with SKA pathfinders (such as LOFAR, see Fig. 16), are starting to show the NT emission in exquisite details, often opening new questions on points that seemed well established (e.g. Bonafede et al. 2015a; Sommer et al. 2017).
SKA1 will allow us to study diffuse radio emission in statistical cluster samples and in a totally new range of masses and redshifts: the discovery of thousands of radio-loud clusters (up to z1 and down to M , including 1000 ultra-steep diffuse radio sources, Ogrean et al. 2015) is predicted by current estimates (Cassano et al. 2015; Ferrari et al. 2015). Thanks to its sensitivity, polarisation purity and resolution, SKA will also permit a step forward in magnetic field measurements. Hundreds of sources in the background of massive clusters are expected to be detected by SKA1, hence entering a new era for the study of the magnetic field through Faraday Rotation Measure studies (Bonafede et al. 2015b). Predictions indicate that SKA1 will be able to recover tiny differences in the magnetic field properties of the ICM, which are far beyond the capabilities of the present instruments.
SKA1 surveys will thus allow us to detect clusters through their synchrotron radiation, which will be complementary to more classical cluster detection methods (SZ signal, X-ray emission, galaxy over-densities). Interestingly, simulations predict that accretion and merging shocks taking place around galaxy clusters and within cosmic filaments could accelerate particles and compress magnetic fields. As already mentioned in Sect. 2.1.4, low-frequency observations with SKA1-LOW could thus be key also for the detection of intracluster filaments through their synchrotron radiation. This is one of the hottest astrophysical topics: most of the baryons in the Universe are expected to reside in the filaments that connect galaxy clusters, but the warm-hot intergalactic medium (WHIM) is currently largely unconstrained from the observational point of view. In the case of efficient amplification of magnetic fields within filaments, SKA1 should be able to detect a significant portion of emission from the cosmic web at low redshifts (z0.1). For a better imaging of their full extent or for their detection up to z=0.5, SKA1-LOW sensitivity should be improved by a factor 3. This can be achieved during the Phase 2. Remarkably enough, even the non detection of radio emission from filaments will offer a way of limiting the magnetisation properties of the cosmic web, thereby providing important clues on the efficiency of the turbulent amplification of early weak cosmological fields during structure formation (Vazza et al. 2015).
The Square Kilometre Array is expected to revolutionise our knowledge of the NT component of the ICM, similarly to what happened in the early 00’s with the study of its thermal component thanks to the NASA and ESA satellites Chandra and XMM.
References:
Adam, R., et al., 2014, A&A, 569, 66;
Bonafede, A., et al., 2015a, MNRAS, 454, 3391;
Bonafede, A., et al., 2015b, AASKA14, 95;
Cassano, R., et al., 2015, AASKA14, 73;
Dolag, K., et al., 2008, SSRv, 134, 311;
Feretti, L., 1999, dtrp.conf, 3;
Feretti, L., et al., 2012, A&ARv, 20, 54;
Ferrari, C., et al., 2008, SSRv, 134, 93;
Ferrari, C., et al., 2011, A&A, 534, 12;
Ferrari, C., et al., 2015, AASKA14, 75;
Mason, B. S., et al., 2010, ApJ, 716, 739;
Martinez-Aviles, G., et al., 2016, A&A, 595, 116;
Ogrean, G. A., et al., 2015, ApJ, 812, 153;
Pfrommer, C., 2008, MNRAS, 385, 1211;
Sommer, M. W., et al., 2017, MNRAS, 466, 996;
Vazza, F., et al., 2015, AASKA14, 97;
Voit, M., 2005, RvMP, 77, 20;
van Weeren, R. J., et al., 2016, ApJ, 818, 204
2.2.1.2 SKA SZ studies of galaxy clusters
With the last generation of CMB experiments, many studies have been done on Galaxy Clusters using the inverse Compton effect of CMB photons on the hot gas (Sunyaev Zeld’ovich effect, SZ). From blind detections on the whole sky to particular investigations of shocks in the intra-cluster medium (ICM), SZ offers many possibilities. This effect being furthermore insensitive to redshift, it theoretically allows us to probe high redshift warm-hot gas in structures. The sensitivity and resolution of SKA1-MID Band 5 brings a new window to probe the SZ effect, complementary to many other observations. Recent observations of SZ clusters have taken advantage of multi-wavelength observations and the peculiar shape of the spectral function of SZ at high frequencies: indeed, the spectral function goes from negative for frequency lower than 217 GHz, null at 217 GHz, to positive above 217 GHz, offering a unique signature. Note however that the first detections and images of SZ were made at 15 GHz (Birkinshaw 1984, Jones 1993).
Recent studies based on high resolution X-ray and SZ observations have shown the complexity of gas density and temperature in the ICM. High resolution studies of the ICM state by SKA1-MID will allow us to access the pressure distribution and thus the dynamical state of clusters. Pressure discontinuities will reveal shocks and/or cold fronts, signatures of cluster mergers, on a large range of redshifts allowing us to study the ICM and cluster evolution. These observations will bring to the next step the current work initiated with Planck (Planck collaboration 2013b) and done with NIKA and NIKA2 (Adam et al. 2014). In the 2030s, Athena will offer an X-ray complementarity to SKA observations, bringing the possibility of combined analyses of high resolution, high sensitivity observations of warm-hot gas not only in clusters but also in filaments and possibly more diffuse environments. While SKA and SZ will bring the thermal and pressure properties of clusters, X-ray spectroscopy from Athena will offer the dynamical state of the substructures, giving a full and powerful view of the different physical processes at play in clusters.
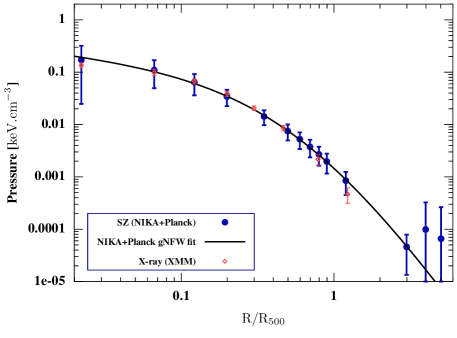
In addition to thermal and dynamical probes, non-thermal signatures have shown to be crucial to understand physical properties of the ICM. Combination of GMRT and MUSTANG (Ferrari et al. 2011) showed a strong correlation between the high pressure seen in SZ and the excess of radio surface brightness of the central radio source in RXJ1347-1145 (see also Fig. 16). This result brought a hint of the presence of cosmic rays contributing to the excess radio emission coming from shock fronts in the ICM. SKA1 will thus offer a complete view of the interaction between thermal and non thermal physical processes through the high sensitivity of detection of both the synchrotron and SZ emissions.
With its high sensitivity and high resolution, SKA1-MID will map the SZ effect from the centre to the more diffuse external regions, even for relatively high redshift clusters, allowing to reconstruct the pressure profile on a large range of scales. While combination of SZ and X-ray was needed until recently (Planck collaboration 2013b), current SZ observations are improving (see Fig. 17), but SKA1-MID will be a precious tool to explore the evolution of global properties of clusters over time. In the coming years, optical (Euclid - Sect. 3.1 - LSST) and X-ray (eRosita - Sect. 3.7) will detect high redshift clusters that SKA1-MID will be able to follow up, providing information on the SZ profile and flux. Combining observations from low and high redshifts of the complementary experiments will thus allow for cluster property evolution studies. In addition, as the SZ measurement is a good mass proxy, SKA1-MID will provide cluster mass estimates in the high redshift domain, where lensing reconstruction from Euclid and X-ray estimates from eRosita will be limited. These SKA1-MID estimated masses will complement the low redshift ones, allowing us to build a unique cosmological sample over a large range of redshifts and thus to provide stronger cosmological constraints.
SZ measurements with SKA1-MID will not be free from contaminations but the versatility of SKA will allow for cleaning. At small scales, the SKA1-MID (Band 5) SZ signal is contaminated by the radio emission of active galaxies in the field of view. By using the SKA1-MID long baseline, the position and flux of the point sources can be measured with high precision and the radio sources contamination removed. On larger scales, synchrotron emission of our own Galaxy can also be removed by observations at different lower frequencies.
The Square Kilometre Array is thus an efficient probe of the hot-warm gas in structures, provides unique information on high redshift clusters and complements many other wavelengths surveys in which the French community is involved.
References:
Adam, R., et al., 2014, A&A, 569, 66;
Birkinshaw, M., et al., 1984, Nature, 309, 34;
Ferrari, C., et al., 2011, A&A, 534, 12;
Jones, M. E. et al., 1993, Nature, 365, 320;
Planck collaboration, 2013, A&A, 550, id.A131, 24;
Planck collaboration, 2013, A&A, 554, id.A140, 19;
Rupin et al., 2017, A&A 597, A110
2.2.1.3 Environmental effects on galaxy evolution
The environment is a key parameter in galaxy evolution. Since the seminal work of Dressler (1980), it is now well established that rich environments such as clusters and compact groups are dominated by early-type galaxies, while late-type objects are the main galaxy population within the field. Multifrequency observations have also indicated that the gas content and the activity of star formation of late-type systems in rich environments are significantly reduced with respect to their field counterparts (e.g. Boselli & Gavazzi 2006).
Two main families of physical processes have been proposed to explain these differences: gravitational interactions between galaxies and the potential well of the cluster (Merritt 1983; Byrd & Valtonen 1990; Moore et al. 1998), and the dynamical interaction of galaxies moving at high velocity within a hot ( 107-108 K) and dense ( 10-3 atoms cm-3) intra-cluster medium (ICM) (Gunn & Gott 1972; Cowie & Songaila 1977; Larson et al. 1980). All these mechanisms are able to stop the infall of fresh gas, to partly or totally remove the cold gas component from the disc, and thus to reduce the activity of star formation of the perturbed galaxies.
If the importance of the environment in shaping galaxy evolution is now well established, it is still unclear which, among the proposed mechanisms is the dominant in different density regions, from loose groups to rich clusters, and at different epochs. Indeed, observations and simulations indicate that the densest regions observed in the local universe have been formed through the accretion of smaller structures, where the different mechanisms might have been already at place (pre-processing, Dressler 2004).
The radio spectral domain offers a unique opportunity in the study of the role of the environment on galaxy evolution. The presence of bent head tail radio galaxies in rich clusters (Rudnick & Owen 1976) have been the first strong observational evidence of ram pressure. Radio continuum observations have also revealed the presence of 50 kpc long tails associated to three late-type galaxies in the periphery of the cluster A1367 (Gavazzi et al. 1995), witnessing a ram pressure stripping process. It has been also shown that cluster late-type galaxies do not follow the far-IR radio correlation since have, on average, a stronger radio continuum emission than their field counterparts (Gavazzi et al. 1991; Gavazzi & Boselli 1999; Andersen & Owen 1995). This result has been interpreted as due to the compression of the magnetic field in cluster galaxies interacting with the surrounding environment.
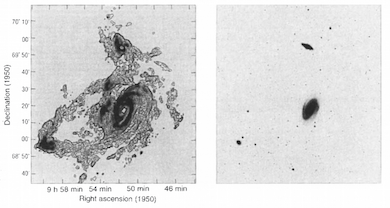
The most spectacular results on the perturbations induced by the environment on galaxy evolution, however, come from 21 cm H i observations. The atomic gas, which is generally distributed on discs more extended by a factor of 2 than the stellar disc, and is thus loosely bounded to the gravitational potential well of galaxies, is easily perturbed during any kind of interaction (Fig. 18). There are indeed several examples of galaxies in nearby clusters and groups with H i tidal or cometary tails, indicating an ongoing stripping process (Yun et al. 1994; Chung et al. 2007; Scott et al. 2012) (cf. Fig. 19). It has been also shown that galaxies in groups (Catinella et al. 2013) and clusters (Cayatte et al. 1990; Solanes et al. 2001; Chung et al. 2009; Gavazzi et al. 2013) have, on average, less H i gas than similar objects in the field. There is also evidence of molecular gas depletion (Casoli et al. 1998; Vollmer et al. 2005, 2008; Fumagalli et al. 2009; Scott et al. 2013; Boselli et al. 2014; Jachym et al. 2014). The lack of gas, principal feeder of star formation, has strong implication in the quenching process and thus on the evolution of the perturbed galaxies (Boselli et al. 2006, 2016a).
At intermediate redshifts (z0.5) CO detections suggest that diffuse molecular gas may be stripped before the SFR is affected (Jablonka et al. 2013). The star formation-density relation is perhaps reversed at some redshift close to 1 (Elbaz et al. 2007) and such a reversal should be observed in the gas content of individual and in the ensemble of galaxies in proto-clusters in the early universe. Mapping of the H i line in clusters and proto-clusters will be possible with SKA1 up to z1 at low resolution, and up to z=2 at higher resolution with SKA2.
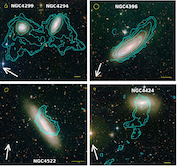
The SKA will be a unique opportunity for understanding the role of different environments on galaxy evolution. Thanks to its sensitivity, angular resolution, and area coverage (4 Jy/beam at 0.5-2 arcsec resolution over 30.000 deg.2 for the proposed all sky continuum survey - Prandoni & Seymour 2015, 1020 cm-2 at 15 arcsec resolution over 20.000 deg2 for the H i all sky survey - Staveley-Smith & Oosterloo 2015) we will be able to map the the radio continuum and H i distribution within galaxies for large samples of local and high- objects, selected according to similar criteria, and belonging to different environments. The different programmed extragalactic wide field surveys will provide large samples of galaxies spanning a wide range in stellar mass and morphological type (from giant to dwarfs) and galaxy density (from voids, to the general field, loose and compact groups, and rich clusters), and will thus be ideally suited for this purpose. The exquisite sensitivity of SKA, able to rich H i column densities of 10-18 cm-2 for pointed observations, will allow the detection of the stripped gas in perturbed galaxies down to still unreached levels. Combined with observations of other gas phases (hot gas from X-rays - Sun et al. 2007, ionised gas from H - Boselli et al. 2016b, molecular gas from CO - Jachym et al. 2017) and with tuned simulations (e.g. Roediger & Hensler 2005, Tonnesen & Bryan 2012) we will be able to study for the first time in a coherent and consistent way the fate of the stripped material in an hostile environment.
The study of the role of environment on galaxy evolution is already a key aspect in several precursor projects under way with APERTIF, MeerKAT, and ASKAP, in which the French community is deeply involved.
The Fornax cluster survey (PI P. Serra, MeerKAT) is indeed dedicated to the study of a nearby cluster of galaxies at unprecedented sensitivity, while EMU in radio continuum (R. Norris) and Wallaby in H i (PI B. Koribalski and L. Staveley-Smith; both with ASKAP) will provide a sample
of 500.000 nearby galaxies, including those in rich environments such as the nearby Virgo cluster. Wallaby and EMU will also provide ideal reference samples of isolated galaxies, necessary for every comparison.
These samples are crucial for determining the typical scaling relations of unperturbed objects, to which those derived for galaxies
in different density regions will be confronted.
References:
Andersen, V., & Owen, F. N., 1995, AJ, 109, 1582;
Boissier, S., et al., 2012, A&A 545, A142;
Boselli, A., & Gavazzi, G., 2006, PASP, 118, 517;
Boselli, A., et al., 2006, ApJ, 651, 811;
Boselli et al. 2014, A&A, 564, 67;
Boselli, A., et al., 2016a, A&A, 596, A11;
Boselli, A., et al., 2016b, A&A, 587, A68;
Byrd, G., & Valtonen, M., 1990, ApJ, 350, 89;
Casoli F., et al., 1998, A&A 331, 451;
Catinella, B., et al., 2013, MNRAS, 436, 34;
Cayatte, V., et al., 1990, AJ, 100, 604;
Chung, A., et al., 2007, ApJL, 659, L115;
Chung, A., et al., 2009, AJ 138, 1741;
Cowie, L., & Songaila, A., 1977, Nature, 266, 501;
Dressler A., 1980, ApJ, 236, 351;
Dressler, A., 2004, in Clusters of Galaxies: Probes of Cosmological Structure and Galaxy Evolution, 206;
Elbaz, D., et al., 2007, A&A 468, 33;
Fumagalli et al. 2009, ApJ, 697, 1811;
Gavazzi, G., & Boselli, A., 1999, A&A, 343, 93;
Gavazzi, G., et al., 1991, AJ, 101, 1207;
Gavazzi, G., et al., 1995, A&A, 304, 325;
Gavazzi, G., et al., 2013, A&A, 553, A89;
Gunn, J. E., & Gott, J. R., III 1972, ApJ, 176, 1;
Jablonka, P., et al., 2013, A&A 557, A103;
Jáchym, P., et al., 2014, ApJ 792, 11;
Jáchym, P., et al., 2017, arXiv:1704.00824;
Larson, R., et al., 1980, ApJ, 237, 692;
Merritt, D., 1983, ApJ, 264, 24;
Moore, B., et al., 1998, ApJ, 495, 139;
Prandoni, I., & Seymour, N., 2015, AASKA14, 67;
Roediger, E. & Hensler, G: 2005, A&A, 433, 875;
Rudnick, L., & Owen, F. N., 1976, ApJL, 203, L107;
Scott, T. C., et al., 2012, MNRAS, 419, L19;
Scott, T. C., et al., 2013, MNRAS 429, 221;
Solanes, J. M., et al., 2001, ApJ, 548, 97;
Staveley-Smith, L., & Oosterloo, T., 2015, AASKA14, 167;
Sun, M., et al., 2007, ApJ, 671, 190;
Tonnesen, S., & Cen, R., 2012, MNRAS, 425, 2313;
Vollmer, B., et al., 2005, A&A 441, 473;
Vollmer, B., et al.: 2008, A&A 491, 455;
Yun, M. S., et al., 1994, Nature, 372, 530
2.2.2 Formation and evolution of galaxies
2.2.2.1 Unobscured star formation and cosmic star formation history
Several surveys of SKA1 are dedicated to the measure of the star formation rate (SFR) from radio continuum in order to trace the star formation history of the Universe (SKA1-MID). Radio continuum observations give access to the only SFR measurements unaffected by dust. The ultraviolet (UV) and optical recombination lines are directly linked to the emission from young stars but suffer from dust extinction. On the opposite side the infrared (IR) emission from dust misses the unobscured starlight, leading to an underestimate of the SFR which can be severe in the earliest phasesTable of galaxy formation, or in metal and dust poor environments. These issues have been identified for a long time and hybrid star formation tracers combining UV-optical and IR luminosities are used at the expense of complex selection functions (e.g. Kennicutt and Evans, 2012).
Deep radio continuum surveys with SKA1 will provide a very powerful alternative with the detection of synchrotron and free-free continuum emissions up to very high redshifts (Mancuso et al. 2015). The continuum surveys in Band 2 will be sensitive to the synchrotron emission whereas the deep surveys in Band 5 will sample a frequency range where the free-free emission from the gas ionised by young stars is expected to dominate the synchrotron component in strong starbursting objects and provide a very direct measure of the current SFR (Murphy et al. 2015, Fig. 20 below).
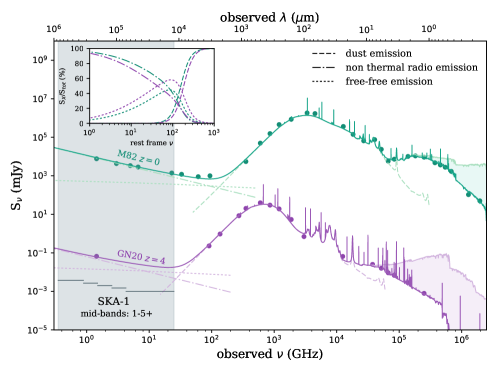
The targeted fields of these surveys will be selected in synergy with other imaging and spectroscopic surveys from optical to submm (Euclid, LSST, DES, Prandoni and Seymour 2015; see also Sect. 3): redshift determinations are required for any study of galaxy evolution. The analysis of the entire electromagnetic spectrum from UV to radio will yield to the measure of physical parameters like the stellar mass, the recent star formation history, the dust mass or the amount of obscuration. Continuum and line emissions from the ionised gas trace the very recent star formation, in the last few Myrs, when UV, synchrotron emission, and dust emissions are sampling larger timescales (100 Myrs, Kennicutt and Evans, 2012, their Table 2): the comparison of the different emissions will provide key information on the age of the starburst event. The shape of the radio continuum itself results of the combination of different emissions: the synchrotron, the free-free, and the cold dust emissions, each of them related to star formation activity. The link of each of these emissions to the SFR depends on the star formation history and ISM properties of the galaxies (Oti-Floranes et al. 2010; Boquien et al. 2014). By combining shallow and deep SKA1 surveys, the main sequence of star-forming galaxies (SFR-stellar mass correlation) and its dispersion can be studied up to high redshifts and/or low mass for individual targets with a very robust SFR estimate. The best way to derive such physical characteristics, and their evolution with redshift, is to fit the full spectral energy distributions (SEDs) with models including all the physical processes at work. In Fig. 20 the SED of two dust-obscured starburst galaxies, M82 at 0 and GN20 at 4, are plotted with the best fits obtained by combining stellar, dust, nebular, and synchrotron emission. AGN emission is also a possible contributor to the radio continuum and a careful modelling of this emission over the whole SED will open the field of the co-evolution between star formation and black hole growth. The addition of X-ray measurements from the future Athena observatory will dramatically improve further this research field (Sect. 3.7).
The MeerKAT deep survey MIGHTEE Tier 2 will cover 35 deg2 at 1.4 GHz down to a 5 limit of 5 Jy for unresolved sources similar to the wide survey of 1000 deg2 planned for SKA1, but with an 8 times higher spatial resolution: the SKA1 survey will dramatically improve the statistics and the quality of the cross-identification with sources at other wavelengths. The deepest SKA1 survey will detect SFR of the order of 100 at 7. A direct outcome from the unique characteristics of the SKA1 survey will be the ability to constrain the average SFR along cosmic time in a statistically robust way, tremendously improving the situation thanks to its efficiency in surveying the millimeter sky, compared to ALMA, for instance (e.g., Dunlop et al. 2017).
Since the seminal works by Lilly et al. (1996) and Madau (1996), intensive efforts have been carried on in establishing the SFR Density (SFRD) evolution with all possible SFR tracers (Madau & Dickinson 2014). Compilation of numerous works shows that the evolution of the SFRD with redshift exhibits a bell shape with a peak possibly located at 13. While the increase of the SFRD at 01 is well established, the position of the SFRD peak varies from 1 in FIR (Gruppioni et al. 2013) to 3 in radio (Novak et al. 2017). Despite an apparent agreement in the SFRD measurements at 38-9, the situation is even more uncertain given the difficulty to correct the UV light for dust attenuation (Burgarella et al. 2013), with UV being currently the only SFR tracers for the bulk of the galaxy population at 3.
The radio emission has been already used to derive the SFRD out to 5 with 6000 individual detected galaxies using VLA over 2 deg2 (Novak et al. 2017). Given the 35 deg2 which will be covered with the deep survey of MeerKAT with a rms twice better, we will be able to reduce significantly any uncertainties linked to cosmic variance and improve the constraint on the SFRD peak. Figs. 2 and 3 of Jarvis et al. (2014) demonstrate the capability of SKA1 to constrain the radio luminosity function well below the characteristic peak (reaching SFR10 M yr-1 for 3 with SKA1 deep) with an incredible sample of detected galaxies (up to 50 millions with SKA1 Wide) improving the situation by two orders of magnitude, both in term of depth and sample size. Therefore, SKA1 deep will produce an unique picture of the SFRD evolution, sampling efficiently the location of the SFRD peak, and establishing the mass assembly rate in the first half of the Universe life using dust-free tracers, which has never been done.
Given the high resolution of radio data, allowing for an easy comparison
with ancillary data, stacking analysis is a powerful tool in radio to push the
limits of studies to lower SFR and higher redshifts. For instance,
Karim et al. (2011) stacked VLA 1.4 GHz radio data proving it to
be extremely efficient to constrain the evolution of the SFRD at 4
with only 2deg2 observed with a sensitivity of 10 Jy.
SKA1 deep will allow a gain better than
two order of magnitude in luminosity over a similar area. Given the
richness of the multi-colour data which will be available (e.g. LSST,
Euclid), stacking will become a standard and essential tool. Combining stacking and
direct detections, we will get one of the most accurate view of the cosmic
star formation history.
References:
Boquien, M., et al.., 2014, A&A, 571, A72;
Burgarella, D., et al., 2013, A&A, 554, 70;
Dunlop, J., et al., 2017, MNRAS, 466, 861;
Gruppioni, C., et al., 2013, MNRAS, 432, 23;
Karim, A., et al., 2011, ApJ, 730, 61;
Kennicutt, R. C. & Evans, N.J., 2012, ARA&A, 50, 531;
Lilly, S.J., et al., 1996, ApJ, 460, 1;
Madau, P., et al., 1996, MNRAS, 283, 1388;
Madau, P. & Dickinson, M.E., 2014, ARA&A, 52, 415;
Mancuso , C., et al.., 2015, ApJ 810, 72;
Murphy, E.J., etal, 2015, AASKA14, 85;
Novak, M., et al., 2017, arXiv170309724;
Oti-Floranes, H. & Mas-Hesse, J.M., 2010, A&A, 511, A61;
Prandoni, I. & Seymour, N., 2015, AASKA14, 67
2.2.2.2 Large samples of H i galaxies
The total amount and internal distribution and dynamics of neutral gas in galaxies are essential features to understand galaxy evolution. The H i 21 cm line has been instrumental in discovering the physics of nearby galaxies, in particular the influence of environment (Chamaraux et al. 1980; Chung et al. 2009) and the importance of dark matter (Bosma 1981; Noordermeer et al. 2007; McGaugh 2012). However, the weakness of the H i line makes it very difficult to detect its emission at redshifts above z0.2, and our knowledge of neutral gas at high z is only based on its molecular phase, traced by CO emission, thanks to the rotational ladder of the molecule (e.g. Tacconi et al. 2013; Carilli & Walter 2013). Due to ill-determined conversion factors, the exact relative fraction of the two gas phases, H i and H2, is not known at z0.3 and indications from damped Ly absorption lines (Noterdaeme et al. 2012) are in contradiction with semi-analytical models (Lagos et al. 2012).
In recent decades, large 21 cm surveys have been performed to derive a statistical knowledge of H i in nearby galaxies (z 0.05) such as HIPASS (H i Parkes All Sky; cf. Barnes et al. 2001) and ALFALFA (Arecibo Legacy Fast ALFA; cf. Giovanelli et al. 2005). To extend our knowledge to higher redshifts, stacking techniques are used to estimate mean galaxy H i contents (e.g. Lah et al. 2007; Delhaize et al. 2013). In the near future, H i in tens of thousands of galaxies will be detected at higher redshifts, up to z=0.2-0.5, with SKA precursors such as the Australian Square Kilometre Array Pathfinder (ASKAP, Johnston et al. 2008) and MeerKAT (de Blok et al. 2009). With the first phase of the Square Kilometre Array, SKA1, it will be possible to detect galaxies up to z=1.7 (see Fig. 21 from the simulations by Staveley-Smith & Oosterloo, 2015), and to obtain reasonable maps for a large fraction of them, to investigate outflows, environmental deformation and dark matter distributions. Eventually, with the higher sensitivity of SKA2, it will be possible to determine the H i content of a myriad of galaxies up to z2, and to map Milky-Way type galaxies up to z1 (Blyth et al. 2015). This corresponds to a look-back time covering a large fraction of the age of the Universe, up to 3 Gyr after the Big Bang, when galaxies assemble their mass, and therefore will provide significant, new insights in galaxy formation and evolution.
H i mass functions: accretion and winds
If early galaxies are formed with a higher surface density, due to the high density of the Universe at the beginning of its expansion, one can expect a more efficient transformation of atomic into molecular gas in galaxy centres. However, outside the optical disk where stars form efficiently, there must exist huge reservoirs of atomic gas, linked to cosmic filaments, fuelling the mass assembly of galaxies. Cosmological simulations by tying the growth of dark matter structure to simple gas physics, show that much of the gas in galaxies is accreted cold in filamentary structures (Keres et al. 2005; Dekel et al. 2009). To understand and quantify these processes, it is important to establish the H i mass function of galaxies as function of redshift, and follow the fate of the gas, by comparison with the molecular evolution. The detailed balance, including emission and absorption, will show the importance of gas accretion and outflowing winds (e.g. Bouché et al. 2012).
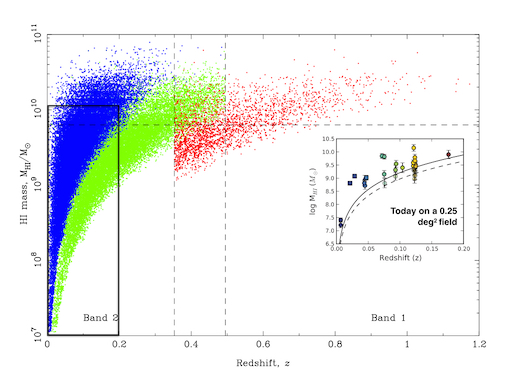
Rotation curves and dark matter content
In the nearby universe, it is well known that the dark matter (DM) fraction in galaxies decreases with stellar mass (e.g. Salucci & Burkert 2000). Galaxies like the Milky Way or more massive are not dominated by DM in their optical disk, contrary to dwarfs. Only H i gas is able to reveal their rotation curve outside the optical disk, for an accurate determination of their dark matter content. At high redshift, limited spatial resolution and sensitivity prevent the study of H i rotation curves for dwarfs, and H or CO velocity fields, confined to the optical radius, are unable to reveal the dark matter content of massive galaxies. Detailed studies of H i kinematics with the SKA will make a breakthrough here. What is the fraction of baryons in galaxies as a function of redshift? Is this fraction closer to the universal fraction of 17%, while supernovae and AGN feedback have been implicated in reducing it to less than 4% today? Obtaining rotation curves extending to the outskirts is time consuming at high z, but much will be learned from a well-selected sample of 100 galaxies. A deep integration of 100h with SKA1-MID, with 15kpc spatial resolution (2.4 arcsec at z=0.5 and 1.8 arcsec at z=1 and beyond), will be required to reach H i column densities of 4.1 and 7.5 1020 cm-2 respectively, at 5, in 20km/s channels. The study of a more significant sample could be done only at lower resolution and higher sensitivity with SKA1 and only then by exploiting the relation between luminosity and rotation speed (i.e., Tully-Fisher relation). Studying galaxies at even higher redshifts, up to z=2, will have to wait for the sensitivity provided by SKA2.
The growth of angular momentum in galaxies
The angular momentum of nearby disk galaxies is about that predicted for their dark matter halos (Steinmetz & Navarro 1999). How can a dissipative and non-dissipative matter have the same specific angular momentum, when one is found on much smaller scales than the other? Models of the cosmological accretion of gas driven by the growth of large scale structure have made significant progress in solving this issue (Danovich et al. 2015) but even then, these models do not follow the gas down to galaxy (kpc) scales. The angular momentum as a function of redshift, should vary as (Mo et al. 1998). This is something we can test rather uniquely with SKA observations of many galaxies in H i.
H i is observed in galaxies with a small range of column densities, from about 0.1 to 10 M⊙ pc-2, it extends well beyond the optical disk, and obeys a size-H i luminosity relation (e.g., Broeils & Rhee 1997). The cosmic H i density may not evolve significantly with redshift (Zafar et al. 2013) suggesting that at a minimum, the H i content of galaxies does (Lehnert et al. 2015). SKA, in a deep integration of a well-studied field with galaxy morphologies, stellar masses, and estimated scale lengths, will not only provide H i luminosities, but also rotation speeds and a constraint on the total angular momentum of a significant number of galaxies across a wide range of redshifts (up to z1 for SKA1 and z2 for SKA2).
Low Surface Brightness and dwarf galaxies
Low Surface Brightness galaxies (LSBs), with disk central surface brightness typically below 23 mag arcsec-2 in the optical, could represent a large fraction of galaxies. Their evolution and role in the big picture of the formation and evolution of galaxies is still under debate however. The class of “giant” LSBs is characterised by huge H i masses (above 1010 M⊙, e.g. Matthews et al. 2001) and large sizes (over hundreds of kpc).
Recent progress in optical detectors and telescopes have allowed us to
discover extended stellar disks around ”normal” galaxies pertaining to
this class (e.g. Hagen et al. 2016), and to re-observe the prototypical
giant LSB Malin 1 in the nearby universe (Boissier
et al. 2016). Disseau et al. (2017) found giant LSBs at redshifts of about 0.5.
Giant LSBs are usually gas-rich; H i measurements at different redshifts
will be necessary to understand their evolution. Malin 1 has an H i column density varying from 5 to 2 1010 atoms/cm2 from the centre to a radius
of 100 kpc (Lelli et al. 2010) and a H i mass of 1010.66 M⊙.
According to the simulations of Staveley-Smith & Oosterloo (2015), this
mass can be detected up to redshift 0.5 in wide/medium deep surveys, and
up to 1.2 in a deep survey with SKA1 (adopting a column density
threshold of 2 to 0.2 x 10²⁰ atoms/cm2, a resolution between 2 and 10
arcsec).
Malin 1 being extremely large, its radius at this column density threshold
corresponds to the resolution of the aforementioned wide/medium surveys proposed
at redshift about 0.5/1.35. SKA1 will allow us to quantify the presence of massive
H i disks and their evolution up to these intermediate redshifts. In the meantime, the
WALLABY survey on ASKAP will detect Malin 1-like galaxies up to 1 Gpc.
References:
Barnes, D. G., et al., 2001, MNRAS, 322, 486;
Blyth, S., et al., 2015, AASKA14, 128;
Boissier, S., et al., 2016, A&A 593, A126;
Bosma, A., 1981, AJ 86, 1825;
Bouché, N., et al., 2012, MNRAS 419, 2;
Broeils, A. H. & Rhee, M.-H, 1997, A&A 324, 877;
Carilli, C. L. & Walter, F., 2013, ARAA 51, 105;
Chamaraux, P., et al., 1980, A&A 83, 38;
Danovich, M., et al., 2015, MNRAS 449, 2087;
de Blok, E., et al., 2009, in Panoramic Radio Astronomy:
Wide-field 1-2 GHz Research on Galaxy Evolution;
Dekel, A., et al., 2009, Nature 457, 451
Delhaize, J., et al., 2013, MNRAS, 433, 1398;
Disseau, K., et al., 2017, MNRAS 466, 2337;
Fernàndez, X., et al., 2013, ApJ 770, L29;
Giovanelli, R., et al., 2005, AJ, 130, 2598;
Hagen, L. M. Z., et al., 2016, ApJ 826, 210;
Johnston, S., et al., 2008, Experimental Astronomy, 22, 151;
Keres, D., et al., 2005, MNRAS 363, 2;
Lagos, C. d. P., et al., 2012, MNRAS, 426, 2142;
Lah, P., et al., 2007, MNRAS, 376, 1357;
Lehnert M. D., et al., 2015 A&A 577, 112;
Lelli, F., et al., 2010, A&A 516, A11
Matthews, L. D., et al., 2001, A&A 365, 1;
McGaugh, S. S., 2012, AJ 143, 40;
Mo, H. J., et al., 1998, MNRAS 295, 319;
Noordermeer, E., et al., 2007, MNRAS 376, 1513;
Noterdaeme, P., et al., 2012, A&A, 547, L1;
Salucci, P. & Burkert, A.: 2000, ApJ 537, L9;
Staveley-Smith, L. & Oosterloo, T: 2015, AASKA14, 167;
Steinmetz, M., & Navarro, J., 1999, ApJ 513, 555;
Tacconi, L. J., et al., 2013, ApJ, 768, 74;
Zafar, T., et al.: 2013 A&A 556, A141
2.2.2.3 Molecular gas content at high redshift from the CO lines
Taking the census of gas reservoirs in galaxies across cosmic times is essential to understand the star formation in the Universe. In addition to the atomic gas (H i) observed via the 21 cm line, SKA will probe the molecular gas (H2) through the redshifted 12CO J=1-0 transition ( = 115 GHz), which is a standard tracer of molecular gas reservoirs. Characterising these cold gas reservoirs is particularly important to understand the evolution of galaxies, as they are the fuel for star formation.
It is now well established that high-redshift galaxies have much higher star formation rate at fixed stellar mass than low-redshift galaxies (e.g. Daddi et al. 2007; Elbaz et al. 2011; Schreiber et al. 2015), and that ultra luminous infrared galaxies (with SFR100 M⊙) have a strong contribution to the star formation density at z2 (e.g. Caputi et. al. 2007; Magnelli et al. 2013). The origin of their intense star formation could be due either to large gas reservoirs or to a temporary increase of the star formation efficiency induced by mergers (e.g. Daddi et al. 2010; Genzel et al. 2010).
At z3, massive follow-up observations of optically or near-IR selected objects in CO were performed with millimetre interferometers (e.g. Tacconi et al. 2013). These observations revealed a quick rise of the gas fraction with increasing redshift. At higher redshift, no large systematic CO searches were performed. However, observations of extreme starbursts (e.g. Riechers et al. 2013) or lensed galaxies (e.g. Aravena et al. 2016) showed that intensely star-forming galaxies at high redshift are a mix of extreme starbursts and gas-rich objects. Some pioneering deep line search observations were performed with PdBI and ALMA (e.g. Decarli et al. 2014; Walter et al. 2016) and detected 10 sources in CO mostly below z=3.
Most of these studies were not based on the fundamental (1-0) transition, which is the most reliable transition to derive a gas mass, but on higher J (2-1, 3-2…) transitions. The ratio between the fundamental and the higher-J transitions can vary significantly depending on the galaxy type (Carilli et al. 2013). Consequently, gas mass estimates based on these higher-J transitions are not fully reliable. SKA1 will be able to target directly the CO 1-0 transition above z=7.3. SKA2 with its coverage of higher frequencies will be able to probe this line at z3.8.
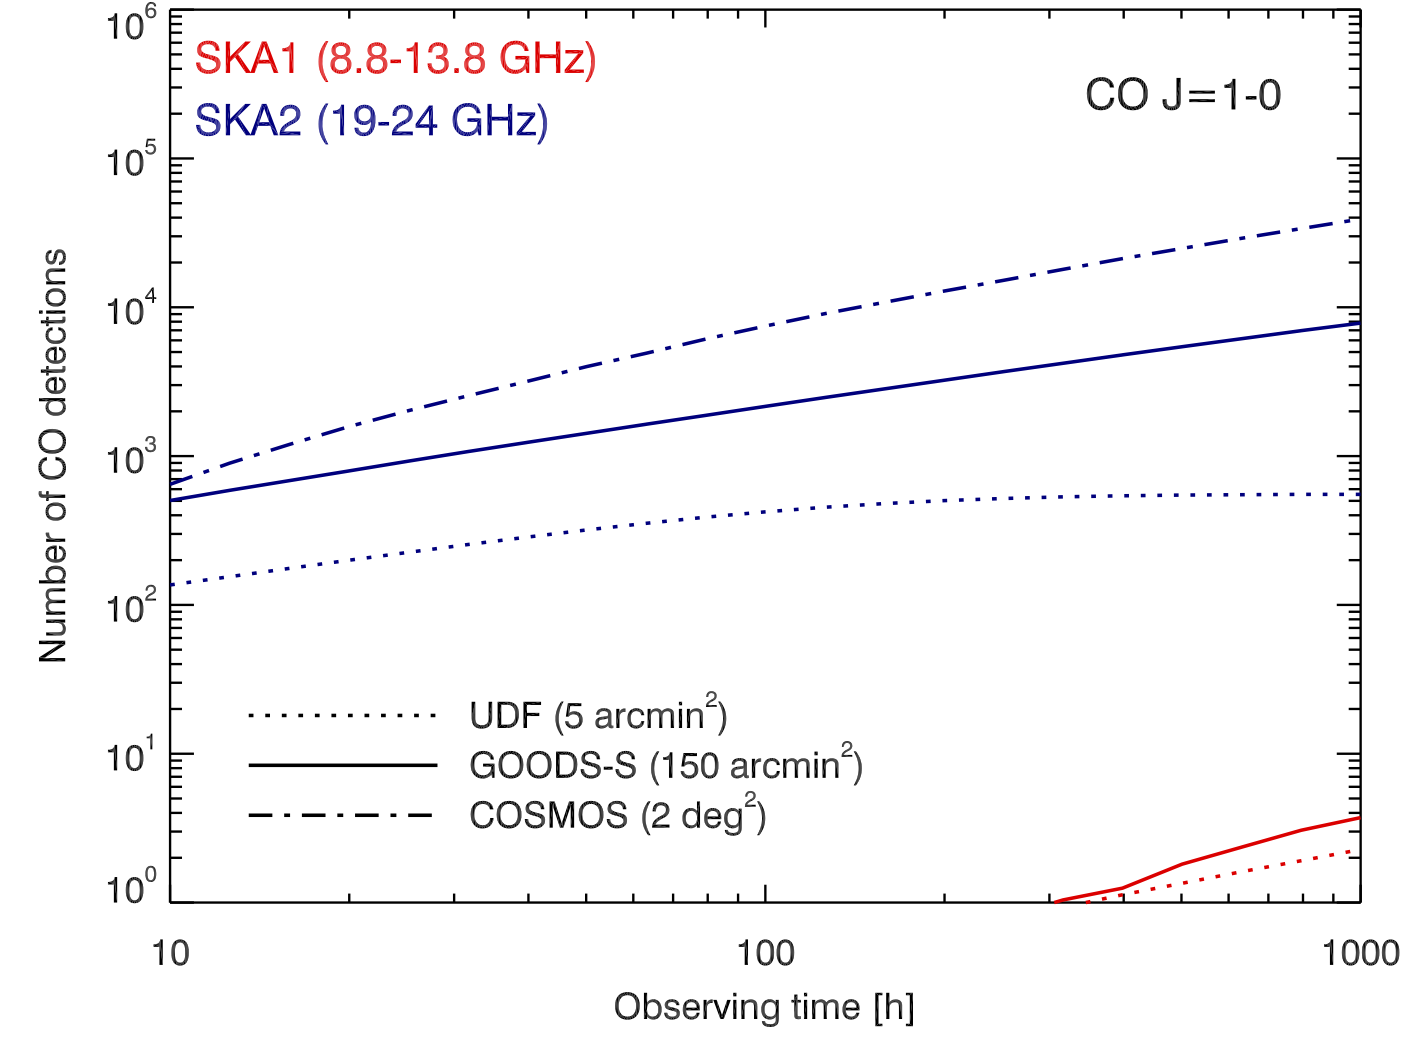 |
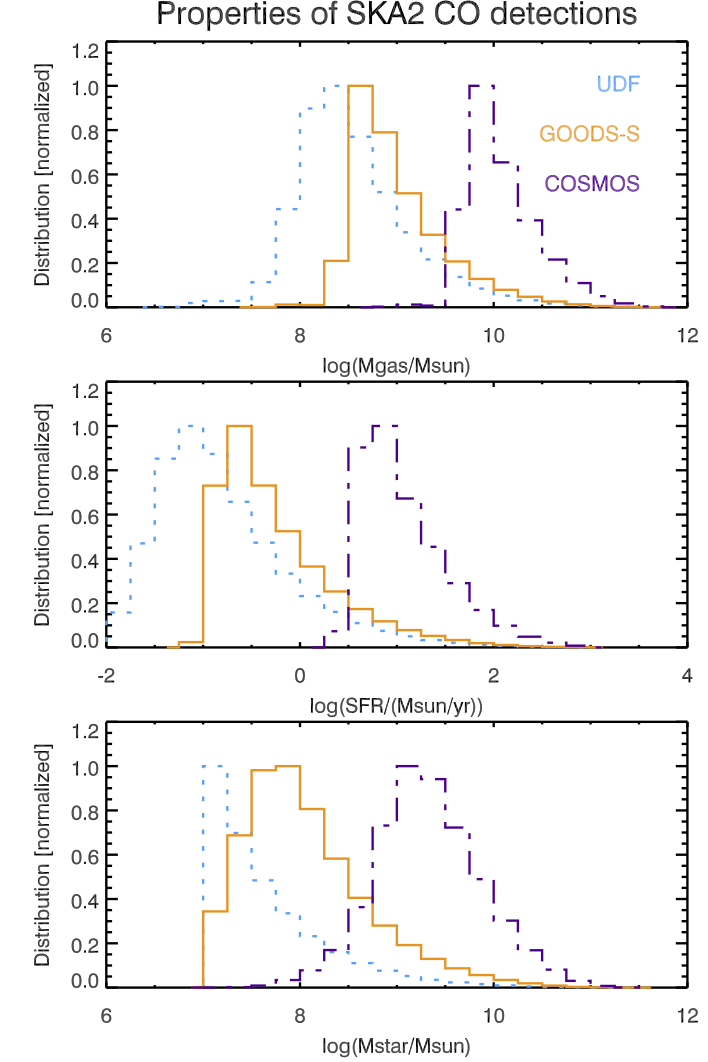 |
We present here some predictions of the number of CO detections expected with SKA for various survey strategies. They are based on the Simulated Infrared Dusty Simulated Sky (SIDES, Béthermin et al. 2017). The gas content and the CO line flux of the simulated galaxies are derived following Sargent et al.(2014). Line widths are derived using Harris et al. (2012) relation between L’CO and the FWHM. From these predictions and the SKA1 science requirements, we estimate the number of CO 1-0 detections at 5 for different observational strategies. These predictions do not take into account the effect of the CMB on the observed line flux, which can reduce the observed line flux by a factor of 2 (Da Cunha et al. 2013; Zhang et al. 2016).
SKA1 will be a powerful instrument for observing CO 1-0 in high-z galaxies identified by ALMA (probably with [OIII] and [CII], see e.g. Laporte et al. (2017) galaxy at z=8.3) or by JWST. For instance, the z=8.3 source (SFR = 20 M⊙/yr, FWHM = 50 km/s, magnified by a factor of 1.8) will be detectable in only 1 h. However, as shown in Fig. 22 (left, red curves), SKA1 will not be able to perform competitive deep spectral scans, since it can detect less than one source per 100 h. This is caused by the absence of high frequency coverage, which forces to target to be at z7.3, where the probed volume and the number density of gas-rich galaxies are both very small.
In contrast, with its coverage of higher frequencies and its sensitivity improved by more than one order of magnitude (from 190 to 2500 antennae), SKA2 will be a powerful CO 1-0 survey machine able to detect tens of thousands of galaxies in 1000 h (Fig. 22). The exact number of detections varies slightly with the strategy and a field size similar to the COSMOS survey (2 deg2) is predicted to be the most efficient. In a 1000 h survey, we could thus detect 40 000 galaxies over 2 deg2 between z=3.8 and z=5.1 with a typical stellar mass of 109.5 M⊙ and a star formation rate of 10 M⊙/yr (see Fig. 22, right panels). These unprecedented performances will open a new era for statistical CO studies above z=4. In addition, deeper fields covering 100 arcmin2 could detect progenitors of Milky-Way-like galaxies at z5. Finally, the size of these spectroscopic samples will be sufficient to perform 3-dimension clustering measurements and to constrain their typical mass of the host dark-matter halos, which is a critical information for models of galaxy evolution.
SKA will have strong synergies with ALMA (see also Sect. 3.11), which will be able to probe complementary tracers of interstellar medium (ISM) at higher frequencies. It is particularly important to calibrate the conversion factor between the CO 1-0 line luminosity and the gas mass. Combining the CO 1-0 from SKA with higher-J transitions, we will construct the CO SLED (Spectral Line Energy Distribution, e.g. Weiss et al. 2007; Daddi et al. 2015) and put better constrain on the properties of molecular gas in z3 galaxies. Robust constraints on the various phases of the ISM will be obtained by combining CO with other ISM tracers: [NII] and [OIII] from ALMA for the ionised gas, [CII] from ALMA for the cold neutral medium and photo-dominated regions, H i from SKA and [CI] from ALMA for the atomic gas, and HCN and CS from SKA (and ALMA for high-J transitions) for the dense molecular gas (see Sect. 2.2.2.4).
References:
Aravena, M., et al. 2016, MNRAS, 457, 4406;
Bethermin, M., et al. 2017, arXiv:1703.08795, sub. to A&A;
Caputi, K. I., et al. 2007, ApJ, 660, 97;
Carilli, C. L., & Walter, F. 2013, ARA&A, 51, 105;
da Cunha, E., et al. 2013, ApJ, 766, 13;
Daddi, E., et al. 2007, ApJ, 670, 156;
Daddi, E., et al. 2010, ApJL, 714, L118;
Daddi, E., et al. 2015, A&A, 577, A46;
Decarli, R., et al. 2014, ApJ, 782, 78;
Elbaz, D., et al. 2011, A&A, 533, A119;
Genzel, R., et al. 2010, MNRAS, 407, 2091;
Harris, A. I., et al. 2012, ApJ, 752, 152;
Laporte, N., et al. 2017, ApJL, 837, L21;
Magnelli, B., et al. 2013, A&A, 553, A132;
Riechers, D. A., et al. 2013, Nature, 496, 329;
Sargent, M. T., et al. 2014, ApJ, 793, 19 ;
Schreiber, C., et al. 2015, A&A, 575, A74;
Tacconi, L. J., et al. 2013, ApJ, 768, 74;
Walter, F., et al. 2016, ApJ, 833, 67;
Weiß, A., et al. 2007, A&A, 467, 955;
Zhang, Z.-Y., et al. 2016, RSOS, 3, 160025
2.2.2.4 Extragalactic spectral lines but H i and CO
The SKA will be able to cover high frequencies in the cm range, up to 16 GHz in its first phase SKA1, and up to 24 GHz in the second phase SKA2. In this range, one of the main lines to observe is the CO(1-0), redshifted from z=3.8 and higher, since the first line of the ladder is required to better estimate the CO-to-H2 conversion ratio in galaxies. CO lines are discussed in Sect. 2.2.2.3, and here we concentrate on other molecular lines, such as HCN, HCO+, HNC, CS, useful as dense gas tracers in redshifted galaxies (e.g. Wagg et al. 2015), H2O, OH, which maser lines help to trace nuclear regions at very high spatial resolution, either AGN or intense starbursts (e.g. Braatz et al. 2010; Darling & Giovanelli 2002), and recombination lines in nearby galaxies, tracing the physics of diffuse cold gas (e.g. Oonk et al. 2015). Absorption lines in front of background radio sources will yield precious clues on the dynamics and chemistry of the intervening galaxies, and help to constrain the variations of fundamental constants (e.g. Wiklind & Combes 1996; Combes & Wiklind 1999; Muller et al. 2014).
Dense gas tracers in redshifted galaxies
In the last decade, lots of efforts have been done to investigate the gas content of main sequence galaxies, forming stars at a sustained rate, with a depletion time of the order of 1-2 Gyr (e.g. Daddi et al. 2010; Tacconi et al. 2013). The observation of several CO lines has been used to derive the gas excitation, and estimate the CO-to-H2 conversion ratio. However, these estimations are still quite uncertain, and one way to progress is to observe dense gas tracers, such as HCN, HCO+ or CS, to probe the physical conditions (density, temperature) of the gas. This has been possible in rare cases of huge starbursts, or lensed objects with high amplification factors (e.g. Carilli & Walter 2013 for a review). Due to their high dipole moment, the critical density to excite these molecules is high (105 cm-3 or higher for the more excited levels), therefore they are difficult to detect at high J with ALMA. The first lines at J=1-0 are thus more promising. Their emission is a better tracer of star formation, since giving directly the amount of dense clumps in the molecular medium (Gao & Solomon 2004). With SKA1, HCN(1-0) will be observable for z4.5, and CS(1-0) for z2. For SKA2, these will be z2.7 and z1, respectively. The expected lines are weak, though, about an order of magnitude less than the CO lines for starbursts, and even less for normal galaxies. Wagg et al. (2015) estimate that the SKA1 deep survey (5000h) could detect about 1 source per arcmin in CS and HCN, and SKA2 (1000h) about 10 times more.
Water masers and AGN
In the sub-pc regions around AGN, the gas is so dense and excited that H2O masers can be excited (e.g. the prototype NGC 4258, Greenhill et al. 1996). The emission is so strong that long baselines (VLBI) can be used, bringing a lot of information on the gas dynamics and mass of the central black hole. The rest-frame frequency being 22 GHz, nearby galaxies could be observed with SKA2, and z0.5 masers could be found with SKA1. Up to now, more than 100 type-2 AGN have been detected (e.g. Braatz et al 2010). Beyond the study of the accreting disk itself, measuring its thickness, and its warping in some cases, and the accurate determination of black hole masses, the high resolution imaging and proper motions can determine accurate distances, and the value of the local Hubble constant. SKA will bring a strong, independent and complementary method to determine H0 at different redshifts with a precision better than 5% (e.g. Braatz et al. 2015), a valuable advantage when the other methods are in tension (e.g. Planck collaboration 2016).
OH megamasers and starbursts
Starbursting galaxies are strong infrared emitters (LIRG and ULIRGs), and provide the conditions to excite OH mega-masers, 2 to 4 orders of magnitude more luminous than OH galactic masers, at the 1.6 GHz frequency (Baan & Haschick 1983). The powerful lines are broad (1000km/s) and can be multiple. More than 100 OH megamasers have been detected now, in particular with the Arecibo survey (e.g. Darling & Giovanelli 2002), and their redshifts are between 0.1 and 0.23. Since the star formation rate increases with redshift by an order of magnitude until z2, the number of actively star-forming galaxies are expected to increase by several orders of magnitude, given the much larger volume explored at high z. The detection of OH megamasers at any redshift will be a side product of the deep SKA surveys of redshifted H i line. This will give insight in the merger evolution with redshift. Based on the correlation between OH megamasers and IR luminosity, the OH masers could be detected up to z=3-5 (cf Roy & Klöckner 2012). In addition to yield the rate of mergers as a function of redshift and the OH mega-maser luminosity function, this research will allow to statistically investigate the nuclear regions of starbursts, and propose targets to follow up at various wavelengths, in particular with ALMA.
Radio Recombination lines
The H i 21 cm line does not inform about the physical conditions of the atomic gas, and in particular its density and temperature. A complementary tracer are the radio recombination lines of hydrogen and carbon, which correspond to dense and clumpy media at high frequency (corresponding to SKA-MID) and to a diffuse medium at low frequency, 350 MHz, corresponding to SKA-LOW (e.g. Thompson et al. 2015). The diffuse carbon radio recombination lines (CRRL) are sensitive to the cold medium, or CNM, and have narrow line-widths, while that of hydrogen (HRRL) are found in the warm medium (WIM), with broader widths. In the Milky-Way, these lines are observed both in emission and absorption in front of strong continuum sources, with typical optical depth of 0.5 to 2 10-3. Diffuse CRRL have been observed towards external galaxies by LOFAR in absorption in M82 (Morabito et al. 2014). The lines are issued from atomic gas or PDR, where the carbon is ionized. The non-LTE models necessary to interpret the data yield the electronic temperature and density and the abundance of carbon. By comparison of H i-21 cm lines, it is possible to derive the fraction of CNM, WNM and WIM along the line of sight. With SKA1, about 100 nearby galaxies could be detected in the CRRL, while 400 will be detected and mapped with SKA2 (Oonk et al. 2015).
Absorption lines in intervening galaxies
Molecular absorption lines from cold medium in intervening galaxies is a powerful tool to study high-redshift galaxies with high resolution and high sensitivity, since the optical depth can rise up to saturation, and only the pencil beam of the strong background radio core is involved. The detection power is then only due to the continuum strength, and only small masses of molecular medium are necessary for detection (Wiklind & Combes, 1996). Five absorbing systems have been detected with mm telescopes, and three of them correspond to lensed quasars, where the absorption comes from the lensing galaxy. In PKS1830-21, a molecular line survey was even possible with ALMA, as shown in Fig. 23 (Muller et al. 2014). Since several lines of sight cross the galaxy, its dynamic can be probed. The absorption lines from the cold medium are so narrow, that a high precision on their frequency/velocity is obtained, thus these systems are ideal targets to constrain the variation of fundamental constants, by comparing various elements (H i, CI, HCN, CS, CH3OH, e.g. Murphy et al. 2001). With SKA, many more absorbing systems are expected to be detected, since the strength of continuum sources increases at low frequency (synchrotron emission). These detections will be a side product of wide redshifted H i surveys.
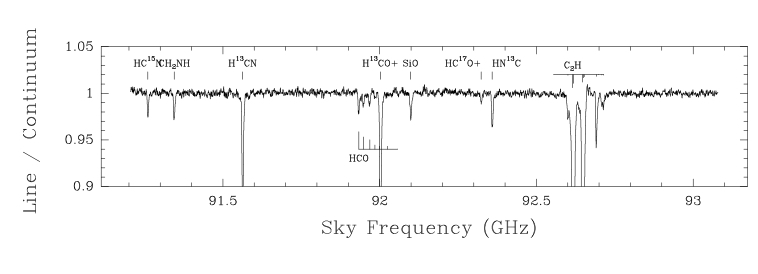
References:
Baan, W.A., & Haschick, A.D., 1983, AJ 88, 1088;
Braatz J.A., et al., 2010, ApJ, 718, 657;
Braatz J.A., et al., 2015, IAUGA 2255730;
Carilli, C., & Walter, F., 2013, ARA&A 51, 105;
Combes, F., & Wiklind, T., 1999, in Highly Redshifted Radio Lines, ASP Conf. Series Vol. 156, p. 210
Daddi, E., et al., 2010, ApJ, 713, 686;
Darling J. & Giovanelli R., 2002, ApJ, 572, 810;
Gao, Y. & Solomon, P. M., 2004, ApJS, 152, 63;
Greenhill, L. J., et al., R., 1996, ApJ 472, L21;
Morabito, L. K., et al., 2014, ApJ 795, L33;
Muller, S., et al., 2014 A&A, 566, 112;
Murphy, M. T., et al., 2001, MNRAS 327, 1244;
Oonk, J.B.R., et al., 2015, AASKA14, 139;
Planck collaboration, 2016, A&A 594, A13
Roy, A., Klöckner, H.R., 2012, in ”SKA German White Paper”;
Tacconi, L. J., et al., 2013, ApJ, 768, 74;
Thompson, M., et al., 2015, AASKA14, 126;
Wagg, J., et al., 2015, AASKA14, 161;
Wiklind, T, Combes, F, 1996 Nature 379, 139
2.2.2.5 The role of AGN
Active galactic nuclei (AGN), powered by accretion of baryonic matter onto the supermassive black holes that reside in the centres of most galaxies, are amongst the most luminous objects in the Universe. The most powerful AGN release the equivalent of the binding energy of a massive galaxy within their short activity periods of few ten to hundred Million years (e.g., Silk & Rees, 1998), separated by much longer epochs of relative quiescence. The injection of a small amount of this energy is sufficient to regulate baryon cooling and cosmic structure formation from the sizes of individual galaxies to galaxy groups and clusters (Dubois et al. 2016), the largest gravitationally bound structures in the Universe today. Most galaxies host dormant AGN, whose masses are tightly correlated with the mass and other structural properties of their host galaxy, pointing out a close evolutionary link. AGN emit varying fractions of their kinetic energy in form of relativistic particles, producing radio jets and lobes, whose sizes can range from few parcsec to the Mpc sizes of entire galaxy clusters. In the most powerful high-redshift AGN, these jets take the leading role in stirring up the gas of the host galaxy and expelling large fractions of it, thereby quenching further star formation, and playing a decisive role for the evolution of massive galaxies (e.g., Nesvadba et al. 2006, 2017). It is probably also the radio source which keeps massive galaxies gas-poor over the 10 Billion years following their initial growth phase, and until the present day (e.g., Best et al. 2006; Nyland et al. 2016).
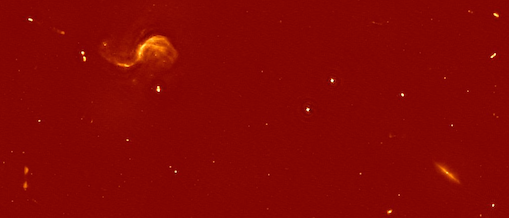
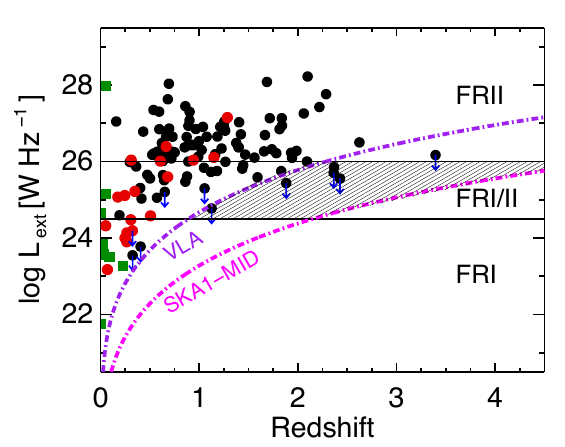
SKA will revolutionise our understanding of AGN in many ways. For the first time, we will have comprehensive surveys of the AGN population, including radio-quiet sources, out to redshifts z, well beyond the peak of cosmic star formation at z. This will provide us with the definite answer on the global role of AGN feedback, its occurrence during different key phases of the cosmic star formation history, galaxy evolution (e.g., starburst, galaxy interactions and mergers, passive evolution), and as a function of galaxy mass and environment. In addition SKA, by exceeding the spatial resolution and sensitivity of current data sets by more than an order of magnitude, will allow us to follow the expansion of individual radio sources through the interstellar gas of their host galaxies and surrounding intergalactic or intracluster environments, and provide us with the physical parameters necessary to unify the rich morphologies and spectral shapes of these sources within a single coherent physical and evolutionary framework (Pandey-Pommier et al. 2014, 2016a), and to quantify the energy and momentum transfer from the AGN to the gas.
As a result of the survey work and detailed studies of individual galaxies or small samples, SKA will trace the co-existence of radio jets and star formation within the nuclei of the most intensely star-forming galaxies and galaxy mergers across all of cosmic star-formation history, including systems, which are optically thick even in the far-infrared and millimetre regimes. We will probe directly, whether the pressure enhancement produced by the expanding jets in the surrounding gas inhibits, or perhaps even boosts star formation (e.g., Salomé et al. 2017; Elbaz et al. 2009; Bieri et al. 2016), and constrain the number of black-hole binaries in galaxy mergers, and the physics and timescales of their merging (Capelo et al. 2017), a major hypothesised source of gravitational waves and perhaps the origin of black-hole spin and radio-loudness. Maser emission from black-hole accretion disks will provide us with accurate black-hole mass estimates out to high redshifts, tracing the co-evolution of black holes and their hosts across cosmic time (Nesvadba et al. 2011), and also constraining our understanding of the first black holes in galaxies (Volonteri et al. 2009).
SKA will give us direct access to the low-frequency radio spectrum of AGN out to the highest redshifts, which constrains the kinetic power and momentum carried by the radio lobes, and is the central parameter that determines the power of AGN feedback. For the first time, SKA will let us establish a kinetic luminosity function for AGN across cosmic history, constraining their global potential in shaping galaxies and small-scale cosmic structure. What fractions of the AGN energy output are injected into the gas, as a function of black hole and host properties, and of environment? What fraction of the rest-mass energy equivalent of the supermassive black holes does this correspond to? The energy transfer efficiency from jet to gas, and the rest-mass energy equivalent are the scaling parameters that are predicted by hydrodynamic and cosmological models of AGN feedback, and are observationally constrained only to about one order of magnitude today – a major limitation in our understanding of AGN feedback (Nesvadba et al. 2006, 2017).
SKA will also show whether AGN really fall into two classes of “radio-loud” and “radio-quiet” sources, with a clear dichotomy in black-hole properties or accretion rate (Cadolle Bel et al. 2007), or whether these are extreme ends of a continuous sequence of black-hole and host galaxy properties. SKA will be the first facility to trace AGN at the divide between Fanaroff & Riley (1974) luminosity class I and II out to the peak of cosmic star-formation at , and to probe even radio-quiet, powerful quasars out to , across nearly all of cosmic star-formation history. This will show whether AGN activity was common enough to shape galaxies at all cosmic times, a basic, and unproven ingredient of our most advanced scenarios of galaxy evolution today.
Another major limitation in our understanding of the AGN-host galaxy connection is the episodic nature of AGN activity. With the exception of rare peculiar cases, the period of quiescence between major activity cycles, and the relative timing of AGN activity and star formation are today essentially unconstrained. With SKA, we will close the feedback cycle, by probing the low-frequency radio spectrum out to high redshifts, including the past radio activity of galaxies, over timescales when the radio synchrotron spectrum of these sources has already faded at higher frequencies (Pandey-Pommier et al. 2016b). This will provide direct measures of the timing and duration of AGN activity and feedback cycles, including for low-power radio sources. The fate of the gas at the end of AGN activity could determine whether sporadic AGN activity alone can maintain low gas fractions and star formation rates in previously quenched galaxies over cosmic time (Nesvadba et al. 2011), or whether additional mechanisms are necessary (Martig et al. 2009).
SKA will also turn radio sources across cosmic history into
beacons to probe the 21 cm line of atomic hydrogen in their massive
host galaxies and surrounding gaseous halos in absorption. This
includes in particular the diffuse, low-density gas outside of massive
star-forming regions, that is otherwise unobservable (Nesvadba et
al. 2016). H i absorption line studies will provide sensitive limits of
turbulence and fragmentation of the ambient gas in high-z AGN host
galaxies, and provide us with accurate limits of gas accretion, as
well as the terminal velocities and gas escape fractions reached by
AGN and starburst-driven outflows.
References:
Best, P., et al., 2006, MNRAS, 368, L67;
Bieri, R., et al., 2016, MNRAS, 455, 4166;
Cadolle Bel, M., et al., 2007, ApJ 659, 549;
Capelo, P. R., et al., 2017, MNRAS, 469, 4437;
Dubois, Y., et al., 2016, MNRAS, 463, 3948;
Elbaz, D., et al., 2009, A&A, 507, 1359;
Fanaroff, B. L. & Riley, J. M., 1974, MNRAS, 167, 31;
Kharb, P., et al., 2016, JApA, 37, 34;
Martig, M., et al., 2009, ApJ, 707, 250;
Nesvadba, N., et al., 2006, ApJ 650, 693;
Nesvadba, N., et al., 2016, A&A 593, L2;
Nesvadba, N., et al., 2017, A&A 600, 121;
Nyland, K., et al., 2017, MNRAS, 464, 1029;
Pandey-Pommier, M., et al., 2014, in NenuFAR : instrument description and science case;
Pandey-Pommier, M., et al., 2016b, Proceedings of the SF2A, 373;
Pandey-Pommier, M., et al., 2016a, Proceedings of the SF2A, 379;
Salomé, P., et al., 2016, A&A, 595, 65;
Silk, J. & Rees, M. J., 1998, A&A 331, L1;
Volonteri, M. & Natarajan, P., 2009, MNRAS, 400, 1911
2.2.3 Nearby resolved galaxies
2.2.3.1 Galaxy dynamics and H i distribution
H i studies played a major role in the 1970s and 1980s in establishing the presence of dark matter in gas rich galaxies, necessary to keep up the extended flat or rising rotation curves at large radii, beyond the optical image. It became readily clear, however, that additional dynamical methods are needed to establish accurately the amount of dark matter, due to the well known degeneracy between models with different stellar mass-to-light ratios of the visible parts. Even though some work argues for nearly maximum disks in Milky Way type galaxies, based on considerations of spiral structure or the strength of shocks in a few barred spirals, other work, primarily using stellar velocity dispersions, indicates non-maximum disks. This problem will continue to be addressed in the near future, with extensive surveys using integral field unit spectrographs (IFUs) on dedicated optical telescopes.
More recent work on late type low surface brightness galaxies showed convincingly that the current CDM models are in disagreement with observations, the so-called core-cusp controversy (de Blok 2010). Recent attempts to solve this problem concentrate on introducing more violent feedback in the star formation recipes used in the numerical simulations of galaxy formation (Oh et al. 2015), so that an initially cuspy dark matter distribution can be modified sufficiently. Research on this problem can be expected to continue to progress, until a better understanding of these feedback mechanisms has been reached. At present, the predictions from these simulations seem to begin to work for small galaxies, but for larger ones the answer is still open. This is an active area of research, and further improvements of the galaxy formation models can be expected (e.g. Tollet et al. 2016).
For bright edge-on galaxies, the star formation intensity is such that a thick H i disk is set up, whose kinematics shows rotation speeds which are smaller than those in the plane of the disk (e.g. Oosterloo et al. 2007 for NGC 891). This greatly complicates the analysis of flaring H i disks, which are expected to exist in the outer parts of galaxies if the dark halo is near spherical, and which can help constrain the shape of the dark halo. Perhaps this latter problem can still be studied for a number of small galaxies, which have a more quiescent star formation activity.
Further H i observations can be expected in the near future, since the all-sky surveys planned with the SKA precursors enable the selection of an adequate sample of relatively unperturbed galaxies, for which far deeper H i observations can be fruitfully done with the SKA, and combined with more extensive diagnostics of the kinematics of the visible parts using IFUs. Such data will contain crucial information for the kinematics of the gas, and hence can be used to study the dark matter problem. Improvement in constraining the stellar mass-to-light ratios using multi wavelength data can also be expected. Moreover, these observations can also be used for the purposes of studying the star formation and gas accretion in disk galaxies, as well as the connection to the cosmic web. Modern star formation laws relate primarily the molecular gas to star formation, but the role of the H i and total gas reservoirs, and its dynamics, play a role in shaping the ISM in which these molecular clouds appear, a role which needs further investigation.
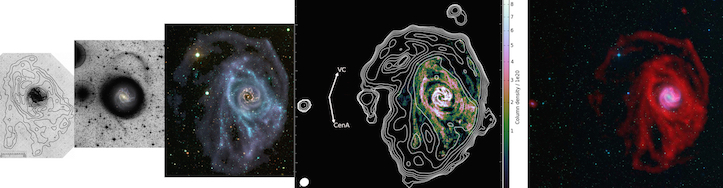
Another field whose exploration will flourish in the near future is the study of faint stellar extensions around the primary optical image of galaxies, such as extended UV disks (e.g. Espada et al. 2011) or faint optical emission (e.g. Martinez-Delgado et al. 2010). The spatial coincidence of these features with the H i is not always unique (as in e.g. M33, Lewis et al. 2013), and deep high resolution imaging with the SKA will contribute to a better understanding of this phenomenon, which may be related to interactions with and/or minor mergers of dwarf satellites. In Fig. 25 we show the evolution of the H i imaging of M83 over the last 40 years, with from left to right a low resolution image from 1974, a deep optical image from 1997, multi wavelength imaging next, then an extended image at low resolution but high sensitivity coupled with a wider field of view from 2016, and a taste of things to come with a 2017 MeerKAT image. The H i studies will be accompanied by studies of the metallicity, stellar populations and star formation of galaxy outskirts in general, as in e.g. Boissier et al. (2016).
Present plans for work in this area with the SKA pathfinders/precursors, in which members of the French astronomical community are involved, are as follows: i) with the WSRT and the Apertif instrument a large shallow survey and a medium deep survey will commence early next year. Follow-up optical data will be collected for selected galaxies with the WEAVE IFU-spectrograph on the 4.2m WHT at La Palma, planned to be ready in 2018. ii) with ASKAP, a large H i survey of the southern sky and part of the northern sky (up to declinations of 30∘), named WALLABY, is planned to commence later this year, and iii) with MeerKAT, deep observations of 30 nearby galaxies in the project MHONGOOSE are planned to commence in 2018, when the telescope is ready.
With the SKA1 and SKA2
telescopes, the sensitivity of the observations will be further improved, and better image quality
at higher spatial resolution will be obtainable. Currently under discussion are: a medium wide
survey (400 deg2 at resolution 10 arcsec) out to z 0.3, a medium deep survey (20 deg2 at resolution 5 arcsec)
out to z 0.5, a deep survey (single pointing at resolution
2 arcsec) out to z 1, deep imaging (100h/galaxy) of
30 nearby galaxies for the study of the interstellar medium, and another 30 galaxies for gas accretion.
Hence, in addition to deep observations of local galaxies, a
major push will be made to get
resolved H i data of spiral galaxies as function of redshift. The depth of the observations will allow the study of the
connection of the galaxies to the Cosmic Web. The SKA data will help refine
the models of galaxy formation and evolution significantly.
References:
Boissier, S., et al.,, 2016, A&A, 593, A126;
de Blok, W.J.G. 2010, Advances in Astronomy, 2010, article id. 789293;
Espada, D., et al., 2011, ApJ, 736, 20;
Heald, G., et al., 2017, MNRAS, 462, 1238;
Koribalski, B.S., 2015, IAUS, 309, 39;
Lewis, G.F., et al., 2013, ApJ, 763, 4;
Malin, D., Hadley, B.,1997, PASA, 14, 52;
Martinez-Delgado, D., et al., 2010, AJ, 140, 962;
Oh, S.-H., et al., 2011, AJ, 142, 24;
Oosterloo, T., et al., 2007, AJ, 134, 1019;
Rogstad, D.H., et al., 1974, ApJ, 193, 309;
Tollet, E., et al., 2016, MNRAS, 456, 3542;
Walter, F., et al., 2008, AJ, 136, 2563
2.2.3.2 The Interstellar Medium in Nearby Galaxies
Introduction
Galaxy evolution is driven by the accretion of gas onto galaxies, the cycling of matter within galaxies between the interstellar medium (ISM) and stars, and the ejection of gas from the galactic disk. Direct detailed observations of these physical processes are essential for understanding the astrophysics of galaxy evolution, to interpret unresolved observations of galaxy populations, and to implement “sub-grid” physics into numerical simulations. Nearby galaxies provide the best opportunity to study these processes in their galactic context across a representative range of galaxy properties and local ISM conditions. Here we briefly outline three science themes that will be advanced by SKA1-MID surveys of galaxies in the local Universe, focussing on topics relating to the neutral ISM and galactic-scale star formation. SKA1 studies of accretion onto supermassive black holes, galaxy dynamics, and AGN activity in nearby galaxies are described elsewhere in this volume. Time and sensitivity estimates assume the characteristics of SKA1-MID presented in Dewdney et al. (2013).
Calibrating the Star Formation Rate in Galaxies
Radio continuum (RC) observations are a powerful diagnostic of the star formation rate (SFR), allowing a direct measurement of the local star formation activity even in highly obscured environments (see e.g. Condon 1992). At GHz frequencies, RC emission consists of two components: thermal free-free emission due to ionizing photons from high-mass () stars, and non-thermal synchrotron emission from relativistic electrons gyrating in a magnetic field. The thermal RC is directly proportional to the instantaneous SFR, while the non-thermal RC depends on both the magnetic field strength and the cosmic ray electron density. The physics that produces a link between a galaxy’s global radio synchrotron luminosity and its SFR are not yet fully understood (see e.g. Bell 2003; Lacki, Thompson & Quataert 2010), and radio-based SFR estimates are usually calibrated via the RC-to-infrared (IR) correlation (e.g. Yun, Reddy & Condon, 2001). Since the non-thermal RC in normal galaxies is typically an order of magnitude brighter than the thermal RC at GHz frequencies, there is great interest in calibrating the non-thermal RC as a SFR diagnostic that can be used from the local Universe out to intermediate redshifts (e.g. Murphy 2009; see also Sect. 2.2.2.1).
SKA1-MID studies of the RC emission in nearby galaxies will make important progress on this topic. First, SKA1-MID will permit a spatially resolved imaging RC survey of galaxies across the entire frequency range between 1.6 and 10 GHz. As an example, observations with 3 resolution and 1 hr per band (4 hrs per target) would achieve Jy per beam sensitivity and linear resolutions of 300 pc for galaxies within 20 Mpc. Whereas existing facilities are restricted to studying individual targets with this combination of resolution, frequency coverage and sensitivity, SKA1-MID thus opens the possibility of a deep RC survey of nearby galaxies in less than 500 hrs of observing. These data would enable radio spectral index mapping and a robust pixel-by-pixel separation of the thermal and non-thermal RC across a wide range of galaxy types. The former will reveal how cosmic ray electrons propagate and cool within galactic disks, while the latter is needed to investigate how the non-thermal RC fraction depends on local ISM conditions (e.g. gas density, interstellar radiation field) and global galaxy processes (e.g. cosmic ray escape). Existing studies of individual targets with the VLA and Westerbork have reported variations in the relationship between the non-thermal RC emission and the SFR as a function of galactic environment (e.g. Dumas et al. 2011; Tabatabaei et al. 2013), but the larger samples and better sensitivity to diffuse emission of SKA1-MID are essential to translate these first results into a physical explanation for how the non-thermal RC traces the SFR across the galaxy population.
Second, with sensitive, sub-arcsecond imaging of individual nearby galaxies, it will become possible to obtain a complete census of the compact radio sources that trace both star formation and the final stages of stellar evolution, e.g. compact H ii regions, super star clusters, X-ray binaries, planetary nebulae, supernovae (SNe) and supernova remnants (SNR). An inventory of these populations can be used to infer the level of current and recent SF within the host galaxy, independent of the mechanisms that tie a galaxy’s non-thermal radio luminosity to its SFR. For example, SKA1-MID observations with 0.5 arcsec resolution and Jy sensitivity at 1 GHz would detect all long-lived radio SNR within Mpc. Combined with information regarding the SNR size and age, these SNR number counts track the number of recent core collapse SNe due to high-mass stars, providing a direct estimate of a galaxy’s recent SF activity and the shape of the high-mass end of the stellar initial mass function (e.g. Fenech et al. 2008). Comparing SFR estimates based on the population statistics of SF phenomena with common multi-wavelength SFR proxies (e.g. IR, UV, H) will place significant new constraints on the calibration and interpretation of extragalactic SFR diagnostics.
Tracing the Gas Cycle in Galaxies
A key result from recent multiwavelength studies of nearby galaxies is that there is a tight, approximately linear correlation between the molecular gas and SFR surface densities on kpc scales within star-forming disks (e.g. Bigiel et al. 2008; Leroy et al. 2008). This correlation can be interpreted as constant star formation efficiency in the molecular gas reservoir. However, the existing data do not access the spatial scales at which cool atomic gas collapses to form giant molecular clouds (GMCs), or the subsequent formation of individual stars. The physical processes that regulate the rate and efficiency of star formation therefore remain poorly understood. Equally puzzling is that the observed kpc-scale relation implies that nearby galaxies should deplete their molecular gas reservoirs within a few Gyr. Numerical simulations show that gas in galactic disks can be replenished by accreting gas from the intergalactic medium (IGM, e.g. Keres̆ et al. 2005), but there is little direct observational evidence for this process. Therefore, two major outstanding questions for galactic-scale theories of star formation are, How do extragalactic star formation scaling relations from the small-scale physics of cloud collapse and star formation? and How do galaxies sustain their star formation activity throughout cosmic time?
Targeted SKA1-MID observations of the H i emission in nearby galaxies will make significant progress towards answering both of these questions. First, the SKA will have sufficient sensitivity to image the atomic gas reservoir in nearby galaxies on the scale of individual GMCs and star-forming complexes. Assuming a channel width of 5 , SKA1-MID observations with 3 resolution and 10 hr per galaxy would achieve a column density sensitivity limit of cm-2 and linear resolutions of 150 pc for galaxies within 10 Mpc. A survey of 50 to 100 galaxies would open the possibility of a systematic study of the phase balance between the warm and cold atomic gas components, turbulence in the neutral ISM, and the transition from atomic to molecular gas on GMC scales across a wide range of ISM conditions and galactic environments. Combined with high resolution ALMA observations of the molecular gas in galaxies, such a survey would establish the timescales and requisite physical conditions for GMC formation, the first step – and perhaps a critical bottleneck – for star formation.
Empirical estimates for molecular gas depletion times indicate that star-forming galaxies must acquire fresh gas from the IGM to maintain their star formation activity. Simulations favour a cold gas accretion process in which the accreting gas is not shock heated as it enters a galaxy’s halo. However H i studies of the Milky Way and local galaxies consistently obtain cold gas accretion rates that are an order of magnitude below the SFR. This measurement is not straightforward, since accreting primordial gas must be distinguished from ‘galactic fountain’ gas that has been expelled from the disk by supernovae and stellar winds (e.g. Fraternali & Binney 2008). As shown by surveys such as HALOGAS (Heald et al. 2011), a thick halo of diffuse neutral gas is present around many nearby galaxies, but a significant population of H i clouds and streams transporting cold gas mass directly onto galactic disks appears to be absent. One possibility is that the accretion occurs at column densities lower than current observational limit of cm-2. With its excellent sensitivity, the SKA will be a powerful machine to characterize extraplanar H i features and to put strong observational limits on cold gas accretion rates. For example, with an angular resolution of 30 and 5 channel width, SKA1-MID will detect a column density of cm-2 with significance in 10 hours. This opens the prospect to obtain a robust statistical description of cold gas accretion activity in the local Universe by surveying gas-rich galaxies within the Local Volume ( Mpc). Looking further ahead, detailed studies of individual targets with SKA2 would reach column densities of less than cm-2 in 100 hours, accessing the regime of Lyman Limit Systems. Both modes of observations will yield strong tests of predictions from cosmological models of cold gas accretion and galactic fountain models.
Revealing the Relativistic Interstellar Medium
In addition to gas and dust, the ISM consists of magnetic fields and relativistic cosmic rays (CRs). These non-thermal components of the ISM are dynamically important, likely playing a significant role in the regulation of star formation, the launching of galactic outflows and winds, and in the hydrostatic balance and stability of galaxy gas disks (e.g. Cox 2005). Most of our knowledge of the magnetic field properties in nearby galaxies comes from radio observations (e.g. Beck 2016): the intensity of the synchrotron component measures the product of the magnetic field strength in the sky plane and the number density of CRs, while the field direction projected in the sky plane can be determined from the polarisation of the synchrotron emission. To date, radio polarisation maps of nearby galaxies have mostly been obtained with a linear resolution of kpc or greater, due to surface brightness sensitivity limitations of existing telescopes. Polarisation maps with 1-100 pc resolution are needed to investigate important physical properties of interstellar magnetic fields, e.g. the correlation scale and degree of anisotropy of turbulent magnetic fields, the universality of large-scale field reversals and magnetic helicity, and the interaction between magnetic fields and the density and kinematics of the neutral ISM.
SKA1-MID will be a powerful machine for mapping the polarised synchrotron emission in nearby galaxies. For polarisation observations, SKA1-MID Band 4 (2.8 to 5.2 GHz) or the low frequency end of Band 5 (4.6 to 13.8 GHz) offer the best compromise between synchrotron intensity (typically declining as in spiral galaxies) and Faraday depolarisation, which increases at lower frequencies. As an example, observations using 2.5 GHz of SKA1-MID Band 5 with 5 resolution would achieve a sensitivity of Jy per beam in 10 hours of integration time, times more sensitive than can be achieved with the EVLA using a similar observing configuration. This resolution is sufficient to access spatial scales of pc in the Magellanic Clouds, and 0.5 kpc or better for all galaxies within 20 Mpc. With only 10 hours required to detect even faint polarised emission in galaxy disks, SKA1-MID therefore presents an opportunity to obtain sensitive polarization maps for a significant number of galaxies, enabling the first systematic characterization of the strength and structure of the magnetic field in galaxies in the local Universe.
In addition to the references quoted above, the interested reader can refer to: Beswick et al. (2015), Murphy et al. (2015) and Pérez-Torres et al. (2015) to know more about the calibration of galaxy SFR; de Blok et al. (2015), McClure-Griffiths et al. (2015) and Popping et al. (2015) about tracing the gas cycle in galaxies; Beck et al. (2015) concerning how to reveal the relativistic interstellar medium.
References:
Beck, R., et al., 2015, AASKA14, 94;
Beck, R., 2016, A&AR, 24, 4;
Bell, E., 2003, ApJ, 586, 794;
Beswick, R., et al., 2015, AASKA14, 70;
Bigiel, F., et al., 2008, AJ, 136, 2846;
de Blok, E., et al., 2015, AASKA14, 129;
Condon, J., 1992, ARA&A, 30, 575;
Cox, D., 2005, ARA&A, 43, 337;
Dumas, G., et al., 2011, AJ, 141, 41;
Fenech, D., et al., 2008, MNRAS, 391, 1384;
Fraternali, F. & Binney, J., 2008, MNRAS, 386, 935;
Heald, G., et al., 2011, A&A, 526, 118;
Keres̆, et al., 2005, MNRAS, 363, 2;
Lacki, B., et al., 2010, ApJ, 717, 1;
Leroy, A., et al., 2008, AJ, 136, 2782;
McClure-Griffiths, N., et al., 2015, AASKA14, 130;
Murphy, E., 2009, ApJ, 706, 482;
Murphy, E., et al., 2015, AASKA14, 85;
Pérez-Torres, et al., 2015, AASKA14, 60;
Popping, A., et al., 2015, AASKA14, 132;
Tabatabaei, F., et al., 2013, A&A, 552, 19;
Yun, M., et al., 2001, ApJ, 554, 803
2.3 Galactic astronomy
Contributors of this section in alphabetic order:
F. Acero [IRFU, CEA, Université Paris-Saclay, Gif-sur-Yvette, France;Université Paris-Diderot, AIM, Sorbonne Paris Cité, CEA, CNRS, Gif-sur-Yvette, France], M. Alves [IRAP, Université de Toulouse, CNRS, UPS, CNES, Toulouse, France], A. Araudo [Laboratoire Univers et Particules de Montpellier, Université de Montpellier, CNRS/IN2P3, Montpellier, France], A. Bacmann [Université Grenoble Alpes, CNRS, IPAG, Grenoble, France], J.-P. Bernard [IRAP, Université de Toulouse, CNRS, UPS, CNES, Toulouse, France], S. Bottinelli [IRAP, Université de Toulouse, CNRS, UPS, CNES, Toulouse, France], F. Boulanger [LERMA, Observatoire de Paris, École normale supérieure, PSL Research University, CNRS, Sorbonne Universités, UPMC Univ. Paris 06, Paris, France;Institut d’Astrophysique Spatiale, CNRS, UMR 8617, Université Paris-Sud, Université Paris-Saclay, Orsay, France], A. Bracco [Institut d’Astrophysique Spatiale, CNRS, UMR 8617, Université Paris-Sud, Université Paris-Saclay, Orsay, France;IRFU, CEA, Université Paris-Saclay, Gif-sur-Yvette, France;Université Paris-Diderot, AIM, Sorbonne Paris Cité, CEA, CNRS, Gif-sur-Yvette, France], J.-M. Casandjian [IRFU, CEA, Université Paris-Saclay, Gif-sur-Yvette, France;Université Paris-Diderot, AIM, Sorbonne Paris Cité, CEA, CNRS, Gif-sur-Yvette, France] L. Cambresy [Université de Strasbourg, CNRS, Observatoire astronomique de Strasbourg, UMR 7550, Strasbourg, France] E. Caux [IRAP, Université de Toulouse, CNRS, UPS, CNES, Toulouse, France], I. Cognard [LPC2E, CNRS, Université d’Orléans, Orleans, France], E. Dartois [Institut d’Astrophysique Spatiale, CNRS, UMR 8617, Université Paris-Sud, Université Paris-Saclay, Orsay, France], K. Demyk [IRAP, Université de Toulouse, CNRS, UPS, CNES, Toulouse, France], E. Falgarone [LERMA, Observatoire de Paris, École normale supérieure, PSL Research University, CNRS, Sorbonne Universités, UPMC Univ. Paris 06, Paris, France], K. Ferrière [IRAP, Université de Toulouse, CNRS, UPS, CNES, Toulouse, France], I. A. Grenier [IRFU, CEA, Université Paris-Saclay, Gif-sur-Yvette, France;Université Paris-Diderot, AIM, Sorbonne Paris Cité, CEA, CNRS, Gif-sur-Yvette, France], J. M. Griessmeier [LPC2E, CNRS, Université d’Orléans, Orleans, France;Station de Radioastronomie de Nançay, Observatoire de Paris, PSL Research University, CNRS, Univ. Orléans, Nançay, France], L. Guillemot [LPC2E, CNRS, Université d’Orléans, Orleans, France;Station de Radioastronomie de Nançay, Observatoire de Paris, PSL Research University, CNRS, Univ. Orléans, Nançay, France], A. Gusdorf [LERMA, Observatoire de Paris, École normale supérieure, PSL Research University, CNRS, Sorbonne Universités, UPMC Univ. Paris 06, Paris, France], E. Habart [Institut d’Astrophysique Spatiale, CNRS, UMR 8617, Université Paris-Sud, Université Paris-Saclay, Orsay, France], P. Hennebelle [IRFU, CEA, Université Paris-Saclay, Gif-sur-Yvette, France;Université Paris-Diderot, AIM, Sorbonne Paris Cité, CEA, CNRS, Gif-sur-Yvette, France], F. Herpin [Laboratoire d astrophysique de Bordeaux, Université de Bordeaux, CNRS, Pessac, France], R. Lallement [GEPI, Observatoire de Paris, PSL Research University, CNRS, Meudon, France], B. Lefloch [Université Grenoble Alpes, CNRS, IPAG, Grenoble, France], M. Lemoine-Goumard [Université Bordeaux, CNRS/IN2P3, Centre d Études Nucléaires de Bordeaux Gradignan, Gradignan, France], F. Levrier [LERMA, Observatoire de Paris, École normale supérieure, PSL Research University, CNRS, Sorbonne Universités, UPMC Univ. Paris 06, Paris, France], D. Lis [LERMA, Observatoire de Paris, École normale supérieure, PSL Research University, CNRS, Sorbonne Universités, UPMC Univ. Paris 06, Paris, France], A. López-Sepulcre [Institut de Radioastronomie Millimétrique (IRAM), Saint Martin d Hères, France], A. Marcowith [Laboratoire Univers et Particules de Montpellier, Université de Montpellier, CNRS/IN2P3, Montpellier, France], D. J. Marshall [IRFU, CEA, Université Paris-Saclay, Gif-sur-Yvette, France;Université Paris-Diderot, AIM, Sorbonne Paris Cité, CEA, CNRS, Gif-sur-Yvette, France], M.-A. Miville-Deschenes [Institut d’Astrophysique Spatiale, CNRS, UMR 8617, Université Paris-Sud, Université Paris-Saclay, Orsay, France], L. Montier [IRAP, Université de Toulouse, CNRS, UPS, CNES, Toulouse, France], J. Pety [Institut de Radioastronomie Millimétrique (IRAM), Saint Martin d Hères, France;LERMA, Observatoire de Paris, École normale supérieure, PSL Research University, CNRS, Sorbonne Universités, UPMC Univ. Paris 06, Paris, France], M. Renaud [Laboratoire Univers et Particules de Montpellier, Université de Montpellier, CNRS/IN2P3, Montpellier, France], I. Ristorcelli [IRAP, Université de Toulouse, CNRS, UPS, CNES, Toulouse, France], M. Schultheis [Université Côte d’Azur, Observatoire de la Côte d’Azur, CNRS, Laboratoire Lagrange, Nice, France], G. Theureau [LPC2E, CNRS, Université d’Orléans, Orleans, France;Station de Radioastronomie de Nançay, Observatoire de Paris, PSL Research University, CNRS, Univ. Orléans, Nançay, France;LUTh, Observatoire de Paris, PSL Research University, CNRS UMR 8109, Université Pierre et Marie Curie, Universit é Paris Diderot, Meudon, France], C. Vastel [IRAP, Université de Toulouse, CNRS, UPS, CNES, Toulouse, France], L. Verstraete [Institut d’Astrophysique Spatiale, CNRS, UMR 8617, Université Paris-Sud, Université Paris-Saclay, Orsay, France], N. Ysard [Institut d’Astrophysique Spatiale, CNRS, UMR 8617, Université Paris-Sud, Université Paris-Saclay, Orsay, France]
2.3.1 The nearby interstellar medium
Spectral line mapping
Different evolutionary processes involving the interstellar medium (ISM) dictate how our Galaxy evolves. From molecular formation through to star formation and the enrichment provided by evolved stars, detailed knowledge of these processes is only available in our Galactic backyard, yet they allow us to better understand how external galaxies evolve as well. The nearby ISM provides a particular appeal with respect to SKA observations as it will be possible to study the different phases of the ISM in exquisite detail.
Data from the SKA will provide us with homogeneous coverage in angular resolution of the three main phases of the ISM (H, H2, H+) for the first time. Spectral line mapping at the resolution of 0.22” corresponds to 30/90 AU at the 140/400 pc of the Taurus/Orion complex, respectively. SKA will provide information on the neutral ISM through the H i hyperfine line at 1.4 GHz, on the diffuse molecular phase through four OH lines at 1.612, 1.665, 1.667 and 1.720 GHz, as well as on the ionised phase through several radio recombination lines of both hydrogen and helium. Due to the limited wavelength range where these lines fall they can be observed simultaneously by the SKA, providing increased mapping speed over current observatories. Using line information in emission and in absorption from the SKA, the nearby ISM can be studied from the appearance of molecules through star forming clouds and the feedback of energetic processes as traced by the ionised phase.
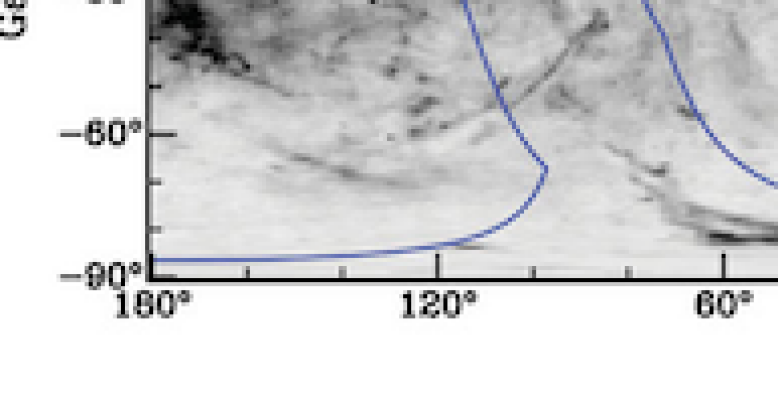
As a taster of things to come, observations are currently underway using the Australian SKA Pathfinder (ASKAP) to map the Galactic plane (GASKAP, Dickey et al. 2013). Fig. 26 shows the different areas of the survey which, beyond the Galactic disk and Magellanic clouds, overlap nearby molecular clouds with different levels of stellar activity (e.g., Chamaeleon and Pegasus) and translucent clouds in different dynamical states (e.g., cirri and intermediate velocity clouds). The survey totals over 13000 square degrees in roughly 8000 hours of observing time. The angular resolution will reach down to 20” with 1mJy sensitivity. The sampling of the atomic and molecular phases through H i absorption as well as H i and OH emission will highlight the interplay between these two phases, specifically the production and shielding of molecular gas, and the influence of the Galactic environment on this interface. Information on this transition, the conditions under which it happens, and the mass locked up in this optically-thick H i and CO-dark H2 transition will provide valuable insight into the differences in evolution of molecular clouds. In the SKA1-MID phase this study can be extended to other local complexes at medium and high Galactic latitudes. It will finally be possible to combine H i and OH observations (from the SKA) with CO data in absorption and emission (from ALMA) and with total gas tracers (such as dust and rays). This comparison is essential if we wish to improve the interpretation of H i and CO line emission along with dust emission which are the only available diagnostics in external galaxies.
3D Exploration of the ISM
The large amount of quality stellar data in the last two decades (2MASS, SDSS, PanStarrs … ) has allowed the construction of three dimensional maps of dust density (Lallement et al. 2014; Marshall et al. 2006; Green et al. 2014). In many environments, dust and H i trace the same underlying material (Planck & Fermi collaborations, 2015), therefore, combined with a SKA diffuse H i survey, the aforementioned 3D dust maps provide a tool to explore the distribution of gas in 4D phase space. This will help us trace the flow of gas from the halo through the ISM where it collapses and feeds star formation. With this description of the distance and kinematics of the gas, we can tackle the essential question of “where does the gas come from?” (McClure-Griffiths et al. 2015).
The Gaia mission (Gaia collaboration, 2016) will help a lot with this effort by providing parallax and extinction measurements to a billion stars. However, Gaia will not provide a full description of nearby molecular clouds as it will not “see” stars embedded within the clouds due to the high extinction suffered there. In contrast, the SKA is able to pick up these embedded stars, such as young stellar objects, and through accurate astrometry will also provide robust distances and proper motions to these sources. The radial velocity can be obtained through line emission, thus providing an exceptional complement to Gaia, and enabling the full characterisation of all local star-forming complexes, even in the SKA1-MID phase. These studies could be extended to local spiral arms using the full SKA2 array.
Additionally, information on the sites and processes of formation/destruction of the complex organic molecules responsible for the hundreds of optical and IR Diffuse Interstellar absorption Bands (DIBs) will benefit from the combination of new multiplex stellar surveys and high-resolution SKA maps of the three ISM phases. Ground based surveys and Gaia provide massive amounts of DIB strengths and radial velocities towards targets seen through all kinds of interstellar phases and cloud opacities. Cross matching this data with SKA lines will allow deeper studies of the link between DIBs and the physical state and the history of interstellar clouds. Subsequently, in combination with dust emission, it will be possible to explore the link with the dust grain distributions in the clouds.
Probing the ionised ISM
Radio recombination lines (RRLs) of many atomic species will be detected by the SKA. Each species can produce many different RRLs and their combination can be used to deduce many properties of the ionised phase of the ISM (Thompson et al. 2005, and references therein). In contrast to present day surveys, the SKA will detect RRLs both at both high resolution and high sensitiviy. These lines are excellent probes of the WIM and are essential to complete our picture of the nearby ISM with its shells, bubbles, and cavities. In addition, MeerGAL is a proposed Galactic plane survey using the 64-dish MeerKAT telescope, a SKA precursor and the most sensitive cm-wave telescope in the southern hemisphere. Observations are to be collected from 10-14 GHz over a total of 3300 hours. These observations will map out young H ii regions as well as RRLs.
The ionised ISM can also be probed using dispersion measures of the radio pulses of Galactic pulsars in order to reconstruct a 3D model of the free electron density in the Galaxy (NE2001, Cordes & Lazio, 2003). This
model is very poorly defined in the nearby ISM due to low numbers of pulsars off the Galactic plane and to the complexity of the 3D distribution of nearby ionised bubbles.
SKA1 will increase the number of observed pulsars by more than an order of magnitude (Keane et al. 2014), including many at high latitude. The combination of these dispersion measures, of the RRLs that the SKA will detect, as well as observations of free-free emission (e.g., Planck collaboration, 2016), will enable a major improvement of the NE2001 model in the nearby ISM.
References:
Cordes & Lazio, 2003, arXiv:astro-ph/0207156v3;
Gaia collaboration, 2016, A&A, 595, A1;
Dickey, J.M., et al., 2013, PASP, 30, 3;
Green et al., 2014, ApJ, 783, 114;
Lallement, R. et al., 2014, A&A, 561, A91;
Keane, E.F. et al., 2015, AASKA14, 40;
Marshall, D.J. et al., 2006, A&A, 453, 635;
McClure-Griffiths, N. M. et al., 2015, AASKA14, 130;
Planck collaboration, 2016, A&A, 594, A25;
Planck & Fermi collaborations, 2015, A&A, 582, A31;
Thompson, M. et al., 2015, AASKA14, 126
2.3.2 Turbulent cascade
Basics of turbulence
Turbulence is the occurrence of chaotic motions in a fluid, preventing any deterministic description of its velocity field on long timescales, so that only statistical analyses are appropriate. This impredictability stems from the non-linearity and non-locality of the equation describing the time evolution of , through which instabilities lead to the fragmentation of large eddies into ever smaller ones, until the viscous damping time is equal to the eddy turnover time. That picture led to the K41 description of a ”turbulent cascade” (Kolmogorov 1941), which is based on the assumption that the energy transfer rate from scale to scale is constant, such that the solution is statistically time-invariant. Key results from this K41 theory are that the velocity fluctuations at a scale are approximately given by , that the velocity power spectrum integrated over directions scales with wavenumber as , and that the structure functions of the velocity field777These are defined through , where and the average is over lag vectors at given . scale as for any positive integer . The main flaw of the K41 theory, despite its successes, is that it cannot explain phenomena such as intermittency, which is the fact that energy dissipation occurs in intense bursts, highly localised in both time and space. In experimental studies, intermittency manifests itself through the presence of non-Gaussian wings in the probability distribution functions (PDFs) of at small scales. Several improvements of this turbulent cascade picture have been proposed to take into account effects of 1/ compressibility (see, e.g., Falceta-Gonçalves et al. 2014), 2/ magnetisation in both isotropic (Iroshnikov 1964; Kraichnan 1965a,b) and anisotropic (Sridhar & Goldreich 1994; Goldreich & Sridhar 1995) frameworks, and 3/ both compressibility and magnetisation (Kritsuk et al. 2007).
Interstellar turbulence
The idea of interstellar turbulence was first suggested in 1951 by Von Weiszäcker and Von Hörner. It is supported by observations of power-law power spectra over a large range of scales for a number of tracers, such as the local free electron density (Armstrong et al. 1995) or atomic hydrogen (H i) density and velocity fluctuations (e.g., Miville-Deschênes et al. 2003a). This self-similarity is expected to span up to eight orders of magnitude in size: most of the energy injection, from massive stellar feedback, supernovæ, and Galactic shear, occurs on 100 pc to 1 kpc scales, and the turbulent cascade trickles energy down to dissipation scales of a few AU (). Although the spectral indices found in different studies reveal a large scatter (see the review by Hennebelle & Falgarone 2012), this may be due to projection effects (Lazarian & Pogosyan 2000; Miville-Deschênes et al. 2003b; Levrier 2004) and to the large panel of tracers being used. Other observational diagnostics are suggestive of turbulence, such as the Larson (1981) scaling between the sizes of molecular clouds and their suprathermal linewidths, with , or the constancy of observed over a wide range of scales (Hennebelle & Falgarone 2012), in agreement with theoretical findings of Kritsuk et al. (2007) for compressible MHD. Hints of the intermittent dissipation of turbulence at small scales are also apparent : the non-Gaussian wings of centroid velocity increments in CO observations by Hily-Blant et al. (2008) are linked to the plane-of-the-sky projection of the vorticity (Lis et al. 1996), and they are shown to arise from coherent, milliparsec-scale elongated structures exhibiting large velocity shears (Falgarone et al. 2009).
The promise of SKA for interstellar turbulence
The SKA is purposefully built as a ”gas survey machine”, with a particular focus on the 21 cm line from atomic neutral hydrogen (H i), a ubiquitous component of the interstellar medium (ISM) which exhibits structure on a wide range of scales, from to a few tens of AU. By measuring this spectral line with high brightness temperature sensitivity, high angular resolution, wide field-of-view, and high spectral resolution, SKA will provide tremendous advances in our understanding of the distribution and kinematics of the atomic gas, and therefore of the turbulent cascade over the entire range of relevant scales (Staveley-Smith & Osterloo 2015).
The H i emission is mostly optically thin, so its brightness temperature is proportional to the column density of atomic hydrogen, , and includes contributions from the warm neutral medium (WNM) and the cold neutral medium (CNM), in proportions that vary depending on the line-of-sight probed. The spectral line cubes of H i emission provided by state-of-the art surveys such as GASS (McClure-Griffiths et al. 2009; Kalberla & Haud 2015), EBHIS (Winkel et al. 2016) and GALFA-H i (Peek et al. 2011) allow one to characterise the power spectrum of turbulent motions in the WNM, provided one can remove the CNM part. These surveys reach angular resolutions of to , spectral resolutions of to , and typical column density sensitivities of a few . The high angular and spectral resolutions, and the high sensitivity provided by SKA will extend these studies to much smaller scales. The CNM itself is best traced by H i absorption measurements, either as self-absorption features (HISA) yielding maps of its spatial distribution, or using strong continuum background sources, which allows one to derive its spin temperature. These absorption measurements will probe the smallest scales and therefore constrain turbulence dissipation mechanisms (Dickey et al. 2004). For instance, by targeting extended continuum background emission such as supernova remnants, variations of a few percent in can be mapped over scales of a few (corresponding to 10 AU at the 100 pc distance to nearby clouds).
While it is difficult to determine the density and temperature structure of the atomic gas solely from 21 cm H i data, low-frequency narrow carbon radio recombination lines (RRL, probed by the SKA1-LOW), which are good tracers of the cold atomic gas, will help disentangle contributions from CNM and WNM (Oonk et al. 2015). Broader RRLs from hydrogen will likely arise from the ionised gas (WIM) and will trace its own kinematics (Thompson et al. 2015). The distinction between cold and warm components of H i will also help constrain models of turbulent mixing by measuring the amount of thermally unstable gas, thought to be transitioning between the CNM and WNM stable phases. The SKA will thus be able to compare turbulent motions in various phases of the ISM and address important topics such as, e.g., 1/ determining whether turbulence in the CNM is ”frozen-in” as cold atomic gas transitions to the molecular phase; 2/ assessing the dominant mode of turbulent energy injection (solenoidal vs compressive), which can be estimated from spectral line cubes using the method of Brunt & Federrath (2014), as demonstrated with the molecular line survey of the Orion B molecular cloud (Orkisz et al. 2017); and 3/ providing constraints for global turbulent ISM models, using dust reddening measurements from PAN-STARRS and LSST and distance measurements from GAIA, which together with SKA data will provide a true tomography of the atomic ISM, with 3 spatial dimensions and one velocity component (McClure-Griffiths et al. 2015).
Moreover, SKA Galactic surveys aimed at the H i line will simultaneously provide maps of the synchrotron continuum at 1.4 GHz, both in total intensity and linear polarisation. As demonstrated by Gaensler et al. (2011) using ATCA, this data will help probe turbulence in the magneto-ionic medium through polarisation gradients. Regarding the interplay between matter structures and magnetic fields in the ISM, this will complement similar Faraday tomography studies of this medium with LOFAR (Zaroubi et al. 2015) and the analysis of thermal dust polarisation by Planck (see, e.g., Planck Int. XX 2015; Planck Int. XXXV 2016; Soler et al. 2016).
References:
Armstrong, J. W., et al. 1995, ApJ, 443, 209;
Brunt, C. M. & Federrath, C., 2014, MNRAS, 442, 1451;
Dickey, J. M., et al. 2004, New Astr. Rev., 48, 1311;
Falceta-Gonçalves, D., et al. 2014, Nonlinear Processes in Geophysics, 21, 587;
Falgarone, E., et al. 2009, A&A, 507, 355;
Gaensler, B. M., et al. 2011, Nature, 478, 214;
Goldreich, P. & Sridhar, S., 1995, ApJ, 438, 763;
Hennebelle, P. & Falgarone, E., 2012, ARAA, 20, 55;
Hily-Blant, P., et al. 2008, A&A, 481, 367;
Hily-Blant, P. & Falgarone, E., 2009, A&A, 500, L29;
Iroshnikov, P. S., 1964, Sov. Ast., 7, 566;
Kalberla, P. M., W. & Haud, U., 2015, A&A, 578, A78;
Kolmogorov, A. N., Akademiia Nauk, 1941, SSSR Doklady, 30, 301;
Kowal, G. & Lazarian, A., 2007, ApJL, 666, L69;
Kraichnan, R. H., 1965, Phys. of Fluids, 8, 575;
Kraichnan, R. H., 1965, Phys. of Fluids, 8, 1385;
Kritsuk, A. G., et al. 2007, ApJ, 665, 416;
Larson, R. B., 1981, MNRAS, 194, 809;
Lazarian, A. & Pogosyan, D., 2000, ApJ, 537, 720;
Levrier, F., 2004, A&A, 421, 387;
Lis, D. C., et al. 1996, ApJ, 463, 623, 1996;
McClure-Griffiths, N. M., et al. 2009, ApJS, 181, 398;
McClure-Griffiths, N. M., et al. 2015, PoS, AASKA14, 130;
Miville-Deschênes, M.-A., et al. 2003, A&A, 411, 109;
Miville-Deschênes, M.-A., et al. 2003, ApJ, 593, 831;
Oonk, R., et al. 2015, AASKA14, 139;
Orkisz, J. H., et al. 2017, A&A, 599, 99;
Peek, J. E. G., et al. 2011, ApJS, 194, 20;
Planck collaboration Int. XX, 2015, A&A, 576, 105;
Planck collaborarion Int. XXXV, 2016, A&A, 586, 138;
Soler, J. D., et al. 2016, A&A, 596, 93;
Sridhar, S. & Goldreich, P., 1994, ApJ, 432, 612;
Staveley-Smith, L. & Osterloo, T., 2015, AASKA14, 167;
Thompson, M., et al. 2015, AASKA14, 126;
von Hörner, S., 1951, Zeit. Ast., 30, 17;
von Weizsäcker, C. F., 1951, ApJ, 114, 165;
Winkel, B., et al. 2016, A&A 585, A41;
Zaroubi, S., et al. 2015, MNRAS, 454, 46
2.3.3 The formation of cold atomic structures
Introduction
Most structures in the Universe are formed through the action of self-gravity. However, it appears that some structures, like atomic (H i) interstellar clouds, have an internal energy far greater than their gravitational energy. These cold clouds (CNM - K) are formed from the diffuse and warm H i (WNM - K) through a condensation process that does not involve gravity but the thermal instability (Field 1965). The efficiency of the transition of the gas from the WNM to the CNM phases is an important aspect of the regulation of the star formation rate in galaxies (Ostriker et al. 2010). How exactly atomic gas transits from diffuse warm gas into denser, colder clouds in which the hydrogen is mostly in molecular form and in which stars form, is still not fully understood. What seems clear is that the time it takes for H i to condensate is similar to the dynamical time of the turbulent motions. This is attested by the fact that a significant fraction of the H i mass is observed at temperatures between 500 and 5000 K corresponding to the thermally unstable regime (Heiles & Troland 2003).
The current scenario by which the CNM forms involves an increase of the pressure of the WNM by a large scale process, like a converging flow, sending it out of thermal equilibrium. Sonic turbulence in the pressured WNM then provides the required velocity and density fluctuations to trigger the transition to the thermally stable cold phase (Hennebelle & Audit, 2007; Saury et al. 2014). One current hypothesis is that the formation of molecular gas and stars may be the result of gravitational contraction starting in the atomic phase (e.g., Heitsch et al. 2008). Large molecular clouds may then develop from an agglomeration of small cold clouds, collected together by the sweeping action of spiral arms (Dobbs et al. 2012) or through the compressive action of H ii regions or superbubbles that can trigger the phase transition and collect H i clouds (Ntormousi et al. 2011; Clark et al. 2012). The combined action of photons and mechanical energy from young stars ultimately destroys the molecular clouds, and a large fraction of the gas is returned to either ionized or atomic form. Part of understanding how a galaxy evolves is understanding how much hydrogen exists in its various states and the time it takes for gas to flow between states and scales.
The HI-H2 transition
Linking the phase transition of the H i to the star formation cycle requires estimating the amount and properties of gas in atomic and in molecular form. The nature of the H i associated with a molecular cloud (e.g., its temperature distribution, the velocity field of the H i) is needed to inform on how molecular clouds form and on what timescale.
Since the first observations of the 21 cm line in the 1950s, the combined analysis of absorption and emission observed in neighbouring lines of sight has been used to separate the contributions of the two phases (CNM and WNM) to the emission (e.g., Heiles & Troland 2003). This leads to the estimate of the temperature, the column density and the velocity dispersion of the cold phase. This type of analysis is demanding and has been done only on a few hundred of lines of sight so far, often away from molecular clouds (Heiles & Troland 2003; Strasser & Taylor 2004; Dickey et al. 2009; Murray et al. 2017). In the last 10 years we have entered a period where the level of details reached by numerical simulation exceeds by far what has been obtained with observational data. There is now a lack of information from the data to constrain the numerical simulation results (on the CNM fraction for instance) and determine what processes dominate in different environments. With the important gain in sensitivity, SKA key programs will provide absorption measurements against radio sources (McClure-Griffiths et al. 2015). Having several of these sources per square degree, combined with the fully sampled imaging of the 21 cm emission line, will allow us for the first time to map the structure of the CNM without ambiguity. Dedicated absorption observations will also allow us to map the H i change of state through the molecular interface.
In denser environments, self-absorption signature has been detected in the 21 cm line emission where cold H i gas is located in front of a warmer H i background. These cold structures are often not seen in molecular tracers (Gibson et al. 2005). Therefore the self-absorption structures can be used to map the structure of the cold gas in and around molecular clouds, but because the temperature of the background emission is unknown, the temperature of the cold gas can not be estimated directly. Only the combination of H i emission and absorption towards continuum sources gives access to the spin temperature of the gas, . The combination of the two types of measurements provided by the SKA will allow us to use the full richness of the 21 cm emission (including the self-absorption features) to map the spatial and thermal structure of cold H i. Extracting the contribution of the cold gas from the emission data will then permit to estimate the properties of the warm and thermally unstable phases and finally understand the exact scenario that triggers the phase transition leading to the formation of cold and dense structures in the ISM. In particular, this SKA absorption grid will allow us to estimate the amount of thermally unstable gas over a large range of physical conditions and therefore evaluate the timescales of the formation process. One important goal of future studies will then be to characterise observationally the association between atomic and molecular gas.
Many difficulties hinder the estimate of the association of CNM and molecular structures. The combination of turbulent motions and thermal broadening from CNM and WNM structures makes the 21 cm line complex and significantly wider ( km s-1) than molecular lines ( km s-1). This difference in spectral characteristics is the main reason why the atomic to molecular transition in the ISM has not been mapped systematically, in spite of the existence of both large scale H i maps and large scale CO maps for more than three decades. SKA H i absorption measurements, combined with high surface brightness sensitivity data at high Galactic latitude and sub-arcminute resolution will generate a substantial catalogue of isolated H i clouds. These clouds can be observed with matching angular () and velocity ( km s-1) resolutions in molecular tracers, such as OH, CO and HCO+. The matching of molecular and atomic tracers will enable quantitative analysis of important atomic to molecular transitions in many well-defined systems.
The SKA will enable essential complementary surveys of the hydroxyl (OH) molecule, whose emission is very weak, despite its probable ubiquity and large observed column densities. Recent evidence that a large fraction of molecular gas exists in the so-called ”CO-dark molecular gas” form (Grenier et al. 2005; Planck Collaboration 2011) is an incentive to look for other tracers of cold H2 than CO. Due to its low excitation temperature, large scale maps of OH emission have not been available. This will become possible with the SKA. Combined with dust tracers and gamma ray measurements, the combination of H i and molecular tracers should lead to better constraints on the H i-H2 transition, on the molecular content of the ISM, and on the evolution of the fraction of CO-dark H2 with Galacto-centric radius and location with respect to the spiral arms.
Link with star formation
Current theoretical expectations are that the fraction of the H i in the CNM phase (), as well as the star formation rate, should scale with the pressure of the WNM (Ostriker et al. 2010; Saury et al. 2014). The exact value of is still a matter of debate, even more its variation across the Galactic plane.
Absorption measurements in the Galactic plane seem to indicate a constant value in the outer Galaxy ( kpc) of % (Dickey et al. 2009). There the scale height of the CNM and WNM are similar. In the inner galaxy, where star formation rate is higher, the CNM is much more concentrated towards the plane with a scale height of pc, a third of the scale height of the WNM. The difference in scale heights is attributed to the different pressure regime which puts the H i in physical conditions that favour the phase transition (Wolfire et al. 2003). To make progress on this topic, more absorption measurements are needed, in the Milky Way and in nearby galaxies.
For now there is only a few tens of absorption measurements in the SMC and LMC. The sensitivity of the SKA will allow us to extend this type of measurements dramatically which will open the possibility to study the efficiency of the phase transition as a function of the local physical conditions (metallicity, pressure, star formation).
References:
Clark, P. C., et al., 2012, MNRAS, 424, 2599;
Dickey, J. M., et al., 2009, ApJ, 693, 1250;
Dobbs, C. L., et al., 2012, MNRAS, 425, 2157;
Field, G. B., 1965, ApJ, 142, 531;
Gibson, S. J., et al., 2005, ApJ, 626, 195;
Grenier, I. A., et al., 2005, Science, 307, 1292;
Heiles, C. & Troland, T. H., 2003, ApJ, 586, 1067;
Heitsch, F., et al., 2008, ApJ, 683, 786;
Hennebelle, P. & Inutsuka, S.-i., 2006, ApJ, 647, 404;
Hennebelle, P. & Audit, E., 2007, A&A, 465, 431;
McClure-Griffiths, N. M., et al. 2015, AASKA14, 130;
Murray, C. E., et al., 2017, ApJ, 837, 55;
Ntormousi, E., et al., 2011, ApJ, 731, 13;
Ostriker, E. C., et al., 2010, ApJ, 721, 975;
Planck Collaboration, et al., 2011, A&A, 536, A19;
Saury, E., et al., 2014, A&A, 567, A16;
Strasser, S. & Taylor, A. R., 2004, ApJ, 603, 560;
Wolfire, M. G., et al., 2003, ApJ, 587, 278
2.3.4 Molecular complexity in cold cores and hot corinos
A tremendous advance in instrumentation for spectroscopy of the interstellar medium took place during past decades. Major discoveries have occurred because of the greater sensitivities of existing telescopes such as IRAM (30m and NOEMA), ALMA and SOFIA. The high sensitivity as well as the spectral resolution of the instruments led to the discovery of many species, and the spatial resolution was the key point to uncover the spatial distribution of these species. Complex organic molecules (COMs), such as as methyl formate (HCOOCH3), dimethyl ether (CH3OCH3) and formamide (NH2CHO), should form in every step through ice mantle desorption as well as gas-phase reactions. Formamide has recently been suggested to be a central species in the synthesis of metabolic and genetic molecules (Saladino et al. 2012), the chemical basis of life, such as amino acids, nucleic acids and bases, acyclonucleosides, sugars, amino sugars, and carboxylic acids. Glycine (NH2CH2COOH) is one of the simplest amino acids and a key constituent of living organisms. So far it has been detected in a comet (Altwegg et al. 2016) and remains a holy grail for the detection of COMs in space.


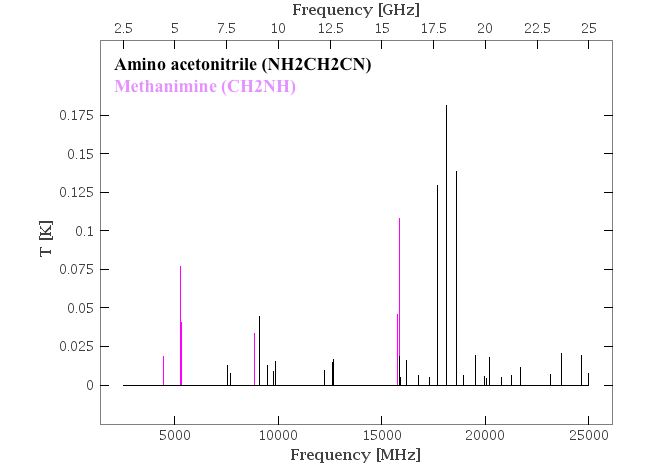
COMs have been detected in dark clouds (Marcelino et al. 2007), prestellar cores (Cernicharo et al. 2012; Bacmann et al. 2012; Vastel et al. 2014) and hot corinos (Cazaux et al. 2003; Bottinelli et al. 2004; Jorgensen et al. 2012; Kahane et al. 2013). Low mass star forming regions are best suited for the detection of COMs, especially in the earliest phases represented by prestellar cores. The level of confusion is indeed lower in those cores, considering the low gas temperatures ( 10 K), leading to a smaller excitation of the lines compared to hot cores and hot corinos. The spectra are also expected to suffer less from line blending, with lower linewidths ( 0.5 km/s) leading to a more precise identification. Recent spectral surveys at IRAM-30m such as TIMASS and ASAI revealed a high level of molecular complexity (Caux et al. 2011; Vastel et al. 2016 and references within). Upper limits on the glycine abundance have been estimated in a prestellar core (Jimenez-Serra et al. 2016) and a low-mass protostar (Ceccarelli et al. 2000) with observed transitions higher than 100 GHz.
We present in Fig. 28 a LTE CASSIS (http://cassis.irap.omp.eu/) simulation (between 350 MHz and 25 GHz) for glycine in the prototypical prestellar core L1544, using N=6 cm-2, Tex=5 K and a 0.3 linewidth, based on the upper limits estimated by Jimenez-Serra et al. (2016). We show that the brightest lines lie around 20 GHz and are around 4 mK, corresponding to a 0.2 mJy intensity considering a 12′′ beam. For baselines corresponding to this beam size, we expect to find 100 SKA1 dishes. Using a sensitivity per SKA1 dish at 20 GHz of 2 m2 K-1 (Fig. 5 of the SKA1 system baseline V2 description SKA-TEL-SKO-0000308), an integration time of 1000 hours and a spectral resolution of 0.2 (sufficient to detect the line), we expect a rms noise level of 63 Jy (see equations 9.36 from Tools of Radioastronomy, 5th edition):
| (2) |
where is the dish sensitivity (m2/K), N=n(n-1)/2 the simultaneous pair-wise correlations (n being the number of antennas), the integration time in hours, the resolution in kHz, in mm and in arcsec. Hence, the three brightest transitions at 20 GHz should be marginally detected, with a S/N of 3.2. The sensitivity at 20 GHz is a crucial parameter for the detection of glycine and other COMs such as formamide in prestellar cores and increasing its value by a factor 2 will increase the S/N by the same factor.
Nonetheless, other species of interest can be observed towards these sources with the frequency coverage currently scheduled for deployment. In particular, cyanopolyynes (HCnN where =3,5,7, …) are a key family of molecules that can be used as probes of physical and chemical conditions. We show that cyanopolyynes have much brighter lines than glycine, leading to quicker detections (less than a minute). Another species of interest is the NH3 low energy transition (1) at 23.7 GHz (1.3 K for a column density of at least 3.5 cm-2: Crapsi et al. 2007). For all these observations, line blending is not a problem as reported in spectral surveys of prestellar cores in the 70–110 GHz range and we checked with our CASSIS simulation, taking into account many species (already detected in L1544), that it will be the same in the 350 MHz–25 GHz range.
Despite the unprecedented planned performances of the SKA, the identification of glycine in a prestellar core will remain very challenging. Unfortunately, the search for this amino acid is not expected to be easier in young protostellar sources such as IRAS16293-2422. Indeed, although the column density may be a bit higher than in prestellar cores ( cm-2 in a beam – Ceccarelli et al. 2000), the higher implies that the glycine spectrum is shifted to higher frequencies, and transitions at 20 GHz are modelled to be weaker than 0.2 mK. Better targets for hot corinos would be glycine precursors such as amino acetonitrile (NH2CH2CN) and methanimine (CH2NH) as they are expected to be 100 times more abundant (Belloche et al. 2008). The CASSIS simulation for these species is shown in Fig. 28 ( cm-2, = 100 K, in a beam). We checked with CASSIS that the transitions in Fig. 28 would not suffer blending with other species. These glycine precursors could be identified in 1000 hours with SKA1 (sensitivity per dish of 4 m2 K-1 at 10 GHz, spectral resolution of 0.2 , adequate to resolve the 1 lines), whereas only 10 to 50 hours would be enough with SKA2 at 20 and 15 GHz. Also, as for L1544, cyanopolyynes would be detected in a very short integration time.
The SKA will give access to a new spectral range, with an unprecedented spatial resolution and sensitivity. SKA1 Low and SKA1 Mid will cover a frequency range from 50 MHz to 14 GHz, giving access to low energy levels of numerous COMs. The study of COMs in Sun-like star-forming regions would highly benefit from SKA2, since it would give access to the frequency band at 20 GHz, where the emission of glycine is expected to be the brightest. SKA appears as a good complement to ALMA for the study of molecular complexity in hot corinos and starless cores.
References:
Altwegg, K., et al., 2016, Science Advances, 2, 5; Bacmann, A., et al., 2012, A&A, 541, 12; Belloche, A., et al., 2008, A&A, 482, 179; Bottinelli, S., et al., 2004, ApJ, 615, 354; Caux, E., et al., 2011, A&A, 532, 23; Cazaux, S., et al., 2003, ApJ, 593, L51; Ceccarelli, C., et al., 2000, A&A, 362, 1122; Cernicharo, J., et al., 2012, ApJ, 759, 43; Crapsi, A., et al., 2007, A&A, 470, 221; Jimenez-Serra, I., et al., 2016, ApJ, 830, L6; Jorgensen, J. K., et al., 2012, ApJ, 757, 4; Kahane, C., et al., 2013, ApJ, 763, 38; Marcelino, N., et al., 2007, ApJ, 665, 127; Saladino, R., et al., 2012, cospar, 39, 1657; Vastel, C., et al., 2014, ApJ, 795, L2; Vastel, C., et al., 2016, A&A, 591, L2
2.3.5 Interstellar dust
Dust grains have a decisive role for many physical and chemical processes acting in the various environments of the interstellar medium. A good knowledge of their size, structure, and composition is thus required first to characterise their properties in all interstellar phases and how they do evolve from one phase to the other, and second to provide critical inputs for other areas of Galactic astronomy (see the other sections of this chapter). We will outline two key science topics for which SKA1 will advance our understanding of dust: the Anomalous Microwave Emission and the grain growth in protoplanetary disks towards the formation of the rocky cores of planets.
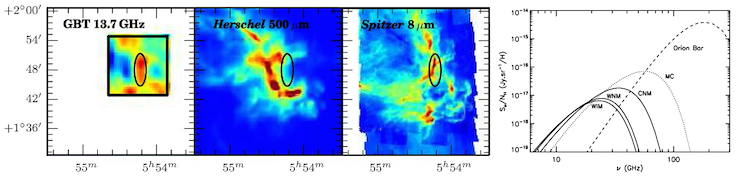
Anomalous Microwave Emission
In the late 1990s, a new emission component was detected between 10 and 50 GHz, which could not be explained by the traditional emission mechanisms known in this frequency range (CMB, free-free, synchrotron, and thermal dust). As a result, it was baptised the “Anomalous Microwave Emission” (AME). Since then, AME was detected in various interstellar environments: diffuse cirrus, dense clouds, compact H ii regions, star forming regions (e.g., Ghosh et al. 2012; Harper et al. 2015; Dickinson et al. 2009; Scaife et al. 2010). At the arcmin scale, AME intensity is correlated with dust emission at mid-IR and far-IR wavelengths (Fig. 29), the carriers of which are ultra-small grains (PAHs, a few nm in size) and bigger grains ( nm), respectively. A number of models have been proposed to explain the AME and so far, even if still questioned (Hensley & Draine 2016), the most plausible is electric dipole radiation from rapidly spinning PAHs (a.k.a. spinning dust, Draine & Lazarian 1998; Ali-Haïmoud et al. 2009; Ysard & Verstraete 2010). However, only a few studies have been able to tentatively show a better correlation between AME and PAHs than AME and bigger grains in a handful of clouds (Ysard et al. 2010; Harper et al. 2015). It is also difficult to tackle the environment physical properties responsible for the thermal and rotational excitation of PAHs, leading to mid-IR emission and AME, respectively. A large part of these difficulties arises from the lack of angular resolution of the existing facilities. With a frequency coverage up to 24 GHz and an angular resolution down to a few arcsecs, the SKA1-MID is perfectly suited to study AME and has the potential to deliver unique science for AME. Sensitive and high resolution SKA observations of dense clouds would give a clear picture of AME. AME studies would also benefit from the SKA bands 3 and 4 at lower frequency since they would allow us to distinguish AME from free-free and synchrotron emissions. Combined with higher frequency data (e.g., ALMA band 1 at 30 GHz and Spitzer IRAC in the mid-IR), it would be possible to establish the full spinning dust SED for a variety of targets. Once the spinning dust hypothesis would be confirmed, it would be possible to use this original tracer of PAHs as a new probe of the ISM. Indeed, the rotational excitation of PAHs depend on a number of parameters otherwise difficult to constrain: PAH size and electric dipole moment distributions, interstellar radiation field, H+ and C+ density, photoelectric emission, and H2 formation. All these parameters are significant inputs when one tries to understand the chemical and dynamical properties of interstellar clouds.
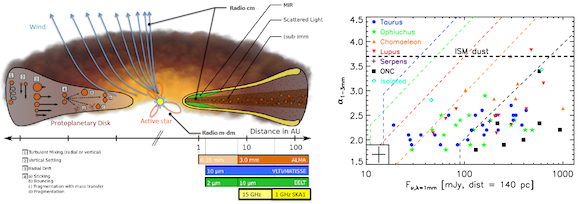
Dust in protoplanetary disks
Protoplanetary disks, rich in gas and dust, are the birthplace of planets and therefore of life itself. Dust grains play an important role in disk evolution: their settling and growth are the first steps towards the formation of the rocky cores of planets. It is thus quite central to characterise their size and structure as a function of their location in the disks. The main observational proof of grain growth is the decrease of the mm-cm mass opacity spectral index from the diffuse ISM to very dense disks (Fig. 30). Observations have revealed that grains can grow up to pebble-size (e.g., Ricci et al. 2010), which is difficult to explain theoretically due to the radial drift of solids towards the central star. One way to overcome this problem is dust trapping in pressure maxima (e.g., Fromang & Nelson 2005). Observations also showed a radial dependence of the grain size in protoplanetary disks (Guilloteau et al. 2011). All these previous observational results imply that the only way to achieve breakthrough science in dust studies is to perform spatially resolved observations of disks at low frequency. For the first time, it will be possible to resolve disks in the microwave domain using SKA1-MID. SKA is also able to detect and spatially resolve the wind emission (see Fig. 30) which has to be subtracted very accurately to study the dust properties. Combined with ALMA observations, SKA1-MID observations would allow us to radially trace grain growth down to a resolution of a few AU in nearby star forming regions. This kind of observational constraints are crucial to ascertain whether dust trapping is a realistic explanation for grain growth to the biggest sizes and also to determine timescale for the formation of the rocky cores of planets.
Finally, mid-IR observations of disks around Herbig Ae/Be stars have shown that a big amount of mass can be trapped in nanometer-sized particles (e.g., Harbart et al. 2006). Detecting spinning dust emission from disks with SKA1-MID would allow us to better constrain their properties and the origin of this small grain population.
References:
Ali-Haïmoud, Y., et al., 2009, ApJ, 395, 1055;
Dickinson, C., et al., 2009, ApJ, 690, 1585;
Draine, B.T. & Lazarian, A., 1998, ApJ, 508, 157;
Fromang, S. & Nelson R.P., 2005, MNRAS, 364, L81;
Ghosh, T., et al., 2012, MNRAS, 422, 3617;
Guilloteau, S., et al., 2011, A&A, 529, 105;
Habart, E., et al., 2006, A&A, 449, 1067;
Harper, S.E., et al., 2015, MNRAS, 453, 3375;
Hensley, B.S. & Draine B.T., 2016, ApJ, 827, 45;
Ricci, L., et al., 2010, A&A, 521, 66;
Scaife, A., et al., 2010, MNRAS, 405, L45;
Testi, L., et al., 2014, AASKA14, 117;
Ysard, N. & Verstraete L., 2010, A&A, 509, 12;
Ysard, N., et al., A&A, 509, L1
2.3.6 Faraday tomography
In the past few years, Galactic magnetism has become a recognised and rapidly growing field of research in astrophysics – an evolution that was made possible by the great improvements in observational capabilities and in computational power. However, observations of the Galactic magnetic field face several important difficulties. Indeed, the classical methods relying on Faraday rotation, synchrotron emission, and dust polarisation are neither direct (they involve the density of free electrons, cosmic-ray electrons, or dust) nor complete (they give only the line-of-sight or plane-of-sky component of the magnetic field). In addition, they probe different (ionised, cosmic-ray filled, or dusty) regions of the multi-phase interstellar medium (ISM), such that they cannot easily be combined to yield the full magnetic field vector. But the major problem resides in the lack of access to the line-of-sight dimension, since the above methods provide only line-of-sight integrated quantities, with no information on how the integrant (Faraday rotation rate, synchrotron emissivity, or dust emissivity) varies along the line of sight. One way to overcome the latter problem, and thus gain access to the 3D structure of the Galactic magnetic field, is to perform Faraday tomography, also known as rotation measure synthesis (RMS). The idea of this new technique is to exploit the wavelength-dependent Faraday rotation of the Galactic diffuse synchrotron emission to separate the different Faraday-rotating and synchrotron-emitting regions and locate them along the line of sight.
Remember that Faraday rotation is the rotation of the polarisation direction of a linearly-polarised radio wave that propagates through a magneto-ionic medium, where it interacts with the free (thermal) electrons gyrating about magnetic field lines. When the radio source is a background source, i.e., when the regions of radio emission and Faraday rotation are spatially separated, the polarisation direction rotates by an angle
| (3) |
where is the observing wavelength and RM is the so-called rotation measure, given by
| (4) |
with a numerical constant, the thermal-electron density, the line-of-sight component of the magnetic field (positive/negative when the field points toward/away from the observer), and the path length between the source and the observer. In practice, RM can be determined by measuring the polarisation direction of the incoming radiation at at least two different wavelengths. Clearly, RM is a purely observational quantity, which can be meaningfully measured only for a background radio source and which can then be related to the physical properties of the foreground Faraday-rotating medium through Eq. (4).
In contrast, when the radio source is the Galaxy itself, the regions of radio emission and Faraday rotation are spatially mixed. In that case, no longer increases linearly with (as in Eq. (3)), and the very concept of RM becomes meaningless. However, one may resort to the more general concept of Faraday depth (FD), defined as
| (5) |
where , , and have the same meaning as in Eq. (4) and is the line-of-sight distance from the observer (Burn 1966; Brentjens & de Bruyn 2005). has basically the same formal expression as RM (Eq. 4), but it differs from RM in the sense that it is a truly physical quantity, which can be defined at any point of the Galaxy, independent of any background radio source. simply corresponds to the line-of-sight depth, , measured in terms of Faraday rotation – in much the same way as optical depth corresponds to line-of-sight depth measured in terms of opacity.
When radio emission and Faraday rotation are mixed along the line of sight, the polarised intensity measured at a given wavelength is the superposition of the polarised emission produced at all line-of-sight distances , i.e., at all Faraday depths , and Faraday-rotated by an angle :
| (6) |
where is the complex polarised intensity () at , and is the complex polarised intensity per unit , also called complex Faraday dispersion function, at (Burn 1966). Since the Faraday rotation angle varies with wavelength, the polarised intensities measured at different wavelengths correspond to different combinations of all the line-of-sight contributions and, therefore, provide different pieces of information. Thus, the idea is to measure the polarised intensity at a large number of different wavelengths and to convert its variation with into a variation with . Mathematically, this can be done inverting Eq. (6), i.e., by taking the Fourier-like transform of to obtain .
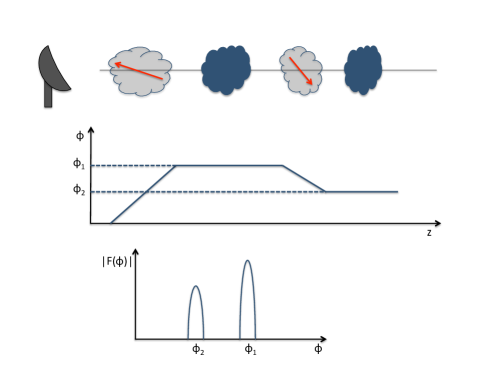
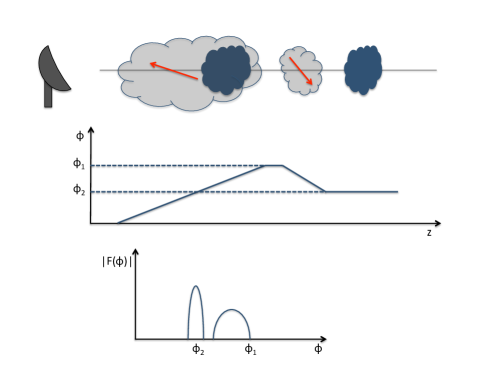
(a) (b)
The method is illustrated in Fig. 31, which depicts a situation where the line of sight intersects two Faraday-rotating clouds (shaded in light grey), across which increases or decreases according to Eq. (5), and two synchrotron-emitting clouds (shaded in dark blue). The top panel in both Fig. 31a and 31b indicates the positions of the four clouds along the line of sight with respect to the observer placed on the far left, as well as the directions of the interstellar magnetic field (red arrows) in the two Faraday-rotating clouds: in the closer/farther cloud, the field points toward/away from the observer, so that is positive/negative and increases/decreases with increasing . The corresponding run of with is plotted in the middle panel, where denotes the Faraday thickness of the closer cloud and the cumulated Faraday thickness of both Faraday-rotating clouds. The bottom panel displays the Faraday dispersion spectrum, , with the two peaks representing the polarised emissions from the two synchrotron-emitting clouds. In Fig. 31a, where the Faraday-rotating and synchrotron-emitting clouds are spatially separated, the closer and farther synchrotron-emitting clouds lie at FDs and , respectively. In Fig. 31b, the closer synchrotron-emitting cloud is embedded inside the closer Faraday-rotating cloud, so it has a finite Faraday thickness, i.e., it extends over a range of FDs (up to nearly ).
In practice, Faraday tomography can be used to separate synchrotron-emitting regions located at different FDs along the line of sight and to estimate their respective polarised synchrotron intensities, which in turn can lead to the strength and the orientation of their . Faraday tomography can also be used to uncover intervening Faraday screens and to estimate their Faraday thicknesses, which in turn can lead to their . The method is particularly interesting when the uncovered Faraday screens can be identified with known gaseous structures, because it then offers a new way of probing their magnetic field.
The SKA will be ideally suited to perform Faraday tomography,
because, in addition to its high sensitivity and fine angular resolution,
it will operate over a broad range of low radio frequencies.
The low frequencies will enhance the effects of Faraday rotation
(which increase as ) and hence improve sensitivity in FD space,
while the broad frequency coverage will make it possible to achieve
fine resolution in FD space.
More quantitatively, if the wavelength range extends
from to ,
the FD resolution is given by
,
where ,
and the maximum detectable Faraday thickness is given by
(Brentjens & de Bruyn 2005).
Thus, with the frequency range 50 – 350 MHz
SKA-LOW will reach
and ,
and with the frequency range 0.35 – 15 GHz,
SKA-MID will reach
and .
It then appears that SKA-LOW will be able to probe the local ISM
with a finer FD resolution than LOFAR currently does
(,
for the presently used frequency range 115 – 189 MHz),
in addition to its finer angular resolution,
while SKA-MID will be sensitive to Faraday-thick objects
and able to probe the internal structure of objects like supernova remnants
() at sub-arcsec resolution.
References:
Burn, B. J., 1966, MNRAS, 133, 67;
Brentjens, M. A. & de Bruyn, A. G., 2005, A&A, 441, 1217
2.3.7 Magnetic fields in star formation regions: Zeeman effect of RRLs
Magnetic fields play a crucial role in the formation and evolution of interstellar objects. With typical strengths of a few microGauss in the diffuse interstellar medium (ISM) to a few milliGauss in the denser star formation regions (see e.g. Crutcher et al. 2010), magnetic fields can be as important for the gas dynamics as turbulent motions and gravity forces. One way to assess how magnetic fields control the flow of matter in the ISM is to quantify the variation of the field strength with gas density: this relation is different if, for instance, gas compression happens parallel or perpendicular to the magnetic field lines. Such studies rely on the Zeeman effect, which is the only available technique for directly measuring magnetic field strengths in the ISM of the Milky Way and other galaxies (e.g. Crutcher et al. 1993; Robishaw et al. 2015). Despite the continuous work, observations are still sparse and so is our understanding of the impact of magnetic fields in the different interstellar environments.
Regions of massive star formation are the richest objects of the ISM for they comprise different environments. Notably, around the stars we find regions of ionised (Hii) gas, which are separated from the parent molecular cloud by a thin layer of neutral gas, called the photodissociation region (PDR) (see Fig. 32). As a result of their different physical conditions, these media will emit different types of radiation. Of interest to this chapter are hydrogen and carbon radio recombination lines (RRLs): H RRLs sample Hii regions, where the hydrogen is fully ionised, whereas C RRLs sample PDRs, where the hydrogen is atomic but the carbon is singly ionised. RRLs are powerful diagnostics of the physical conditions of the emitting gas (see e.g., Gordon & Sorochenko 2009; Oonk et al. 2015) and potentially equally strong probes of the magnetic field through their Zeeman effect.
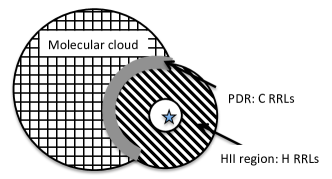
The Zeeman effect is the splitting of a spectral line into three or more components (linearly or circularly polarised). The splitting between two consecutive sub-lines is , where is the magnetic field strength and is the splitting coefficient that depends on the spectral transition. When the frequency shift is much lower than the spectral line width, (which is the case for all Zeeman detections except in OH masers), the splitting is only detectable in the Stokes spectrum. The spectrum is the difference between the two circular polarisations. It has the (horizontal -) shape of the derivative of the Stokes spectrum and is proportional to , the line-of-sight component of the magnetic field. For a Gaussian line profile having central intensity , . The splitting coefficient for H and C RRLs is the same as for the Hi line, Hz/G (Troland & Heiles 1977, Greve & Pauls 1980).
Despite several attempts, no Zeeman detection of non-masing H RRLs has been claimed to date. Thum & Morris (1999) reported the only Zeeman measurement of a H RRL maser transition at 1.3 mm (H30). Measuring the Zeeman splitting of H RRLs is therefore exploratory work, which will be enabled with SKA1. As for C RRLs, Heiles & Robishaw (2008) used the Green Bank Telescope to measure magnetic fields of G (at ) towards a couple of PDRs. These results are suggestive of high magnetic field strengths in PDRs. They also point out the need to observe such small sources with an interferometer, to minimise the effects of beam averaging and depolarisation. Zeeman observations of C RRLs are ongoing with LOFAR (R. Oonk private communication). They will be pursued first with SKA1 at the same low frequencies; later with SKA2 we will be able to explore a higher frequency range at improved angular resolutions (see below).
Fig. 33 shows our estimates of the maximum intensity of the spectrum, , for H and C transitions () as a function of quantum number and frequency. Note that there are more than 400 transitions within the SKA1 frequency range, which can be stacked to increase the sensitivity to the Zeeman effect. We use gas densities and temperatures of cm-3 and K for the Hii region and cm-3 and K for the PDR. In the Hii region, , where is the electron density; in the PDR we assume cm-3, for a C abundance of about (Tielens 2005). Moreover, we assume path lengths of 0.5 pc and 0.05 pc through the Hii region and PDR, respectively. We take into account thermal, radiation, and collisional broadening of the lines (Gordon & Sorochenko 2009; Salgado et al. 2017b). We assume that the H RRLs are emitted in local thermal equilibrium (LTE); detailed modelling of non-LTE effects shows that H line intensities can actually be enhanced at the highest frequencies ( GHz). For C RRLs we include the departure coefficients from LTE, from the recent work of Salgado et al. (2017a, 2017b).

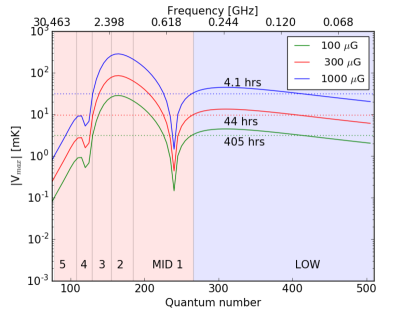
| Time [hrs] | |||
|---|---|---|---|
| [G] | H RRLs – | HRRLs – | C RRLs – 5 |
| 10000 | 0.1 | 2.5 | 4.1 |
| 300 | 0.7 | 27 | 44 |
| 100 | 6.5 | 250 | 405 |
Table 1 shows that the Zeeman effect of H and C RRLs is readily detectable with SKA1, for typical compact/ultra-compact Hii regions and PDRs, and for G. Such values have been measured in PDRs (e.g. Troland et al. 2016) but are higher than what is typically observed in large, low-density ( cm-3) Hii regions (e.g. Harvery-Smith et al. 2011). However, the magnetic field could indeed be larger in the much denser compact/ultra-compact Hii regions considered here. Angular resolutions of with MID are sufficient to observe such Hii regions up to distances of a few kpc. As for PDRs with SKA1-LOW, angular resolutions better than , which at the distance of Orion is equivalent to 0.2 pc, imply too long integration times. More detailed studies of PDRs will be possible with SKA2, when the sensitivity will increase tenfold. Moreover, SKA2 will also allow us to explore C RRLs in the MID bands; even though they are as bright as the lines at lower frequencies, they are a factor of 10 narrower.
Acknowledgements: We thank R. Oonk for kindly providing the results from non-LTE models and T. Robishaw for the discussions.
References:
Crutcher R.M., et al., 1993, ApJ, 407, 175;
Crutcher R.M., 2010, ApJ, 725, 466;
Gordon M.A. & Sorochenko R.L., 2009, Radio recombination lines, ASSL, vol. 282;
Greve A. & Pauls T., 1980, A&A, 82, 388;
Harvey-Smith L., et al., 2011, ApJ, 736, 83;
Heiles, C. & Robishaw T., 2008, IAUS, 259, 579;
Oonk J.B.R, et al., 2015, AASKA14, 139;
Robishaw T., et al., 2015, AASKA14, 110;
Salgado F., et al., 2017a, ApJ, 837, 141;
Salgado F., et al., 2017b, ApJ, 837, 142;
Thum C. & Morris D., 1999, A&A, 344, 923;
Tielens A.G.G.M., 2005, The physics & chemistry of the interstellar medium, Cambridge Uni. Press;
Troland T.H. & Heiles C., 1977, ApJ, 214, 703;
Troland T.H., et al., 2016, ApJ, 825, 2;
Wilson T.L., Rohlfs K. & Hüttemeister S., 2009, Tools of radio astronomy, Springer-Verlag
2.3.8 Jets, outflows and young stellar objects
Young Stellar Objects’ (YSOs) are stars in the early stages of their evolution, before they arrive on the main sequence. Most of them drive jets and bipolar outflows, that can harbour masers or Herbig-Haro objects. Their intense far UV field can also be at the origin of H ii regions. Finally, they are sometimes associated with protoplanetary disks. YSOs hence represent an important feedback form of stars on galaxies, as supernova remnants (SNRs) do. YSOs are less spatially extended but more numerous than SNRs. Their injection of energy to the interstellar medium (ISM) is mostly in the form of shocks and energetic radiation, and probably cosmic rays (CRs) in lower proportions. They modify the dust and gas properties and composition. As such they play an important role in the chemistry hence in the cycle of matter in galaxies. They also play a role in the energetic balance of galaxies. Their study can shed light on star formation scenarios, specially on the evacuation of momentum from forming protostars. Finally, they could be acceleration sites for CRs.
Young stellar objects
YSOs are often classified according to the mass of the forming object: from low-mass () to high-mass (), through intermediate-mass (in between), due to the different formation scenarios. Low-mass protostars are often isolated, sometimes in binary systems (e.g., BHR71, see Bourke et al. 1997), whereas their massive counterparts occur in clusters (e.g., G5.89–0.39, e.g., Hunter et al. 2008). The SKA contribution to the study of YSOs will be related to two questions. First, the high angular resolution and high sensitivity of the instrument will make the detection of multiple sources possible, as their separation within a binary system or a cluster. This is an important first step in the identification of sources driving outflows in complex systems such as G5.89–0.39. Additionally, upcoming SKA observations will contribute to the age determination of the sources (see Güdel 2002 for a review on radio emission from stellar sources), a key parameter in understanding the evolution of clusters or binary systems.
Jets and outflows
Following source identification, the separation of multiple flows and shock structures is also a topic where the high angular resolution of SKA will produce an impact. Indeed, it will contribute to disentangle the various outflow structures in a star-forming region (massive, like G5.89–0.39, or not, like the NGC1333 cloud, e.g., Dionatos & Güdel 2017). After this first separation step, isolating shock structures in outflows is also necessary before their characterisation. Indeed, the propagation of a shock in the ISM is naturally associated with several shocked layers (see e.g., Hollenbach 1997), which are generally mixed in a single-dish beam. Isolating at least those emitting in the radio range will enable a better characterisation.
The shock structures thus isolated can then be characterised. This is done by comparing observations with models of shock propagation. 1D models such as the Paris-Durham model are used to interpret single-dish observations (e.g., Gusdorf et al. 2015). These observations usually trace the molecular and atomic shocked gas in the sub-mm/IR ranges of the spectrum. Few shock tracers fall within the SKA frequency ranges, with the notable exception of masers. OH, H2O, CH3OH and NH3 masers all place constraints on dense gas properties (Frail 2011), and probe the local kinematics and magnetic field strength. All these masers will be observed with SKA with great sensitivity and will allow us to place constraints on shock models (see Gusdorf et al. 2012).
Based on these additional constraints and on complementary observations of molecular and atomic species (e.g., Bachiller et al. 2001), progress can be made in our understanding of shocks. This question encompasses the gas-phase and dust processes. In the gas phase, the observation of OH and H2O masers will allow us to a better understanding of the chemistry of oxygen for instance, and the observation of complex organic molecules will also be a step forward in our understanding of astrochemical processes (e.g., Codella et al. 2015). Regarding dust, SKA observations could shed light on the anomalous microwave emission problem (e.g., Dickinson et al. 2015). This could open a new spectral window, whose combination with data at other wavelengths could make a better characterisation of dust properties and abundance possible.
On the question of energetics, SKA observations will directly enable us to measure the energy and momentum injected into the ISM at low frequencies, for instance through the observation of recombination lines with spectral resolution (which are probes of abundance and velocity of certain gas components). Such observations could be used to benchmark simulations of star formation (e.g., Matsumoto et al. 2017 for a recent example). Additionally, the constraints placed on shock models will allow us to indirectly measure the momentum and energy injection at sub-mm to IR frequencies.
More generally, SKA observations will allow us to better understand the process of star formation in various ways. First, imaging observations of the outflow systems at very high resolution and sensitivity will be compared to more detailed shock models than 1D ones in order to probe the role of outflows in extracting momentum from accreting systems. To this aim, pseudo-3D models such as Tram et al., submitted to MNRAS, or even more sophisticated ones, e.g., the magnetised disk wind models (e.g., Panoglou et al. 2012; Yvart et al. 2016) will be constrained by observations that probe the configuration of the jet/outflow systems. Moreover, the magnetic field measurements enabled by the SKA will shed light on the role of the magnetic field in the formation of stars and their associated outflows (see Li et al. 2014 for a recent review). Finally, SKA will enable the monitoring and characterisation of episodic phenomena associated with YSOs, in particular those associated with ejection of matter from the protostar (see Anglada et al. 1998).
H ii regions
This paragraph mostly concerns the late stages of massive YSOs, which have carved H ii regions in the ISM by their far UV radiation. The size of the H ii region depends on its origin: hypercompact when it is due to a photoevaporating disk, ultracompact when diskless protostars ionise their surroundings, and compact and classical when it is caused by several sources (e.g., Zinnecker & Yorke 2007). Beyond the H ii region shell, one can often find a layer of dense gas where the physics and chemistry are driven by the far UV photons emanating from the H ii region, constituting a photon dominated or photodissociation region (PDR). This is the case in G5.89–0.39, a high-mass star forming region where a central O star has carved an ultra compact H ii region surrounded by a cocoon of dense gas (Hunter et al. 2008; Su et al. 2009). SKA is the right instrument to characterise both the H ii region and its PDRs, the signposts of stellar feedback. Indeed it will make the observation of typical tracers of H ii regions possible, as well as the study of their influence on the environment: hydrogen, helium, and carbon recombination lines (e.g., Oonk et al. 2015; Thompson et al. 2015; Beswick et al. 2015).
Cosmic Ray acceleration
Synchrotron radio emission has been detected in several YSOs, such as IRAS 16547 (Garay et al. 2003), HH80/81 (Marti et al. 1993; Carrasco-Gonzalez et al. 2010), the triple radio source in Serpens (Rodriguez-Kamenetzky et al. 2016), DG Tau (Ainsworth et al. 2014), and W3(02H) (Wilner et al. 1999) among others. The detection of synchrotron photons indicates the presence of relativistic electrons in the emitter. In all cases, the number density of non-thermal electrons required to explain the measured synchrotron fluxes ( mJy) in the GHz domain is larger than the average CR electron density which would result from the propagation of background CR electrons in molecular clouds, and therefore local acceleration of electrons is needed. SKA with its improved sensitivity should increase substantially the number of detected YSOs emitting non-thermal radio radiation. In particular, SKA-LOW detection of several sources will complement first YSOs detection by the GMRT (Ainsworth et al. 2014) and will help in constraining the modeling of the relativistic electron distribution (Padovani et al 2016).
Energetic particles can be accelerated up to relativistic energies from the thermal pool by diffusing back and forth internal and termination shocks in protostellar jets (e.g., Araudo et al. 2007; Bosch-Ramon et al. 2010; Padovani et al. 2016). The magnetic field and its perturbations play an important role in the Fermi acceleration process. The value of the magnetic field in equipartition with non-thermal particles and in the one-zone approximation is between 0.1 and 100 mG, depending on the distance of the synchrotron emitter to the central protostar. However, the spatial resolution of the current facilities in the GHz domain is not enough to develop an accurate model of the magnetic field distribution in the shock downstream region. In this concern, future observations with SKA-MID at sub-arcsecond resolution will allow us to identify the acceleration and cooling regions, and to go in depth on the microphysics of the jet plasma by studying the magnetic field amplification and damping downstream of the shock. SKA high resolution observations of non-thermal YSO jets will open a new window to study CR acceleration in low velocity shocks and high density plasmas.
References:
Ainsworth, R. E., et al., 2014, ApJ, 792, 18;
Anglada, G., et al., 1998, AJ, 116, 2953;
Araudo, A. T., et al., 2007, A&A, 476, 1289;
Bachiller, R., et al., 2001, A&A, 372, 899;
Beswick, R. J., et al., 2015, AASKA14, 70;
Bosch-Ramon, V., et al., 2010, A&A, 511, A8;
Bourke, T. L., et al., 1997, ApJ, 476, 7812;
Carrasco-Gonzalez, C., et al., 2010, AJ, 139, 2433;
Codella, C., et al., 2014, AASKA14, 123;
Dickinson, C., et al., 2014, AASKA14, 124;
Dionatos, O. & Güdel, M., 2017, A&A, 597, 64;
Frail, D. A., 2011, MmSAI, 82, 703;
Garay, G., et al., 2003, ApJ, 587, 739;
Güdel, M., 2002, ARA&A, 40, 217;
Gusdorf, A., et al., 2012, A&A, 542, L19;
Gusdorf, A., et al., 2015, A&A, 575, 98;
Hollenbach, D. J., 1997, IAU, 182, 181;
Hunter, T. R., et al., 2008, ApJ, 680, 1271;
Li, H. B., et al., 2014, PPV, 101;
Marti, J., et al., 1993, ApJ, 416, 208;
Matsumoto, T., et al., 2017, ApJ, 839, 69;
Oonk, R., et al., 2015, AASKA14, 139;
Padovani, P., et al., 2016, A&A, 590, 8;
Panoglou, D., et al., 2012, A&A, 538, 2;
Rodriguez-Kamenetzky, A., et al., 2016, ApJ, 818, 27;
Su, Y.-N., et al., 2009, ApJ, 704, L5;
Thompson, M., et al., 2015, AASKA14, 126;
Wilner, D. J., et al., 1999, ApJ, 513, 775;
Yvart, W., et al., 2016, A&A, 585, 74;
Zinnecker, H. & Yorke, H. W., 2007, ARAA, 45, 281
2.3.9 Supernova remnants
At the latest stages of supernova (SN) explosions, supernova remnants (SNRs) represent an important feedback form of stars on galaxies. Indeed, SNRs re-distribute large amounts of energy to the interstellar medium (ISM) in the form of shocks, energetic radiation and cosmic rays. They modify both the dust and gas properties and compositions and as such play an important role in the chemistry, and hence in the cycle of matter in galaxies. They also play a vital role in the energetic balance of galaxies. Additionally, the shocks they generate have the potential to trigger a second generation of star formation. Finally, SNRs trap cosmic rays (CRs) that have been accelerated at the earlier stages of the SN explosion. SNRs are hence ideal laboratories to address numerous questions at the crossroads between ISM astrophysics and high-energy astrophysics.
The first step towards a global understanding of SNRs consists of the identification and separation of the various shock components that propagate in relation with the SNR. Indeed, shocks in SNRs can be driven by the primary SN shock after its encounter with a molecular cloud, and by young stars (in the form of protostellar outflows) whose recent formation was triggered in the molecular cloud by either the SN shock wave or the stellar wind of the SNR’s progenitor. This is the case for instance in the G clump of the IC443 SNR (Xu et al. 2011). Separating these various shock structures is a first step preliminary to all other scientific objectives, and it can only be achieved through high-angular and high-spectral resolution observations of the region (see Louvet et al. 2016 for an example of such a separation in a dense filament). Thanks to its high angular resolution, SKA will play a role in this crucial first step.
In a second step, the local ISM must be characterised, especially its shocked components. The underlying questions and methodology are exactly similar to what is done in the context of shocks associated to YSOs jets and outflows (see Sect. 2.3.8): a shock model is first used to interpret sub-mm/IR observations (e.g., Anderl et al. 2014). Few shock tracers can be observed by SKA, contrary to maser emission that can be used to a posteriori validate this modelling (see Frail et al. 2011 and Gusdorf et al. 2012). Based on these additional constraints and on complementary observations of molecular and atomic species (e.g., van Dishoeck et al. 1993), further progress can be made in our understanding of SNR shocks. This question encompasses the gas-phase and dust processes (see Sect. 2.3.8 for details). Finally, SKA observations will directly enable us to measure the energy and momentum injected into the ISM at low frequencies through the observation of recombination lines with spectral resolution. Such observations could be used on the longer term to benchmark simulations of ISM evolution regulated by SN explosions (Hennebelle & Iffrig 2014). Additionally, the constraints placed on shock models will allow us to indirectly measure the momentum and energy injection at sub-mm to IR frequencies.
In relation with the topic of studying star formation potentially triggered by the passage of a SN shock, and beyond the separation between shock structures made possible by SKA, radio observations will make it possible to characterise ejection flares from protostars (Anglada et al. 1998) and their winds or even chromospheres for the more evolved ones (Güdel 2002). The subsequent evolutionary stage determination will help to understand the causality between the SN shock and the local star formation. Finally, on the subject of CR-related questions, discussed in other sections (below and in Sect. 2.3.8), it could be noted that the thorough assessment of the content of the ISM described here (magnetic field measurements included) will support the development and application of models of gamma-ray emission resulting from the interaction of CRs accelerated in the past stages of the SN explosion and trapped in its shock fronts, with the dense (shocked or not) medium (Gabici et al. 2009). SKA will thus also serve to study CR composition, acceleration, and propagation mechanisms.
Source identification
During the last two decades, the imaging atmospheric Cherenkov telescopes like H.E.S.S., MAGIC or VERITAS have discovered more than one hundred new gamma-ray sources of different types. However, in the case of H.E.S.S. a third of these new sources are still unidentified. Similarly, among the thousands of new sources detected by the gamma-ray LAT detector aboard Fermi space telescope, a third do not have a clear counterpart at any other wavelengths. The future at gamma-ray energies will be provided by the Cherenkov Telescope Array (CTA) which will start its Galactic plane survey in the early 2020’s. CTA will consist of a northern and a southern site providing an order of magnitude gain in sensitivity and allowing the detection of 20-70 SNRs among which 7-15 would be resolved with CTA (Renaud 2011). This means that a large fraction of the detected shell-type SNRs will not be identified as such based solely on their TeV morphology. In addition, although CTA will bring an order of magnitude in sensitivity, the spatial resolution will be of the order of 3 arcmin (r68%) creating source confusion in the plane. Surveys at other wavelengths will therefore be key to identify new SNRs. Historically most SNRs known in our Galaxy were discovered by radio surveys (Green 2009). The SKA1-LOW, with frequency range between 50 MHz and 350 MHz and a field of view of 30 deg2, hosts great potential to discover a large number of SNRs and will be of crucial importance to identify gamma-ray sources or to constrain their non-thermal morphology. With a field of view of only 0.5 deg2 but an excellent angular resolution of (with respect to for SKA1-LOW), the SKA1-MID will be ideal to detect and resolve young SNRs ( 1000 years) which are the best candidates for the acceleration of PeV protons.
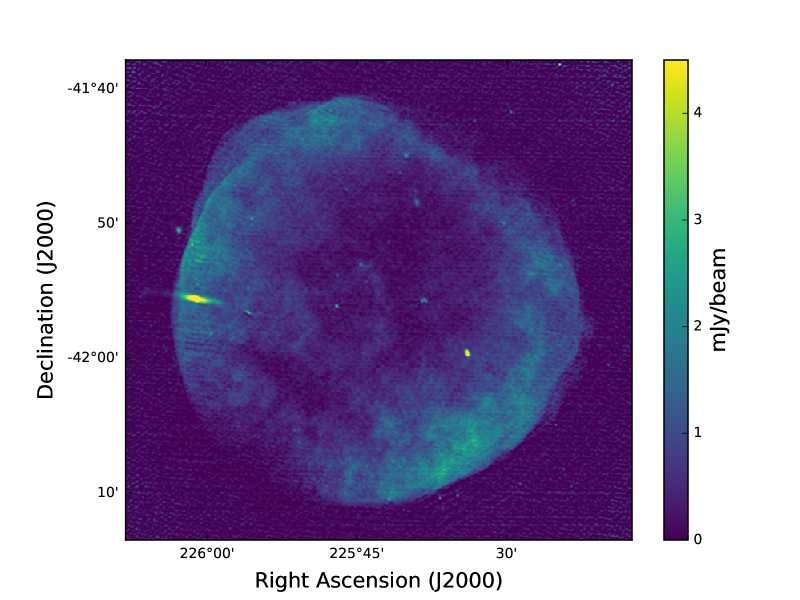
Cosmic ray acceleration physics
SNRs have been known to be sources of relativistic particles and non-thermal radiation since the beginning of the 50’s (Shklovskii 1953). Non-thermal radio emission results from synchrotron radiation of GeV electrons. Radio observations provide information about the remnant morphology, its magnetic field strength and orientation and particle acceleration in strong shock waves that pervade the ISM (Reynolds 2008). Recent X-ray arc-second angular resolution images of several historical SNRs by the American satellite Chandra show the presence of thin filaments with a typical thickness of a few percent of the SNR radius (Hwang et al. 2002). This, combined with the detection of SNRs at gamma rays, confirms that SNRs can accelerate energetic particles at least up to TeV energies (H.E.S.S. Collaboration 2011). The filament thickness implies that the magnetic field at the forward shock can reach strengths up to two orders of magnitude above mean interstellar values (Parizot et al. 2006). Magnetic field amplification seems to be a key process to explain the acceleration of hadrons up to PeV energies and the origin of cosmic rays (Bell 2004). Yet, the process of particle acceleration in strong SNR shock waves remains largely elusive.
SKA with its waveband coverage, its improved sensitivity and its angular resolution down to sub arc-second scales can bring important constraints on the process of particle acceleration in SNRs. In parallel to CTA, several X-ray facilities are expected to overlap with the science phase of SKA. This is likely for XMM-Newton and Chandra covering the 0.2 - 12 keV band as well as NuSTAR which operates in the 10 – 80 keV energy range, and finally Athena+, due for launch in 2028, with a superb sensitivity and spectral resolution in the 0.1 – 12 keV energy range. These missions will help to study the high energy TeV particles through their synchrotron emission while low frequency radio emission is linked to the GeV energy particles. High sensitivity observations at different wave bands combined with X-ray observations can be conducted to produce radio spectral maps of historical SNRs visible in the southern hemisphere like SN1006, RXJ 1713-3945 or Vela Jr. The full wavelength high sensitivity coverage from a few hundred MHz to X-rays can be used to test any particular spectral curvature related to the particle acceleration process. In parallel, it should be noted that the energy spectrum of secondary electrons produced via pp collisions starts to deviate from a pure power law below 1 GeV. This implies that the radio synchrotron emission from secondary electrons will start to diverge from a pure power-law at frequencies below 100 MHz for a magnetic field of 10 G (Aharonian et al. 2013). This should be detectable by SKA1-LOW thus allowing us to trace high energy protons in SNRs.
Finally, high-angular resolution observations can test the existence of radio filaments, the profile of radio synchrotron radiation behind the forward shock, and possibly the existence of a radio precursor associated with the streaming of low energy cosmic rays ahead the shock front.
Covering SNR spectrum over a wide wavelength range will provide a complete view of particles accelerated in SNR shocks allowing us to better understand this long standing CR origin issue.
References:
Aharonian, F. A., et al., 2013, arXiv:1301.4124;
H.E.S.S. Collaboration, 2011, A&A, 531, A81;
Anderl, S., et al., 2014, A&A, 569, 81;
Anglada, G., et al., 1998, AJ, 116, 2953;
Bell, A. R., 2004, MNRAS, 353, 550;
Frail, D. A., 2011, MmSAI, 82, 703;
Gabici, S., et al., 2009, MNRAS, 396, 1629;
Green, D. A., 2009, Bull. Astr. Soc. India, 37, 45;
Güdel, M., 2002, ARA&A, 40, 217;
Gusdorf, A., et al., 2012, A&A, 542, L19;
Hennebelle, P., & Iffrig, O., 2014, A&A, 570, 81;
Hwang, U., et al., 2002, ApJ, 581, 1101;
Louvet, F., et al., 2016, A&A, 595, 122;
Parizot, E., et al., 2006, A&A, 453, 387;
Renaud, M., 2011, MmSAI, 82, 726;
Reynolds, S. P., 2008, ARAA, 46, 89;
Reynoso, E. M., et al., 2013, AJ, 145, 104;
Shklovskii, I. S., 1953, Dokl.Akad.Naut. SSSR, 91, 475;
van Dishoeck, E. F., et al., 1993, A&A, 279, 541;
Xu, J.-L., et al., 2011, ApJ, 727, 81
2.3.10 Pulsar census and probe of the interstellar medium
The SKA will have a wide field-of-view, high sensitivity, multi-beaming and sub-arraying capabilities, and it will be equipped with advanced pulsar search backends. These design characteristics make this new radio telescope an ideal instrument to survey efficiently the whole sky accessible from the South African and Australian sites. In particular, SKA-MID will be the main tool for discovering distant pulsars in the Galactic plane, whereas SKA-LOW can both go deeper and survey faster at higher Galactic latitudes.
Future populations studies
The combined Milky Way surveys at multiple frequencies will increase the number of known pulsars by more than an order of magnitude, revealing both the young population (ages 103-107 years) strongly confined to the Galactic plane and the much older millisecond pulsars (ages of 108 yr) much more spread across the sky. Simulations show that one expects up to 9000 normal pulsars and 1500 millisecond recycled ones with the first step SKA1, while SKA2 will potentially find all of the Galactic radio-emitting pulsars in the SKA sky which are beaming in our direction (Bates et al. 2014; Keane et al. 2015). In terms of Galactic studies and stellar populations, SKA will offer a complete picture of the neutron star birth properties, of the interstellar matter (ionised gas) distribution and of the magnetic field structure, thanks to dispersion measures and Faraday rotation measures. Searches in the vicinity of the Galactic Centre should reveal the 1000 pulsars we infer to be closely orbiting Sgr A*, help constrain the mass and spin of the central object, and characterise its nature (massive Kerr black hole, boson star or black hole coupled with a scalar field, e.g. Vincent et al. 2016). Among the most exciting systems to be discovered, the SKA’s instantaneous high sensitivity will allow efficient search for highly relativistic binaries, i.e. pairs of neutron stars or neutron star - white dwarf systems orbiting each other in less than a couple of hours. If not the dreamed neutron star - black hole association, or a few other triple systems similar to PSRJ0337+1715 to test directly the strong equivalence principle, this population of close compact binaries will provide us with a bunch of unprecedented tests for gravity theories (see Sect. 2.6.2).
Targeted searches towards globular clusters will help fully characterise the old pulsar population and provide unique tools to probe the structure, gas content, magnetic field, and formation history of the clusters (Hessels et al. 2015). With their high stellar densities, globular clusters are also the place of exotic gravitational associations, thanks to the unique environment for stellar collisions and interactions. The variety of individual systems, in terms of masses and nature of the components, will help constrain the equation-of-state of neutron-rich matter at super-nuclear densities and to test gravitational theories, and it will also provide novel insights for understanding stellar evolution and accretion physics. The timing of millisecond pulsars next to the cluster core can also reveal and constrain the presence of an intermediate mass black hole (Perera et al. 2017). Important results will also come from pulsar supernova remnant (SNR) and pulsar wind nebulae (PWN) associations, in particular thanks to the synergy with high energy astrophysics. SKA should measure the radio morphology, spectrum, and polarization properties of up to 100 PWNe (10 times more than today) and increase the number of eclipsing binary pulsars from 50 to 300 (Gelfand et al. 2015). Such samples will allow us in particular to determine how a neutron star’s spin-down luminosity, age, and environment affect the evolution of its PWN. Finally, SKA will be the first telescope to probe efficiently the bright pulsar population in neighbouring galaxies and allow comparison in terms of average metallicity and environment.
Probing the interstellar medium using pulsar timing
As the pulsar radio emission propagates through the interstellar medium (ISM), it is affected and modified by the ISM and its inhomogeneities. How severely the signal is affected mostly depends on the observing frequency and can usually be described by a power-law. The Dispersion Measure (DM) informs on the free electron content along each pulsar line of sight, its long term variation and the observed scintillation time and frequency scales reflect directly the characteristic scale of ISM turbulence and plasma cells. At low frequencies, it is also possible to measure the small rotation measure (RM) values of the nearby population of pulsars. This provides an unprecedented tool to study the local magnetic field structure (Stappers et al. 2011). SKA, with its broad frequency coverage (up to 9 octaves!) and its high sensitivity at low frequencies where these effects are the most pronounced, will be a fantastic tool to study the ISM. The French pathfinder NenuFAR (10-80MHz), associated with LOFAR-HBA (110-250 MHz) and the Nançay Radio Telescope (NRT;1.0-3.5GHz) will allow us to do the spadework for this program.
On going observational programs and collaborations in France
The MODE annual workshop and collaboration has been the place of fruitful discussions between French theoreticians and observers, about neutron stars and their environment. It regularly gathers scientists studying pulsar multi-wavelength emission, neutron star interiors, their magnetospheres and wind properties, and their associations with PWNe and SNRs. Those people (at e.g. CENBG, IRAP, LUPM) are all very interested in the SKA outcome in terms of population statistics. The Nançay-Orléans group has a long term experience in pulsar timing and pulsar search with NRT and LOFAR. Two surveys of the Galactic plane have been made so far with the NRT, at the end of the 90’s with the old receiver and currently with the powerful 512 MHz bandwidth NUPPI backend. Some targeted searches in unidentified Fermi sources were also made and led to the discovery of a few objects. This group participates in the LOTAAS survey with LOFAR and leads the associated key science project with NenuFAR, to investigate the low frequency end of pulsar emission spectrum, as a pilot project for SKA. In particular, the aim here is to characterise the spectral turn-off observed below 100 MHz, understand the frequency evolution of the emission beam structure, and interpret these results in terms of radio emission processes. Finally, the same people are involved in the TRAPUM project, which is one of the key programs of MeerKAT, the South African precursor of SKA-MID.
The French pulsar community has played a key role in the synergies between radio and gamma observations, with a large accompanying program of Fermi-LAT observations started already in mid-2006, before the satellite launch. This project has been extremely fruitful, with tens of common publications and 150 pulsars detected at high energies thanks to radio ephemerides. Equivalent programs at smaller scales were led in the same period with INTEGRAL, XMM-Newton, and HESS-I/II. The expected prolongation of Fermi’s operation and the deployment of CTA will perpetuate this combined effort on the long term. Similarly, combined studies of timing radio observations with next-generation X-ray telescopes such as eROSITA and ATHENA+ will help constrain the super-dense matter equation-of-state.
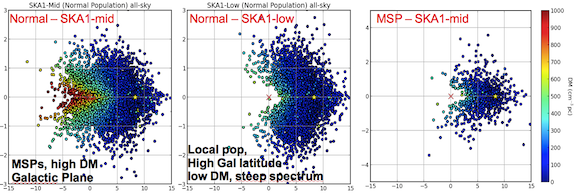
References:
Bates, S. D., et al., 2014, MNRAS, 439, 2893;
Gelfand, J., et al., 2015, AASKA14, 46;
Hessels, J., et al., 2015, AASKA14, 47;
Keane, E., et al., 2015, AASKA14, 40;
Perera, B. B. P., et al., 2017, MNRAS, 468, 2114;
Stappers, B. W., et al., 2011, A&A, 53, A80;
Janssen, G., et al., 2015, SKA KSWG workshop, Stokholm;
Vincent, F. H., et al., 2016, PhysRevD, 94, 084045
2.3.11 Distance determination
Despite the new era of high precision astrometry and proper motions in the Gaia era, SKA will provide with its high sensitivity the capability to obtain microarcsec astrometric precision for astronomical objects such as maser stars, pulsars in the Milky Way as well as in the local group universe. Combining the SKA with VLBI arrays, SKA-VLBI, will allow us to measure parallaxes as well as the trajectories of the stars in the Galactic plane very precisely, specifically in molecular clouds where interstellar extinctions hampers Gaia to deliver precise parallaxes. An area of high interest will be clearly the inner kpc of the Milky Way, the so-called “Galactic Bulge”, a major component in our galaxy together with the Central Molecular Zone (CMZ) in the innermost 200 pc region of the Milky Way, which is a giant molecular cloud complex and contains about 10% of the molecular gas of our Galaxy. The CMZ shows signs of active star formation and can provide us with a template to compare with the quiescent galactic nuclei in the present-day Universe. Precise distances and proper motions would be essential to understand the origin of this high-complex zone as well as the interaction with the supermassive black hole and constraining the galactic potential.
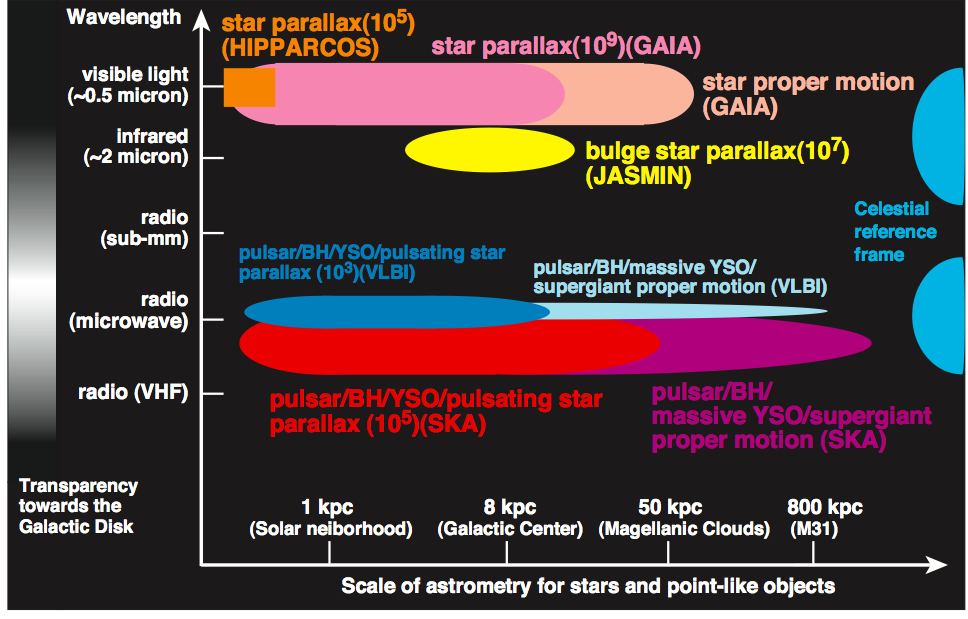
SKA and VLBI synergy
Due to its extremely high angular resolution and sensitivity SKA-VLBI will be able to measure parallaxes and proper motions to better than 10 , allowing us to establish a direct comparison with the the Gaia (ESA) mission (see also Ros et al. 2015), and favouring a direct comparison with Gaia and a cross-correlation among both reference frames (International Celestial Reference Frame (ICRF) and Gaia). SKA-VLBI will be very complementary to Gaia as it traces stars in regions of high interstellar extinction (e.g. massive star forming regions, Galactic Centre and the CMZ, dark molecular clouds, etc..) where Gaia will not be able to penetrate. In addition, stellar objects with strong radio emission such as supernova remnants, pulsars and late-type stars such as OH/IR stars can be easily monitored by SKA-VLBI. According to Fomalont & Reid (2004), all stars in our galaxy with flux densities higher than 0.5 mJy can be detected by SKA-VLBI spaced every six months over a two-year period. Proper motions of objects in the Milky Way can be obtained within a period of a few years. A typical example would be the proper motion of around the Galactic Centre and its supermassive black hole. Measuring the direct parallax of the Galactic Centre would give us for the first time the fundamental parameter (Distance to the Galactic Centre) to an accuracy of 1% which will have a big impact in galactic astronomy. Similarly, precise distances to stellar clusters can be measured, especially for low-mass stars, which will contribute to extending the distance determinations of stellar clusters. Masses of pre-main sequence objects (PMS) are calibrated from stellar mass-luminosity relations (e.g. Close et al. 2005) where SKA astrometry will clearly refine measurements of the distance and the orbital motions for several hundreds of stars (Guirado et al. 2015). This will lead to the derivation of accurate masses and ages of the stars, which will give strong constraints to stellar evolutionary models (Baraffe et al. 2009).
The Galactic Centre and bulge : Synergy between radio and near-infrared astrometry
While the ESA Gaia mission will get precise parallaxes for stars in the different Milky Way populations, the inner kpc of our Milky way will be not covered due the high interstellar extinction. The Japanese “JASMINE” (Japan Astrometry Satellite Mission for Infrared Exploration, planned for 2020) mission will measure positions and motions of stars around the nuclear bulge in the near-infrared. There will be common targets between JASMINE and SKA, which are mainly circumstellar OH maser sources, and their astrometry will be cross- checked. For stars in the innermost part of the nuclear disk, where it is difficult for JASMINE to access due to severe interstellar extinction, the SKA astrometry will compensate the sample of those stars. One of the major questions to be addressed is the formation mechanism of the super massive black hole (SMBH) in the centre of our galaxy. Was the SMBH formed by gas accretion or by a merger process? What is the link between the SMBH, the nuclear central star cluster, and the nuclear disk (Genzel et al. 2010; Fritz et al. 2014) ? The answer to these questions is crucial and will give us a better estimate of the galactic potential in the central region of the Milky Way. Precise stellar orbits with JASMINE and SKA will allow us to better constrain the gravitational potential as well as the physical processes of the SMBH growth.
Maser stars
In the Milky Way, maser emission is observed in young stellar objects and late type stars. The strongest maser emission comes
from SiO, OH and . OH/IR stars show show strong maser emission at 1612 MHz with a typical double peak feature originating from the front and backside of the
circumstellar shell (Sevenster et al. 2001). Due to the variability of the maser, only a fraction of these maser stars has been detected. The number of detected OH/IR stars in our Galaxy
depends on the distribution of the mass-loss rates of the AGB stars. A complete detection of the OH/IR star population give us contraints on the total integrated
mass-loss rates in our Galaxy, a crucial parameter for chemical evolution models (Matteucci 2014). The kinematics of the maser stars allow us to study stellar kinematics in various galactic
components (thin disc, thick disc, bulge, halo).
We expect to find weak maser emission in planetary nebulae or post-AGB stars where the maser emission is probably related to shock excitation in the interface between a fast post-AGB wind and a slow AGB star
wind, which produces low-luminosity maser emission (Etoka et al. 2015). There, SKA will clearly open a new window as it is expected
to find many maser in stars.
References:
Baraffe, I., et al., 2009, ApJ, 702, 27;
Close, L.M., et al., 2005, Nature, 433, 286;
Etoka S., et al., 2015, arXiv:1501.06153;
Fomalont E. & Reid M., 2004, New Astronomy Reviews, 48, 1473;
Fritz T.K., et al., ApJ, 821, 42;
Genzel, R., et al., 2010, Reviews of Modern Physics, 82, 3121;
Guirado, J.C., et al., 2015, Spanish SKA White Book;
Imai, H., et al., 2017, Japan SKA Consortium;
Matteucci, F., 2014, “Chemical Evolution of the Milky Way and Its Satellites”, in The Origin of the Galaxy and Local Group, Saas-Fee Advanced Course, Volume 37. ISBN 978-3-642-41719-1. Springer-Verlag Berlin Heidelberg, 2014, p. 145;
Ros, E., et al., 2015, Spanish SKA White Book;
Sevenster, M.N., et al., 2001, A&A, 366, 481
2.4 Planets, Sun, Stars and Civilizations
Contributors of this section in alphabetic order:
E. Blanc [CEA Commissariat à l’Energie Atomique DAM, Arpajon Cedex, France], C. Briand [LESIA, Observatoire de Paris, PSL Research University, CNRS, Sorbonne Universités, UPMC Université Paris 06, Université Paris Diderot, Meudon, France], S. Celestin [LPC2E, CNRS, Université d’Orléans, Orleans, France], R. Courtin [LESIA, Observatoire de Paris, PSL Research University, CNRS, Sorbonne Universités, UPMC Université Paris 06, Université Paris Diderot, Meudon, France], J. F. Donati [IRAP, Université de Toulouse, CNRS, UPS, CNES, Toulouse, France], T. Farges [CEA Commissariat à l’Energie Atomique DAM, Arpajon Cedex, France], J. Girard [IRFU, CEA, Université Paris-Saclay, Gif-sur-Yvette, France;Université Paris-Diderot, AIM, Sorbonne Paris Cité, CEA, CNRS, Gif-sur-Yvette, France], J. M. Griessmeier [LPC2E, CNRS, Université d’Orléans, Orleans, France;Station de Radioastronomie de Nançay, Observatoire de Paris, PSL Research University, CNRS, Univ. Orléans, Nançay, France], M. Janvier [Institut d’Astrophysique Spatiale, CNRS, UMR 8617, Université Paris-Sud, Université Paris-Saclay, Orsay, France], E. Josselin [Laboratoire Univers et Particules de Montpellier, Université de Montpellier, CNRS/IN2P3, Montpellier, France;IRAP, Université de Toulouse, CNRS, UPS, CNES, Toulouse, France], L. Lamy [LESIA, Observatoire de Paris, PSL Research University, CNRS, Sorbonne Universités, UPMC Université Paris 06, Université Paris Diderot, Meudon, France], T. Le Bertre [LERMA, Observatoire de Paris, École normale supérieure, PSL Research University, CNRS, Sorbonne Universités, UPMC Univ. Paris 06, Paris, France], S. Masson [LESIA, Observatoire de Paris, PSL Research University, CNRS, Sorbonne Universités, UPMC Université Paris 06, Université Paris Diderot, Meudon, France;Station de Radioastronomie de Nançay, Observatoire de Paris, PSL Research University, CNRS, Univ. Orléans, Nançay, France], M. Pandey-Pommier [Université Lyon, Université Lyon1, Ens de Lyon, CNRS, Centre de Recherche Astrophysique de Lyon UMR5574, France], P. Petit [IRAP, Université de Toulouse, CNRS, UPS, CNES, Toulouse, France], N. Vilmer [LESIA, Observatoire de Paris, PSL Research University, CNRS, Sorbonne Universités, UPMC Université Paris 06, Université Paris Diderot, Meudon, France], P. Zarka [LESIA, Observatoire de Paris, PSL Research University, CNRS, Sorbonne Universités, UPMC Université Paris 06, Université Paris Diderot, Meudon, France;Station de Radioastronomie de Nançay, Observatoire de Paris, PSL Research University, CNRS, Univ. Orléans, Nançay, France]
2.4.1 Solar system planets
The following sections demonstrate the interest of survey observations by SKA1-LOW of solar system planets, for which strong interest and expertise exist in the French community.
2.4.1.1 Jupiter’s magnetosphere and radio emissions
Jupiter is the solar system planet with the strongest magnetic field (up to 14 Gauss at the surface, 10 times larger than for any other planet. Its giant magnetosphere, than extends toward the Sun up to 100 Jovian radii (7 million km) from the planet, is a very effective particle accelerator. Magnetospheric plasma fed by the moon Io, Jupiter’s ionosphere, and the solar wind, is accelerated to several keV energies in the auroral (high-latitude) regions, and up to several MeV energies in the radiation belts that are trapped along magnetic field lines with apex up to 4–6 Jovian radii above the cloud tops (Bagenal et al. 2014). Auroral keV electrons produce extremely intense cyclotron emissions at frequencies up to 40 MHz (Zarka 1998), that are below the frequency range of SKA1-LOW. But MeV radiation belt electrons produce intense synchrotron radiation, the broad spectrum of which covers frequencies from 100 MHz to 10 GHz. The emission has strong linear polarisation, its flux peaks at 6.5 Jy between 100 MHz and 1 GHz and it decreases towards higher frequencies until merging into the thermal emission of the planetary disk above 10 GHz (de Pater et al. 2003).
The belts being optically thin to synchrotron emission, but not homogeneous, their projection on the sky creates two asymmetric and variable “ears” surrounding the planetary disk (Fig. 37). The extent, temporal and spectral variations of the belts contains the signatures of the physical processes (plasma sources, acceleration, sinks) that shape them. The Salammbô-3D code incorporate all these physical processes as well as radiative modeling of the belt emission (Sicard & Bourdarie 2004, Nenon et al. 2017). LOFAR recently allowed us to obtain the first resolved image of the emission below 300 MHz (Girard et al. 2016a), taking into account the rapid source motion and wobbling, as well as direction-dependent calibration (Smirnov & Tasse 2015). A 7-hour integrated image at 150 MHz demonstrates the broadest extent of electron belts of lower energy (emitting lower frequency synchrotron emission) as compared to higher energy electron belts observed with the VLA. Hourly sub-images compare well qualitatively with corresponding Salammbô-3D simulations. By contrast, the spectral variations and turnover are difficult to constrain by non-simultaneous observations in various spectral ranges. But we found a signal down to 50 MHz with an overall shape compatible with observations at higher frequencies.
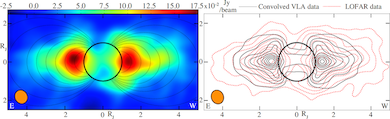
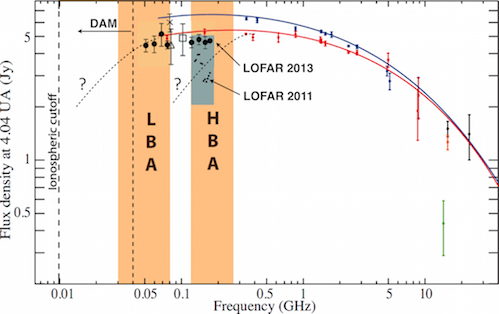
SKA, covering the entire range of Jupiter’s synchrotron emission with resolved images, will bring unique constraints to the distribution of energetic electrons in Jupiter’s inner magnetosphere in all energy ranges (100s of keV to 10 MeV) simultaneously. It will also allow us to derive a reference instantaneous spectrum of the emission. It could also provide tomographic constraints on the topology of the near-planet low-latitude magnetic field, but following measurements by Juno we should already have a very accurate Jovian magnetic field model that will be a strong basis for the study of the belts structure and dynamics. Provided that the scheduling of survey observations by SKA in the ecliptic plane includes pointing at Jupiter at intervals of a few days, we will also derive the time variability of the belt processes at all timescales longer than this recurrence interval.
References:
Bagenal, F., et al., 2014, Space Sci. Rev., doi:10.1007/s11214-014-0036-8;
de Pater, I., et al., 2003, Icarus, 163, 434;
Girard, J., et al., 2016a, A&A, A3, 587;
Girard, J., et al., 2016b, SF2A, http://sf2a.eu/semaine-sf2a/2016/posterpdfs/237_186_46.pdf;
Nenon, Q., et al., 2017, JGR, 122, 5158;
Sicard, A. & Bourdarie, S., 2004, JGR, 109, 2216;
Smirnov, O. M. & Tasse, C., 2015, MNRAS, 449, 2668;
Zarka, P., 1998, JGR, 103, 20159
2.4.1.2 Planetary atmospheres
SKA will be a powerful instrument for studying planetary atmospheres thanks to its high sensitivity, angular resolution, spectral flexibility and resolution, that will help not only to detect faint thermal emissions down to the micro-Jansky level, but also resolve their morphology. These capabilities will enable significant advances in our understanding of the lower atmospheres of the terrestrial planets, mostly in the case of Venus. They will also further our knowledge of the deep atmospheres of the outer planets.
On Venus, the total emission is the sum of the surface and atmospheric contributions. The atmospheric opacity in the microwave range is mainly determined by the abundance of the sulfur compounds, SO2 and H2SO4. While the distribution of these compounds is fairly well understood, recent JVLA observations at 250 and 500 MHz (Butler 2014) have shown that there are still unknowns in what influences the long wavelength spectrum. The improved sensitivity of SKA in that domain will help resolve this issue.
The other area of interest concerns the deep atmospheres of the four outer planets. Their bulk composition is still poorly constrained in terms of the main cosmogonical elements, especially C, N, and O (Fletcher et al. 2009). Our incomplete knowledge is due to the difficulty to probe the atmospheres of these planets below the condensation levels of the volatiles containing N and O (NH3, NH4SH, H2O) which are located much below the levels probed by infrared and microwave instruments (Atreya et al. 1999). As a consequence, the interior models of these planets are also poorly constrained because of the uncertainty in the abundance of heavy elements, which is dominated by that of H2O (Nettelmann et al. 2013). As the atmospheric temperature increases with depth and the optical depth decreases with decreasing frequency, the thermal emission from the outer planets increases towards long wavelengths.
At Jupiter, the strong magnetospheric synchrotron emission (see 4.1.1) dominates below 1 GHz, preventing to probe the deep atmosphere (except from an observer inside the radiation belts like the Juno spacecraft). But monitoring Jupiter’s thermal emission above 1 GHz with sub-arcsecond resolution will reveal fine details of the spatial distribution of NH3 and deep cloud structure, increasing our understanding of tropospheric dynamics.
At Saturn, no significant magnetospheric emission is expected because of electrons absorption by the rings. Observations at 428 MHz with the Arecibo radiotelescope permitted Briggs & Sackett (1989) to constrain the NH3 mole fraction within a factor of 2, but they were only marginally sensitive to the abundance of H2O. Recent measurements with the Giant Meterwave Radio Telescope in India, at 150, 235, and 610 MHz, were compared with models of Saturn’s thermal radiation assuming different water vapour concentrations (Courtin et al. 2015), favouring water-rich models with an O/H ratio of at least 15 (Fig. 38, left panel). Contemporary LOFAR observations were heavily contaminated by extragalactic sources so that the thermal emission below 200 MHz remains undetected so far. SKA measurements will bring decisive constraints in the 100-600 MHz range, where Saturn’s predicted thermal spectrum strongly depends on the H2O abundance. At 240 MHz, Saturn’s thermal emission mostly originates from pressure levels between 20 and 400 bar, well below the H2O-NH3 condensation cloud, and is characterised by a brightness temperature of 490-800 K depending on the assumed H2O concentration (0.2–10 times the value estimated by Visscher & Fegley (2005), i.e. 0.7–34 times the O/H solar ratio of Lodders (2003)). Gas opacity decreases with decreasing frequency, so that higher brightness temperatures (550-1000 K) are expected at 180 MHz, corresponding to emission from around the 1 kbar level. The frequency range 180-240 MHz is most adapted to measuring the H2O abundance since the spectrum in this range is primarily influenced by that quantity. At lower frequencies, we will probe the weakly ionised region of the atmosphere, never explored before and whose theoretical modeling is more uncertain (a brightness temperatures of 850-1650 K 20% is predicted at 110 MHz). SKA observations between 150 and 600 MHz should reach a signal-to-noise ratio between 300 and 2500 with a 12 MHz bandwidth and 1 hour integration time, providing the first definitive test of Saturn’s deep atmospheric abundance of water, and a first glimpse on the deeper weakly ionised layers. The H2O abundance in the deep atmosphere will in turn allow us to constrain the O/H ratio relative to the solar abundance, which has important cosmogonical implications. It also strongly influences Saturn’s J4 moment of inertia, which characterises the distribution of mass inside Saturn, with implications for its internal structure, figure, and rotation.
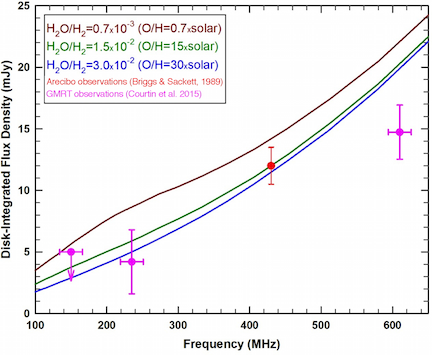
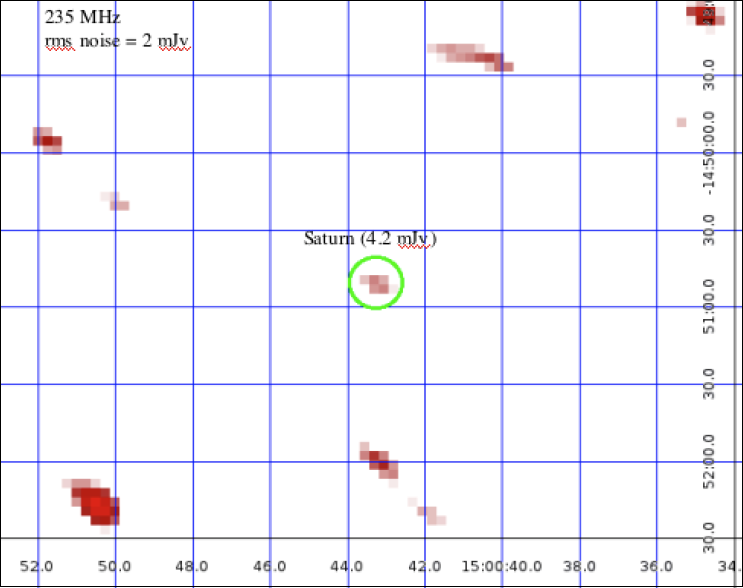
Due to its smaller apparent diameter (3.7” instead of 17” for Saturn), Uranus’ thermal spectrum is expected to be a few percent of that of Saturn in the same frequency range, assuming similar brightness temperatures. Hence, flux densities of about 0.2–0.6 mJy are predicted, that are within the reach of SKA with a theoretical SNR of 15–100 between 150 and 600 MHz (with 12 MHz bandwidth 1 hour integration). Neptune, with flux densities one order of magnitude lower than Uranus, is not a realistic target for SKA.
References:
Atreya, S.K., et al., 1999, Planet. Space Sci., 47, 1243;
Briggs, F.H. & Sackett, P.D., 1989, Icarus, 80, 77;
Butler, B., 2014, AAS-DPS meeting #46, id.416.04;
Courtin, R., et al., 2015, SF2A proceedings, S. Boissier et al.eds., Paris, France;
Fletcher, L.N., et al., , 2009, Icarus, 199, 351;
Lodders, K., 2003, ApJ, 591, 1220;
Nettelmann, N., et al., 2013, Icarus, 225, 548;
Visscher, C. & Fegley Jr., B., 2005, ApJ, 623, 1221
2.4.1.3 Planetary lightning
Lightning is a transient, high-current electrostatic discharge resulting from macroscopic electric charge separation (by convection and gravitation combined), following small-scale particle electrification (via collisions and charge transfer). A large-scale electric field builds up, which may eventually lead to breakdown and ionise the ambient medium, causing a lightning stroke. A lightning discharge consists of many consecutive strokes of a few s duration and lasts typically 1-100 ms. It may have an important role in the atmospheric chemistry (production of non-equilibrium trace organic constituents potentially important for biological processes). Electromagnetic signatures include optical, VLF and LF radio emissions. The radio emission generated by lightning is broadband in nature. For example, the spectrum of terrestrial lightning peaks at tens of kHz, but extends to the VHF range (30-300 MHz) and above. Satellite observations show that the lightning phenomenon also takes place on other solar system planets (Zarka et al. 2004, and references therein). First ground-based detection occurred recently, limited by the low flux density of the emission. Its sensitivity and the low emission frequency (typically 100 MHz) make SKA1-LOW a promising instrument with potential for significant discoveries in this field, for terrestrial as well as giant planets of the Solar system.
Existence of lightning on Venus remains controversial (e.g. Zarka et al. 2008). Venus lightning, if it exists, is either extremely rare (1 flash/hour, with long intervals of atmospheric electrical inactivity), very weak (102-3 times weaker than terrestrial lightning), or restricted to low frequencies (e.g. slow strokes with a very steep high frequency spectrum) which are unable to cross Venus’ ionosphere. SKA will be able to probe the intensity and occurrence rate of Venus lightning. On Mars, despite a thin atmosphere, atmospheric electric discharges can happen in large scale dust storms or “dust devils” (localised dust storms) which are thought to be able to generate substantial charge via triboelectric processes, i.e. contact electrification (Farrell et al. 1999). Observations were attempted, but reports on detection remain controversial (Ruf et al. 2009, Anderson et al. 2012). The radio flux is expected to increase with frequency, so that SKA should be able to either detect this emission, or prove that it does not exist.
At Jupiter, no HF radio emission from lightning was detected despite the observation of optical lighting flashes. SKA1-LOW’s sensitivity and resolution may allow us to detect rare intense events just above its LF limit of 50 MHz. On Saturn, radio emission caused by lightning has been observed from satellites as well as using ground-based radio telescopes such as UTR-2 (Zakharenko et al. 2012, Konovalenko et al. 2013), WSRT, and during test observations with LOFAR (Griemeier et al. 2010, 2011). The flux density of Saturn’s lightning detected at Earth is up to 100–1000 Jy (Zarka et al. 2004). SKA will provide the sensitivity permitting to monitor lightning from Saturn, addressing questions such as the discharge timescales, spectral profile, and its energy budget, the electrification processes compared to Earth’s, the breakdown electric field (which depends on atmospheric pressure, composition and electron density), atmospheric dynamics and cloud structure, and geographical and seasonal variations. In addition, high resolution imaging will give access to spatial information. Similarly to Saturn’s case, lightning-generated radio emission from Uranus was detected by Voyager 2 (Zarka and Pedersen 1986), with a corresponding flux density of 0.4–40 Jy at Earth. Uranus’ lightning is thus detectable with the SKA. At Neptune, only 4 weak events were detected during the Voyager 2 fly-by (Kaiser et al. 1991), too rare and weak to be an interesting target for SKA. However, occasional monitoring has the potential to discover Neptune’s lightning if periods of strong activity occur (or to set upper limits on the emission duty cycle).
No lightning from exoplanets is expected to be detectable, in spite of some recent fanciful claims that do not need to be advertised here.
References:
Anderson, M.M., et al., 2012, ApJ, 744, 15;
Farrell, W.M., et al., 1999, GRL, 26, 2601;
Griemeier, J.-M., et al., 2010, ISKAF2010, PoS, 022, http://pos.sissa.it/cgi-bin/reader/conf.cgi?confid=112;
Griemeier, J.-M., et al., 2011, in PRE VII, H.O. Rucker et al.eds., Austrian Acad. Sci. Press, Vienna, 145;
Kaiser, M.L., et al., 1991, JGR 96, 19043;
Konovalenko, A.A., et al., 2013, Icarus 224, 4;
Ruf, C., et al., 2009, GRL, 36, L13202;
Zakharenko, V., et al., 2012, Planet. Space Sci., 61, 53;
Zarka, P., et al., 2004, Planet. Space Sci., 52, 1435;
Zarka, P., et al., 2008, Space Sci. Rev., 137, 257;
Zarka, P. & Pedersen, B.M., 1986, Nature, 323, 605
2.4.1.4 Electrical activity in Earth’s atmosphere
Earth’s thunderstorm activity consists of 45 flashes per second (Christian and al., 2003). 75% of the discharges are intra-cloud, whereas 25% are cloud-to-ground discharges. Lightning activity is inhomogeneously distributed in space and time: 90% occurs over continents, mainly in the tropical belt, whereas 10% occurs above the oceans (Fig. 39, left). The activity takes place mainly in the summer and fall. In the 1990’s, it was discovered that energetic phenomena occur above storm clouds: transient luminous events (TLE) (e.g. Pasko et al. 2012) and Terrestrial Gamma-ray Flashes (TGF) (Fishman et al. 1994) (Fig. 39, right). SKA1-LOW may bring an original contribution to the understanding of several aspects of atmospheric electricity:
-
•
start of the lightning discharge: Rison et al. (2016) showed that specific discharges, the so-called Narrow Bipolar Pulses, occur inside cumulonimbus at the very beginning of the lightning discharge process. These NBP are very energetic and radiate in the HF - VHF range (1 - 100 MHz). Measurements below 100 MHz will strongly contribute to the understanding of these phenomena. More generally, the spectral slope of lightning radio emission is not well characterised above 10 MHz;
-
•
a new category of TLE has been observed at the top of tropical clouds from the International Space Station (Chanrion et al. 2017). They are reminiscent of blue jets, which remain poorly known because not easily accessible. These topside discharges, like the NEB, probably produce HF - VHF radiation that can be detected with SKA. Their quantitative study will improve our understanding of the formation of NOx components involved in the assessment of climate warming;
-
•
production of TGF requires the presence of electric fields high enough to accelerate electrons to relativistic energies. These electric fields are produced in intra-cloud discharges, and they accelerate secondary electron/positron beams that escape into space, and may produce radio and visible signals detectable from ground and space (Xu et al. 2017). The study of the radio signal with SKA will constrain the production mechanisms of TGF.
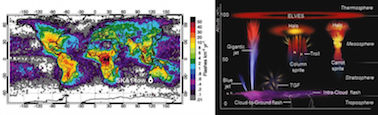
Pioneering radio imaging measurements of lightning has been conducted with the LOFAR in order to locate electric discharges in 3D (Scholten et al. 2017). Additional location information will be brought by facilities such as the Weather Zone Total Lightning detection Network in Australia, as well as satellite observations from geostationary orbit. Several space experiments dedicated to the study of lightning, TLE, and TGF are (soon to be) launched: ISS–LIS (3/2017) and ASIM (2018) on board the ISS, and the satellite TARANIS (2019). Having the possibility of Target of opportunity Observations on short notice and taking care of not suppressing lightning radio signals (brief, broadband) in SKA1-LOW data will be important assets.
References:
Blanc, E. & Farges, T., 2012, PLS, 416, 48;
Chanrion, O., et al., 2017, GRL, 44, 496;
Christian, H.J., et al., 2003, JGR, 108(D1), 4005;
Fishman, G.J., et al., 1994, Science. 264, 1313;
Pasko, V.P.,, et al., 2012, Space Sci. Rev., 168, 475;
Rison, W., et al., 2016, Nature Comm., 7, 10721;
Scholten O., et al., 2017, EPJ Web of Conf. 135, 03003, doi:10.1051/epjconf/201713503003;
Xu, W., et al., 2017, GRL, 44, 2571
2.4.1.5 Ionospheric physics & Meteor showers
The calibration of low frequency radio data (below 300 MHz) acquired by new generation radio interferometers like MWA, LOFAR and SKA imposes severe challenges due to ionospheric propagation combined with their large field of view (Fig. 40, left). The ionosphere is inhomogeneous in time and space (Davies 1990). The free electron column density along the line of sight also referred to as total electron content (TEC) and its organised (waves) and stochastic fluctuations cause dispersion, propagation delays, Faraday rotation, as well as distortion and phase shifts in the radio signal from astronomical sources. The resulting time- and direction-dependent phase and amplitude calibration errors may introduce source displacement (Fig. 40, centre) and deformation, false flux variability, and add spurious faint sources in the image or smear existing ones leading to their disappearance. The effect of the ionosphere is stronger at low frequencies, the phase shift being inversely proportional to the wavelength. These effects must be corrected in the imaging process. Algorithms have been developed to solve and correct for ionospheric phase errors from a pre-defined sky model, from SPAM (Intema et al. 2009), that produces a model of the ionospheric phase screen, to the fully time- and direction-dependent KillMS/DDfacet pipeline developed in Paris Observatory (Smirnov & Tasse 2015). Besides drastically improving the image quality, these algorithms allow one to derive maps of TEC fluctuations (Fig. 40, right) and consequently study the ionosphere itself (Herne et al. 2013, Loi et al. 2016). These studies will be a permanent side product of SKA1-LOW observations.
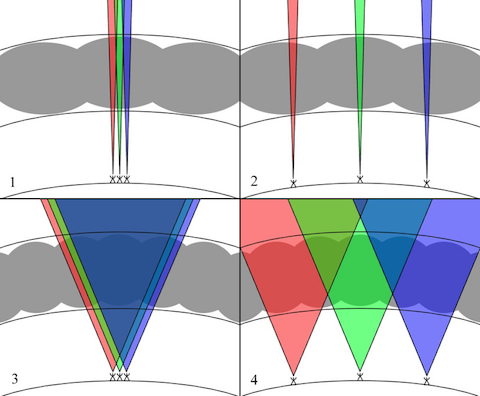
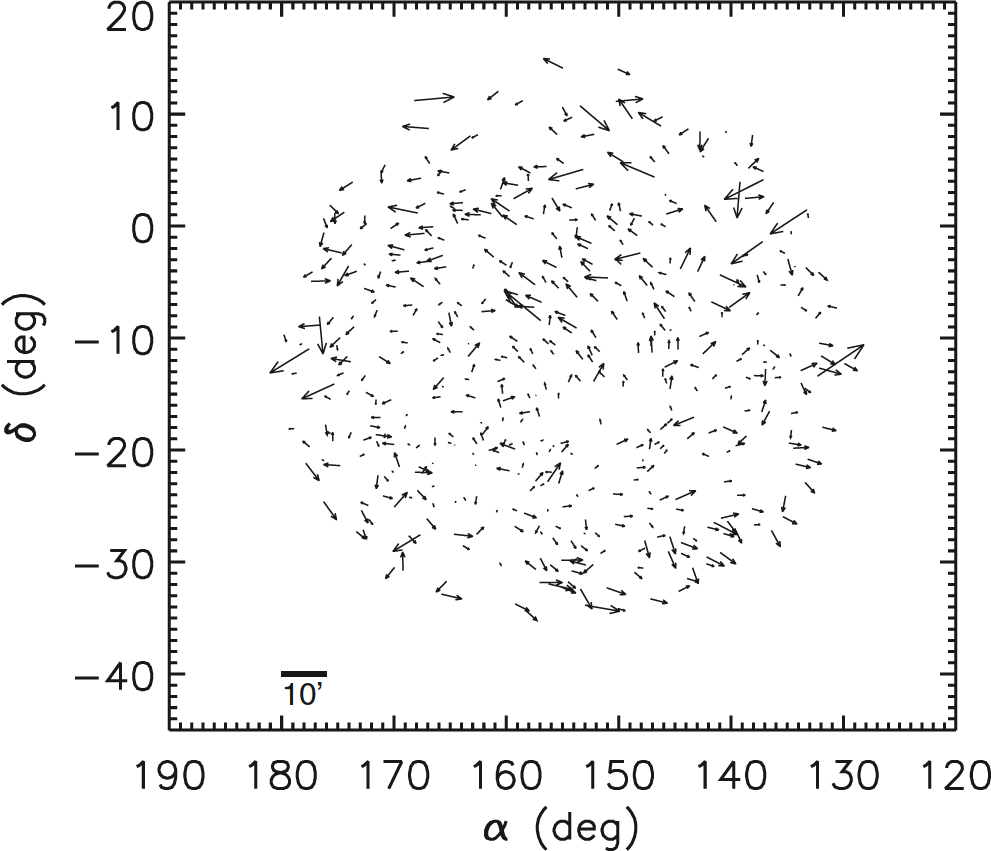
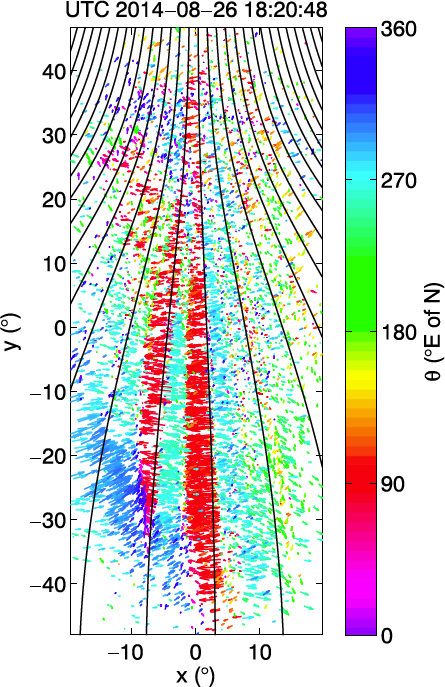
Meteoroids of various sizes (single objects, dust clusters or asteroid trails) frequently penetrate Earth’s atmosphere at tens of km/s. Friction with air molecules produces ablation and ionization, forming a plasma cloud that reflects radio waves. Signals from ionospheric radars, AM/FM/TV broadcast and other narrowband transmitters reflect on these clouds. High time–frequency observations ( sec kHz) within narrow frequency bands (a few kHz) around transmitters’ frequencies of reflected echoes allow to track the plasma cloud dynamics along the meteor entry path up to several seconds after full ablation. Estimation of the location and motion of the meteor and its trail may allow to estimate shower paths and strengths (densities of meteors in showers), trail reflectivity, and to classify automatically meteors by “radar signature” analysis (Azarian & Vaubaillon 2014). Maximum reflectivity should occur at the LF end of SKA1-LOW (peak around 50 MHz). Even in the super-clean environment of SKA1-LOW, narrowband RFI sources will exist (Expert Panel Report on RFI 2011) than will constitute illuminators of opportunity. SKA1-LOW can then be used as a passive radar receiver with high sensitivity, large FoV (possibly multibeam), and possibly fast imaging capability with high angular resolution fast imaging.
References:
Azarian, S. & Vaubaillon, J., 2014, in NenuFAR: instrument description and science case, https://nenufar.obs-nancay.fr/, 118;
Davies, K., 1990, Ionospheric Radio, IET, UK;
Expert Panel Report on RFI, 2011, http://skatelescope.org/;
Intema, H.T., et al., 2009, A&A, 501, 1185;
Herne, D., et al., 2013, Proc. ASSC 13, Sydney, Australia, 129;
Loi, S.T., et al., 2016, JGR, 121, 1569;
Smirnov, O. M. & Tasse, C., 2015, MNRAS, 449, 2668;
Williams, C.L., et al., 2012, ApJ, 755, 47
2.4.2 Exoplanets and star-planet interactions
All magnetised solar system planets are sources of strong low-frequency radio emissions (Zarka 1998). These emissions are produced by electrons accelerated to a few keV energy via by solar wind-magnetosphere interaction (compression or magnetic reconnection), magnetosphere-ionosphere or magnetosphere-satellite coupling. When traveling along magnetic field lines above planetary polar regions, these electrons generate radio emissions at the local cyclotron frequency (, up to 40 MHz at Jupiter, 1.5 MHz at all other planets), via a well-understood and well-documented non thermal coherent process, the Cyclotron Maser Instability (CMI – Treumann 2006). These emissions can be as intense as solar ones (kJy to MJy – cf. red circle on Fig. 41), hence the idea to detect their exoplanetary counterparts from stellar distances. However, the LF sky background, (plus ionospheric scintillation and RFI) prevent us to detect them from these distances. Scaling laws have been derived that predict that hot jupiters may be emitters to times more intense than Jupiter (Fig. 42), and thus detectable at a few tens of pc range (Zarka et al. 2001, Zarka 2007, Griemeier et al. 2007). Other studies favour fast rotating giant planets orbiting at a few AU from stars with a large X-UV brightness (Nichols, 2011).
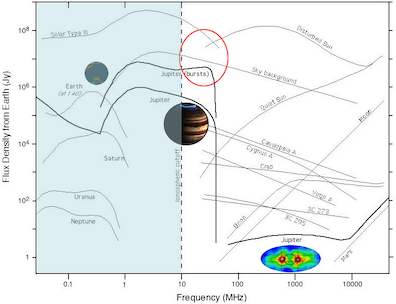
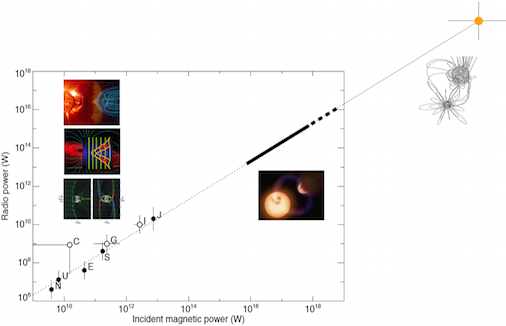
As hot jupiters on circular orbit are likely to be spin-orbit synchronised, their relatively slow sidereal rotation ( days) may be unfavourable to sustain a strong planetary dynamo. Thus their magnetic field may be too weak to provide electron cyclotron frequencies a few tens of MHz. However, even if weakly magnetised or unmagnetised, these planets orbiting in a sub-Alfvénic stellar wind will magnetically interact with their parent star similarly to Io with Jupiter. The planet may thus induce (via unipolar inductor, Alfvén waves or magnetic reconnection) electron acceleration and thus intense radio emission, up to times Jupiter’s, in the magnetic field of their parent star (Fig. 42). The study of star-planet plasma interactions was placed in the more general theoretical framework of the interaction of a magnetised plasma flow with an obstacle (Zarka 2017, and references therein). It also applies for example to the case of terrestrial planets orbiting a white dwarf, as analysed by Willes and Wu (2004, 2005) who predicted strong CMI emission at several GHz.
Based on our detailed theoretical understanding of magnetospheric emissions from solar system planets, it has been shown that detection (in the time–frequency plane, because no resolved imaging is possible for extrasolar hot jupiters) of the intensity and circular polarisation of the radio emission from an exoplanetary system will allow us to obtain unique information on the planetary magnetic field (strength, orientation, tilt) and thus the planetary dynamo process (that depends itself on the thermal state, composition, and dynamics of their interior – very difficult to probe by other means), and on the physics of star-planet plasma interactions (topology, energetics). Detailed simulations are discussed in (Hess & Zarka 2011) and illustrated in Fig. 43. Not only such a detection will open the broad new field of comparative exo-magnetospheric physics, but it will also permit to measure the planetary rotation (testing spin-orbit synchronisation) and orbit inclination, detect exo-moons, and provide a precious constraint on the planetary habitability (large-scale planetary magnetic fields play an important role in protecting the planet’s surface and atmosphere).
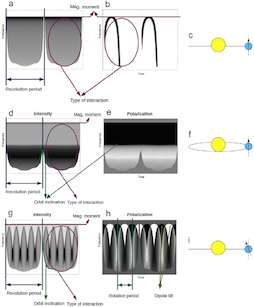
Observational searches started even before the confirmed discovery of the first exoplanet (Zarka 2011). No confirmed detection has been
reached yet (Zarka et al. 2015), but only a few tens of candidates were observed (by UTR-2, the VLA, the GMRT, and LOFAR). SKA1-LOW will give access to the range 50 MHz with a sensitivity 30 times better than LOFAR’s. To the extent that Jupiter’s magnetic field is not exceptionally strong, and that exoplanetary radio emission thus exists above 50 MHz, SKA1-LOW will be able to detect a signal equivalent to Jupiter’s emitted from a distance up to 5 pc. Distinguishing a planetary signal from a stellar one should be facilitated by the expected strong circular polarisation of planetary CMI emission, and recurrence at the planetary orbital period. SKA will operate in large surveys (the one of interest for exoplanets being focused on low Galactic latitudes), so that systematic sensitive observation of all known exoplanets in the southern hemisphere (800 today – cf. www.exoplanet.eu) will be carried out. Within 10 pc distance, there are 200 known stars and 50 currently known exoplanets, and this number should increase substantially with coming space missions dedicated to transits and powerful ground-based instruments. The accessible volume will be much increased if scaling laws derived in our solar system can be reliably extrapolated to exoplanetary systems, permitting to measure lower mass planets’ dynamos and magnetospheres. Scheduling regular re-observations of the exhaustive set of planetary targets will increase the chances of radio burst detection and possibly allow us to address original questions such as the variability of the emission with the season or stellar cycle. SKA observations will be complemented at frequencies 50 MHz by NenuFAR observations (in the northern hemisphere – Zarka et al. 2012). Note that the higher frequency synchrotron emission from high energy electrons in radiation belts is several orders of magnitude weaker than the CMI emission and thus should not be detectable at stellar distances.
References:
Budding, E., et al., 1998, PASA, 15, 183;
Griemeier, J.-M., et al., 2007, A&A, 475, 359;
Hess, S.L.G. & Zarka, P., 2011, A&A, 531, A29;
Nichols, J. D., 2011, MNRAS, 414, 2125;
Treumann, R., 2006, Astron. Astrophys. Rev, 13, 229;
Willes, A. J. & Wu, K., 2004, MNRAS, 348, 285;
Willes, A. J. & Wu, K., 2005, A&A, 432, 1091;
Zarka, P., 1998, JGR, 103, 20159;
Zarka, P., 2007, Planet. Space Sci., 55, 598;
Zarka, P., 2011, in Planetary Radio Emissions VII, H. O. Rucker et al.eds., Austrian Acad. Sci. Press, 287;
Zarka, P., et al., 2001, Astrophys. Space Sci., 277, 293;
Zarka, P., et al., 2012, SF2A-2012, S. Boissier et al.eds., 687;
Zarka, P., et al., 2015, AASKA14, 120;
Zarka, P. 2017, Handbook of Exoplanets, J. A. Belmonte et al.eds., Springer, in press
2.4.3 Solar radio emissions
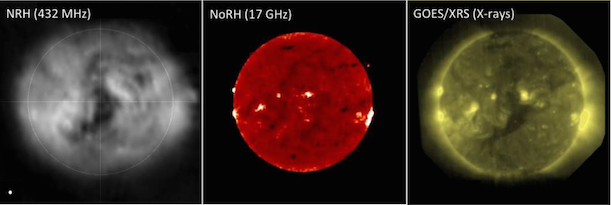
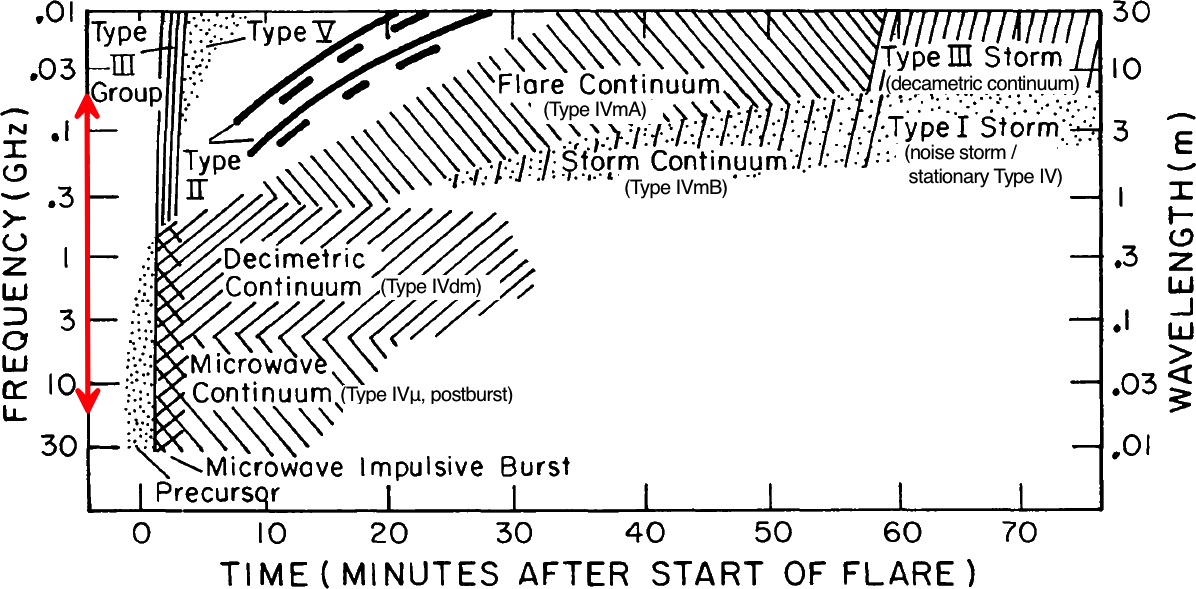
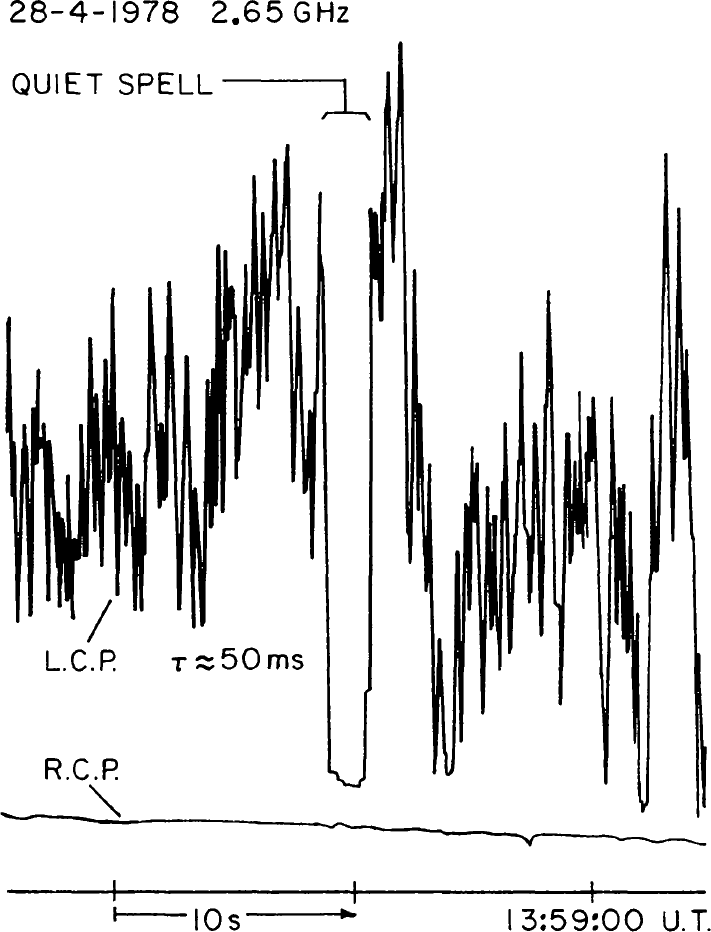
The Sun is a strong radio emitter in the frequency range from 1 MHz to 50 GHz (e.g. Dulk 1985, Pick & Vilmer 2008). Radio observations provide dynamic spectra (intensity, polarisation) from 10 GHz to 1 MHz and imaging information with solar dedicated radio-heliographs (Nobeyama at 35 and 17 GHz, Nançay (NRH) at several frequencies between 435 and 150 MHz) or with radio interferometers developed for astronomy (VLA, LOFAR, …). The quiet Sun can be imaged at various frequencies with e.g. the above radio-heliographs (Dulk 1985, Mercier & Chambe 2012; Fig. 44). Higher frequencies are produced closer to the solar surface. As a result, while quiet Sun images at high frequencies tend to match Extreme UV and X-ray images of the solar corona, at lower frequencies (e.g. 150 MHz) they reveal coronal holes.
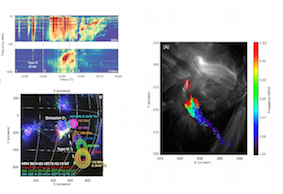
Radio emissions of the active Sun (radio bursts) display a very complex morphology in the time-frequency plane with drifting structures, bands, zebra (Fig. 45, left and Fig. 46, top left). Radio bursts associated with flares, shocks and coronal mass ejections (CMEs) are produced in the solar atmosphere by energetic electrons either through various plasma mechanisms (narrowband emissions observed in particular below 1 GHz) or by gyrosynchrotron process (large broadband continuum emission observed predominantly above 1 GHz). For plasma mechanisms, the emitted frequency is related to the local plasma frequency () or its double (harmonic) and therefore decreases with height in the solar corona. Measuring radio emissions at different frequencies (either with spectroscopy or through imaging) thus allows us to probe phenomena at different heights of the solar atmosphere as well as to follow the propagation of disturbances from e.g. the low corona to the interplanetary medium. In addition, some specific radio emissions (long duration radio continua called type IV) can be used as tracers of the development in the low corona of CMEs, well before they become detectable in the field of view of coronographs.
The most frequent bursts produced in solar flares are Type III bursts associated to the propagation of relativistic (0.1-0.5c) electron beams in the corona (see e.g. Saint-Hilaire et al. 2013). Type II bursts are associated to shock waves travelling outward through the corona (Bougeret et al. 1998). Both beams and shock waves can propagate through the interplanetary medium to and beyond 1 AU (Fig. 46, top left). At frequencies in the 450-150 MHz range, radio bursts have been routinely imaged with the NRH (Fig. 46, bottom left). With the LOFAR array, new observation modes combining (pseudo-)imaging and high-resolution dynamic spectra have been implemented (Morosan et al. 2014), allowing to localise type III sources in the high corona (in the 30-50 MHz range). LOFAR observations also revealed circularly polarised drifting bursts which were attributed to CMI emission from the feet or magnetic loops (Morosan et al. 2015). At higher frequencies, some microwave spike bursts have been also attributed to the CMI on highly-magnetised magnetic loops. Fig. 45 (right) displays an example of such circularly polarised spikes.
The main interests of SKA for the study of the radio Sun will be its broad spectral coverage that will allow to observe a large portion of the solar radio spectrum with imaging capability in the frequency range from 14 GHz to 50 MHz. Its expected capability of providing simultaneously images and dynamic spectra will allow in particular to study in details the propagation and radiation of electron beams very close to the flare site (as demonstrated with the first observations of Type IIIdm bursts in the 1-2 GHz range obtained with the recently upgraded Karl G. Jansky VLA; cf. Fig. 46, right) as well as from the acceleration region up to the higher corona (Fig. 46, bottom left).
SKA will of course not produce routine solar observations, but regular and Target of Opportunity campaigns may bring significant progress in the understanding of e.g. acceleration, propagation and radiation of electron beams in the solar corona. These observations will complement those from solar dedicated instruments such as the MUSER radio-heliograph in China and EOVSA in the USA. Eventually, similar to the extrapolation of our knowledge of solar system planets magnetospheres to the study of exoplanets, our understanding of solar activity and bursts should form a basis for stellar radio bursts and activity studies (below).
References:
Bougeret, J.-L., et al., 1998, GRL, 25, 2513;
Carley, E. et al., 2016, ApJ, 833, 87;
Chen, B. et al., 2013, ApJ, 703, L21;
Dulk, G.A., 1985, Ann. Rev. Astron. Astrophys., 23, 169;
Mercier, C., Chambe, G., 2012, A&A, 540, A18;
Morosan, D.E., et al., 2014, A&A, 568, A67;
Morosan, D.E., et al., 2015, A&A, 580, A65;
Pick, M. & Vilmer, N., 2008, A&Arv, 16, 1;
Saint-Hilaire, P., et al., 2013, ApJ, 762, 60
2.4.4 Stellar activity and environment
Stellar activity can be studied with SKA along with exoplanet search and study, with the same observational setups. SKA can provide a bridge between the study of solar and stellar bursts, as between that of solar system planets and exoplanets.
2.4.4.1 Stellar flares and analogues to Solar radio bursts
Multi-wavelength observations (X, EUV, optical and radio) have shown that solar-like flares are a common feature of magnetically active stars. In particular, radio emissions during stellar flaring events have been reported continuously along the years (see reviews and references in Bastian 1990, Guedel 2002, White 2004 – Fig. 47).
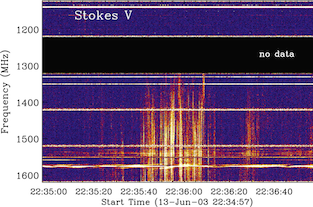
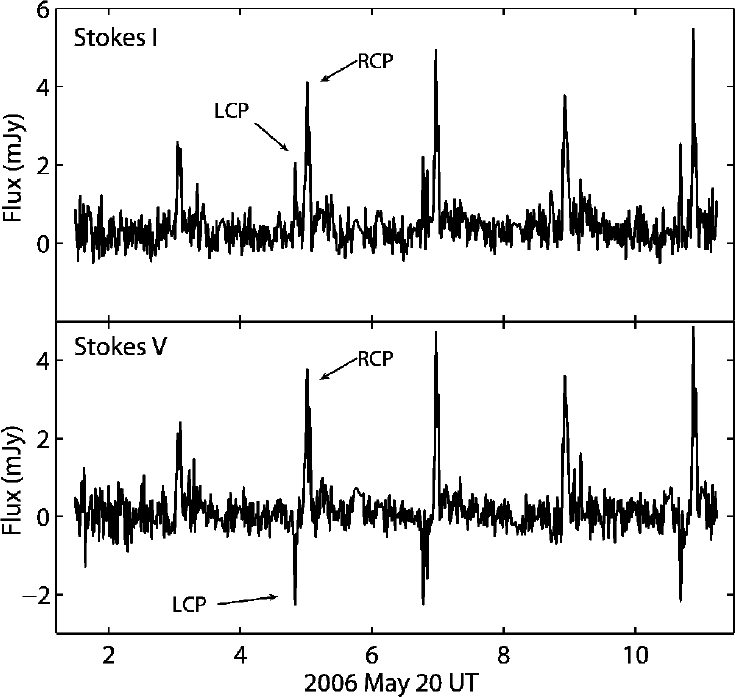
Overall, stellar flares present a similar phenomenology with solar flares: light curves generally show an impulsive phase with an abrupt rise followed by a longer decay phase, as for solar flares, and the ratios of radio to UV emission are similar (Osten et al. 2004). However, radio emissions are not always present during stellar flares: Tingay et al. (2016) showed that the Kepler K2 field radio survey did not find any radio emission where optical flares had been detected. When radio emissions are detected alongside other wavelengths, the lack of amplitude correlation (e.g. between optical and radio, see Spangler 1976) poses the question of how and where energy is partitioned during those flares. Furthermore, compared with the Sun, some star types such as UV Ceti are radio-overluminous with regard to their associated X-ray emission (Guedel 1996). Hence, even though similar generic mechanisms may be at play at the Sun and on other stars during flares, the role of atmospheric compositions and magnetic fields need to be better understood. Sky surveys performed with large fields of view with SKA will help assess the link between emissions at different wavelengths and probe into the underlying mechanisms of flares.
Different types of radio emissions from stars have been reported during stellar flares in the MHz-GHz range (see review by Guedel 2002). On the one hand, gyrosynchrotron emissions, related to relativistic electrons (Dulk 1985), provide a diagnostic of non-thermal electron populations. On the other hand, coherent emissions inform on the plasma processes at play. Study of the polarisation can help distinguish between the two possible coherent mechanisms, CMI or plasma emission (see e.g. the observations made at 154 MHz with the MWA by Lynch et al. 2017). Dynamic spectral analyses offered with the SKA capabilities will also be of interest in understanding the location of particle acceleration and drift of electron beams in the stellar coronae. SKA will provide a better understanding of the particle acceleration history, non-thermal energy release, coherent emission, and influence of the stellar atmosphere, as answering those questions require both broadband coverage and high sensitivity.
Assuming that stellar flares are powered by mechanisms similar to those found at the Sun, we may wonder whether the equivalent of Coronal Mass Ejections (CMEs) exist. It is believed that these large amounts of ejected stellar material can be an important mass loss for the star, with possible impact on planetary disks and planetary habitability (Khodhachenko et al. 2013, Osten & Wolk 2015, Drake et al. 2016). While CMEs observed at the Sun are associated with radio sources (e.g. Bastian 2001, 2007), their stellar counterparts have remained elusive. Ongoing programs (e.g. Villadsen et al. 2016) are promising, as well as future dynamic spectra obtained in the low frequencies (100 MHz, for these frequencies will reveal outward-propagating CMEs) with SKA.
Overall, by providing new observations in the field of stellar flares, SKA will help to better understand transients detected at stars (including stars equivalent to a young Sun, constraining scenarios of solar system evolution), and to assess planetary habitability, a field that has gained momentum with the exponential increase of detected exoplanets ( www.exoplanet.eu). To complement this section, the reader is referred to the review by Osten (2008), where interesting questions regarding radio observations of stellar transients with wide-field radio surveys such as SKA’s are discussed in more details.
References:
Bastian, T.S., 1990, Solar Phys., 130, 265;
Bastian, T.S., et al., 2001, ApJ, 558, 65;
Bastian, T.S., 2007, ApJ, 665, 805;
Drake, J.J., et al., 2016, Proc. IAU Symp. 320;
Dulk, G.A., 1985, Ann. Rev. Astron. Astrophys., 23, 169;
Guedel, M., et al., 1996, ApJ, 471, 1002;
Guedel, M., 2002, Ann. Rev. Astron. Astrophys., 40, 217;
Hallinan, G., et al., 2007, ApJ, 663, L25;
Khodachenko M., et al., 2013, Proc. IAU Symp. 300;
Lynch, C.R., et al., ApJ Lett., 836, L30;
Osten R., et al., 2005, ApJ, 621, 398;
Osten R., et al., 2006, ApJ, 637, 1016;
Osten, R., Wolk, S., 2015, ApJ, 809, 79;
Spangler, S.R. & Moffett, T.J., 1976, ApJ, 203, 497;
Tingay, S.J., et al., 2016, Astron. J., 152, 82;
Villadsen J., et al., 2016, Proc. IAU Symp. 320;
White S.M., 2004, New Astron. Rev., 48, 1319
2.4.4.2 Cool dwarfs
A limited number of bodies more massive than planets have been recently found to host similar non-thermal radio emissions, intense enough to be detected from the ground in the GHz range with peak flux densities up to a few mJy (Fig. 47, right). These include brown dwarfs and very low mass stars of spectral type later than M7, often referred to altogether as ultracool dwarfs. Fig. 48, left shows the rate and number of detections as a function of the spectral type, that provides a constraint on their internal structure with their capacity to generate and maintain a large scale magnetic field. Fig. 48, right displays the distribution of radio intensities versus the distance.
The detected radio sources generally display two types of radiations: quiescent emissions are persistent, broadband, faint, and display a low degree of circular polarisation; bursts are variable at timescales of minutes, broadband, intense, with a high degree of circular polarisation (Berger et al. 2002, 2006, 2009; Burgasser & Putman 2005; Hallinan et al. 2006, 2015; Phan-Bao et al. 2007; Antonova et al. 2008; MacLean et al. 2011, 2012; Route & Wolszczan 2012 ; Lynch et al. 2015). Quiescent faint emission has been early thought to be produced by gyrosynchrotron emission from mildly relativistic electrons.
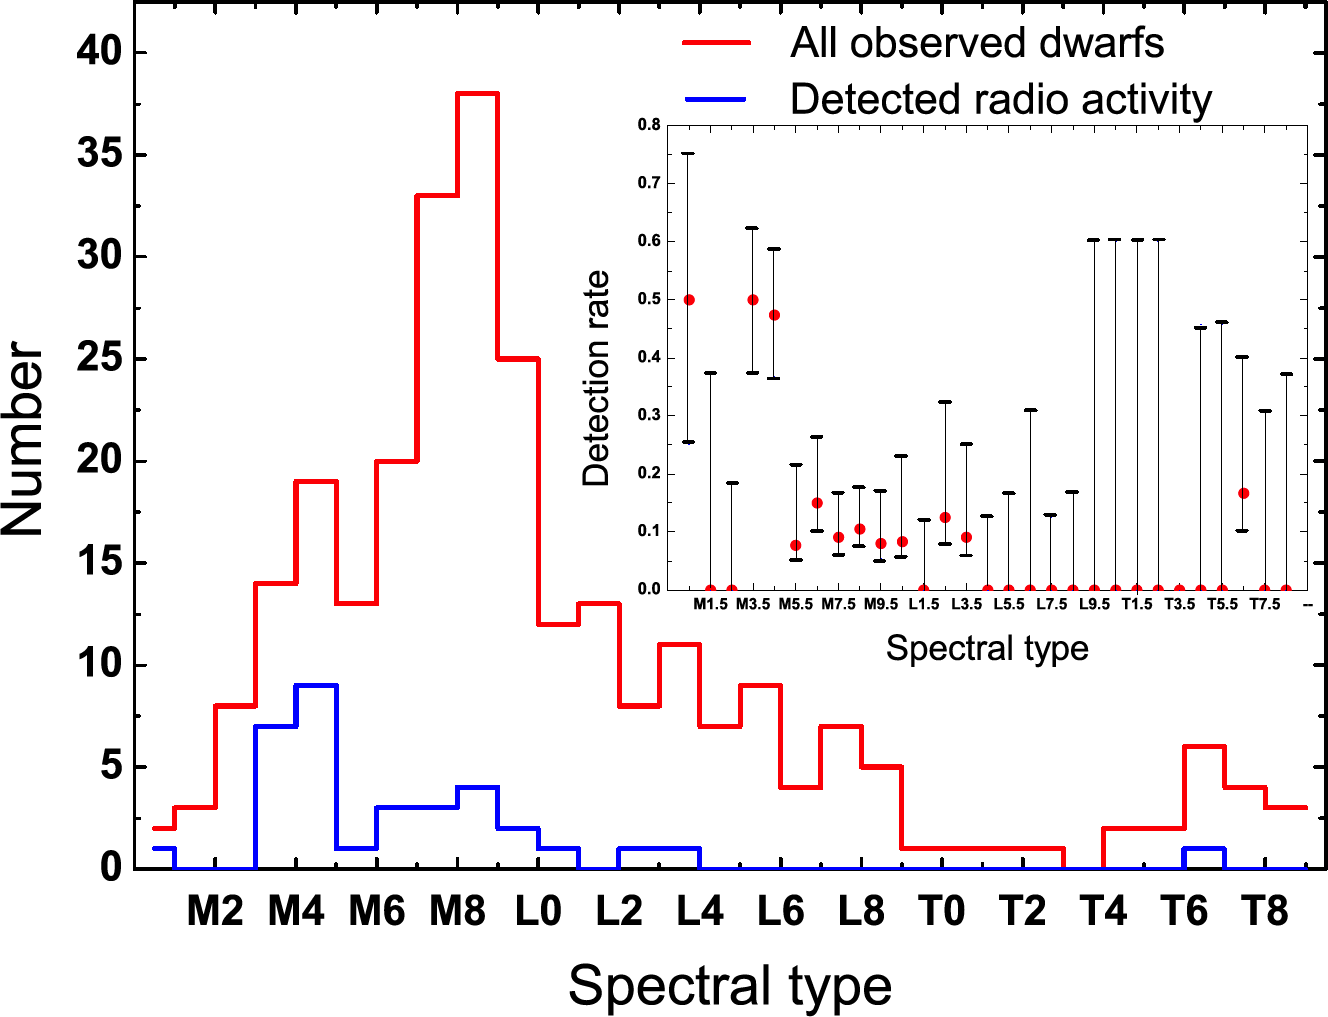
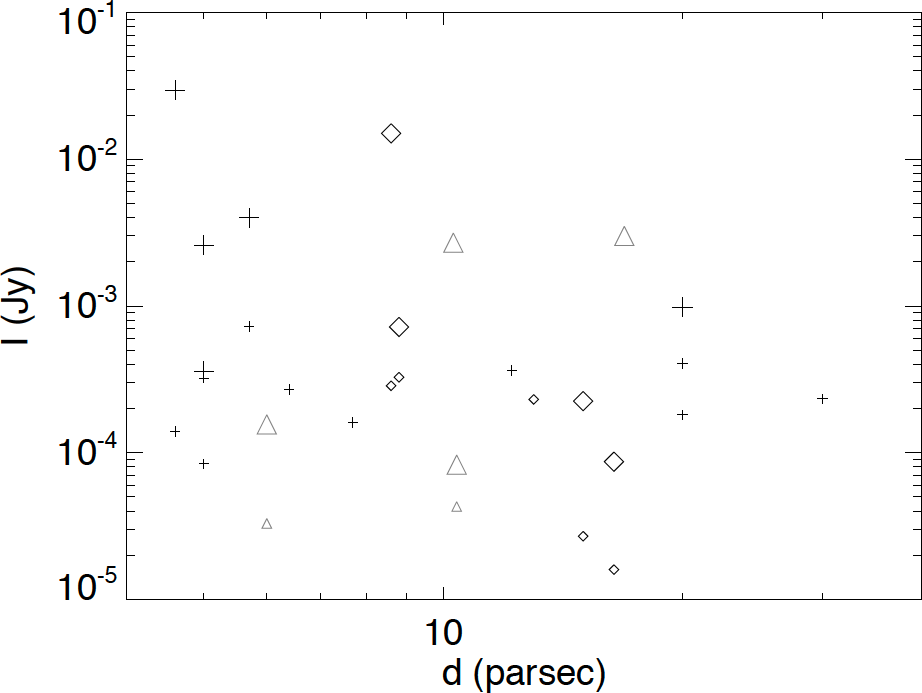
Conversely, the electron-cyclotron maser instability (CMI) has been identified as the most plausible emission mechanism for most intense bursty emissions. This instability enables to amplify elliptically polarised radio waves from non-maxwellian weakly relativistic electrons close to the relativistic electron cyclotron frequency with a typical 1% energy conversion efficiency. The CMI was originally developed to explain the terrestrial Auroral Kilometric Radiation (Wu & Lee 1979, Treumann 2006) and it is now thought to be more generally responsible for all planetary auroral radio emissions detected in the solar system, ranging from decametric (40 MHz at Jupiter) to kilometric (100 kHz at Earth, Jupiter, Saturn, Uranus & Neptune) wavelengths (Zarka 1998). The validity of the CMI has then been checked with in situ measurements at Earth (Roux et al. 1993; Ergun et al. 2000), at Saturn (Lamy et al. 2010; Mutel et al. 2010) and at Jupiter (Louarn et al. 2017). Overall, CMI-driven planetary auroral radio emissions provide a powerful diagnostic of magnetospheric processes: dynamics, coupling with the solar wind and/or moons, energy budgets, current systems, particle acceleration processes. For other CMI radio sources (exoplanets, stars), comparison to emission models (as in Hess & Zarka, 2011, or Leto et al. 2016) gives access to key parameters such as the magnetic field strength at the source, and various parameters.
Applied to brown dwarfs, CMI emission implies magnetic field amplitudes of several kGauss at the source. Monitoring polarisation switches of the CMI bursts of ultracool dwarfs may reveal the existence and properties of magnetic cycles of very low-mass stars and brown dwarfs (Route 2016). Very little is currently known about the dynamo magnetic fields and cyclic behavior of these fully-convective objects. Monitoring them simultaneously with SKA and SPIROU (Infrared Spectropolarimeter at CFHT) should unveil their detailed magnetic properties, guide theory towards more predictive dynamo models and bridge the observational gap between magnetic fields of M dwarfs (Donati et al. 2008; Morin et al. 2008, 2010) and those of giant and terrestrial planets (Christensen et al. 2009; Morin et al. 2011).
Observing ultracool dwarfs with SKA1-LOW will enable us to detect a wide variety of sources in the range 50-350 MHz yet unexplored with high sensitivity (hence probing source magnetic fields from 18 to 125 G). Such observations will provide a unique frame for comparative “dwarfology” that will rely on our current understanding of solar system planetary auroral emissions. Interestingly, SKA observations of ultracool dwarfs may additionally provide a path toward the detection of (likely fainter) exoplanets, or at least hints to understand their non-detection.
References:
Antonova, A., et al., 2013, A&A, 549, A131;
Antonova, A., et al., 2008, A&A, 487, 317;
Berger, E. et al., 2002, ApJ, 572, 503;
Berger, E., 2006, ApJ, 648, 629;
Berger, E., et al., 2009, ApJ, 695, 310;
Burgasser, A. J. & Putman, M. E., 2005, ApJ, 626, 486;
Christensen, U., et al., 2009, Nature 457, 167;
Donati, J.-F., et al., 2008, MNRAS 390, 545;
Ergun, R.E., et al., 2000, ApJ, 538, 456;
Hallinan, G., et al., 2006, ApJ, 653, 690;
Hallinan, G., et al., 2015, Nature, 523, 568;
Hess, S.L.G. & Zarka, P., 2011, A&A 531, A29;
Lamy, L., et al., 2010, GRL, 37, L12104;
Leto, P., et al., 2016, MNRAS, 459,1159;
Louarn, P., et al., 2017, GRL, in press;
Lynch, C., et al., 2015, ApJ, 802,106;
McLean, M., et al., 2011, ApJ, 741, 27;
McLean, M., et al., 2012, ApJ, 746, 23;
Morin, J., et al., 2008, MNRAS 390, 567;
Morin, J., et al., 2010, MNRAS 407, 2269;
Morin, J., et al., 2011, MNRAS 418, L133;
Mutel, R.L., et al., 2010, GRL, 37, L19105;
Phan-Bao, N., et al., 2007, ApJ, 658, 553;
Route, M. & Wolszczan, A., 2012, ApJ, 747, L22;
Route, M., 2016, ApJ 830, L27;
Roux, A., et al., 1993, JGR, 98, A7, 11657;
Treumann, R., 2006, Astron. Astrophys. Rev, 13, 229;
Trigilio, C., et al., 2011, ApJ, 739, L10;
Wu, C.S. & Lee, L.C., 1979, ApJ, 230, 621;
Zarka, P., 1998, JGR, 109, E9, 20159
2.4.4.3 Circumstellar HI
The H i line at 21 cm allows us to probe the kinematics and the physical properties of circumstellar shells over large sizes, and especially the properties of their external regions where stellar outflows interact with the ambient medium (Villaver et al. 2002; Hoai et al. 2015). Previous observations, in particular with the VLA and the NRT, have shown that the line widths are narrow (FWHM 5 km/s), and that in some cases the centroid velocities are drifting with position on the sky along directions opposite to the stellar motions (Matthews et al. 2008).
Thanks to the high spectral resolution available in the radio range, the H i study of galactic circumstellar shells with the SKA can provide unique information on the mass loss history of stars, on the injection of stellar matter in the ISM, and thus on the cycle of matter in our Galaxy. We stress here the interest to map with a high spectral resolution (corresponding to 0.1 km/s) the H i line emission in the directions of a variety of sources representative of the population of galactic mass losing stars. A spatial resolution of 1 would allow us to resolve the kinematical structures which, in 3D numerical simulations, are predicted to develop at the interfaces with the ISM, in nearby sources (typically 200-500 pc, e.g. Mohammed et al. 2012). This project could be extended to the study of the cycle of matter in nearby galaxies, such as the Magellanic Clouds.
The requirements are a good sensitivity in a large field of view
( one degree), a good response to large scale structures
(up to 1/2 degree), as well as an ability to filter out
strong background H i components originating in the ISM located
on the same lines of sight. A radio interferometer, made of 12-m antennas,
with a compact core and outer components providing long baselines,
up to 100 km, and a good coverage of the uv plane,
such as the one foreseen for SKA1 in South Africa,
seems very well adapted. However, the sensitivity requirements
are demanding, and the full potential of this programme might only be
revealed by the complete SKA (i.e. with a collecting area of 1 km2).
References:
Hoai, D.T., et al., 2015, MNRAS, 449, 2386;
Matthews, L.D., et al., 2008, ApJ, 684, 603;
Mohammed, S., et al., 2012, A&A, 541, 1;
Villaver, E., et al., 2002, ApJ, 571, 880
2.4.5 Planets, Stars and Commensal SETI observations
As discussed above, CMI emission is the most intense radio emission from planets, and has been detected from brown dwarfs and low-mass stars. Its detection is expected to bring unique information about exoplanets and star-planet plasma interactions (involving FGKM stars as well as white dwarfs), opening the news fields of comparative exo-magnetospheric physics and extrasolar space weather, and about auroral-like radio emissions from brown dwarfs and low-mass stars. For exoplanets, detection will give access to unique physical information (described above). For both exoplanets and low-mass stars, detection will permit to elucidate the type or “engine” in operation : star-planet interactions (stellar wind control, triggering by CME, magnetic reconnection, unipolar induction), auroral-like currents in stellar environments. The expected sensitivity will also permit to detect radio emissions from stellar coronal mass ejections (CME, analog to Solar type II bursts), that may in turn trigger exoplanetary radio emissions, and from magnetic binaries with star-planet-like interaction.
It is thus essential to promote an ambitious survey with SKA allowing us to search and study exoplanets, cool dwarfs and stars. It will allow us to study the evolution of the objects’ properties (rotation periods, large-scale magnetic field amplitudes and topologies, atmospheres–ionospheres, radio fluxes), bringing new constraints on dynamo theories and radio emission scaling laws, and possibly enabling the discovery of low-mass (habitable?) planets around M dwarfs (Zarka et al. 2015). We have proposed such a survey, focused on low-frequencies and low galactic latitudes, in the frame of the SKA working group “Cradle of Life”. This survey should benefit from strong synergies with observations at other wavelengths.
We named this proposal : Key Science Project “Stars, Planets and Civilisations”. Indeed, provided that beamformed raw voltages can be exported in parallel to imaging or beamformed spectral data, the proposed targets of this program are ideally adapted to a SETI commensal search, probing leakage radiation from Kardashev 0-1 civilisations of nearby planets and stars (Siemion et al. 2015). After interference elimination, sensitivities to W Equivalent Isotropic Radiated Power can be reached, nearing the highest power leakage transmitters from Earth. A particularly interesting idea is the possible existence of beamed unintentional signals that would be used for radio communication within a transiting multi-planet system (i.e. seen along the ecliptic plane), between planets and/or space probes, the detection of which would require transmitted powers of W only.
The search and study of Planets, Sun, Stars, and Civilisations with SKA is a broad new field to explore (actually including many connected sub-fields). The theoretical frame is much advanced, and we can be very optimistic about the prospects and outcomes.
References:
Siemion, A.P.V., et al., 2015, AASKA14, 116;
Zarka, P., et al., 2015, AASKA14, 120
2.5 Transient Universe
Contributors of this section in alphabetic order:
M. G. Bernardini [Laboratoire Univers et Particules de Montpellier, Université de Montpellier, CNRS/IN2P3, Montpellier, France], C. Boisson [LUTh, Observatoire de Paris, PSL Research University, CNRS UMR 8109, Université Pierre et Marie Curie, Universit é Paris Diderot, Meudon, France], M. Cerruti [Sorbonne Universités, UPMC Université Paris 06, Université Paris Diderot, Sorbonne Paris Cité, CNRS, Laboratoire de Physique Nucléaire et de Hautes Energies (LPNHE), Paris Cedex 5, France], E. Chassande-Mottin [Astroparticule et Cosmologie APC, Université Paris Diderot, CNRS/IN2P3, CEA/IRFU, Observatoire de Paris, Sorbonne Paris Cité, Paris, France], S. Chaty [IRFU, CEA, Université Paris-Saclay, Gif-sur-Yvette, France;Université Paris-Diderot, AIM, Sorbonne Paris Cité, CEA, CNRS, Gif-sur-Yvette, France;Institut Universitaire de France, Paris, France], I. Cognard [LPC2E, CNRS, Université d’Orléans, Orleans, France], S. Corbel [IRFU, CEA, Université Paris-Saclay, Gif-sur-Yvette, France;Université Paris-Diderot, AIM, Sorbonne Paris Cité, CEA, CNRS, Gif-sur-Yvette, France;Station de Radioastronomie de Nançay, Observatoire de Paris, PSL Research University, CNRS, Univ. Orléans, Nançay, France], M. Coriat [IRAP, Université de Toulouse, CNRS, UPS, CNES, Toulouse, France], R. Dallier [SUBATECH, école des Mines de Nantes, CNRS-IN2P3, Université de Nantes, France], A. Djannati-Ataï [Astroparticule et Cosmologie APC, Université Paris Diderot, CNRS/IN2P3, CEA/IRFU, Observatoire de Paris, Sorbonne Paris Cité, Paris, France], L. Guillemot [LPC2E, CNRS, Université d’Orléans, Orleans, France;Station de Radioastronomie de Nançay, Observatoire de Paris, PSL Research University, CNRS, Univ. Orléans, Nançay, France], A. Marcowith [Laboratoire Univers et Particules de Montpellier, Université de Montpellier, CNRS/IN2P3, Montpellier, France], L. Martin [SUBATECH, école des Mines de Nantes, CNRS-IN2P3, Université de Nantes, France;Station de Radioastronomie de Nançay, Observatoire de Paris, PSL Research University, CNRS, Univ. Orléans, Nançay, France], F. Mottez [LUTh, Observatoire de Paris, PSL Research University, CNRS UMR 8109, Université Pierre et Marie Curie, Universit é Paris Diderot, Meudon, France], J. Pétri [Université de Strasbourg, CNRS, Observatoire astronomique de Strasbourg, UMR 7550, Strasbourg, France], B. Revenu [SUBATECH, école des Mines de Nantes, CNRS-IN2P3, Université de Nantes, France], J. Rodriguez [IRFU, CEA, Université Paris-Saclay, Gif-sur-Yvette, France;Université Paris-Diderot, AIM, Sorbonne Paris Cité, CEA, CNRS, Gif-sur-Yvette, France], G. Theureau [LPC2E, CNRS, Université d’Orléans, Orleans, France;Station de Radioastronomie de Nançay, Observatoire de Paris, PSL Research University, CNRS, Univ. Orléans, Nançay, France;LUTh, Observatoire de Paris, PSL Research University, CNRS UMR 8109, Université Pierre et Marie Curie, Universit é Paris Diderot, Meudon, France], S. D. Vergani [GEPI, Observatoire de Paris, PSL Research University, CNRS, Meudon, France], N. Webb [IRAP, Université de Toulouse, CNRS, UPS, CNES, Toulouse, France]
2.5.1 Slow transients
2.5.1.1 Accreting transients
The following text is adapted from the chapter Incoherent transient radio emission from stellar-mass compact objects in the SKA era from the Proceedings of Advancing Astrophysics with the Square Kilometre Array (Corbel et al. 2015).
Introduction and context
Stellar-mass compact objects provide important laboratories for studying the fundamental coupling between the accretion process and the launching of energetic outflows, which often take the form of highly-collimated jets (Hughes 1991). A theoretical picture has been developed where the jets are composed of an electron/positron or electron/proton plasma (e.g. Bonometto & Rees 1971), which is magnetically collimated as it flows away from the compact object. These jets may be powered either by tapping the energy of a rotating black hole (Blandford & Znajek 1977), or by extracting energy from the accretion flow (Blandford & Payne 1982). However, many basic aspects of jet physics are uncertain, including their composition and structure, as well as the mechanisms that power and collimate them. Relativistic jets are relevant in almost all fields of astrophysics, and in some cases may be the dominant output channel for the accretion power from black holes (Fender et al. 2003). They provide an important source of feedback to the surrounding environment, being able to either trigger or suppress star formation, accelerate cosmic rays, and seed the surrounding medium with magnetic fields. They have even been suggested to play a role in the reionisation of the Universe (e.g. Mirabel et al. 2011). Despite their relative proximity, the lower masses of stellar-mass compact objects imply that they are observed at lower angular resolution (in terms of gravitational radii) than nearby AGN, yet they evolve through their duty cycles on human timescales, typically undergoing entire outbursts over periods of days to months. Thus, they provide unique insights into the coupling between accretion and outflow. Furthermore, comparative studies of the different classes of compact object can provide important insights into the necessary and sufficient ingredients for the jet launching processes. The non-thermal radio emission from stellar-mass compact objects typically arises via synchrotron emission from relativistic particles spiraling around the magnetic field lines of the jets. While significant progress has been made over the past few decades in understanding the nature of the jets and their coupling to the accretion flow (see Fender 2006, for a review), investigations have been hampered by the limited sensitivity of past and current facilities (see also Fender et al. 2015). We detail in this chapter how the sensitivity improvement brought about by the SKA will allow us to study black hole outbursts throughout the Galaxy and out into the Local Group, determine the role of jets in the low-luminosity quiescent state, and extend our existing studies of black holes to the analogous yet fainter neutron star and white dwarf systems.
Stellar mass black holes
From an observational standpoint, black hole transients spend most of their time in a quiescent state, at very low mass accretion rates. They occasionally undergo outbursts that last from a few months to a year, during which the flux rises by several orders of magnitude across the whole electromagnetic spectrum (McClintock & Remillard 2006). These outbursts are associated with global changes in three main components: the jets, the accretion disk and the corona. The luminous outburst phase, with a luminosity of the Eddington luminosity (the ”soft state”), is dominated by thermal emission from the accretion disk. During the rise and decay phases of the outburst (the ”hard” state), the bolometric luminosity of the source is dominated by non-thermal emission (synchrotron or inverse Compton emission from either the jets or the corona) extending up to the hard X-ray band. Following recent results with high-resolution X-ray spectroscopy, accretion disk winds are now recognised as ubiquitous in black hole X-ray binaries, and may carry away a significant fraction of the inflowing energy (Miller et al. 2006; Neilsen & Lee 2009; Ponti et al. 2012; Diaz Trigo et al. 2013). Observations of typical Galactic black holes have indicated two forms of jets associated with these primary accretion states; the slowly-varying, partially self-absorbed compact jets (with radio emission usually mJy for distances of a few kpc, and a flat or slightly inverted radio spectrum) observed in the hard state (Corbel et al. 2000; Fender et al. 2000; Dhawan et al. 2000; Stirling et al. 2001), and the bright ( Jy, with an optically thin radio spectrum), strongly variable transient jets (occasionally showing apparent superluminal motion) detected during the transition from the hard to the soft state (Corbel et al. 2004; Fender et al. 2004b). The core radio emission is then strongly quenched during the soft state (Fender et al. 1999; Coriat et al. 2011). Relic radio emission can also be detected in some cases when the jets interact with the ambient medium, either as large-scale lobes (Gallo et al. 2005), or as faint, transient hot spots (Corbel et al. 2002), depending on the duty cycle of the central black hole.
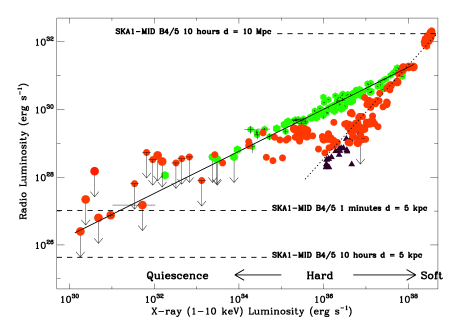
There is a strong correlation between the radio and X-ray emission in the hard and quiescent states (Corbel et al. 2003, 2013b; Gallo et al. 2003, 2012), indicating a possible coupling between the launch of the jets and the dynamics of the flow close to the accreting black hole (Fig. 49). It can be used to determine the expected source behaviour at the lowest radio luminosities, which remain relatively poorly explored owing to the limited sensitivity of current instruments (Miller-Jones et al. 2011). It is, for example, not clear whether quiescent black holes do host jets as in the brighter states. Current observations seem to indicate weak jet activity even in quiescence (Gallo et al. 2006, 2014), but it is not known what fraction of the liberated accretion power is carried away in the jets rather than being advected across the black hole event horizon (Fender et al. 2003). Furthermore, understanding the dichotomy in the radio/X-ray correlation (Coriat et al. 2011; Gallo et al. 2012) could provide a new way to explore the possibility of different couplings between accretion and ejection in black hole transients. With a sensitivity as good as 30 Jy s1/2 in band 4/5, SKA1-MID is the ideal instrument to monitor all detected black hole outbursts (up to a few tens per year) all the way down to quiescence. Furthermore, a long observation (10 hrs) with SKA1-MID could detect all quiescent black hole binaries up to a distance of 5 kpc. These transient black holes could either be discovered by targeted monitoring or a blind radio survey with SKA (Fender et al. 2015), or by any active multi-wavelength monitoring facility. The brightest phases of black hole outbursts (the hard to soft state transitions) can easily be studied via snapshot observations, even for the most distant systems in our Galaxy, meaning that SKA (even in phase 1) will probe a significant fraction of the outburst activity for almost all black holes in our Galaxy, including the very faint, sub-Eddington transients, which have rarely been observed at radio frequencies. With a resolution on the order of a few tenths of an arcsecond, the bright radio emission associated with the transient jets (Mirabel & Rodriguez 1994) could also be resolved from a week after the onset of the radio flare, as typical proper motions are on the order of 15-20 mas day-1. Good polarisation measurements (linear and circular) from SKA1-MID, associated with good signal purity, will provide key probes of the composition and geometry of the jets, and the structure of their magnetic fields. The high sensitivity and ability to dump the visibilities on rapid (1 s) timescales would allow us to probe any short-timescale variability of the jets, should it be present (shortest timescales of 10 minutes up to now, e.g. Corbel et al. (2000); Middleton et al. (2013)). Casella et al. (2010) detected rapid (sub-second) infrared variability from the jets of GX 339–4, which was correlated with the observed X-ray variability. Observing these variations at multiple frequencies as they propagate downstream in the jets would allow us to directly measure the speeds and sizes of the compact jets, providing the best observational constraints on their Lorentz factors.
Neutron stars
Comparisons between accreting neutron stars and black holes are ideal for determining which effects seen from accreting black holes are fundamentally related to the presence of an event horizon, instead of being generic to accretion onto objects with deep gravitational potential wells. Largely speaking, the phenomenology of accretion onto neutron stars is similar to that onto black holes (e.g. Psaltis 2006). Many of the known differences can be explained in a straightforward manner by the presence of a solid surface for neutron stars and the lack of one for black holes. Studies of accreting neutron stars will be bolstered by the enhanced sensitivity of the SKA. Systematic studies of the radio luminosities of accreting neutron stars as a function of their X-ray luminosities are far sparser than those for black holes. This is in part because the characteristic timescales on which accretion disks change scales inversely with the accretor mass, so that ”typical” outbursts of accreting neutron stars are shorter than those for accreting black holes; and partly because both the peak X-ray luminosities of neutron star transients and the ratio of radio to X-ray flux for neutron stars are both lower than for black holes (Fender & Kuulkers 2001; Wu et al. 2010; Migliari & Fender 2006). As a result of these factors, most soft X-ray transients with neutron star accretors peak at flux densities of about 1 mJy or less (for typical distances of several kpc). Thus, it has traditionally been difficult to span more than a factor of 10 in radio luminosity for neutron stars. Furthermore, since the outbursts progress quickly, scheduling a large number of epochs places strong pressure on the ToO scheduling of existing arrays. Finally, since many of these sources are located in the Galactic Bulge, or elsewhere in the Southern Hemisphere, often only short observations are possible. Despite these problems, some progress has still been made on understanding the radio emission of neutron star X-ray binaries. A few things seem clear: the high magnetic field X-ray pulsars are not strong radio emitters (Migliari & Fender 2006) and the radio and X-ray fluxes are correlated (see Fig. 49) for neutron star X-ray binaries that emit at less than about 10% of the Eddington luminosity (Migliari et al. 2003; Tudose et al. 2009). The enhanced sensitivity of the SKA will allow more quantitative statements on these topics. For example, Migliari et al. (2003) find that for the neutron star 4U 1728-34 in hard spectral states, while Tudose et al. (2009) looked at Aql X-1 and found , albeit while including data from a range of X-ray spectral states. Developing a sample of sources that has both many objects, and which spans a few orders of magnitude in radio luminosity would bring the data quality into line with that from the black hole transients at the present time (Fig. 49).
Additional studies of the thermal X-ray states of neutron stars in the radio may also hold important clues to understanding how jets are launched. In these systems, by analogy with the black holes, the accretion disks themselves are unlikely to supply much power to an accretion flow. On the other hand, the boundary layers, where the neutron star’s accretion disk dissipates its excess rotational energy, should have the large scale height thought to be needed to power jets, and may interact with the magnetic field of the neutron star itself. Studies of a large sample of these soft states rather than merely the two that have been detected already (Migliari et al. 2004), may help us to understand jet production in this environment.
A final class of systems that can probe the relationship between the accretion flow and the launching of jets are the recently-discovered class of transitional binary pulsars, which switch between accretion-powered and rotation-powered states on timescales of just weeks (e.g. Archibald et al. 2009; Papitto et al. 2013; Bassa et al. 2014). These systems have been shown to emit flat or inverted-spectrum radio emission in their accretion-powered states, which is consistent with partially-self absorbed synchrotron jets (Papitto et al. 2013; Bassa et al. 2014). Intensive radio monitoring of the transitions between these two states would provide unique insights into how the jets are formed and destroyed, and, together with simultaneous X-ray monitoring, would highlight the connection between the jets and the evolving accretion flow.
White dwarfs
The occurrence of jets and fast collimated outflows is by no means restricted to accreting black holes or neutron stars. Through sensitive and timely observations in the last decade, numerous accreting white dwarfs (in cataclysmic variables, symbiotic stars and supersoft X-ray sources) have shown strong evidence for jets and jet-like shocked, collimated outflows, observed at radio frequencies and interpreted as synchrotron emission (e.g. Coppejans et al. 2015, 2016). However, the brightness temperatures of the radio emission from cataclysmic variables are small enough that thermal and/or cyclotron emission are still viable possibilities and given the multiple possible mechanisms, there may be some heterogeneity in emission processes. Better spectral measurements, and searches for circular polarisation, which should be possible with SKA, can help resolve these issues. Perhaps the most striking (and encouraging) aspect is that these transient radio jets have all occurred in the prototypes of subclasses of accreting white dwarfs (Brocksopp et al. 2004; Rupen et al. 2008; Kording et al. 2008), suggesting they are more common in white dwarf accretors than previously assumed.
In close analogy to transient jets in X-ray binaries, the non-magnetic dwarf nova SS Cyg repeatedly exhibits radio outbursts associated with its disc outburst cycle (Kording et al. 2008). Even though radio luminosities are low compared to X-ray binaries – peak flux densities of 1 mJy at 1–10 GHz for a system at 114 pc (SS Cyg; Miller-Jones et al. 2013) – these systems provide an important link in understanding how accretion is coupled to the outflow of matter across a range of compact accretors. With the expected sensitivities achieved by SKA1- MID we can extend the sample of dwarf novae observed at radio frequencies out to kiloparsec distances, where optical transient surveys such as CRTS and iPTF (and LSST in the SKA era) are finding thousands of new dwarf novae (e.g. Drake et al. 2014). The sheer numbers of systems, the accessible time scales of the disc instability cycle in cataclysmic variables (weeks to months), and the reasonably well-understood accretion discs around white dwarfs provide an excellent laboratory for the SKA to study accretion physics with targeted (and target-of-opportunity) observations.
Whilst thermal emission is the dominant component of radio emission in novae (Seaquist & Bode 2008; O’Brien et al. 2015b), a significant number of novae exhibit non-thermal (synchrotron) emission associated with collimated bipolar and jet-like outflows (e.g. O’Brien et al. 2006; Woudt et al. 2009; O’Brien et al. 2015). As recurrent novae are prime candidates for the progenitors of type Ia supernovae, questions surrounding the nature and energetics of the outflow of material during a nova outburst are at the core of the debate as to whether a white dwarf grows in mass during successive nova cycles. A representative census of Galactic novae observed at the sensitivity of SKA1-MID (including band 4 or 5) is required to determine what fraction of novae show evidence for synchrotron emission and to fully understand the processes that lead to the formation of collimated jets following a thermonuclear runaway on the surface of the white dwarf.
References:
Archibald, A., M., et al., 2009, Science, 324, 1411;
Bassa, C. G., et al., 2014, MNRAS, 441, 1825;
Blandford, R. D. & Znajek, R. L., 1977, MNRAS, 179, 433;
Blandford, R. D. & Payne, D. G., 1982, MNRAS, 199, 883;
Bonometto, S. & Rees, M. J., 1971, MNRAS, 152, 21;
Brocksopp, C., et al., 2004, MNRAS, 347, 430;
Casella, P., et al., 2010, MNRAS, 404, L21;
Coppejans, D. L., et al., 2015, MNRAS, 451, 3801;
Coppejans, D. L., et al., 2016, MNRAS, 463, 2229;
Corbel, S., et al., 2000, A&A, 359, 251;
Corbel, S., et al., 2002, Science, 298, 196;
Corbel, S., et al., 2003, A&A, 400, 1007;
Corbel, S., et al., 2004, ApJ, 617, 1272;
Corbel, S., et al., 2013a, MNRAS, 431, L107;
Corbel, S., et al., 2013b, MNRAS, 428, 2500;
Corbel, S., et al., 2015, AASKA14, 62;
Coriat, S., et al., 2011, MNRAS, 414, 677;
Dhawan, V., et al., 2000, ApJ, 543, 373;
Diaz Trigo, M., et al., 2013, Nature, 504, 260;
Drake, A. J., et al., 2014, MNRAS, 441, 1186;
Fender, R. P., et al., 1999, ApJ, 519, L165;
Fender, R. P., et al., 2000, MNRAS, 312, 853;
Fender, R. P., et al., 2003, MNRAS, 343, L99;
Fender, R. P., et al., 2004b, MNRAS, 355, 1105;
Fender, R. P., 2006, Compact stellar X-ray sources (Cambridge University Press), 381;
Fender, R. P., et al., 2015, AASKA14, 62;
Fender, R. P. & Kuulkers, E. 2001, MNRAS, 324, 923;
Gallo, E., et al., 2003, MNRAS, 344, 60;
Gallo, E., et al., 2005, Nature, 436, 819;
Gallo, E., et al., 2006, MNRAS, 370, 1351;
Gallo, E., et al., 2012, MNRAS, 423, 590;
Gallo, E., et al., 2014, MNRAS, 455, 290;
Hughes, P.A., 1991, Beams and jets in astrophysics (Cambridge University Press);
Kording, E., et al., 2008, Science, 320, 1318;
McClintock, J. E. & Remillard, R. A., 2006, Black hole binaries (Compact stellar X-ray sources), 157;
Middleton, M. J., et al., 2013, Nature, 493, 187;
Migliari, S., et al., 2003, MNRAS, 342, L67;
Migliari, S., et al., 2004, MNRAS, 351, 186;
Migliari S. & FenderR. P., 2006, MNRAS, 366, 79;
Miller, J. M., et al., 2006, Nature, 441, 953;
Miller-Jones, J. C. A., et al., 2011, ApJ, 739, L18;
Miller-Jones, J. C. A., et al., 2013, Science, 340, 950;
Mirabel, I. F. & Rodriguez, L. F., 1994, Nature, 371, 46;
Mirabel, I. F., et al., 2011, A&A, 528, 149;
Neilsen, J. & Lee, J. C., 2009, Nature, 458, 481;
O’Brien, T., et al., 2006, Nature, 442, 279;
O’Brien, T., et al., 2015, AASKA14, 62;
Papitto, A., et al., 2013, Nature, 501, 517;
Psaltis, D., 2006, Accreting neutron stars and black holes: a decade of discoveries (Cambridge University Press), 1;
Ponti, G., et al., 2012, MNRAS, 422, L11;
Rupen, M. P., et al., 2008, ApJ, 688, 559;
Seaquist, E. R., & Bode, M. F., 2008, Cambridge University Press (Classical Novae), 141;
Stirling, A. M., et al., 2001, MNRAS, 327, 1273;
Tudose, V., et al., 2009, MNRAS, 400, 2111;
Woudt, P. A., et al., 2009, ApJ, 706, 738;
Wu, Y. X., et al., 2010, ApJ, 718, 620
2.5.1.2 Ultra Luminous X-ray sources
Ultra Luminous X-ray sources (ULXs) are defined very simply as off-nuclear X-ray sources that have X-ray luminosities exceeding the Eddington luminosity for a stellar mass black hole of reasonable (10 M⊙) proportions (L1039 erg s-1). For a long time they have been supposed to contain accreting black holes, which were thought to perhaps be of intermediate mass (102-5 M⊙), which would explain the very high luminosities without invoking complicated scenarios such as super-Eddington accretion. However, thanks to the first results with NuSTAR (Bachetti et al. 2013; Walton et al. 2013), it seemed likely that the systems contained stellar mass black holes accreting above the Eddington limit. More recently, three ULXs have been shown to contain accreting neutron stars (Bachetti et al. 2014; Fürst et al. 2016; Israel et al. 2017), thanks to the detection of X-ray pulsations of these systems, thus confirming that these objects do undergo super-Eddington accretion. A number of authors have also proposed that many ULXs may therefore contain neutron stars accreting at highly super-Eddington rates (e.g. Koliopanos et al. 2017; King, Lasota & Kluźniak et al. 2017; Mushtukov et al. 2017). In addition, the extreme ULX ESO 243-49 HLX-1 (e.g. Farrell et al. 2009; Webb et al. 2010) has been shown to contain an intermediate mass black hole (IMBH) of 104 M⊙ (e.g. Webb et al. 2012; Godet et al. 2012). This means that ULXs are a very heterogeneous collection of objects. Further observations are required to elucidate their nature.
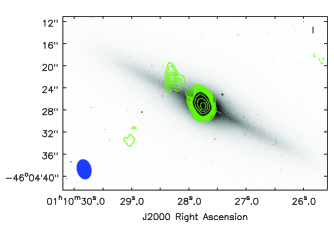
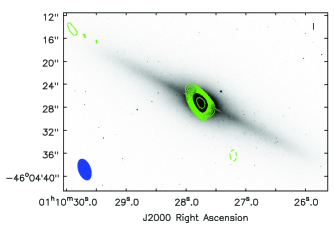
However, whatever the nature of ULXs, they are extremely useful objects to understand the growth of supermassive black holes. For those ULXs accreting above the Eddington limit, studying them should help us uncover the physical processes behind these extreme accretion rates which are thought to play an essential role in the formation of supermassive black holes that appear early on in the Universe, (e.g. Mortlock et al. 2011). There are many other open questions concerning super-Eddington accretion outlined recently by Narayan, Sadowski & Soria (2017), which could also be studied through observations of ULXs. These questions include (i) How viable is super-Eddington accretion ? (ii) What is the geometry of the accretion flow? How does it impact observations as a function of inclination angle? (iii) How luminous are super-Eddington systems? Are they radiatively efficient? (iv) How much mechanical energy do super-Eddington disks produce in outflows? What role do the outflows play in feedback? (v) How often do super-Eddington disks produce relativistic jets? How do these jets compare with blazar jets? Alternatively, supermassive black holes could grow from accretion onto intermediate mass black holes (e.g. Greene 2012, Volonteri 2012). Observing the size and the distribution of the population of IMBHs will help us probe open questions such as how are IMBHs formed and how do they evolve (Miller & Colbert 2004)?
Observations with the SKA will be essential to elucidate the nature of ULXs. Firstly, the intrinsic power of the ULX can be estimated from the optical emission-line nebulae, created from shock-ionised driven jets, outflows or disc winds and/or because of photo-ionisation from the X-ray and UV emission around the black hole (Pakull & Mirioni, 2002, 2003), where some of these show a radio counterpart. These radio nebulae can also be used to understand how outflows and photo-ionisation can play a role in the behaviour of the ULX and on its surrounding environment (Pakull & Mirioni, 2002, 2003; Roberts et al. 2003; Kaaret et al. 2004). The sensitivity (and resolution) of SKA1-MID will allow us to detect and resolve these nebulae in galaxies out to 10s of Mpc with few hours of integration time. Phase 2 of the SKA will double the distance of detecting ULX bubbles of a given luminosity with only modest telescope time per target. We will also be able to search for the presence of any compact radio source on the sub-arcsecond scale to determine if these nebulae are blown by compact jets emanating from the compact object. With quasi-simultaneous X-ray observations, using for example SVOM or Athena (see also Sect. 3), we can also estimate the mass of the black hole. This can be done using the fundamental plane of black hole activity, a correlation relating the X-ray luminosity, the radio luminosity and the mass of the black hole (e.g. Merloni et al. 2003; Körding et al. 2006; Plotkin et al. 2012).
HLX-1 was the first ULX to show jets in the same way as X-ray binaries, although they are too faint to detect in the hard state and can only be detected when discrete jet ejection events occur during the transition from the hard to the soft state (Webb et al. 2012; Cseh et al. 2015). It is very likely that HLX-1 will be detectable in the hard state with SKA1-MID, extrapolating from the radio flares detected during the hard to soft state transitions, but closer ULXs (95 Mpc away) will be much easier to detect than HLX-1 in the hard state. Other nearby ULXs have now also been seen to show radio jets close to the soft state, like XMMU J004243.6+412519 (Middleton et al. 2013) which shows radio variability on a timescale of tens of minutes (arguing that the source is highly compact). Therefore, any X-ray (using for exemple SVOM or Athena, see also Sect. 3) and radio observations of this type of sources should be contemporary in order to constrain the mass of the compact object and understand the emission mechanisms. In addition, low state/quiescent IMBHs should also have steady jets. Madau & Rees (2001) propose that there may be many IMBHs in a Milky Way type galaxy. SKA1-MID will be able to detect almost any quiescent IMBH in our Galaxy (assuming radio flux densities of Jy level). Plotting the radio luminosities against quasi-simultaneous X-ray luminosities (the fundamental plane of black hole accretion) will indicate their IMBH nature (Maccarone 2004). Identifying where IMBHs reside will give us clues as to how they were formed (Miller & Colbert 2004).
In order to identify neutron stars as the compact objects in ULXs, the clearest cut way is to detect pulsations. ULXs are by definition very bright because of the high accretion rates and to date all of the pulsations have been detected in X-ray. However, we know that ULXs can vary by factors of 100-1000 or more in X-ray luminosity (e.g. the accreting neutron star ULX, M 82 X-2, Brightman et al. 2016). Such variability could be monitored using the SVOM satellite, for example. Once the neutron star is no longer accreting at high (super-Eddington) rates, it may be possible to detect the radio pulsations, in the same way as has been done for the accreting pulsars e.g. PSR 1023+0038 (Archibald et al. 2009) or PSR J1824-2452I (Papitto et al. 2013). The wide field of view, great time resolution and sensitivity of SKA1-MID and SKA1-LOW will be essential tools to identify (or put limits on) pulsations from known ULXs and help find new pulsating neutron stars that may become ULXs later in their lives.
References:
Archibald, A. M., et al., 2009, Science, 324, 1411;
Bachetti, M., et al., 2014, Nature, 514, 202;
Bachetti, M., et al., 2013, ApJ, 778, 163;
Brightman, M., et al., 2016, ApJ, 816, 60;
Cseh, D., et al., 2015, MNRAS, 446, 3268;
Farrell, S. A., et al., 2009, Nature, 460, 73;
Fürst, F., et al., 2016, ApJ, 831, L14;
Godet, O., et al., 2012, ApJ, 752, 34;
Greene, J. E. 2012, Nature Communications, 3, 1304;
Israel, G. L., et al., 2017, Science, 355, 817;
Kaaret, P., Ward, M. J., & Zezas, A. 2004, MNRAS, 351, L83;
King, A., et al., 2017, MNRAS, 468, L59;
Koliopanos, F., et al., 2017, A&A;
Kording, E., et al., S. 2006, A&A, 456, 439;
Maccarone, T. J., 2004, MNRAS, 351, 1049;
Madau, P. & Rees, M. J. 2001, ApJ, 551, L27;
Merloni, A., et al., 2003, MNRAS, 345, 1057;
Middleton, M. J., et al., 2013, Nature, 493, 187;
Miller, M. C. & Colbert, E. J. M., 2004, International Journal of Modern Physics D, 13, 1;
Mortlock, D. J., et al., 2011, Nature, 474, 616;
Mushtukov, A. A., et al., 2017, MNRAS, 467, 1202;
Narayan, R., et al., 2017, arXiv:astro-ph/1702.01158;
Pakull, M. W. & Mirioni, L., 2002, arXiv:astro-ph/0202488;
Pakull, M. W. & Mirioni, L., 2003, RMxAC, 15, 197;
Papitto, A., et al., 2013, Nature, 501, 517;
Plotkin, R. M., et al., 2012, MNRAS, 419, 267;
Roberts, T. P., et al., 2003, MNRAS, 342, 709;
Volonteri, M., 2012, Science, 337, 544;
Walton, D. J., et al., 2013, ApJ, 779, 148;
Webb, N., et al., 2012, Science, 337, 554;
Webb, N. A., et al., 2010, A.J., 712, L107
2.5.1.3 Gamma-ray bursts
Introduction
Gamma-ray burst (GRB) afterglow studies in the radio domain provide complementary and sometimes unique diagnostics on GRB explosions and their environments. They may also allow the identification of very high redshift GRBs, possibly associated with PopIII stars. The sensitivities of MeerKAT and then SKA will hugely increase the number of radio afterglow detections. Furthermore, thanks to the wide field of view of the new and future radio arrays, it will be possible to identify GRB orphan afterglows and establish the association between gravitational waves and short GRBs.
GRBs and their radio afterglows
GRBs are among the most energetic events in the universe. Thanks to their exceptional brightness they can be used as a unique tools to retrieve information on the high redshift universe. Forty years after their discovery, their origin and physics are still to be fully understood. There are two main phases of the gamma-ray burst phenomenon: the prompt emission (occurring primarily at gamma-ray energies and lasting at most few minutes), and the afterglow (a long-lasting, multi-wavelength emission which follows the main GRB event).
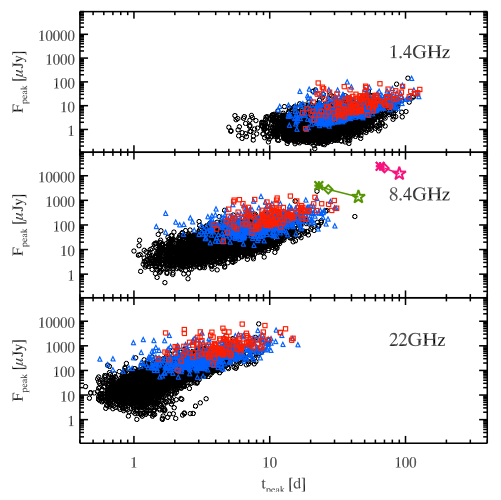
Studies of the afterglow in the radio domain provide complementary and sometimes unique diagnostics on GRB explosions and their environments. Thanks to radio observations it is possible to add information to assess which are the radiative processes at play, to determine the total kinetic power of the jet, to test the jet expansion and to determine the interstellar medium structure and density. The radio emission has the advantage (compared to optical) to peak on timescales of few days and generally to keep bright up to several tens of days after the burst (Fig. 51; the peak fluxes are weaker for larger wavelengths). Nonetheless only a few percent of radio GRB afterglows are detected with present radio instrumentation (see Chandra & Frail 2012 for a review). This is mainly due to the fact that radio GRB afterglows are usually weak (flux at peak less than 1mJy). With the new generation of radio arrays it will be possible to easily detect much weaker fluxes. Part of the ThunderKAT KSP of the SKA precursor MeerKAT is dedicated to the detection and study of GRB radio afterglows, and SKA will be able to detect systematically GRB afterglows and also their transition to the non-relativistic phase. SKA GRB afterglow observations will play a particular important role in the context of the Sino-French space mission SVOM (see Sect. 3.13). Indeed, taking also advantage of the synergy with CTA (see Sect. 3.8), it will be possible to cover the emission of SVOM detected GRB from the very high (GeV/TeV) to the very low (radio) frequencies, and therefore obtain a complete knowledge of the emission processes occurring both in the prompt and in the afterglow phases.
Very high-z GRBs
Since the peak time of radio afterglow light-curves is larger for very high-z GRBs, radio afterglow detections can pinpoint to high redshift GRBs even without optical/near-infrared afterglow observations. Moreover radio detections can also allow the identification of PopIII GRBs. This should be possible also at LOFAR frequencies. In fact, a strong radio signature is expected for GRBs originating from PopIII stars, with high peak fluxes and much larger peak times (e.g.: Toma et al. 2011), allowing us to uniquely identify them. Radio afterglows of PopIII stars (or of very bright GRBs) can also in principle be used as background sources for 21 cm absorption line detections. At very high redshift, SKA afterglow observations will play also an important role in synergy with the Athena (see Sect. 3.7) capabilities to constrain the chemical composition of Pop-III-GRB close environments, confirming the Pop-III origin of afterglows. The improved sensitivity of the future radio arrays will also make possible the detection of the radio emission of a much larger number of GRB host galaxies, allowing the direct determination of their star formation rate, important information as GRBs can be considered as direct tracer of star formation.
Orphan afterglows
The GRB emission is beamed in the direction of the jet motion. To observe the prompt GRB emission, our line-of-sight has to lie within the jet cone. However, as the jet is gradually decelerated over time, the beaming angle of the emission becomes wider (see Fig. 52) allowing the afterglow detection even for an observer not placed along the jet cone. Such an afterglow is called an orphan afterglow. In fact, on-axis GRBs are only the tip of the iceberg of the GRB population. For each GRB seen on axis, there should be hundreds of GRBs for which only the orphan afterglows can be detected. The detection of an orphan afterglow will bring independent confirmation of the jetted GRB outflow and the detailed analysis of their light curves will enable to differentiate between different jet models. The peak of the orphan afterglow will happen some tens of days after the GRB explosion. At these epochs, the afterglow spectra peak towards mm/radio frequencies. The future radio wide field surveys, especially with the ASKAP and SKA arrays, will be therefore very powerful ways to detect orphan afterglows and establish the association between gravitational waves and short GRBs (see Ghirlanda et al. 2014).
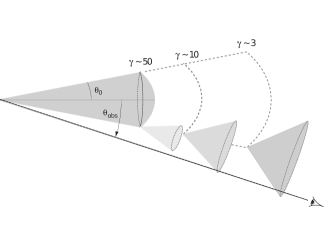
References:
Chandra, P. & Frail, D., 2012, ApJ, 746, 156;
Ghirlanda, G., et al., 2013, MNRAS, 435, 2543;
Ghirlanda, G. et al., 2014, PASA, 31, 22;
Granot, J., et al., 2005, ApJ, 630, 1003;
Toma, K., et al., 2011, ApJ, 731, 127
2.5.1.4 High Mass X-ray Binaries
“High-Mass X-ray Binaries” (HMXB) are composed of a compact object (neutron star –NS– or black hole –BH–) orbiting a luminous and massive early OB type companion star (). We distinguish 3 types of HMXB by the process of accretion, ordered here by decreasing number of systems of each class: (i) Be X-ray binaries (BeHMXB), (ii) supergiant X-ray binaries (sgHMXB), and (iii) Roche Lobe Overflow systems (RLO).
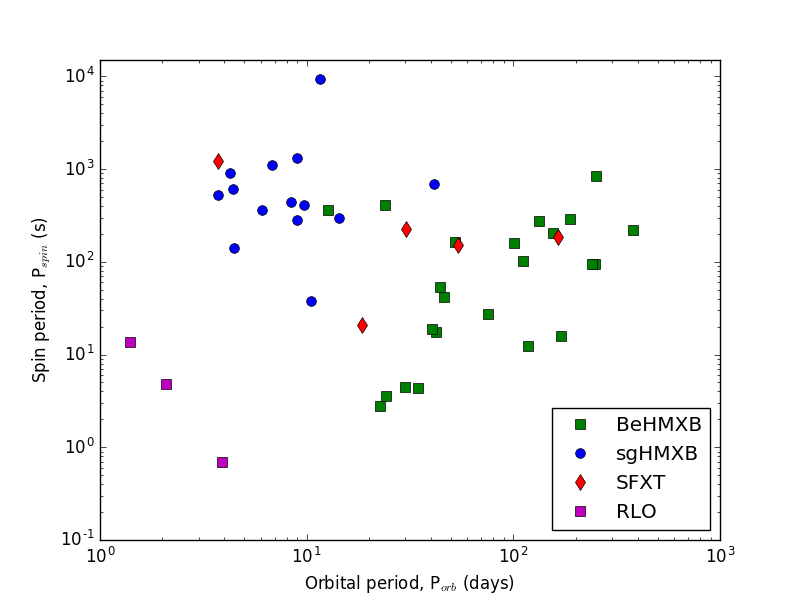
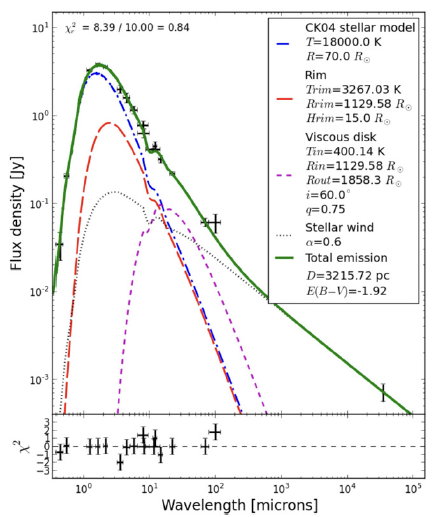
(i) Be X-ray binaries (BeHMXB) host a main sequence donor star of spectral type B0-B2e III/IV/V, a rapid rotator surrounded by a circumstellar (so-called “decretion”) disc of gas, as seen by the presence of a prominent H emission line. This disc is created by a low velocity/high density stellar wind of . Transient and bright (“Type I”) X-ray outbursts periodically occur, each time the compact object (usually a NS on a wide and eccentric orbit) approaches periastron and accretes matter from the decretion disc (see Charles & Coe 2006; Tauris & van den Heuvel 2006). These systems exhibit a correlation between the spin and orbital period, as shown by their location from the lower left to the upper right of the Corbet diagram (see Fig. 53), due to efficient transfer of angular momentum at each periastron passage: rapidly spinning NS corresponding to short orbital period systems. Apart from MWC 656 hosting a BH (Casares et al. 2014), most BeHMXB seem to host a NS.
(ii) Supergiant X-ray binaries (sgHMXB) host a supergiant star of spectral type O8-B1 I/II, characterised by a slow and dense, radiatively steady and highly supersonic stellar wind, radially outflowing from the equator. There are “classical” sgHMXB, most of them being close systems, with a compact object on a short and circular orbit, directly accreting from the stellar wind, through e.g. Bondy-Hoyle-Littleton process. Such wind-fed systems exhibit a luminous and persistent X-ray emission (), with superimposed large variations on short timescales, and a cut-off (10-30 keV) power-law X-ray spectrum. Located in the upper left part of the Corbet diagram (small orbital period days vs long spin periods s, Fig. 53), they do not show any correlation, since there is no net transfer of angular momentum. Nearly half of sgHMXB () exhibit a substantial intrinsic and local extinction , with a compact object deeply embedded in the dense stellar wind (such as the highly obscured IGR J16318-4848, Chaty & Rahoui 2012). Likely in transition to Roche Lobe Overflow, these systems are characterised by slow winds causing a deep spiral-in of the compact object, and leading to Common Envelope Phase. There exists also the possibility, for sgHMXB such as Cyg X-1, to accrete both through Roche lobe overflow and stellar wind accretion.
A significant subclass of sgHMXB is constituted of 17 (+5 candidate) Supergiant Fast X-ray Transients (SFXT, see Negueruela et al. 2006). These systems, characterised by a compact object orbiting with days on a circular or excentric orbit, and by s spin periods, span on a vast location in the Corbet diagram, mostly in between BeHMXB and sgHMXB (Fig. 53). They exhibit short and intense X-ray outbursts, an unusual characteristic among HMXB, rising in tens of minutes up to a peak luminosity , lasting for a few hours, and alternating with long ( days) quiescence at , with an impressive variability factor going up to . Various processes have been invoked to explain these flares, such as wind inhomogeneities, magneto/centrifugal accretion barrier, transitory accretion disc, etc (see Chaty et al. 2013 and references therein).
(iii) Roche Lobe Overflow systems (RLO) host a massive star filling its Roche lobe, where accreted matter flows via inner Lagrangian point to form an accretion disc (similarly to LMXB). These systems, also called beginning atmospheric Roche lobe overflow, constitute the classical “bright” HMXB (such as Cen X-3, SMC X-1 and LMC X-4), with accretion of matter occurring through the formation of an accretion disc, leading to a high X-ray luminosity () during outbursts. There are only a few sources, located in the lower left of the Corbet diagram (Fig. 53), characterised by short orbital and spin periods.
A number of 114 HMXB are reported in Liu et al. (2006), and 117 in Bird et al. (2016). By cross-correlating both catalogues, we find that the total number of HMXB currently known in our Galaxy amounts to 152 (see Fortin, Chaty & Coleiro, in prep). Therefore, adding all known LMXB and HMXB systems, HMXB represent of the total number of high energy binary systems. Among HMXB, there are 70 BeHMXB, 35 sgHMXB and 56 HMXB of unidentified nature. sgHMXB can be further divised in 25 “classical” sources and 10 SFXT. Thus, HMXB can be divided respectively in 43% of BeHMXB, 22% of sgHMXB and 35% of unidentified HMXB.
To get an idea of the flux we would detect with SKA1, we now estimate the level of emission of HMXB in the radio domain, likely dominated by the intense stellar winds emanating from early type massive stars. To take an example, let us estimate the flux of the persistent HMXB hosting an hypergiant star GX 301-2 (see discussion within Servillat et al. 2014, and Fig. 53 right). Using Equation (4) in Scuderi et al. (1998), we estimate a radio flux of 2.5 mJy at 8.6 GHz, while Pestolazzi et al (2009) have detected a flux around 1 mJy at 4.8 and 8.6 GHz with ATCA, in 1.5 hour integration. This discrepancy between the estimate and the detection level might be due either to rough understanding of the stellar wind emission, or even variability proper to this emission. Looking at the SED of GX 301-2 in Servillat et al. (2014), an extrapolation at lower frequency suggests that this source will not be detectable within SKA1-LOW bands. However, the frequencies between 4.8 and 8.6 GHz will be covered by SKA1-MID, and we estimate that we should be able to detect this signal level in a few minutes.
Such a detection with SKA1 with a continuous coverage will allow us to constrain the nature of the emission (thermal, free-free, non-thermal, synchrotron emission), and most important where it comes from: either from the stellar wind, or surrounding dust, or even from a transient accretion disk accumulating around the compact object. This integration time represents a lower limit for HMXB, as GX 301-2 is one of the brightest HMXB.
References:
Bird, A. J., et al., 2016, ApJSS, 223, 15;
Casares, J., et al., 2014, Nature, 505, 378;
Charles, P. A. & Coe, M. J., 2006, in Compact stellar X-ray sources, Cambridge University Press, 215;
Chaty, S. & Rahoui, F., 2012, ApJ, 751, 150;
Chaty, S., 2013, Advances in Space Research, 52, 2132;
Coleiro, A., & Chaty, S., 2013, ApJ, 764, 185;
Grimm, H.J., et al., 2003, MNRAS, 339, 793;
Liu, Q.Z., et al. 2006, A&A, 455, 1165;
Liu, Q.Z., et al. 2007, A&A, 469, 807;
Negueruela, I., et al., 2006, in ESA Special Publication;
Scuderi, S., et al., 1998, A&A, 332, 251;
Servillat, M., et al., 2014, ApJ, 797, 114;
Tauris, T. & van den Heuvel E.P.J., 2006, in Compact stellar X-ray sources, Cambridge University Press, 623
2.5.1.5 AGN variability
Active galactic nuclei (AGN) are supermassive black holes at the centre of galaxies that are thought to be powered by accretion (e.g. Urry & Padovani 1995). Radio-loud AGN typically exhibit relativistic outflows of matter, the so-called jets.
Variability of nuclear flux density and polarisation is a common characteristic of AGN, and occurs with multiple characteristic timescales in individual objects, from hours to days to years. Variations between different bands of the electromagnetic spectrum are often related to each other, with emission at short wavelengths (X-rays or -rays) eventually propagating to longer wavelengths, as radio, with longer timescales. Emission at different frequencies probe different physical processes occurring in different regions of the AGN central engine. Thus correlating variability over a range of radio frequencies with that seen across the electromagnetic spectrum, can provide a powerful probe of the connection between disks and jets, inflow and outflow, turbulence and shocks, and activity and quiescence.
Indeed AGN intrinsic variability exhibits both red and white noise power spectrum, as well as quasi-periodic oscillations in some cases (e.g. King et al. 2013). This may correspond to variations in accretion rate (Chatterjee et al. 2011), flares and shocks in disks and jets (Marsher 2016), or changes in Doppler boosting and jet precession (Lister et al. 2009), as well as reflect transitions between high and low states (Krauss et al. 2016).
These questions will be addressed specially through analysis of the massive data sets arising from the deep all-sky surveys with SKA1, including both total and polarimetric flux.
Long term monitoring
Long-term monitoring observations are required to sample different timescales and to allow correlations to observations at other frequencies. Day to year timescales for AGN variability correspond to the light crossing, viscous, and infall timescales of the black hole and accretion disk. The delay between X-ray and radio variations can be hundreds of days implying that long duration coordinated campaigns are required for reasonable sampling (at least several years). Due to the limited survey rate of existing radio telescopes, AGN variability has been studied in detail only for a thousand of relatively bright objects (e.g. Hovatta et al. 2007), or in only a few epochs for larger numbers of sources down to lower flux density limits.
AGN dominate the radio sky at flux densities above a milli-Jansky (Seymour et al. 2008), and synoptic surveys with SKA1 will provide precision flux measurements as a function of time with a cadence of days or less for hundreds of thousands of AGN, and thus produce an archive of variability information for a large range of AGN, alleviating the biases inherent to small sample selection.
Radio loud
Variability at radio wavelengths is most marked in powerful radio-loud AGN. The largest and most rapid variations observed in nuclear non-thermal continuum emission is seen in BL Lacs and core-dominated quasars. These variations are explained primarily by Doppler boosting of the nuclear emission by highly relativistic jets viewed at small angles to the line of sight. Flares in the radio light curves might correspond to ejection of new relativistic components or emergence of shocks in the underlying flow (e.g. Valtaoja et al. 2002; Arlen et al. 2013; Feng et al. 2017).
Population studies of gamma-ray loud and quiet AGN was possible thanks to Fermi-LAT that monitors since 2008 the entire gamma-ray sky every three hours (Atwood et al. 2009). Comparison of the gamma-ray emission to their radio properties showed that gamma-ray detected AGN have larger variability amplitudes in radio (Richards et al. 2011), faster apparent jet speeds (Lister et al. 2009), and higher Doppler beaming factors (Savolainen et al. 2010) than non-detected objects. Some studies have also reported that radio and gamma-ray luminosities are correlated (Marscher et al. 2008; Ackermann et al. 2011; Nieppola et al. 2011), but it is difficult to assess the significance of such correlations as a whole without larger samples even though this implies a connection between radio and gamma-ray variations in the sources. Moreover, the next generation very high energy Cherenkov Telescope Array (CTA) (see Sect. 3.8), in combination with SKA, will open the possibility to study the connection between TeV and radio emission in a large number of sources, probing the acceleration of particles up to the highest energies.
As a matter of fact, many existing surveys have focused on blazars, where relativistic beaming and the compact sizes of emitting regions produce more variability than in sources oriented further from the line of sight. The wide field monitoring capabilities of SKA, however, will enable light-curves from all classes of AGN to be studied, refining unification schemes and our understanding of the geometry of the emitting regions.
Radio quiet
Seyfert galaxies, classified as radio quiet (though not radio silent), are known to show variability in their continuum and line emission at X-ray, optical, and UV wavelengths, providing constraints on the variation of nuclear absorbing column, photon reprocessing, structure and dynamics of the broad-line region and ultimately the mass of the central object (ref here to put). But, although ten time more common than their radio-loud counterparts, only a small number of interesting Seyferts have been systematically monitored at radio frequencies, with some studies motivated by serendipitous discovery of radio flares (Falcke et al. 2004). Radio flares seen in III Zw 2 and Mrk 348 suggest that jets in Seyferts can accelerate from non-relativistic to relativistic speeds during an outburst, but larger samples are required to confirm this (Mundell et al. 2009). Monitoring of broad absorption line BAL-QSOs and other radio quiet objects, such as Mrk 231, has already revealed variations similar to blazars. Although large scale jets and lobes do not develop in these objects, highly energetic flares can still occur close to the core (Reynolds et al. 2013).
Less than 10% of Narrow-Line Seyfert I galaxies (NLS1s) are formally radio loud (Komossa et al. 2006). However several of them are detected in gamma rays by Fermi (Abdo et al. 2009), confirming that they indeed can also emit high energy electrons, and have prominent relativistic jets. Those also show fast variations in their radio light curves, similar to blazars (Foschini et al. 2011; D’Ammando et al. 2012). Modeling these variations can probe jet acceleration mechanisms and central engine physics (Kudryavtseva et al. 2011).
Note that in some cases (e.g. Thyagarajan et al. 2011) variable radio emission is the only indicator of AGN activity, and can provide a powerful probe of buried AGN which show no evidence of an accreting black hole at other wavelengths.
But with few examples, it is difficult to establish if the flaring is a common property in so-called radio quiet AGN. With SKA, the number of low luminosity AGN monitored will be extremely large, allowing detailed studies of the variability and comparison to blazars. This will give insights into the jet formation processes and bridge the gap between variations in jetted systems around stellar-mass black holes and the most extreme blazars.
VLBI
VLBI observations provide a direct measure of relativistic motion in AGN jets, allowing to measure intrinsic jet parameters (as velocity, Doppler factor, opening angle, inclination angle, magnetic field strength) and have the potential to locate and constrain the size of emission regions in conjunction with high energy and intermediate energy observations.
Radio observations with milli-arcsecond resolution have resolved the radio-emitting regions and measured outflow velocities from some well known AGN (e.g. Lister et al. 2013). Multi-wavelength monitoring of a few bright sources from radio to the Fermi GeV band, strongly suggests that the emission takes place at distances of several pc from the central engine, VLBI observations showing that (some) major -ray flares take place at the same time with the ejection of superluminal components from the radio core, located several pc downstream of the central engine (e.g. Marscher et al. 2010; Arlen et al. 2013), or even co-spatial with VLBI components downstream of the core (e.g. Agudo et al. 2011). At (very)high energies the angular resolution is insufficient and we must infer the size and location of the emission regions from flux variations. If gamma-ray and radio emission are triggered by shocks propagating along a relativistic jet, the time delay between flares in the two bands depends on their separation. Several studies have found time-lagged correlation between these two energy bands, but without a large sample with well-sampled light curves it is difficult to assess the significance of the correlations. Flares and superluminal blobs may be connected to changes in magnetic field on timescales of years, or to current-driven instabilities, tangled magnetic fields, or reconnection events, and the VLBI extension of SKA can help probe this (Agudo et al. 2015).
Also if flares in radio light curves correspond to ejection of new relativistic components or emergence of shocks in the underlying flow, improved monitoring and high-resolution imaging using VLBI techniques are required to confirm that radio jets are intrinsically non-relativistic during quiescence but that Seyferts, as black-hole-driven active galactic nuclei (AGN), have the capacity to accelerate relativistic jets during radio flares.
Current VLBI surveys reach milli-arcsecond resolutions, corresponding to parsec scales in AGN. Resolution of the baseline SKA-MID is an order of magnitude or so poorer but SKA2 (see Paragi et al. 2015) would enable the expansion of existing monitoring programs to much larger number of sources. Polarisation capabilities will enable identification and tracking of jet components, characterising changes in magnetic fields and their connection to flares, thus shedding light on jet composition and the interaction of jets with the ambient medium.
More elements pointing towards the strength of SKA monitoring for time domain studies of AGN can be found in Bignall et al. 2015.
References:
Abdo, A. A., et al., 2009, ApJL, 707, L142;
Ackermann, M. et al. 2011, ApJ, 741, 30;
Agudo, I., et al. 2011, ApJ, 743, L10;
Agudo, I., et al. 2015, AASKA14, 93;
Arlen, T., et al. 2013, ApJ, 762, 92;
Atwood, W. B., et al. 2009, ApJ, 697,1071;
Bignall, H., et al., 2015, AASKA14, 58;
Chatterjee, F., , R., et al. 2011, ApJ, 734, 43;
D’Ammando et al. 2012, MNRAS, 426, 317;
Falcke, H., et al. 2004, New Astronomy Reviews, 48, 1157;
Feng, Q., et al. 2017, arXiv 1708.06386;
Foschini, L., et al. 2011, MNRAS, 413, 1671;
Hovatta, T., et al. 2007, A&A, 469, 899;
King, O. G., et al. 2013, MNRAS, 436, L114;
Komossa, S., et al. 2006, AJ, 132, 531;
Krauss, F., et al. 2016, A&A, 581,130;
Kudryavtseva, N.A., et al. 2011, MNRAS, 415, 1631;
Lister, M. L., et al. 2009, AJ, 138, 1874;
Lister, M. L., et al. 2013, AJ, 146, 120;
Marscher, A. P., et al. 2008, Nature, 452, 966;
Marscher, A. P., et al., 2010, ApJ, 710, L126;
Mundell, C., et al. 2009, ApJ, 703, 802;
Nieppola, E., et al. 2011, A&A, 535, 69;
Paragi, Z., et al. 2015, AASKA14, 143;
Reynolds, C., et al. 2013, ApJL, 776, L21;
Richards, J. L., et al. 2011, MNRAS, 438, 3058;
Savolainen, T., et al. 2010, A&A, 489, L33;
Seymour, N., et al. 2008, MNRAS, 386, 1695;
Thyagarajan, N., et al. 2011, ApJ, 742, 49;
Valtaoja, E., et al. 2002, PASA, 2002, 19, 117;
Urry, M., & Padovani, P., 1995, PASP, 107,803
2.5.1.6 Supernovæ
Supernovæ (SNe) are among the most energetic events in the universe. They can release up to a few ergs in the interstellar medium in form of fast stellar ejecta and radiation. There are two types of supernova (SN): Type Ia SN, events produced by the thermonuclear explosion of an accreting white dwarf, core-collapse SNe, events associated with the death of stars more massive than 8 . Radio observations are essential for many aspects of supernova physics especially to what concerns the investigation of the circum-stellar medium (CSM) properties, SN shock dynamics, energetic particles acceleration.
Type Ia supernovæ
Actually no type Ia SN has been detected yet at radio wavelength. Hence, the high sensitivity of SKA should allow to discover and follow in time the radio emission of such objects. SKA-MID configuration already reaches flux limits below some most luminous type Ia SNe like SN 2014J or SN 2011fe. SNIa radio detection will help to identify the configuration of the stellar system prior to the explosion: either a double or a single degenerate. Radio emission is expected from a single degenerate case as a probe of the CSM matter deposited by the companion star (Wang et al. 2015).
Core-collapse supernovae-CCSNe
CCSNe present a vast variety of sub-types from type IIP SNe (about half of the SNe), type IIL, IIb, Ib/c, IIn (see Smith 2014 for details). At present, about 50 SNe have been detected and then follow in time at radio wavebands (Weiler et al. 2002; Perez-Torres et al. 2014). SKA with its improved sensitivity at different wavelengths and combining detection in its pointed and survey modes is expected to detect several thousands of CCSNe (Perez-Torres et al. 2014) up to a redshift for the most intense IIn SNe. With the advent of SKA the community will be able to start statistical analysis of CCSNe properties depending of their subclass type.
SKA will also be able to monitor the closest and most intense events as it was already done with the VLA for emblematic objects like SN1987A and SN1993J (see Fig. 54). Time evolution of the radio spectrum is of particular importance to understand shock dynamics, magnetic field generation, particle acceleration in different CSM environments. These issues are intimately related to the problem of the origin of cosmic rays and make these observations particularly relevant to trigger multi-wavelength observation campaigns involving high-energy instruments like the X-ray satellites XMM-Newton or Chandra and gamma-ray telescopes like the future Cerenkov Telescope Array.
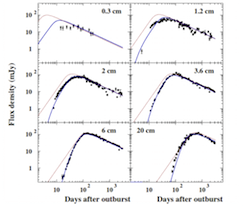
References:
Perez-Torres, M., et al., 2015, AASKA14, 60;
Smith, N., 2014, ARA&A, 52, 478;
Tatischeff, V., 2009, A&A, 499, 191;
Wang, L., et al., 2015, AASKA14, 64;
Weiler, K. W., et al., 2002, ARA&A, 40 387;
Weiler, K. W., et al., 2007, ApJ 671 1959
2.5.2 Fast transients
2.5.2.1 Fast Radio Bursts
Fast Radio Bursts (hereafter FRBs) are bright, millisecond-duration transient phenomena detected in the radio. The first FRB was detected in 2007 in archival data recorded as part of a 1.4-GHz survey for pulsars with the 64-m Parkes radio telescope, in Australia (Lorimer et al. 2007). A little more than 20 have now been discovered in data from several radio telescopes around the world, at 1.4 and 0.8 GHz888A catalog of FRBs is available at: http://www.astronomy.swin.edu.au/pulsar/frbcat/. (Petroff et al. 2016). Similarly to radio signal from pulsars, observed bursts are dispersed by the ionised plasma following the classical DM frequency-time relation, where DM (the “Dispersion Measure”) represents the integrated density of free electrons along the line-of-sight. The large DM values of FRBs seen so far range from about 300 cm-3 pc to well above 1000 cm-3 pc. Among other arguments, this suggests an extragalactic origin for the FRBs, although the exact phenomenon producing them is still actively debated. Proposed theories invoke superflares from soft gamma repeaters (e.g. Popov & Postnov 2007), supergiant pulses from distant pulsars (e.g. Cordes & Wasserman 2016), Alfvén waves from bodies orbiting a pulsar (Mottez & Zarka 2014), to name but a few examples (see e.g. Katz 2016 for a review). The identification of FRB progenitors is further complicated by the fact that, unlike bursts from pulsars, FRBs do not appear to repeat. One notable exception is FRB 121102, seen to repeat by several radio telescopes (e.g. Spitler et al. 2016) including the Nançay Radio Telescope (see below). This enabled the association of the FRB with a dwarf galaxy at a distance of 1 Gpc (Chatterjee et al. 2017). However, it is unclear whether FRB 121102 is typical of other FRBs, since it is the only one seen to repeat until now. In any case, the firm identification of an FRB with a known object would certainly dramatically improve our understanding of this phenomenon.
Independently of their exact nature, the brightness and short durations of FRBs make them very useful astrophysical tools. For example, the dispersion measures of a large number of FRBs could be used to address the “missing” baryon problem, in the low redshift Universe. The scattering-induced smearing of FRB signals could be used to probe the turbulent intergalactic medium. Another potential application of the detection of a population of FRBs with high measured redshifts, is the study of the geometry of the Universe, via a model for the average electron density as a function of redshift. We refer the reader to the review by Macquart et al. (2015) and references therein, for additional details on these various potential studies and further possible applications. In addition to being extremely interesting phenomena in themselves, FRBs also are valuable cosmic probes.
Current and planned efforts to observe FRBs at Nançay
The majority of FRBs seen thus far have been detected by analysing data from 1.4-GHz observations conducted with the Parkes radio telescope, often as part of the High Time Resolution Universe (HTRU) pulsar survey (see for instance Champion et al. 2016). FRB 121102 (discussed above), discovered at 1.4-GHz at Arecibo, was the first FRB not detected at Parkes (Spitler et al. 2014); and the discovery of FRB 110523 with the Green Bank Telescope at about 0.8-GHz demonstrated that FRBs can be seen at these lower frequencies (Masui et al. 2015). Recently, Caleb et al. (2017) reported the discovery of three FRBs in a survey of the southern sky at 0.8-GHz with the Molonglo Observatory Synthesis Telescope. It will be particularly interesting to see how many FRBs CHIME, currently in construction in Canada, will detect between 0.4 and 0.8-GHz, and also if instruments such as MWA and LOFAR will be able to detect FRBs despite the strongly dispersed and scattered signals at these very low radio frequencies (note that a search for FRBs at 145-MHz using LOFAR stations in France and in the UK resulted in no detection, see Karastergiou et al. 2015 for details). The estimated FRB rate based on the population seen so far is of several thousands FRBs per sky and per day (see e.g. Champion et al. 2016).
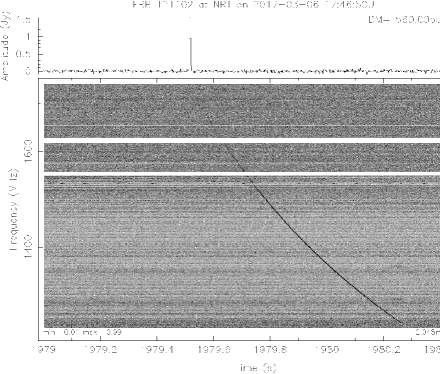
A survey for pulsars similar to HTRU is being conducted with the Nançay decimetric Radio Telescope (NRT) in France, at 1.4-GHz (Desvignes et al. 2013). No FRB has yet been found in the data from this pulsar survey. However, observations of the repeating FRB 121102 have revealed bright detections (see Fig. 55 for an example). At lower radio frequencies (below 100 MHz), Zarka & Mottez (2016) simulated observations of FRBs with NenuFAR, a new telescope currently under construction at Nançay recognised as a pathfinder to SKA, and argued that it should be able to detect these transients provided they exist at these frequencies. If successful, such observations will give crucial information on FRB emission spectra and on the intergalactic medium. They will also be very useful for estimating the expected detection rate of future instruments operating at these low frequencies, such as SKA1-LOW (see below).
FRBs in the SKA era
With its dramatically increased sensitivity compared to present day radio telescopes, its large field-of-view and multi-beaming capabilities, and its continuously active transient detection systems, the SKA will be a wonderful FRB monitor. While current FRB searches yield a few detections per year, searches with SKA1-MID at GHz frequencies could for instance enable the discovery of several FRBs every week (see e.g. Macquart et al. 2015). Searches with SKA1-LOW below 350 MHz, although hampered by the much higher dispersion of the radio emission, may also yield large numbers of FRB detections. A much increased FRB population uncovered by the SKA will likely make it possible to characterise the FRB phenomenon in detail and use them as cosmological probes. The Orléans-Nançay group has a long experience in pulsar searches and is now conducting FRB searches with the NRT. The LUTh group at the Paris Observatory has been exploring possible theories for the nature and emission properties of FRBs. NenuFAR observations will be valuable for exploring FRB very low frequency emission. The French community is therefore ideally placed to contribute to FRB observation efforts with the SKA.
References:
Lorimer, D. R., et al., 2007, Science, 318, 777;
Petroff, E., et al., 2016, PASA, 33, 45;
Popov, S. B., & Postnov, K. A., 2007, arXiv:0710.2006;
Cordes, J. M. & Wasserman, I., 2016, MNRAS, 457, 232;
Mottez, F. & Zarka, P., 2014, A&A, 569, 86;
Katz, J. I., 2016, Modern Physics Letters A, 31, 14;
Spitler, L. G., et al., 2016, Nature, 531, 202;
Chatterjee, S., et al., 2017, Nature, 541, 58;
Macquart, J. P., et al., 2015, AASKA14, 55;
Champion, D. J., et al., 2016, MNRAS, 460, 30;
Spitler, L. G., et al., 2014, ApJ, 790, 101;
Masui, K., et al., 2015, Nature, 528, 523;
Caleb, M., et al., 2017, MNRAS, 468, 3746;
Karastergiou, A., et al., 2015, MNRAS 452, 1254;
Desvignes, G., et al., 2013, Proc. IAU 291, 375;
Zarka, P. & Mottez, F., 2016, Proc. SF2A meeting
2.5.2.2 GW event follow-up
Introduction
SKA and its precursors can play a unique role in identifying the electromagnetic counterparts of gravitational wave (GW) events. An optimised observational strategy is fundamental to this purpose.
Electromagnetic counterparts of GWs form merging of neutron stars
Even if to date GWs have been detected only from the merging of black hole binary systems, it is predicted that the Advanced LIGO/Virgo interferometers will also detect GWs coming from the merging of neutron stars. To fully exploit the huge scientific outcome of such detections it is necessary to identify the electromagnetic (EM) counterpart emission associated with the GW event. Many are the hints that the class of short GRBs (i.e.: GRBs having a duration of their prompt emission of less than 2 s; see Sect. 2.5.1.3) is associated with the merging of neutrons stars. Indeed, there are some evidences for the detection of kilonova explosions (predicted for neutron star merging) after short GRB explosions. Short GRBs and kilonova emission are the best candidates as GW EM counterparts.
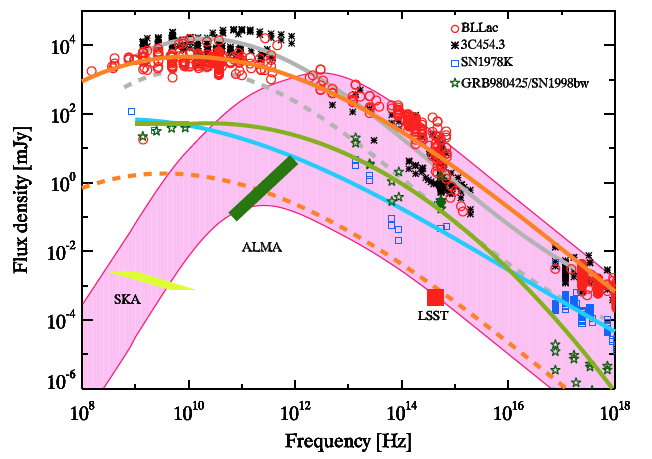
The detection of EM counterparts by SKA and SKA precursors
The error regions associated with a GW detection are and will be very large (from hundreds of degree2 to degree2). This situation makes the identification of the EM counterpart particularly challenging, also because of the high number of transient phenomena in the Universe. The radio emission of the candidate counterparts can play a key role in disentangling which is the event associated with the GW detection (see e.g. Fig. 56).
The future radio wide field surveys, especially with the ASKAP and SKA arrays, will make a step forwards in detecting the orphan afterglows (see Sect. 2.5.1.3) also of short GRBs. As orphan afterglow are believe to be hundreds of time more frequent than on-axis GRBS (see Sect. 2.5.1.3), their detection is a key to find EM counterparts of GWs. Due to its frequency range, it is not clear if LOFAR and NenuFAR can also play a role in this sense (see Vergani & Chassande-Mottin 2015).
The ThunderKAT group of the SKA precursor MeerKAT is focussing its effort also to the search of EM counterparts of GW events, with an observational strategy aiming at detecting the emission coming from GRB afterglows and kilonovæ (see also Hotokezaka et al. 2016).
The information coming from the GW detection itself can be particularly important to set the observational strategy. Indeed, as shown by Salafia et al. 2017, such optimised strategy is able to reduce by a factor of ten the time needed to observe and detect the source, and increase the success of detections as, following this strategy, the observation of the counterparts will take place at epochs at which the source is still enough bright to be detected.
References:
Ghirlanda, G., et al., 2015, A&A, 578, 71;
Hotokezaka, K., et al., 2016, ApJ, 831, 190;
Salafia, O.S., et al., 2017, ApJ submitted;
Vergani, S.D. & Chassande-Mottin, E., 2015, SF2A-2015: Proceedings of the Annual meeting of the French Society of Astronomy and Astrophysics. Eds.: F. Martins, S. Boissier, V. Buat, L. Cambrésy, P. Petit, pp.253-256
2.5.2.3 Neutron stars magnetosphere and wind
With its unprecedented sensitivity, SKA will increase the number of detected radio-pulsars by one order of magnitude. We expect to observe about 10.000 pulsars or more, offering a high quality sample of neutron star population to investigate the still unsolved fundamental physics problem of their coherent radio emission. SKA will be able to diagnose the plasma regime given useful insight into the magnetosphere and identify the possible sites of radio wave generation.
Amazingly, even after almost fifty years of intensive activity, our current understanding of the pulsar machinery stays on a rather low basic level. Apart from being a strongly magnetised rotating neutron star, further claims remain almost pure speculation. This is widely due to the lack of modeling based on a self-consistent use of first principles of electrodynamics, leaving our knowledge in an unsatisfactory state.
According to current wisdom, the low-frequency spectrum of pulsed emission is required to be a coherent emission mechanism able to radiate very efficiently in the radio-band because the brightness temperature is much too high, larger than K which is unphysical. The details of this radio-wave generation are still unclear and highly debated within the community. The location of the emission region is also loosely constrained by observations so far. However, due to its large bandwidth and sensitivity, extending from 50 MHz up to 14 GHz (albeit the 1.65 - 5GHz band remains uncovered), the theory of radio emission will be underpinned by SKA measurements and eventually fully understood. Detailed analysis of single pulses observations achievable with SKA should unequivocally unveil the radio mechanism and open a new window on pulsar variability, beyond stationary models of their magnetospheres.
Synergies with high energy emission physics
The discovery of more than 200 gamma-ray emitting pulsars, including the doubling of the number of known millisecond pulsars, has opened a new era in the field. The abundance of measurements in the broadband spectrum, e.g., light curves and pulse profiles, radio polarisation of single pulses, time lag between radio and high energy pulses, have brought unprecedented constraints on high-energy emission models. The acceleration and emission zones can no longer be confined to the polar caps, but have to be pushed towards the outer magnetosphere, close to, or even beyond the light-cylinder in the wind. In addition, the magnetosphere can no more be considered as purely vacuum or force-free, but resistive (Kalapotharakos et al. 2014). Significant contributions have been made by the French community to these recent advances. On the observational side, the synergy between radio and gamma-ray astronomers, working with the Nançay radio telescope and the Fermi-LAT (e.g. Abdo et al.2009, 2013), has been instrumental in the discoveries. In the phenomenological field, important results have been achieved through both analytical and numerical modeling works, e.g., the striped wind model (e.g., Pétri 2016a) and the PIC999Particle In Cell simulations (e.g., Cerruti et al.2016). These efforts should continue in the SKA era, in conjunction with the Fermi-LAT (of which the extension on the long term is likely), and the CTA observatory, where the French researchers are heavily involved.
Giant Radio Pulses (GRP)
Giant radio pulses have an amplitude typically 1000 times above regular radio pulses, but their duration is much shorter from a few nanoseconds to a few microseconds. They are seen only in a handful of pulsars and they are (so far) not correlated with optical, X, and gamma ray observations, neither with any properties of their host, apart from a high magnetic field at the light cylinder (Cognard et al.1996). Theories include solitons (Mikhailovskii et al.1985), scattering of photon beams of different frequencies (Petrova 2004), magnetic reconnection near the light cylinder (Lyutikov 2007), modulational instability (Weatherall 2001). Thanks to its high sensitivity and wide spectral range, SKA will allow a characterisation of the instantaneous spectra of galactic GRPs and help for the first time to discriminate the various models. For instance, (Lyutikov 2007) has shown that the Crab GRPs observations (e.g. Hankins 2007) are compatible with L-O mode triggered by magnetic reconnection in the equatorial region of the light cylinder. Because the L-O mode has a lower cut-off frequency, the extension toward lower frequencies of the emission band spectrum could confirm or invalidate this theory. Beyond the problem of waves in the magnetosphere, SKA observations will give clues to the important question of the dissipation of magnetic energy (here through reconnection) in the pulsar magnetosphere. SKA will also allow for the first time search for giant pulses in other Local Group galaxies. The expected better statistics will help tracing the history of massive star formation in other galaxies (Kondratiev et al.2013), and in the same time provide constraints on the inter-galactic medium through the analysis of propagation properties (see e.g. Sect. 2.3.10).
Magnetic field topology
The great precision and the detailed observations coming from current telescopes forces our modeling of pulsars to be increasingly refined, including general-relativistic and quantum electrodynamics effects. Such corrections largely underestimated in past works, become more popular to theoreticians because these effects clearly demonstrate their inevitable usefulness to understand pulsar magnetospheres.
A fundamental issue about neutron star magnetosphere concerns the question of the magnetic field topology. Until very recently, pulsar light-curves have been exclusively computed according to a dipole magnetic field structure, which is moreover located exactly at the centre of the star. Such assumption is highly restrictive and difficult to justify as it is a very special case very unlikely to occur in nature. This led Pétri (2016b) to relax this assumption by assuming a off-centred dipole. Such geometry induces higher order magnetic multipoles that can be computed analytically (Pétri 2015). Small scale magnetic field structures (Harding & Muslimov 2011) as well as general relativity (Philippov et al.2015; Belyaev & Parfrey 2016) are required to enhance the pair creation rate around the polar caps. Such distortions from the standard view of a dipole impact strongly on the phase-resolved polarisation properties and are under scrutiny by French theoreticians.
Polarisation
Guided by near future measurements of X-ray polarisation emanating from neutron stars as performed by the IXPE mission (Imaging X-ray Polarimetry Explorer), for a launch expected in 2020, in addition to observations available in optical polarisation and the advent of the SKA project, the French community is highly motivated by a thorough multi-wavelength study of the phase-resolved polarisation properties of pulsed emission. Accurate fitting of pulse profiles polarisation have already been performed for the Crab in optical (Pétri 2005) and predictions made in X-rays (Pétri 2013) in the frame work of the striped wind. polarisation can severely constrain competing emission models (polar cap, slot gap, striped wind) as demonstrated by (Dyks et al.2004). In the radio band, the plethora of observations concerning polarised emission of hundreds of pulsars still suffers from a lack of convincing explanations by a unique and reliable model. The quantity and complexity of the data collected in radio does not allow a synthetic description of these observations. Nevertheless, radio polarisation is a crucial and complementary aspect of optical/X-ray/gamma-ray observations to constrain the polar cap geometry (Radhakrishnan & Cooke 1969). Radio astronomy is at the dawn of a new era with SKA. An off-centred dipole generates a clear and distinctive radio-polarisation signature (Pétri 2017) very different from the traditional rotating vector model (Radhakrishnan & Cooke 1969). Single pulse observations acquired by SKA will alleviate the degeneracy in the determination of the magnetosphere geometry.
References:
Abdo, A. A., et al., 2009, Science, 325, 848;
Abdo, A. A., et al., 2013, ApJS, 208, 17;
Belyaev, M. A. & Parfrey, K., 2016, ApJ, 830, 119;
Cerutti, B., et al., 2016, MNRAS, 457, 2401;
Cognard, I., et al., 1996, ApJL, 457, L81;
Dyks, J., et al., 2004, ApJ, 606, 1125;
Hankins, T. H. & Eilek, J. A., 2007, ApJ, 670, 693;
Harding, A. K. & Muslimov, A. G., 2011, ApJ, 726, L10;
Kalapotharakos, C., et al., 2014, ApJ, 793, 97;
Kondratiev, V., et al., 2013, IAUS, 291, 431;
Lyutikov, M., MNRAS, 2007, 381, 1190;
Mikhailovskii, A. B., et al., 1985, Soviet Astronomy Letters, 11, 78;
Petrova, S. A., 2004, A&A, 424, 227;
Philippov, A. A., et al., 2015, ApJL, 815, L19;
Pétri, J. & Kirk, J. G., 2005, ApJL, 627, L37;
Pétri, J., MNRAS, 2011, 412, 1870;
Pétri, J., MNRAS, 2013, 434, 2636 ;
Pétri, J., MNRAS, 2015, 450, 714;
Pétri, J., J.Pl.Ph., 2016a, 82, 635820502;
Pétri, J., MNRAS, 2016b, 463, 1240;
Pétri, J., MNRAS, 2017, 466, L73;
Radhakrishnan, V. & Cooke, D. J., 1969, ApL, 3, 225;
Weatherall, J. C., 2001, ApJ, 559, 196
2.5.2.4 Cosmic rays
Extensive atmospheric air showers (EAS) induced by cosmic rays (CRs) emit radio pulses with a duration of tens of nanoseconds which illuminate areas of km2 scale on the ground. These radio signals can be used to infer the CR arrival direction, energy and mass composition. The mass composition in particular is a very important quantity to study the origin and propagation of high energy CRs, which in spite of many decades of research are still among the great open questions in astroparticle physics.
Several experiments are currently exploring the radio signal of EAS. At LOFAR, high-precision mass composition measurements based on CR radio detection are currently being performed in the 1017–1018 eV range (Buitink et al. 2016). The Auger Engineering Radio Array (AERA), located at the Pierre Auger cosmic ray observatory in Argentina, performs radio measurements up to energies of eV, but with a much sparser antenna spacing than LOFAR, making the determination of the particle mass much more challenging (Gaté et al. 2016). CODALEMA at Nançay is exploring various solutions to enrich and to improve the radio detection technique such as detecting on very large frequency band (2 - 200 MHz), pining down a new low frequency signal, improving the CR self-triggering system (Dallier et al. 2015). In the future, due to the large area of its core and its wide frequency coverage of 50-350 MHz, SKA-LOW will be very well-suited to perform high-precision CR composition measurements in the full energy range of 1017–1019 eV (Huege et al. 2016). This is the energy range in which the transition from galactic to extragalactic cosmic rays is expected. High-precision CR measurements with SKA-LOW can significantly improve our understanding of CR physics in this transition region, e.g. by disentangling individual CR mass groups such as proton, helium, silicon and heavier particles. Finally, combining the expertise on CR detection and the tremendous amount of antennas, SKA might be a unique opportunity to search for and exploit in a beam-formed mode the radio counterpart of the gamma-ray induced air showers of identified gamma-ray sources.
As it has already been shown at LOFAR, on a digital radio telescope observations of atmospheric air showers can run fully concurrently with other observation modes such as imaging. However, for this it is necessary to shortly buffer all raw data of the SKA-LOW core antennas in ring buffers. Upon an external trigger provided by a particle detector array, a few microseconds of the raw (waveform) data of the individual antennas need to be stored for analysis. As the arrival direction of CRs is unknown a priori, pre-beamformed data is not suitable for CR studies through atmospheric air showers. The low-RFI environment of the SKA might also allow triggering from the pulsed radio signals themselves without the need to deploy a particle detector array.
The authors of this proposal are the promoters of the CODALEMA experiment at the Nançay radio observatory, dedicated since 2002 to the radio detection of cosmic ray air showers (Torres-Machado, 2013). Since 2014, together with an European team of researchers from Germany and Netherlands, they propose to use the NenuFAR telescope, completely surrounded by the CODALEMA detectors and which could be externally triggered on a cosmic ray signal detected by CODALEMA, to serve as a pathfinder for the SKA-EAS operating mode (Dallier, 2015). They are involved in the “SKA Focus Group” on cosmic ray physics, and have submitted several contributions to the future SKA design and programs including the possibility to test the concepts in Nançay (Huege et al. 2014). The physics goals of this observing program have been extensively presented in several conferences (Huege 2014, 2015 and 2016).
References:
Buitink, S., et al., 2016, Nature 531, 70;
Gaté F., for the Pierre Auger Collaboration, 2016, 7th International Conference on Acoustic and Radio EeV Neutrino Detection (ARENA 2016), Groningen, The Netherlands;
Dallier, R., et al., 2015, 34th ICRC, The Hague, Netherlands;
Huege, T., et al., 2016, 7th International Conference on Acoustic and Radio EeV Neutrino Detection (ARENA 2016), Groningen, The Netherlands;
Torres-Machado, D., et al., 2013, (CODALEMA Coll.), 33rd ICRC, Rio de Janeiro, Brazil;
Huege, T., et al., 2015, AASKA14, 148;
Huege, T., et al., 2015, 34th ICRC, The Hague, Netherlands
2.6 Fundamental physics
S. Babak [Astroparticule et Cosmologie APC, Université Paris Diderot, CNRS/IN2P3, CEA/IRFU, Observatoire de Paris, Sorbonne Paris Cité, Paris, France], L. Blanchet [Sorbonne Universités, UPMC Univ Paris 6 et CNRS, UMR 7095, Institut d Astrophysique de Paris, Paris, France], P. Charlot [Laboratoire d astrophysique de Bordeaux, Université de Bordeaux, CNRS, Pessac, France], I. Cognard [LPC2E, CNRS, Université d’Orléans, Orleans, France], A. F. Fantina [Institut d’Astronomie et d’Astrophysique, CP-226, Université Libre de Bruxelles (ULB), Brussels, Belgium;Grand Accélérateur National d’Ions Lourds (GANIL), CEA/DRF CNRS/IN2P3, Caen, France], L. Guillemot [LPC2E, CNRS, Université d’Orléans, Orleans, France;Station de Radioastronomie de Nançay, Observatoire de Paris, PSL Research University, CNRS, Univ. Orléans, Nançay, France], F. Gulminelli [Université de Caen, ENSICAEN and CNRS, UMR6534, LPC, Caen, France], S. Lambert [SYRTE, Observatoire de Paris, PSL Research University, CNRS, Sorbonne Universités, UPMC Université Paris 06, LNE, Paris, France], A. Le Tiec [LUTh, Observatoire de Paris, PSL Research University, CNRS UMR 8109, Université Pierre et Marie Curie, Universit é Paris Diderot, Meudon, France] J. Margueron [Institute for Nuclear Theory, University of Washington, Seattle, Washington, USA;Institut de Physique Nucléaire de Lyon, CNRS/IN2P3, Université de Lyon, Université Claude Bernard Lyon 1, Villeurbanne, France], J. Novak [LUTh, Observatoire de Paris, PSL Research University, CNRS UMR 8109, Université Pierre et Marie Curie, Universit é Paris Diderot, Meudon, France], M. Oertel [LUTh, Observatoire de Paris, PSL Research University, CNRS UMR 8109, Université Pierre et Marie Curie, Universit é Paris Diderot, Meudon, France], A. Petiteau [Astroparticule et Cosmologie APC, Université Paris Diderot, CNRS/IN2P3, CEA/IRFU, Observatoire de Paris, Sorbonne Paris Cité, Paris, France], G. Theureau [LPC2E, CNRS, Université d’Orléans, Orleans, France;Station de Radioastronomie de Nançay, Observatoire de Paris, PSL Research University, CNRS, Univ. Orléans, Nançay, France;LUTh, Observatoire de Paris, PSL Research University, CNRS UMR 8109, Université Pierre et Marie Curie, Universit é Paris Diderot, Meudon, France],
2.6.1 Pulsar timing arrays as gravitational wave detectors
The timing of an array of stable millisecond pulsars (PTA) works as a Galactic sensor for gravitational wave direct detection in the frequency regime from nHz to Hz. It is complementary to ground based (LIGO-Virgo, Hz-kHz) and future spatial (LISA, mHz) interferometers. This technique is the unique one probing the emission of the supermassive black hole binary (SMBHB) population that was formed in the hierarchical large scale structure and galaxy building scenario. Thanks to the tremendous results from LIGO-Virgo announced in 2016, we now know that gravitational waves exist. Even though PTAs have yet produced only upper limits on the nHz background or individual sources gravitational radiation, the recent results start to constrain models of structure formation, the growth of the galaxy central black hole and the migration rate of the black hole binaries formed in mergers towards the gravitational wave emission regime. With improving radio telescope detectors and data analysis techniques, a detection is expected within the coming 5-10 years with the current generation of instruments, while we will have to wait for SKA1 to fully confirm preliminary detections, identify and characterise the sources and their spectrum.
NRT, EPTA and IPTA.
The ”pulsar group” in Orléans (LPC2E, CNRS), associated with the scientific exploitation of the decimetric Nançay Radio Telescope (NRT) and with the construction of a new low frequency compact array NenuFAR in France, has been one of the founding members of the European Pulsar Timing Array (EPTA). This consortium was created in 2006 in a kick off meeting in Paris Observatory, and it gathers scientific teams associated with the five 100-m class radio telescopes of the continent: Jodrell Bank, UK, Westerbork, NL, Effelsberg, Ger, Cagliari, It, Nançay Radio Telescope (NRT), Fr. Pulsar timing observations represent a large fraction of telescope time at all these facilities, with a total amount of more than 3000 hours dedicated per year, since the start of the project. EPTA members are collaborating for upgrading dedicated pulsar backends with state of the art techniques and they participate actively to receiver developments at each telescope. In this respect, NRT is equipped with one of the most productive (60% of European timing data in the period 2006-2017) and most precise timing instrumentation in the world (NUPPI back-end, Desvignes et al. 2011). Its pioneering development of coherent pulsar dedispersion on wide frequency band in L and S domains (currently 512 MHz, 2 GHz of bandwidth in preparation) make the French group one of the leaders in the field. The European collaboration has also been the framework for the LEAP-ERC experiment, demonstrating the feasibility of a continental phased array of the five 100-m class telescopes and its optimisation for pulsar timing. This composite radio telescope reaches the same sensitivity as the Arecibo dish, but on a much greater area on the sky (Bassa et al. 2016).
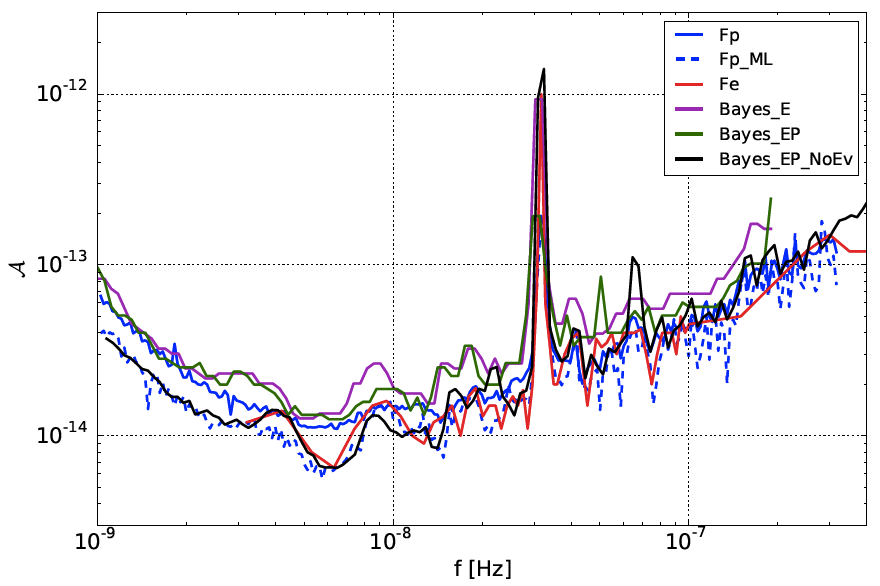
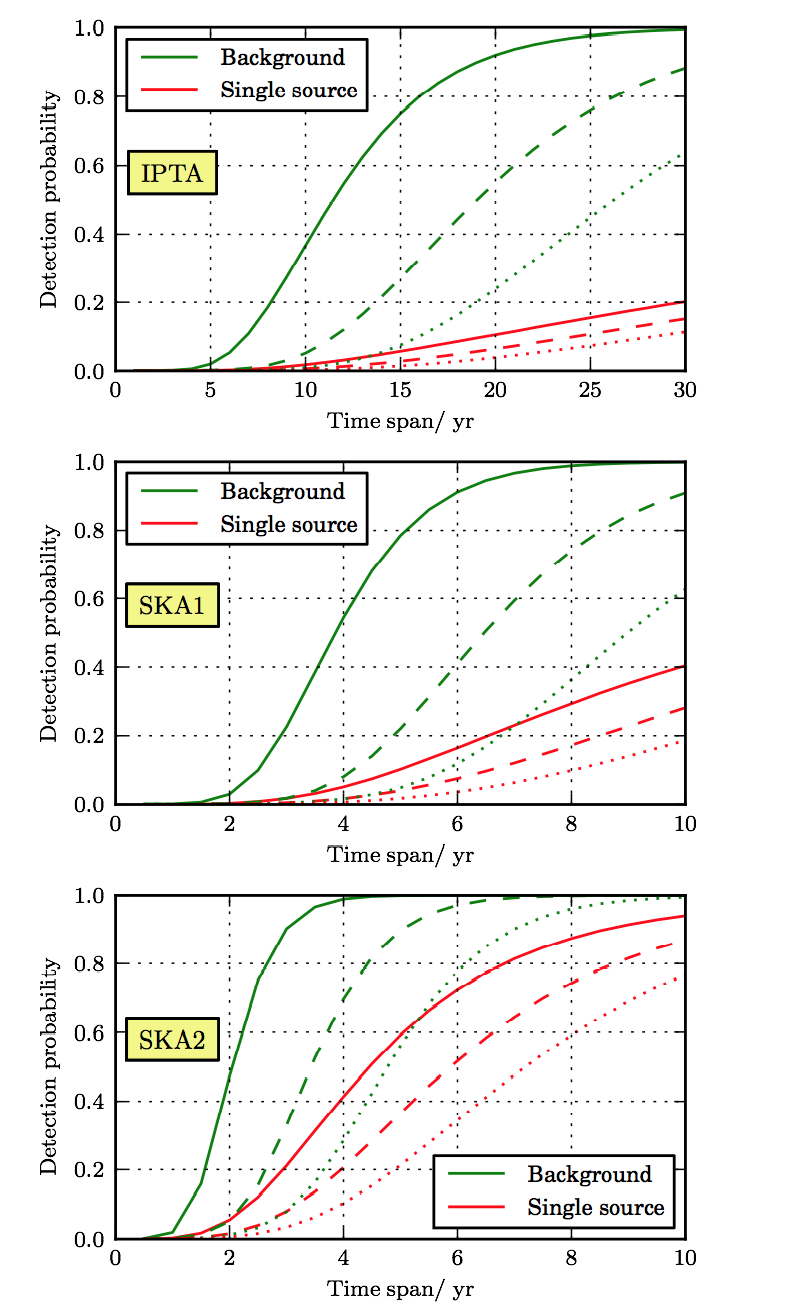
At the world wide level, the International Pulsar Timing Array (IPTA) is presently made of the contributions of the three continental consortia: EPTA in Europe, PPTA in Australia and NanoGRAV in the US. With the development of FAST in China, of MeerKAT in South Africa, and the recent evolutions of the GMRT in India, it will rapidly include new groups around the planet. This consortium, with its long term program and world wide organisation, is the cornerstone of the pulsar SKA Science Working Group (SSWG), and make it one of the most structured Science Groups of the SKA organisation. The authors of this section are involved at different level in this international structure: members of the SSWG, members of the EPTA steering committee and IPTA board, Co-Is of the TRAPUM and MeerTime key projects with the SKA precursor MeerKAT.
Gravitational astronomy with PTA in the SKA context.
In 2015 and 2016, in phase with a first massive data release (11 years times series, Desvignes et al. 2016; Caballero et al. 2016), the French NRT team and EPTA/IPTA collaborations have produced a first set of long term results, with a major impact on the gravitational emission in the nHz regime and on the population of supermassive black hole binaries (e.g. Lentati et al. 2015; Babak et al. 2016; Taylor et al. 2015; Verbiest et al. 2016; Lentati et al. 2016). In the meantime, the results from a large set of short term projects have been published, led by the young scientists among the collaboration and based on individual source astrophysics and gravity tests in binaries (5-10 publications/yr; see Sect. 2.6.2).
For high precision timing, SKA will both bring a leap in sensitivity and versatility. The SKA survey will provide us with a large number of new stable millisecond pulsars (1500 MSPs expected with SKA1). The gain in signal to noise ratio (S/N) being directly convertible in timing accuracy, the predicted 10 times better sensitivity with respect to current 100-m class telescopes shall bring up to 200 the number of pulsars timed better than 500 ns over 10 years, with 10-20 around or better than 100 ns rms. The wide frequency domain accessible with the SKA (50MHz-13.8 GHz) will allow fine studies of the interstellar medium imprints on the signal and a better monitoring of the associated red noise component which perturbs the gravitational signal detection. In this respect, the multi-telescope Nançay facility will provide us with pioneering results, thanks to the possibility of simultaneous observation campaigns with NenuFAR, LOFAR-FR606 and the NRT in the range 15MHz-3.5 GHz. Pulse jittering is also a critical source of noise in the timing residuals, typically at the 100 ns rms level, it produces a higher threshold with shorter integrations, and it can thus limit the detection of gravitational waves with a highly sensitive radio telescope like the SKA, where a natural tendency would be to reduce observing time of the brightest sources. The two ways to address this problem are: 1) using the sub-arraying capability of SKA and doing multiple parallel long exposures observations; 2) using the existing 100-m class telescopes to monitor on the long term most of the bright millisecond pulsars used in PTAs. In such a context, the low declination limit (-39∘) of the NRT would make it a precious complement to SKA pulsar observations.
While we expect to detect the first signal from the stochastic gravitational background or the first single super massive black hole binary with the IPTA, SKA1
should definitely confirm and characterise the sources or populations associated to this detection. On a longer time scale, full SKA will be the only instrument allowing
to really exploit gravitational astronomy in the nHz-Hz domain.
References:
Babak, S., et al., 2016, MNRAS, 455, 1665;
Bassa, C. G., et al., 2016, MNRAS 456, 2196;
Caballero, R. N., et al., 2016, MNRAS, 457, 4421;
Desvignes, G., et al., 2011, AIP Conference Proceedings, Volume 1357, pp. 349-350;
Desvignes, G., et al., MNRAS, 2016, 458, 3341;
Lentati, L., et al., MNRAS, 2015, 453, 2576;
Lentati, L., et al., MNRAS, 2016, 458, 2161;
Rosado, P. A., et al., 2015, MNRAS 451, 2417;
Taylor, S. R., et al., PhRvL, 2015, 115, 041101;
Verbiest, J. P. W., et al., MNRAS, 2016, 458, 1267
2.6.2 Binary pulsars as natural laboratories to test Gravitation theories
With orbital periods of only a few hours, pulsar/white-dwarf or pulsar/neutron-star compact binary systems are natural laboratories for testing Gravity theories in the strong field regime. In the most interesting systems, the timing precision reached by state of the art radio observations allows us to measure all Keplerian and several post-Keplerian orbital parameters in only a few years. Beyond the accurate measurement of both masses, which is crucial for constraining neutron star internal structure models (see Sect. 2.6.3), one can accurately measure the relativistic precession of the periastron, a combination of the gravitational redshift and the second order Doppler effect, the Shapiro time delay (both its range and shape), and the gravitational damping of the orbit due to gravitational wave emission (see e.g. Kramer et al. 2017). One can also measure the spin-orbit coupling effect implying geodetic orbital precession and hence get information on the spins. Finally, one can test for possible variations of the gravitational constant, produce the most stringent test of scalar-tensor gravity, and of some alternative theories motivated by dark matter (Freire et al. 2012). Such tests of alternative theories with binary pulsars are very important for the direct detection of gravitational waves by LIGO/VIRGO, since they permit to restrict the number of alternative theories to be considered for building gravitational-wave templates to be used in the data analysis of these detectors.
Recent results obtained with NRT and other 100-m class radio telescopes
The Nançay decimetric Radio Telescope (NRT) is one of the rare instruments on Earth able to provide both timing quality and data rate for this kind of scientific application, in particular for densely and correctly sampling the orbital phase of such systems. Since 2006, 90 binary pulsars are then monitored on a regular basis, with time series extending beyond a decade. Combining these NRT timing data with those of other antennae (Effelsberg, GBT, Arecibo, Parkes, Westerbork, Jodrell Bank) the Nançay group obtained several results :

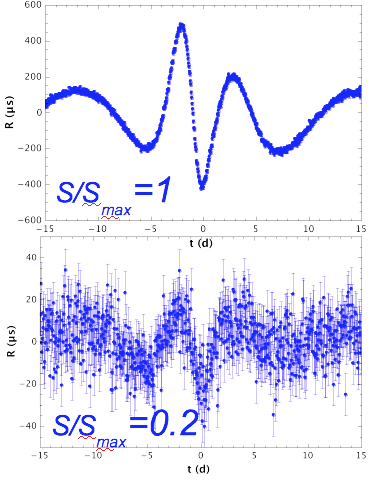
-
•
first Shapiro delay measurement and masses for the neutron-star/white-dwarf (NS/WD) system PSR J18022124 (Ferdman et al. 2010);
-
•
constraints on PSR J1012+5307’s eccentricity, variation of semi-major axis and orbital period, upper limit on dipolar emission and on the variations of the gravitational constant G (Lazaridis et al. 2009);
-
•
evidence of a secular variation of PSR J2051-0827’s projected semi-major axis and interpretation in terms of spin-orbit coupling, tidal effects and associated variations of the quadrupole moment (Lazaridis et al. 2011);
-
•
discovery of a strong magnetic field around the supermassive black hole at the centre of the Galaxy (Eatough et al. 2013); the measurement of five post-Keplerian parameters in the double neutron star PSR J17562251 and a series of tests of General Relativity (Ferdman et al. 2014);
-
•
evidence for geodetic precession in PSR J1906+0746 (157 years) and accurate measurement of both neutron star masses (Desvignes et al. 2008, Van Leeuwen et al. 2015, Desvignes et al. 2017);
-
•
pulsar timing evidence for an intermediate-mass black hole in the globular cluster NGC 6624 (Perera et al. 2017);
-
•
accurate mass measurements for both components of the PSR J22220137 binary and of the rate of advance of periastron, constraints on dipolar radiation and spontaneous scalarization (Cognard et al. 2017).
Testing Gravity in the SKA era
Current radio timing observations of binary pulsars enable tests of the quasi-stationary strong-field regime in the first order post-Newtonian approximation and of gravitational wave damping at leading order (i.e. second-and-a-half post-Newtonian order). With its higher sensitivity and higher timing accuracy, SKA will revolutionize the field and allow us to measure other post-Keplerian parameters and higher order effects. We expect in particular more than a hundred of double neutron star (NS) systems, with phase resolved short period orbits. At 50 ns of timing precision, we know that the Shapiro effect will be detectable at inclinations down to 40∘ and lead to 5 times more NS masses and also new geodetic precession measurements. This precision will also allow to observe frame dragging from apparent semi-major axis variations in tight binaries with large spin/orbit angle, and to measure the Lense-Thirring effect through its contribution to thanks to the combination of accurate Shapiro delay, variation of the orbital period and VLBI distance. These data will also be unique for the measurement of NS moments of inertia and contraints on the Equation of State (see Sect. 2.6.3).
The high timing precision reached by SKA will allow exploring new tests of the strong equivalence principle, and gravitational dipole radiation, e.g. due to a scalar field component of gravitation. The discovery of new highly asymmetrical NS-WD systems such as PSR J1738+0333 and PSR J0348+0432 will offer a unique test of the effacement property in so-called scalar tensor theories (see e.g. Wex 2014, Berti et al. 2015) or allow to constrain the differential free fall in the Milky Way gravitational potential (the so-called Damour-Schäfer test). Finally, the possible discovery of a triple system such as the recently discovered PSR J0337+1715 (Ramson et al. 2014), but with an external neutron star (instead of a white dwarf) would considerably improve the test of the universality of free fall in a strong external field. Such triple systems are also interesting for checking Newtonian resonant orbital effects such as the Kozai-Lidov mechanism.
All gravitational astronomers know that the holy grail would be the discovery of a neutron-star/black-hole system. Liu et al. (2012, 2014) showed for example that with a fast millisecond pulsar orbiting a 10-30 M⊙ black hole (BH) like those discovered with LIGO, SKA could measure the quadrupole moment with enough precision to constrain the BH mass to better than 0.1% and its spin better than 1%. Such a discovery will also allow us a direct test of the cosmic censorship conjecture (there exists a maximum spin, S G M2/c). Liu et al. (2012) and Psaltis, Wex & Kramer (2016) also showed that with a pulsar orbiting the central Milky Way black hole Sgr A* in 0.1 year, we would be able to test the no-hair theorem to about 1% precision, thanks to a high amplitude (a few 100 s !) and the characteristic periodic effect of the quadrupole moment on the timing residuals.
References:
Cognard, I., et al., 2017, ApJ, submitted;
Berti, E., et al., 2015, CQG, 32, 243001;
Desvignes, G., et al., in preparation;
Eatough, R. P., et al., 2013, Nature, 501, 391;
Ferdman, R. D., et al., 2010, ApJ, 711, 764;
Ferdman, R. D., et al., 2014, MNRAS, 443, 2183;
Freire, P. C. C., et al., 2012, MNRAS, 423, 3328;
Kramer, M., et al., 2017, in preparation;
Lazaridis, K., et al., 2009, MNRAS, 400, 805;
Lazaridis, K., et al., 2011, MNRAS, 414, 3134;
van Leeuwen, J., et al., 2015, ApJ, 798, 118;
Liu, K., et al., 2012, ApJ, 747, 1;
Liu, K., et al., 2014, MNRAS, 445, 3115;
Perera, B. B. P., et al., 2017, MNRAS, 468, 2114;
Psaltis, D., et al., 2016, ApJ, 818, 121;
Ransom, S. M., et al., Nature, 2014, 505, 520;
Shao, L., et al., 2015, AASKA14, 42;
Wex, N., 2014, eprint arXiv:1402.5594
2.6.3 Neutron star equation of state
Matter in the neutron star (NS) interior is compressed to densities exceeding that in the centre of atomic nuclei, opening the possibility to probe the nature of the strong interaction under conditions dramatically different from those in terrestrial experiments and to clarify the composition of compact stars. Several models are considered and these stars can be either standard NSs composed of nucleons and nuclei, or stars containing, in addition to nucleons, strange baryons (hyperons) or mesons at the centre, or possibly “hybrid stars”, i.e., with a quark matter core, or even pure strange quark stars. Via the equation of state (EoS), matter properties uniquely relate mass and radius of the star, see Fig. 59 (top-left panel). The ultimate key to constraining the NS EoS would thus be to measure masses and radii of NSs. The latter are, however, difficult to determine and current values are subject to large systematic uncertainties.
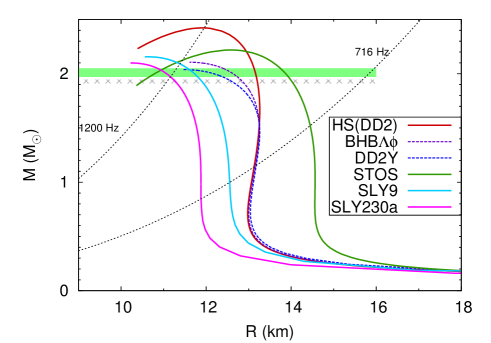
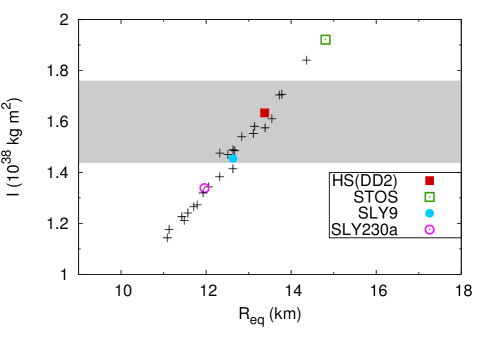
Masses
Since, for a given EoS, there is a limit in the mass for a NS (due to general-relativistic effects), the observation of a massive NS can already exclude some EoS models, put constraints on the strong interaction at high densities and answer questions about the composition. In particular, pulsar timing measurements in double NS systems and millisecond pulsars (MSPs) in binary systems can deliver high precision NS masses (see also Sec. 4.6.2). The SKA is expected to increase the total number of mass determinations by roughly a factor 10 (Watts et al. 2015). The improved timing precision will in addition greatly reduce uncertainties on already measured masses. The discovery of a NS mass with a mass only 10% higher than the current record holders, PSR J 1614-2230 (Demorest et al. 2010; Fonseca et al. 2016) and PSR J0348+0432 (Antoniadis et al 2013) would exclude many EoSs and thus seriously challenge our understanding of dense matter, see Fig. 59, left panel.
Radii and moments of inertia.
Current standard techniques to determine NS radii rely on i) spectroscopic measurements of accreting neutron stars in quiescence (Heinke et al. 2014) or ii) on the study of thermonuclear (type I) X-ray bursts (Özel & Freire 2016 and references therein), or iii) timing observations of surface inhomogeneities of rotating stars (see Miller & Lamb 2016; Haensel et al. 2016). Determining the moment of inertia for a NS with well known mass would be a fascinating alternative way (Morrison et al. 2004). As can be seen from Fig. 59 (right panel), a 10% precision on for the double pulsar, possible with the SKA in less than 20 years (Watts et al. 2015), would constrain the radius to roughly 10%, too, better than present determinations with standard techniques. In addition, SKA1(2) should discover up to 100 (180) new double neutron star systems, and we can hope that some of them present more favorable geometries for measuring with high precision, see also Sec. 4.6.2.
Rotation frequencies
The NS spin frequency must be lower than the mass shedding limit, the Kepler frequency . To a very good approximation, , with the constant kHz for NSs (Haensel et al. 2009). More compact stars support higher rotation rates and the discovery of a sub-ms pulsar would severely constrain the EoS, see Fig. 59, left panel. The dotted lines indicate the minimum radius for a given mass assuming rotation at a Kepler frequency of 716 Hz (the fastest spinning known pulsar, PSR J1748-2446ad, Hessels et al. 2006) and 1200 Hz, respectively. Even if SKA1-MID and SKA2 do not find sub-millisecond pulsars, SKA1-MID will certainly discover at least few MSPs spinning faster than PSR J17482446ad, while SKA2 will deliver a full census of the population of the of the nearby, thus unaffected by scattering and dispersion delays, ultra rapidly spinning MSPs (Watts et al. 2015).
Glitches
The high precision timing provided by the SKA (see Sec. 4.6.1) might not only constrain the EoS, but could improve greatly our understanding of dense matter superfluidity in the interior of NSs through the study of glitches, small irregularities in the pulsar’s rotation rate. Several hundreds of glitches have been observed during almost fifty years in more than 150 pulsars ( www.jb.man.ac.uk/pulsar/glitches.html, Espinoza et al. 2011), mainly trough long term monitoring programs. The slow post-glitch relaxation on time scales up to months or years is a clear indication for a superfluid component in the NS interior (Baym et al. 1969). A dedicated observational campaign on 20-30 objects could explore fully the glitch size distribution and track the recovery of all detected glitches. It might be possible, too, to observe the glitch rise time, which then gives insight into the superfluid NS properties (Sourie et al. 2017). All these can contribute in an important way to a quantitative understanding of the glitch mechanism.
The French community contributes considerably to these efforts via
-
a)
the development of the numerical library LORENE (http://lorene.obspm.fr) which allows to compute (rotating) NS models in general relativity and thus relate dense matter properties to NS observables (Gourgoulhon et al. 2016),
-
b)
the development of new EoS models (Oertel et al. 2017; Gulminelli & Raduta 2015; Tan et al. 2016; Fantina et al. 2016),
-
c)
the development of the EoS data base Compose (http://compose.obspm.fr), which aims in collecting microphysics data for modeling compact stars,
-
d)
the development of a collaboration between theoreticians and the experimental nuclear-physics group in GANIL; specifically, an experiment to measure properties of neutron-rich nuclei relevant for compact-star modelling has been accepted and will be performed in the next months (Bastin et al. 2016).
This shows that strong links exist with the French experimental and theoretical nuclear-physics community.
References:
Antoniadis, J., et al., 2013, Science, 340, 448;
Bastin, B., et al., 2016, JYFL experiment I220;
Baym, G., et al., 1969, Nature, 224, 673;
Demorest, P., et al., 2010, Nature, 457, 1081;
Espinoza, C.M., et al., 2011, MNRAS, 414, 1679;
Fantina, A.F., et al., 2016, Phys. Rev. C, 93, 015801;
Fonseca, E., et al., 2016, ApJ, 832, 167;
Gourgoulhon, E., et al., 2016, Astrophysics Source Code Library, 1608.018;
Gulminelli, F. & Raduta, A.R., 2015, Phys. Rev. C, 92, 055803;
Haensel, P., et al., 2009, A&A, 502, 605;
Haensel, P., et al., 2016 EPJA, 52, 59;
Heinke, C., et al., 2014, MNRAS, 444, 443;
Hessels, J., et al., 2006, Science, 311, 1901;
Miller, M. C. & Lamb, F. K., 2016, EPJA, 52, 63;
Morrison, I. A., et al., 2004, ApJ, 617, L135;
Oertel, M., et al., 2017, Rev. Mod. Phys., 89, 015007;
Özel, F. & Freire, P., 2016, ARA&A, 54, 401;
Sourie, A., et al., 2017, MNRAS, 464, 4641;
Tan, N. H., et al., 2016, Phys. Rev. C, 93, 035806;
Typel, S., et al., 2015, Phys. Part. Nucl., 46, 633;
Watts, A., et al., 2015, AASKA14, 43
2.6.4 Reference frames
The determination of the motion of the celestial bodies through repeated measurements of their position using astrometric techniques constitutes the foundation of our present understanding of the Universe. For consistency in time and space, and hence comparisons for different celestial bodies, such determinations must be established in well-defined coordinate (or reference) systems. In practice, coordinate axes for celestial systems are not defined directly but only implicitly through the adoption of a set of fiducial directions, precisely identified and highly stable over long timescales. Specific bodies possessing the required properties are used to materialise such directions. On the celestial sphere, these form a grid of points whose two-dimensional coordinates define a reference frame.
For the past 20 years, fundamental reference frames have been based on extragalactic sources, namely quasars or more generally active galactic nuclei (AGN). These objects possess highly compact central emission (of synchrotron origin), ensuring well-defined fiducial directions, and have no detected proper motions due to their location at cosmological distances. Furthermore, their positions can be determined with exquisite accuracies, below the milliarcsecond (mas) level, using Very Long Baseline Interferometry (VLBI), a radio interferometric technique utilising antennas spread over the entire Earth, hence forming intercontinental baselines (see Sect. 3.14).
The current best realisation of the extragalactic frame is the second version of the International Celestial Reference Frame (ICRF2), recognised as the primary reference frame as per a resolution of the IAU adopted in 2009 (Ma et al. 2009; Fey et al. 2015). The ICRF2 is made up of 3414 extragalactic radio sources covering the entire sky (Fig. 60). Of these, 295 are used to define the axes of the frame with an accuracy of 0.01 mas. Positional accuracy for the individual objects reaches 0.04 mas for the most compact and best observed sources in ICRF2. The next generation celestial reference frame is expected for 2018 with the presentation of ICRF3 to the IAU for adoption at the upcoming IAU General Assembly in summer 2018. ICRF3 is built by a Working Group of the IAU chaired by P. Charlot (LAB) and with 20% of its membership from the French community. Compared to ICRF2, ICRF3 will have a larger number of sources ( 4000), be more accurate and have a more uniform precision in position. It should also comprise positions at three frequencies, 8 GHz, 24 GHz and 32 GHz, another new feature with respect to ICRF2, where positions were limited to the standard 8 GHz radio frequency.
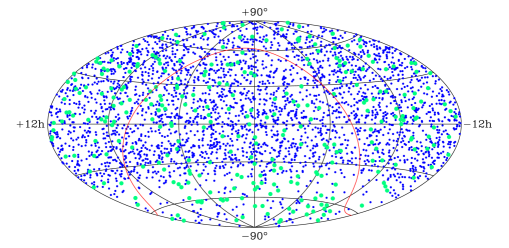
The upcoming ICRF3, with its increased positional accuracy, but also thanks to an observing span approaching 40 years (1979–2017), will allow the scientific community to tackle new questions in astronomy and fundamental physics. The long time base now makes possible the detection of Galactic aberration, a secular effect introduced by the rotation of the Solar System barycentre around the Galactic centre. This effect is now emerging from the current VLBI data with a magnitude of 0.005 mas/yr through apparent long-term proper motions of the radio sources (Titov & Lambert 2013). In a similar way, the low-frequency ( Hz) gravitational wave background, although not detected at present, may be revealed in the future through such quasar proper motions (Gwinn et al. 1997; Titov et al. 2011). VLBI is also essential for testing General Relativity, e.g. through the determination of the relativistic parameter (Lambert & Le-Poncin Lafitte 2011) or for trying alternate theories (Le-Poncin Lafitte et al. 2016). Incorporating SKA1-MID as an element of world-wide VLBI arrays, as described in Sect. 3.14, will largely improve the sensitivity of such arrays, hence permitting to expand considerably the celestial frame, which is essential to further constrain or reveal the above effects. With its location in the southern hemisphere, SKA1-MID will also help to correct the currently uneven sky distribution which comprises much less sources below declination (see Fig. 60) due to the sparseness of VLBI telescopes in the South.
The multi-frequency positional information in ICRF3 together with the optical positions derived with the Gaia space mission (Mignard et al. 2016) will also provide new insights into the physics of AGN. At radio frequencies, these objects generally feature a bright compact core and a single-sided relativistic jet with blobs of emission moving away from the core on time scales of months to years (Fig. 61). Future reference frames will have to account for such time-varying extended internal structures for the highest accuracy, a perspective that motivates the systematic VLBI imaging program101010All VLBI images produced through this program are publicly available through the Bordeaux VLBI Image Database (BVID). of the Bordeaux group to monitor the structure of the ICRF sources. In the light of such extended emission, comparison of the ICRF3 and Gaia positions will be essential in understanding whether the radio emission and optical emission are superimposed in these objects. Estimates of such radio-optical “core shifts” indicate that they amount to 0.1 mas on average (Kovalev et al. 2008), which is significant considering the anticipated ICRF3 and Gaia position accuracies. While potentially affecting the alignment between the two frames, the ICRF3-Gaia positional differences will also offer a unique opportunity to directly determine those core-shifts and probe the geometry of quasars in the framework of unified AGN theories. In particular, such measurements may help to locate the optical region relative to the relativistic radio jet and determine whether the dominant optical emission originates from the accretion disk or the inner portion of the jet. As noted above, incorporation of SKA1-MID in VLBI arrays will permit to vastly augment the number of sources in the radio frame, thereby permitting to tackle such studies for complete source samples including thousands of objects.
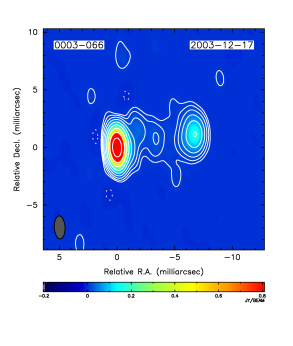
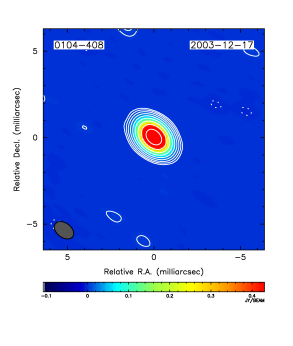
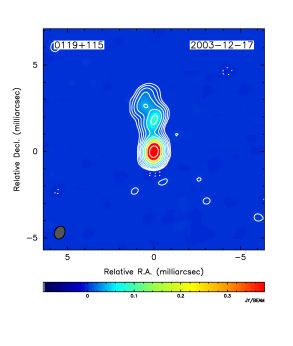
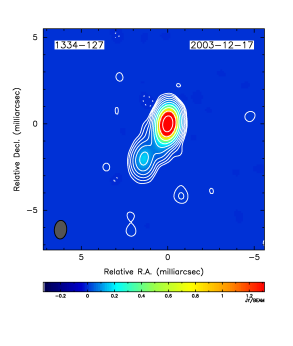
Beyond fundamental physics, astronomy and astrophysics, celestial reference frames have also applications in many other areas. This includes navigation of spacecrafts in the Solar System through differential VLBI astrometry relative to angularly-close quasars. Additionally, VLBI contributes to geodesy and the monitoring of the Earth’s rotation. In particular, it determines uniquely the Earth’s nutation, which depends on the geophysical properties of the Earth, hence providing constraints on the Earth’s interior structure (Mathews et al. 2002; Rosat et al. 2017). Expansion of the celestial frame through SKA-VLBI measurements will thus reverberate on all those areas as well.
References:
Fey, A. L., et al., 2015, AJ, 150;
Gwinn, C. R, et al., 1997, ApJ, 485, 87;
Kovalev, Y. Y., et al., 2008, A&A, 483, 759;
Lambert, S.B. & Le Poncin-Lafitte, C., 2011, A&A, 529, 70;
Le Poncin-Lafitte, C., et al., 2016, Phys. Rev. D, 94, 125030;
Ma, C., et al., 2009, IERS Technical Note No. 35, Eds. A. Fey and D. Gordon, Verlag des Bundesamsts für Kartographie und Geodäsie, Frankfurt am main;
Mathews, P. M., et al., 2002, JGR, 107(B4), ETG 3-1;
Mignard, F., et al., 2016, A&A, 595, 5;
Rosat, S., et al., 2017, GJI, 208, 211;
Titov, O. & Lambert, S., 2011, A&A, 559, A95;
Titov, O., et al., 2011, A&A, 529, A91
3 Scientific synergies with other instruments
Contributors of this section in alphabetic order:
E. Armengaud [IRFU, CEA, Université Paris-Saclay, Gif-sur-Yvette, France], A. J. Banday [IRAP, Université de Toulouse, CNRS, UPS, CNES, Toulouse, France], P. Charlot [Laboratoire d astrophysique de Bordeaux, Université de Bordeaux, CNRS, Pessac, France], E. Chassande-Mottin [Astroparticule et Cosmologie APC, Université Paris Diderot, CNRS/IN2P3, CEA/IRFU, Observatoire de Paris, Sorbonne Paris Cité, Paris, France], N. Christensen [Université Côte d’Azur, Observatoire de la Côte d’Azur, CNRS, Laboratoire Artemis, Nice, France], N. Clerc [IRAP, Université de Toulouse, CNRS, UPS, CNES, Toulouse, France], B. Cordier [CEA, IRFU/SAp, Université Paris-Saclay, Gif-sur-Yvette, France], F. Hammer [GEPI, Observatoire de Paris, PSL Research University, CNRS, Meudon, France], P. Guillard [Sorbonne Universités, UPMC Univ Paris 6 et CNRS, UMR 7095, Institut d Astrophysique de Paris, Paris, France], A. Gusdorf [LERMA, Observatoire de Paris, École normale supérieure, PSL Research University, CNRS, Sorbonne Universités, UPMC Univ. Paris 06, Paris, France], O. Hervet [Santa Cruz Institute for Particle Physics and Department of Physics, University of California at Santa Cruz, Santa Cruz, CA, USA], C. Lachaud [Astroparticule et Cosmologie APC, Université Paris Diderot, CNRS/IN2P3, CEA/IRFU, Observatoire de Paris, Sorbonne Paris Cité, Paris, France], S. Lambert [SYRTE, Observatoire de Paris, PSL Research University, CNRS, Sorbonne Universités, UPMC Université Paris 06, LNE, Paris, France], O. Le Fèvre [Aix Marseille Univ, CNRS, LAM, Laboratoire d’Astrophysique de Marseille, Marseille, France], M. Lehnert [Sorbonne Universités, UPMC Univ Paris 6 et CNRS, UMR 7095, Institut d Astrophysique de Paris, Paris, France], C. Magneville [IRFU, CEA, Université Paris-Saclay, Gif-sur-Yvette, France], S. Maurogordato [Université Côte d’Azur, Observatoire de la Côte d’Azur, CNRS, Laboratoire Lagrange, Nice, France], Y. Mellier [Sorbonne Universités, UPMC Univ Paris 6 et CNRS, UMR 7095, Institut d Astrophysique de Paris, Paris, France], N. Nesvadba [Institut d’Astrophysique Spatiale, CNRS, UMR 8617, Université Paris-Sud, Université Paris-Saclay, Orsay, France], N. Palanque-Delabrouille [IRFU, CEA, Université Paris-Saclay, Gif-sur-Yvette, France], G. W. Pratt [IRFU, CEA, Université Paris-Saclay, Gif-sur-Yvette, France;Université Paris-Diderot, AIM, Sorbonne Paris Cité, CEA, CNRS, Gif-sur-Yvette, France], M. Puech [GEPI, Observatoire de Paris, PSL Research University, CNRS, Meudon, France], J. Richard [Université Lyon, Université Lyon1, Ens de Lyon, CNRS, Centre de Recherche Astrophysique de Lyon UMR5574, France], H. Sol [LUTh, Observatoire de Paris, PSL Research University, CNRS UMR 8109, Université Pierre et Marie Curie, Universit é Paris Diderot, Meudon, France], M. Tagger [LPC2E, CNRS, Université d’Orléans, Orleans, France], S. D. Vergani [GEPI, Observatoire de Paris, PSL Research University, CNRS, Meudon, France], N. Webb [IRAP, Université de Toulouse, CNRS, UPS, CNES, Toulouse, France], P. Zarka [LESIA, Observatoire de Paris, PSL Research University, CNRS, Sorbonne Universités, UPMC Université Paris 06, Université Paris Diderot, Meudon, France;Station de Radioastronomie de Nançay, Observatoire de Paris, PSL Research University, CNRS, Univ. Orléans, Nançay, France]
3.1 Euclid
Mission description
Euclid is a M-class space mission led by ESA, aimed to understand the nature of dark energy, and study the distribution of dark matter. The Euclid mission is composed of the following main elements: a telescope 1.2m in diameter, a visible imager (VIS), a near infrared imaging spectrograph and photometer (NISP), VIS and NISP both with a field of view of 0.5 square degree, and a science ground segment (SGS). Euclid will run two surveys, a wide survey over 15 000 square degrees and a deep survey over 40 square degrees. The mission duration is set for about 6 years with a launch not earlier than 2020.
Wide cosmology survey
The Euclid cosmology survey will cover 15 000 square degree of high galactic latitude, both in imaging and in spectroscopy (Euclid Red book, Laureij et al. 2011). Deep images will be obtained with the VIS instrument in a broad visible r+i+z band covering from 550 to 900 nm, providing two key elements to the mission: detection of faint sources and shape measurements to analyse weak lensing properties. The VIS images will reach a limiting magnitude V=24.5 (10) for sources with extent 0.3 arcsec. The NIR imaging spectrograph (NISP) will provide Y, J and H band images down to H24 (5) over the same field of view of the VIS imaging. In total more than 1.5 billion sources will be imaged in the wide survey. Along with the imaging, the NISP will provide slitless spectroscopy over the same area. The spectroscopic survey aims to obtain redshift information based on the H line for over 25 million galaxies with , reaching a limiting flux 2 erg.cm2.s-1. With this large sample of galaxies with accurate spectroscopic redshifts it will be possible to analyse the clustering of galaxies at a cosmic time when sensitivity to a dark energy component is maximum.
The complementarity between Euclid and SKA for Cosmology has been reported by Kitching et al. (2015). They emphasise that the two experiments are synergistic in several respects, both through the scientific objectives and through the control of systematic effects on computing cosmological parameters. On the weak lensing side Euclid and SKA will be complementary in measuring the weak lensing shear and magnification, together with the positions of galaxies, projected on the plane of the sky as well as in redshift. Cross and auto correlation statistics will allow to identify systematic effects affecting measurements, and ideally minimise them to an unprecedented accuracy and precision.
As identified in Kitching et al. (2015), the combination of SKA with Euclid will improve the accuracy of Baryon Acoustic Oscillations (BAO), and redshift space distortions (RSD) measured from clustering analysis. Improved constraints on massive neutrinos become possible. Combined analysis of different populations with different biases with the dark matter distribution, can yield a further improvement on the measurement of cosmological parameters, especially from constraints on large scales.
Galaxy formation and evolution
With Euclid delivering images and spectrophotometric information probing mostly the stellar emission in galaxies, and SKA informing mostly about the gas content, combining the two will lead to a comprehensive information content for each galaxy in common. It will become possible to investigate the evolution of the star formation rate, gas and stellar mass content, over a range of galaxy properties, including their environment, in a range of redshift up to z=2 when combined with the Euclid wide survey. For the 25 million galaxies with Euclid spectra and H measurement, it will become possible to compare the instantaneous star formation rate to the gas content.
The Euclid deep survey over 40 deg2 will give a unique opportunity to probe the massive end of the galaxy mass function up to the reionisation epoch z7. The deepest SKA surveys should ideally be set overlapping with the Euclid deep survey areas. Here again, and depending on the depth of the SKA surveys, the joint information about stellar and gas content will be invaluable to investigate the build up of the massive galaxy population from the end of reionisation to the peak in star formation activity.
Galaxy clusters
Combining SKA and Euclid will open a new era in the understanding of the physics of galaxy clusters and their use as a new solid primary cosmological probe. Euclid surveys are expected to deliver an unprecedented catalog of massive clusters spanning the redshift range [0,2] (Laurejis et al. 2011). Analysis of cluster counts as a function of mass and redshift is a young and promising cosmological probe which is deeply investigated in the context of next generation surveys. Current forecasts show that its success will depend crucially on our capacity to precisely determine and calibrate the observable-mass relation (Sartoris et al. 2016), which is critical at high redshift where mass estimates are particularly difficult to obtain by most techniques. Following a sample of these clusters with SKA1-MID will allow to measure the SZ decrement produced by these systems (Grainge et al. 2015) and will provide the calibration of the mass-richness relation for Euclid clusters up to the highest redshifts () where individual mass determination by weak-lensing techniques reaches its limit. This will then improve drastically the precision of the cosmological parameters inferred from the Euclid cluster catalog.
Comparison of the thousands of rich clusters detected through their synchrotron radiation in SKA1 surveys (see Sect. 2.2.1.1) will be compared to those detected from galaxy overdensities and weak lensing peaks by Euclid. Analysis of the signatures of the non-thermal component of the ICM revealed by SKA1 surveys will then be addressed at the light of state-of-the-art mass maps reconstructed from Euclid weak lensing analysis and galaxy density maps. This will give a revolutionary vision of the formation of these systems in the context of their surrounding mass and galaxy distribution.
References:
Grainge, K., et al., 2015, AASKA14, 170;
Kitching, T., et al., 2015, AASKA14, 146;
Laurejis, R., et al., 2011, arXiv1110.3193, Euclid Definition Study Report;
Sartoris, B., et al., 2016, MNRAS, 459, 1764
3.2 E-ELT
The European Extremely Large Telescope (E-ELT), with its 39m diameter aperture, will provide Europe with the biggest ground-based optical astronomical facility ever built as from 2024. During the very first years of operation, it will be progressively equipped with a instrumental suite largely covering the parameter space in term of observational capabilities (imaging, integrated and 3D spectroscopy), wavelength (from the visible to the NIR).
HARMONI will be one of the two first-light instruments for the E-ELT. It is an integral field spectrograph operating in the optical and near-infrared (0.5-2.45 m), with spectral resolutions ranging between R=3 000 and R=20 000 (Thatte et al. 2016). HARMONI is designed to work together with various adaptive-optics systems (SCAO, GLAO, LTAO) with a good spatial sampling (between 4 and 60 mas), albeit within a small FoV (between 1 and 10 arcsec). With its numerous spatial and spectral configuration, HARMONI will be a generic instrument for first light, in particular for the study of stellar populations, exoplanets and high redshift galaxies.
The timeline for HARMONI (first light in 2024) makes it suitable for following-up SKA sources. HARMONI can perform a detailed follow-up of kinematics and chemical properties for individual galaxies at selected with SKA in 21 cm H i and/or radio continuum. At higher redshift, HARMONI will have the spatial and spectral resolution to study bright sources inside reionisation bubbles mapped out by SKA. It will be possible to correlate the H i content of these sources with their Ly- properties, in particular the presence of extended haloes.
MOSAIC111111http://mosaic-elt.eu will the E-ELT multi-object spectrograph as from 2026. It will work in the optical and near-infrared (0.45-1.8 m) with spectral resolutions R=5 000, and R=15 000 in specific windows (Hammer et al. 2016), providing integrated spectroscopy of 100-200 objects in a 40 patrol field as well as multi-object spatially-resolved spectroscopy with 10 IFUs – a unique capability amongst all ELTs. MOSAIC will be optimised for survey speed and is aimed to become a workhorse spectrograph for the E-ELT. These capabilities will allow tackling fundamental questions in cosmology such as how matter is distributed in distant galaxy haloes, and how present-day galaxies assembled. This includes the detection of nearby primordial stars, the very first galaxies at the EoR, the most exhaustive dynamical survey of distant galaxies ever undertaken, and the detailed study of the stellar populations (Evans et al. 2015). Most of these science cases are expected to provide very strong synergies with SKA.
One of the prominent synergies with MOSAIC will be related to the distribution of dark and baryonic matter in distant galaxy haloes. In particular, MOSAIC will take advantage of both the (MOAO) adaptive optics corrections and the optimized surface brightness sensitivity provided by its (multiple) 75 mas IFUs to sample the ionized gas extending beyond the optical radius of distant galaxies (Contini et al. 2016). This will allow constructing accurate rotation curves and dark matter profiles in galaxies (Puech et al. 2010), while SKA1-MID will probably remain limited in providing H i-based rotation curves only up to (Blyth et al. 2015). The redshifts around will be of particular interest since here SKA1 and then SKA2 will be able to detect a large fraction of galaxies and determine their H i cold gas content.
MOSAIC will also target the low-luminosity sources that are
expected to be responsible for the reonisation of the Universe beyond
. MOSAIC will observe large samples of Lyman Break Galaxies
as faint as and measure the equivalent widths of their
Ly- emission (see Fig. 62; Disseau et al. 2014) to
study the evolution of the Ly- Luminosity Function as a
function of redshift and better constrain the EoR. The higher spectral
resolution compared to JWST will be decisive to study the physics (from
the Ly- line profile and other ISM lines) within these first
galaxies. The correlation between these sources and the H i direct
imaging at scales of arc-minutes that SKA1-LOW will produce at are expected to generate very strong synergies that will lift the veil
on the physics of EoR (Koopmans et al. 2015).
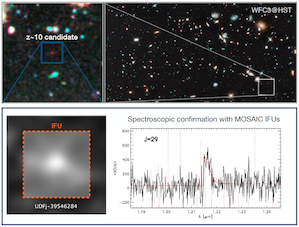
References:
Blyth, S., et al., 2015, AASKA14, 128;
Bouwens, R.J., et al., 2011, Nature, 469, 504;
Contini, T., et al., 2015, A&A, 591, 49;
Disseau, K., et al., 2014, SPIE, 9147, 91
Evans, C., Puech M. (Eds), et al., 2015, ArXiv:1501.04726;
Hammer, F., et al., 2016, SPIE, 9908, 24;
Koopmans, L. V. E., et al., 2015, AASKA14, 1;
Puech, M., et al., 2010, MNRAS, 402, 903;
Thatte, N., et al., 2016, SPIE, 9908, 1
3.3 4MOST Cosmology Redshift Survey
4MOST is a major new wide-field high-multiplex spectroscopic survey facility under development for the VISTA telescope of ESO. 4MOST has a broad range of science goals ranging from galactic archaeology and stellar physics to the high-energy physics, galaxy evolution, and cosmology. It is a natural follow-up instrument for other massive space-based and ground-based projects, such as GAIA, Euclid, e-Rosita or SKA. Starting in 2022, 4MOST will deploy 2436 fibres in an hexagonal 4.1 square degree field-of-view using a positioner based on the tilting spine principle. The fibres will feed one high-resolution (R 20,000) and two medium-resolution (R 5000) spectrographs with fixed 3-channel designs and identical 6K x 6K CCD detectors. 4MOST will have a unique operation concept, in which 5-year public surveys both from the 4MOST Consortium and the ESO community will be combined and observed in parallel during each exposure. At least 15 surveys, both galactic and extra-galactic, will be run in parallel. The 4MOST Facility Simulator (4FS) was developed to demonstrate the feasibility of this observing concept, showing that we can expect to observe above 50 million objects in the entire survey period and will eventually be used to plan and conduct the actual survey (de Jong. et al. 2016).
The goal of the 4MOST Cosmology Redshift Survey (CRS) is to study the nature of gravity and dark energy, responsible for the structure formation in the Universe and its expansion, respectively. To this end, it will map the three-dimensional matter distribution in the Southern sky. We aim at performing precise measurements of baryonic acoustic oscillations (BAO) and redshift space distortions (RSD) from the three-dimensional distributions of galaxies with an unprecedented accuracy at redshifts up to about . In particular the objectives are to measure redshifts for 8-10 million (a) Bright Galaxies (BG) and (b) Luminous Red Galaxies (LRG), and for 10 million (c) Emission Line Galaxies (ELG). Additionally, this survey will measure the distribution of quasars and the Lyman- forest between redshift 2.2-3.5 and the redshifts of SNe 1a or their host galaxies using triggers from DES and LSST. The survey will cover 10-13K square degrees, concentrating on the area covered by the Dark Energy Survey (DES) where deep imaging will be available (see Fig. 63), allowing for instance cross-correlations with weak lensing surveys and CMB experiments. Among all 4MOST surveys, the CRS provides the largest number of targets and represents the majority of all extragalactic targets. We describe below some science goals which will benefit from the combination of 4MOST and SKA.
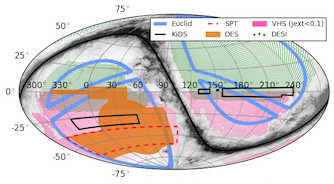
21 cm surveys
Intensity mapping surveys with the Square Kilometre Array pathfinders (MeerKAT in South Africa and ASKAP in Australia) and later with the SKA itself, will be a very powerful cosmological probe. Future intensity mapping experiments will be able to measure the rate of cosmic growth through redshift-space distortions of the power spectrum (Bull et al. 2015). Measurements of the H i power spectrum will still be degenerate with the H i bias, but cross-correlation between the 21 cm intensity maps and large-area optical surveys provides a useful cross-check of this parameter and the neutral hydrogen density. This measurement has already been performed using radio data from the Green Bank telescope, and optical data from the WiggleZ Dark Energy Survey (Masui et al. 2013). Cross-correlation between 4MOST and a large-area future intensity mapping experiment will be be a valuable probe of cosmology and galaxy evolution.
Radio continuum surveys
The large-area radio continuum surveys such as ASKAP EMU (Evolutionary Map of the Universe, Norris et al. 2011) will cover the whole southern sky. EMU will detect roughly 70 million radio galaxies out to redshift 5 and provide constraints on dark energy, modified gravity and primordial non-Gaussianity through measurements of the angular correlation function, cosmic magnification and Integrated Sachs Wolfe (ISW) effect.
The radio spectrum is too smooth to measure redshifts, and all of these measurements will be enhanced by the addition of redshift information to allow division of the sample into redshift bins. This will be contributed by the 4MOST CRS, either directly, or indirectly via photo-z calibration.
Velocity power spectrum
Maximum-likelihood methods can constrain the amplitude of the auto- and cross-power spectra of density and velocity, which can trace the growth rate of structure as a function of scale . Originally proposed by Jaffe & Kaiser (1995), it has seen recent success in its application to the peculiar velocity sample from the 6dFGS (Johnson et al. 2014; Adams et al. 2017). Howlett et al. (2017) find that combining the peculiar velocity and density fields from the Taipan and ASKAP WALLABY surveys can constrain the growth rate to . The higher number density of 4MOST objects would greatly improve on this constraint, both separately, and in combination with other measurements of peculiar velocities, such as those from WALLABY, SKA or LSST Supernovae.
References:
Adams, C., et al., 2017, submitted;
Bull, P., et al., 2015, ApJ, 803, 21;
Howlett, C., et al., 2017, MNRAS, 464, 2517;
Jaffe, A. H. & Kaiser, N., 1995, APJ, 455, 26;
Johnson, A., et al., 2014, MNRAS, 444, 3926;
de Jong, R., et al., 2016, SPIE, 9908, 1;
Masui, K., et al., 2013, ApJ, 763, 20;
Norris, R., et al., 2011, PASA, 28, 215
3.4 JWST
The James Webb Space Telescope (JWST) is the large aperture, near-IR optimised successor of the Hubble and Spitzer space telescopes. JWST’s launch date is October 2018 and it will be carried on an Ariane 5 rocket which will place it in a Lissajous orbit around the Earth-Sun L2 point. Covering the wavelength range m, with its large, segmented, m primary mirror (see Gardner et al. 2006 for a review of JWST’s characteristics), will achieve a gain in sensitivity and spatial resolution of about two-orders of magnitude compared to ground-based facilities and Spitzer. The four science instruments comprising the integrated science instrument module (ISIM) are:
- NIRCam:
-
A Near-Infrared Camera (m), with two broad- and intermediate-band imaging modules, each with a arcmin2 field of view (Beichman et al. 2012). The modules have a short- and a long-wavelength channel, taking images simultaneously with light split by a dichroic at about m. The short-wavelength channel, covering the wavelength range m, is sampled at pixels (0.0317 arcsec pixel-1), the long-wavelength channel at pixels (0.0648 arcsec pixel-1).
- NIRSpec:
-
A Near-Infrared Spectrograph (m) with 3 observing modes: a low resolution prism mode, a multi-object mode and a Integral Field Unit (IFU) or long-slit spectroscopy mode (Bagnasco et al. 2007). In the and modes, NIRSpec uses a micro-electromechanical system (MEMS) to provide dynamic aperture shutter masks (“microshutter array”). These masks allow us to obtain simultaneous spectra of more than 100 objects in a arcmin2 field of view ( arcmin2 at 1 m). At one prism spectrum covers the full m wavelength range. At , three gratings are necessary to cover the full m wavelength.
- MIRI:
-
A Mid-InfraRed Instrument, developed by a European consortium (Wright et al. 2014), with imaging and spectroscopy covering the m wavelength range. Its design consists of two main modules, an imager (Bouchet et al. 2015), a low-resolution spectrometer (Kendrew et al. 2015) and an IFU medium resolution spectrograph (MRS; Wells et 2015).
- FGS/NIRISS
-
The Fine Guidance System/Near-InfraRed Imager and Slitless Spectrograph, provided by the Canadian Space Agency. NIRISS is a wide-field, 2.2’ 2.2’, imager capable of slitless spectroscopy (Beichman et al. 2014). It also includes a spectroscopic observing mode optimised for exploring exoplanets atmospheres.
In the following we illustrate some Galactic and extra-galactic science topics where JWST and SKA have strong synergies. This is by no means intended to be a comprehensive review, but rather we highlight a few examples, biased towards interstellar medium studies, showcasing the power of combining JWST and SKA observations.
Galactic science
The complementarity between SKA and JWST wavelengths translates into the following Galactic science topics:
-
•
In shock regions (e.g., supernova remnant shocks, see Sect. 2.3.9, or jets and outflows, see Sect. 2.3.8), the local density can be constrained by H2 observations with JWST. These types of constraints have proven to be robust using JWST’s predecessors like ISO or Spitzer (see, e.g., Neufeld et al. 2009), because H2 is significantly excited in the warm shocked gas, its transitions are optically thin, and also its abundance makes it chemistry-independent. Once the density of H2 is known, especially at high angular resolution, the chemistry of complex organic molecules (COMs) will be better constrained, and the excitation of, for example, OH masers better understood. Both COMs and maser emissions can be probed through SKA observations. JWST will also allow us to more accurately characterise shocked regions through observations of ionised lines which trace fast or externally irradiated shocks, and of other lines of abundant molecular species such as water.
-
•
In photodissociation regions (PDRs) and H ii regions, the study of the physics and chemistry will similarly benefit from observations with JWST and the constraints it will provide on H2 density (e.g., Habart et al. 2011) complemented by COMs, masers, and also the radio recombination line observations by SKA (hydrogen, helium, and carbon). In such environments, the synergy between JWST and SKA will extend to the study of dust properties. Dust plays key roles in both the physical and chemical processes operating in PDRS and H ii regions. The exact role they play depends on the detailed dust properties such the distribution of grain sizes, the detailed structure of the grains, and on their composition. It is well documented that continuum observations at multiple wavelengths are mandatory to robustly constrain these properties.
-
•
Beyond these phases of the interstellar medium (ISM), the study of dust will benefit from combined results from both SKA and JWST. To reinforce what is written in previous sections, the validation of the interpretation of anomalous microwave emission by means of spinning dust requires the combined observation of dust emission between 10 and 50 GHz with SKA, and of PAH emission at a few microns with JWST. The high angular resolution of both telescopes will allow us to obtain a deep understanding of this phenomenon. The high-angular resolution of both SKA and JWST will also allow us to study grain growth in protostellar disks, where these telescopes do not probe exactly the same layers. We will be able to “peel back” the layers and thus obtain a comprehensive characterisation of the whole disk structure.
Extragalactic science
JWST will detect warm/hot dust emission, and ionised and molecular hydrogen lines out to very high redshifts, which will therefore allow us to complement spectral line diagnostics and provide independent dust and gas mass and energy budget estimates in the early universe. For instance:
-
•
JWST and SKA observations will make it possible to probe sub-kpc scales and low column density gas of the multiphase ISM of nearby galaxies. JWST will complement SKA observations of the H i gas by allowing us to study the relationship between HI, H2 and ionised gas, as well as the dust distribution. High-resolution multi-wavelength observations are the keys to studying the connection between star formation on small scales and global scaling laws.
-
•
JWST will allow us to unveil obscured AGN and extend the AGN luminosity function to similar redshifts as SKA (). SKA and JWST will also spatially resolve the morphology and the kinematics of the dusty gas torus around nearby AGN, thus extending the studies of the gas properties of their host galaxies.
-
•
JWST will extend the UV line emission and absorption to high-redshift galaxies, by building the faint-end of the UV luminosity function, thus providing unique and complementary constraints for SKA on how the universe was reionised.
-
•
Recent observations show that the gas in halos of galaxies is multiphase (e.g. Werk et al. 2014; Emonts et al. 2016). JWST and SKA have unique and complementary capabilities in imaging and characterising the ionised, atomic and molecular gas and dust in halos of galaxies, up to high redshifts (). This will potentially revolutionise our view of the gas content in the circum-galactic medium of galaxies.
Generally speaking, the synergy between JWST and SKA will be made even more efficient on all these subjects by including high-angular resolution observations at sub-millimetre wavelengths with ALMA (see Sect. 3.11) filling the gap between the IR/MIR and radio ranges: the combined use of these three telescopes will ensure an optimal scientific return in all these active research areas for decades to come.
References:
Bagnasco, G., et al., 2007, SPIE, 6692;
Beichman, C. et al., 2012, SPIE, 8442, 2;
Beichman, C., et al., 2014, PASP, 126, 1134;
Bouchet, P., et al., 2015, PASP, 127, 612;
Emonts, B. H. C., et al., 2016, Science, 354, 1128;
Habart, E., et al., 2011, A&A, 527, 122;
Kendrew, S. et al., 2015, PASP, 127, 623;
Neufeld, D. A., et al., 2009, ApJ, 706, 170;
Wells, M., et al., 2015, PASP, 127, 646;
Werk, J. K., et al., 2014, ApJ, 792, 8;
Wright, G. S., et al., 2015, PASP, 127, 595
3.5 DESI
The Dark Energy Spectroscopic Instrument (DESI) is a Stage IV ground-based survey dedicated to cosmology. It will be installed on the 4-m Mayall telescope in Kitt Peak, Arizona, in order to obtain more than 30 million galaxy and quasar redshifts. This will permit the study of BAO and the growth of structures with unprecedented precision on a wide area and over a large range of redshifts (Aghamoussa et al. 2016).
The DESI robotically-actuated fiber-fed spectrograph is capable of taking up to 5,000 simultaneous spectra over the wavelength range nm. The fibers feed ten three-arm spectrographs with resolution depending on wavelength. The DESI instrument will conduct a five-year survey to cover 14,000 deg2. Spectroscopic targets will be selected in four classes from imaging data: luminous red galaxies up to , emission line galaxies up to and quasars both as tracers of the matter distribution and, in the redshift range , for their Lyman- forest absorption features. Several French laboratories from CEA, INSU and IN2P3 take an active part in the development of this DOE-led project, at the same time in instrumental developments (spectrographs), survey preparation (target selection, pipeline) and science. Of particular interest concerning SKA, french groups possess a key scientific expertise in the Lyman- forest, from the development of quasar search algorithms to the reconstruction of the forest power spectrum at small scales and at the BAO scale, and its cosmological implications. French members strongly contributed and contribute to this research topic within the former BOSS and current eBOSS redshift surveys (e.g. Delubac et al. 2015).
As is well known, the cross-correlations between different probes of large-scale structures is a nice tool in order to improve their sensitivities to cosmological parameters. This is due to several reasons : extra information from different cosmological dependences of the cross-correlations, improved knowledge of the tracer biases, and better constraints on single-probe systematics. Although located in the Northern hemisphere, a large fraction of the DESI footprint will overlap with large-area () SKA cosmological surveys, and in particular all of the DESI Southern Galactic Cap. Cross-correlations between different DESI and SKA probes will therefore be possible and provide significant improvements in terms of cosmological constraints - in a way very similar to what was described for 4MOST in the previous section. We note in particular that the DESI footprint will be complementary to the 4MOST one, which will only cover sky regions with negative declination.
It is recognised that several sources of systematics, and in particular foreground contaminations, will be an important challenge to the SKA1 H i intensity mapping survey. For redshifts above , a way to identify residual systematics in this survey, and to reduce foreground contaminations will be to cross-correlate the 21 cm IM signal with Lyman- forest spectra, as suggested in (Sarkar et al. 2011). While the 21 cm signal is expected to originate mostly from damped Lyman- (DLA) systems, the Lyman- forest is associated to much smaller fluctuations of the neutral IGM. Simulations (Carucci et al. 2017) suggest that both emission and absorption signals should be largely anti-correlated. This should permit improvements by % in the cosmological parameter estimations, and more importantly provide an observable less sensitive to foreground contaminations than the 21 cm-alone power spectrum. Such a cross-correlation should be feasible already with existing BOSS [resp. eBOSS] data, which have a density of [resp. 22] quasars/deg2. The DESI survey will improve both the signal-to-noise and resolution with respect to BOSS/eBOSS, and increase the density of Lyman- forests to deg2. Note that a large number of individual DLA systems will also be identified from the DESI survey.
References:
Aghamoussa, A., et al. (DESI Collaboration), 2016, arxiv:1611.00036;
Delubac, T., et al. (BOSS Collaboration), 2015, A&A, 574, A59;
Sarkar, T. G. et al., 2011, MNRAS, 410, 1130;
Carucci, I. P., et al., 2017, JCAP04, 001
3.6 LSST
The Large Synoptic Survey Telescope ( LSST) is the major optical photometric survey instrument of the next decade (Ivezic et al. 2008). The LSST telescope under construction on Cerro Pachon in Chile features an 8.4 meter diameter (6.7 m effective) primary mirror and a compact 3-mirror optical design providing a very wide field of view of . The LSST camera will cover the diameter focal plane with 189 16-MPixels CCDs, for a total of 3.2 billion pixels that will be read in 2 s. The camera will be equipped with six broadband optical filters (ugrizy) covering the wavelength range from near UV to near infrared (320-1050 nm).
LSST will carry out a ten year survey of the southern sky in the six filters, starting in 2022. Its total optical throughput (étendue = ) will be two orders of magnitude greater than any existing facility, allowing a survey of the sky to unprecedented depth and size. The entire southern sky will be mapped every nights by LSST, with i-band magnitude depth reaching in each single visit with an exposure time of only 40s, including dead time. At the end of the 10-year survey, the southern sky will be visited nearly a 1000 times using the six filters, with the i-band detection limit reaching in the deep co-added images.
LSST will provide a static census of nearly 40 billion objects, as well as dynamic, time domain mapping of variabilities for a huge number of faint objects. Many areas of research in astronomy and physics will benefit from the LSST survey, and especially the four following broad scientific topics which have driven the instrument design and survey strategy optimisation (Ivezic et al. 2013): moving objects in the solar system, structure and formation of the Milky Way, the transient sky and variable Universe, and the nature of the dark matter and dark energy.
A consortium of French scientists in CNRS-IN2P3 laboratories is contributing to the LSST construction effort and will have full access to the LSST data and catalog. The French R&D and technical contributions relate to the LSST camera electronics and mechanics (filter exchanger), calibration, camera control system and data processing.
Cosmology and more specifically dark energy probes are the main LSST science area in which the french LSST community has been involved up to now. However, other science topics are likely to evolve and grow, as French researchers from INSU or CEA (outside the IN2P3 laboratories) join the project.
As is the case for SKA, managing the LSST data flow (15 TB produced per night, 5 PB of raw image data per year) will be a major technical challenge (Juric et al. 2015). The French consortium is also responsible for handling the data processing for half of the data. Sharing technical expertise, aiming for common design choices and technical synergies whenever possible, will likely benefit both projects.
LSST survey will provide shear measurement for weak lensing and accurate photometric redshift estimates for a few billion galaxies in the southern sky, that is to say about 40-50 galaxies per arcmin2 with and redshift errors . Such a large sample will enable cosmological studies using nearly all of the cosmological probes and allow LSST to measure with high precision the distance-redshift and growth-redshift relations. A precision of on the distance and on the growth factor is forecast over the redshift range (Abell et al. 2009). In addition, LSST will discover of order type Ia supernovae annually, with a mean redshift , and maximum redshift . Combining distance-redshift constraints from supernovae with weak lensing, LSS, BAO as well as galaxy cluster studies will constrain the mean value of the dark energy parameter to about 1%.
Future constraints on the cosmological model and its parameters are likely to be limited by systematics. Complementarity of SKA and optical surveys such as LSST for mitigating systematic errors, especially for BAO and weak lensing, is widely recognised (see e.g. Bacon et al. 2015) and is an area where joint SKA-LSST studies can improve the cosmological constraints. One forefront example is the ability of SKA H i observations to yield estimates of intrinsic position angles of galaxies, thus providing a way to mitigate LSST shear systematics due to intrinsic alignment, arguably one of the main issues in LSST weak lensing programs.
In addition, at least four other science areas will benefit from the complementarities and synergies between SKA and LSST:
-
1.
PhotoZ : The determination of galaxy redshifts from photometric measurements is a key objective of the LSST survey, because this information will be exploited for all the extragalactic and cosmological studies. A number of studies have demonstrated the importance of spectroscopic samples for training PhotoZ reconstruction codes, as well as calibration, in particular using cross-correlation methods (Newman et al. 2013). The H i sources detected by SKA at large redshift will be a valuable addition to optical spectroscopic samples, as well as 3D H i mass maps obtained through the Intensity Mapping technique.
Moreover, SKA can use the LSST catalog to determine the redshift for the radio sources which it will detect. -
2.
Galaxy formation and evolution : Next generation of instruments promise to revolutionize our understanding of galaxy evolution, especially at high redshift. With their comparable footprints (in several redshift bands, LSST will provide optical photometric measurements for nearly all the H i sources that SKA will detect), LSST and SKA will play a key role in this respect. For instance, SKA continuum survey will obtain unprecedented high-resolution, multi-scale 3D coverage of AGN and star forming regions, while LSST will provide redshift and other properties (mass, metallicity, age) of stellar populations within galaxies. LSST will also benefit from SKA detection of AGN activity in order to correctly model the galaxy spectrum at optical and near-infrared wavelengths.
-
3.
Strong lenses : SKA and LSST will each potentially detect several 10000s lensed systems. For SKA, these will include gas clouds, for which SKA will determine distance, but also continuum synchrotron emission from AGN or star forming regions, for which LSST data may provide distance information. Furthermore, joint optical and radio data will be powerful to fight false positive and to associate lensed systems to the lensing galaxies, paving the road to accurate mass distribution modelling and studies of galaxy formation source populations at high magnification. Finally, multi-wavelength measurements and follow-ups of gravitational time delays will represent an important joint cosmological topic for both instruments and communities.
-
4.
Transients : LSST promises to revolutionise the area of Time Domain Astronomy. With a baseline cadence of field visit every s (with 2 back-to-back s exposures), and one nominal revisit after 60 min when possible, LSST will be able to scan several time scales significantly shorter than the full-sky survey few-day time scale. Furthermore, LSST is committed to distribute in a lapse time of 60 seconds unrestricted alerts of the multi-million transient and variable events detected each night. Long recognised as a key science driver for LSST, the transient Universe has also come to the fore in the case of SKA and its pathfinders and precursors, with key programmes in fast and slow transients. The transient science drivers for SKA have been extensively discussed in (Fender et al. 2015; Macquart et al. 2015; Corbel et al. 2015), ranging from the very high rate of AGN flaring detections to the prospects for TDE detection or FRB breakthroughs.
Without going into these detailed analyses here, it is clear that the value of finding radio transients is severely reduced if counterparts at other wavelengths are not also identified, and among them the optical or infrared bands are often most needed, especially to identify candidates for spectroscopic follow-up (and possibly redshift measurement) in the most exciting cases. While, in the era of parallel wide-field SKA and LSST observations looking at the same portion of the sky, the optical data of the quiet counterpart will be readily available for most fields, the actual real-time follow-up for either instrument based on alert from the other seems like a formidable goal to achieve. Indeed both LSST and SKA will have unprecedented rates of alerts, which will be extremely hard to efficiently triage without prior synchronisation. Thus, while it is important to investigate the best ways to enable target of opportunity observations for either or both instruments, some reflexion should also be devoted to the possibility to build campaigns where the same sky is observed at the same time.
References:
Ivezic, Z., et al., 2008, 0805.2366v4; Ivezic, Z., et al., 2013, http://ls.st/LPM-17; Juric, M., et al., 2015, 1512.07914; Abell, P. A., et al., 2009, 0912.0201; Bacon, D., et al, 2015, AASKA14, 145; Newman, J., et al., 2013, 1309.5384;Fender, R., et al., 2015, AASKA14, 51; Macquart, J.P., et al., 2015, AASKA14, 55; Corbel, S., et al., 2015, AASKA14, 53
3.7 Athena and eROSITA
Galaxy Clusters
The combination of radio and X-ray observations gives insights into the interplay of thermal and non-thermal emission across a wide variety of astrophysical sources. In this context, the coupling of SKA observations with missions offering deep X-ray survey capability, or new X-ray instruments with unprecedented angular resolution and sensitivity, will lead to new insights. Exploitation of existing missions such as XMM-Newton and Chandra, will hopefully continue as SKA comes on-line. The present contribution discusses further possibilities in the context of galaxy cluster observations for the next-generation X-ray survey, eROSITA (2018), and ESA’s next-generation X-ray observatory, Athena (2028).
The extended ROentgen Survey with an Imaging Telescope Array (eROSITA, Merloni et al. 2012) is the primary instrument on the Russian Spektrum-Roentgen-Gamma (SRG) mission, to be launched in 2018. eROSITA has been conceived to perform a deep survey of the entire X-ray sky that will be about 20 times more sensitive than ROSAT in the soft energy (0.5-2 keV) band; in addition, the satellite will undertake the first true imaging survey in the hard energy (2-10 keV) band. The seven eROSITA telescopes combined will have an effective area of 0.14 m2 at 1 keV, a field of view of , and an average survey-mode angular resolution of in the soft band and in the hard band. Over the course of its four-year survey, eROSITA is expected to detect galaxy clusters up to , and AGN across the extragalactic sky, in addition to Galactic objects such as accreting binaries, active stars, supernova remnants, and diffuse emission within and without the Galaxy.
A fraction of the X-ray sources discovered in the eROSITA survey will also emit in radio wavelengths. Cross-comparison of X-ray and radio surveys will enable improved source identification and source classification (e.g. of AGN into radio-loud and radio-quiet classes). New discoveries of Galactic and extragalactic accreting black holes will enable the black hole fundamental plane (e.g. Merloni et al. 2003) to be examined in greater detail and at greater dynamic range, leading to new insights into the relationship between accretion and ejection through the disc-jet connection.
SKA is also expected to detect thousands of extended radio sources associated to the non-thermal (synchrotron) emission from galaxy clusters (haloes, relics and individual radio galaxies; e.g. Norris et al. 2011; Brüggen et al. 2012; Reiprich et al. 2013). The origin of such diffuse radio emission within the intracluster medium (ICM) is unclear, although their properties correlate well with those of the hot gas observed in X-rays (e.g. Cassano et al. 2010) suggesting a tight relationship between non-thermal and thermal components in a cluster. Extended halo and relic emission in particular is seen to be associated to cluster dynamical state; this information will be useful in combination with information on the X-ray morphology and global parameters obtained from the eROSITA survey to provide insights into the formation and astrophysics of haloes and relics, and the cluster cosmic ray population in general (e.g. Schuecker et al. 2001; see below). Observations of tailed radio galaxies out to large distances trace the ICM (e.g. Blanton et al. 2001) that can be studied via its X-ray emission. Furthermore, estimates of the magnetic field strengths in the intracluster medium (ICM) can be obtained from measurements of Faraday rotation through the ICM, in combination with an independent measurement of the ICM electron density (e.g. Clarke et al. 2001). The intrinsic polarisation of the source need not be known, as the effect can be observed as a characteristic wavelength-dependent rotation measure (RM) signature. Thus the combination of X-ray and radio observations gives unique insights into cluster-wide magnetic fields. The All-Sky SKA Rotation Measure Survey aims to increase by five orders of magnitude existing data sets by providing an all-sky grid of Faraday rotation measures at a spacing of between sources. Combined with measurements of the electron density from eROSITA measurements, this rotation measure grid will improve immeasurably our knowledge of the spatial distribution, physical characteristics, and evolution of galaxy cluster magnetic fields.
The Advanced Telescope for High ENergy Astropysics (Athena, Nandra et al. 2013) is the European Space Agency’s L2 mission, scheduled for launch in 2028. Athena has been conceived to combine a large effective area X-ray telescope with state-of-the-art instrumentation for spatially-resolved X-ray imaging spectroscopy. The telescope, based on ESA’s Silicon Pore Optics technology, will have an effective area of 2 m2 at 1 keV, coupled with an angular resolution of (Willingale et al. 2013). The Athena Science Instrument Module will carry the X-ray Integral Field Unit (X-IFU) for high-resolution ( eV) imaging X-ray spectroscopy (Barret et al. 2016), and the Wide Field Imager (WFI) for X-ray spectro-imaging across a field of view (Rau et al. 2016).
Athena is an observatory-class mission that will make detailed observations of many astrophysical objects, so the area of overlap with SKA is potentially vast. Areas in which combined Athena X-ray and SKA radio observations are expected to provide particular insight include:
-
•
The relationship between turbulence and bulk motions in the ICM and the presence of radio haloes (e.g. Cassano et al. 2010, 2013). These works have shown that Mpc-scale radio halo emission is associated almost exclusively with systems that present highly perturbed X-ray images, indicating significant dynamical activity, while objects with a relaxed X-ray morphology do not appear to host radio emission. Furthermore, the radio power is correlated to the cluster X-ray luminosity. The combination of SKA and Athena will allow these relationships, which are thus-far limited to the nearest, most massive objects, to be probed to down to far lower masses and up to higher redshifts, opening up the field to studies of evolution.
-
•
The detailed physics of shock acceleration in galaxy cluster radio relics. These extended, filamentary radio emission regions appear to be linked to re-acceleration of fossil relativistic particles as a shock travels towards the cluster periphery (van Weeren et al. 2017). Robust measurement of the Mach number from several different methods is necessary to probe these shocks. These can be determined both in radio (from the spectral injection index) and in X-rays (from application of the Rankine-Hugoniot shock conditions to density and temperature jumps). SKA will vastly increase the number of known relic systems with favourable viewing angles, while the high throughput of Athena will allow accurate pre- and post-shock densities and temperatures to be measured.
-
•
The balance between heating and cooling in the centre of galaxy clusters and its relationship to the interaction between the central AGN and the ICM (e.g. Croston et al. 2013). In particular, Athena will allow measurement of the line profiles and centroid variations in the vicinity of the AGN jets, allowing the velocity field to be mapped to high precision. The thermal and non-thermal energy content of the X-ray cavities will also be mapped for the first time, enabling their composition to be established. Finally, jet power measurements can be compared to accretion rates of hot and cold material, enabling insights into the accretion process and black hole growth to be obtained.
AGN
Complimentary SKA and Athena observations will help us understand many of the open questions regarding Active Galactic Nucleii (AGN), see Sect. 2.2.2.5. In a similar way to the Ultra Luminous Sources (ULXs, see Sect. 2.5.1.2), X-ray and radio observations will help us investigate the mechanical energy carried away by jets from AGN. This is believed to control hot-gas cooling in massive ellipticals and groups and clusters of galaxies via a feedback loop in which jets heat the hot gas, suppressing star formation and regulating their own fuel supply. Current X-ray observations have revealed compelling evidence for such AGN feedback (e.g. McNamara & Nulsen 2007). However, the physics of how the balance between these processes is established and maintained, and how it evolves with time, is poorly understood. Athena observations will allow us to measure the kinematics and energy injected into the environs and the SKA observations will allow us to analyse, in detail, the nature and scale of the jets. This will help us understand how the energy input from jets is dissipated and distributed throughout the intercluster medium, and how the energy balance between cooling and heating is maintained and established in regions where the most massive galaxies are being formed. Further, we will also be able to make estimates of the masses of black holes using the X-ray and radio observations, in order to understand the growth of black holes (Sect. 2.5.1.2), by using the fundamental plane of black hole activity.
However, there are galaxies in which the central massive black hole is not accreting at a high rate, i.e. is not an AGN, but can become bright during a tidal disruption event (TDE). These occur when a star in a galaxy wanders too close to the central massive black hole. The star disrupts when the tidal forces exceed the self-gravity of the star and a previously undetected central supermassive black hole will become extremely bright, allowing it to be studied. 10-4 – 10-5 TDEs are expected per galaxy per year (Rees 1988). To date, only about 30 TDEs have been detected in X-ray (Komossa 2015) out of about 70 candidates proposed to date. As the tidal radius of the black hole must be outside of the Schwarzschild radius for us to observe the tidal disruption event, it is only for the lower mass black holes ( 108 M⊙) that we detect these events, which may allow us then to detect the extremely rare intermediate mass black holes (IMBH, 102-5 M⊙, see Sect. 2.5.1.2). Surveys with X-ray observatories such as SVOM can pick out such events and then they can be followed up rapidly in radio to hunt for jetted emission that has only been seen in 3 TDEs to date (e.g. Burrows et al. 2011; Cenko et al. 2012). Why only some TDEs show such emission is still unclear. Then with Athena the bright X-ray emission can be modelled to determine the mass of the black hole, the accretion mechanism and if the event is close and therefore very bright, to detect an iron line in the spectrum, allowing us to put limits on the black hole spin (e.g. Karas et al. 2014).
Combined observations with the SKA and Athena will be essential to elucidate the nature of Ultra Luminous X-ray sources (ULXs). Using Athena/X-IFU observations, we will be able to search for emission and absorption lines, evidence for a ULX wind (e.g. Pinto, Middleton & Fabien 2016) that may be at the origin of the radio nebulae seen around some ULXs (Cseh et al. 2015). With quasi-contemporary SKA and Athena X-ray observations for example, necessary as stellar mass black holes are known to vary rapidly, see Sect. 2.5.1.2, and using the fundamental plane of black hole activity, an estimate of the mass of the black hole can be made. Radio survey observations and complimentary X-ray observations will also be able to identify the many IMBHs in the Milky Way.
References:
Barret, D., et al., 2016, arXiv:1608.08105;
Blanton, E., et al., 2001, AJ, 121, 2915;
Brüggen, M., et al., 2012, SSRv, 166, 187;
Burrows, D.N., et al., 2011, Nature, 476, 421
Cassano, R., et al. 2010, ApJ, 721, L82;
Cassano, R., et al. 2013, ApJ, 777, 141;
Cenko, S.B., et al. 2012, ApJ, 753, 77;
Clarke, T.E., et al. 2001, ApJ, 547, L111;
Croston, J.H., et al. 2013, arXiv:1306.2323;
Cseh, D., et al., 2015a, MNRAS, 452, 24;
Karas, V., et al., 2014, arXiv:1409.3746;
Komossa, S. 2015, Journal of High Energy Astrophysics, 7, 148;
McNamara, B. R., & Nulsen, P. E. J. 2007, ARA&A, 45, 117;
Merloni, A., et al., 2012, arXiv:1209.3114;
Nandra, K., et al., 2013, arXiv:1306.2307;
Norris, R., et al., 2011, JApA 32, 599;
Pinto, C., Middleton, M. J., & Fabian, A. C. 2016, Nature, 533, 64;
Rau, A., et al., 2016, arXiv:1607.00878;
Rees, M. J. 1988, Nature, 333, 523;
Reiprich, T., et al., 2013, SSRv, 177, 195;
Schuecker, P. et al., 2001, A&A, 378, 408;
van Weeren, R., et al., 2017, Nature Astronomy, 1, 0005;
Willingale, R., et al., 2013, arXiv:1307.1709
3.8 CTA
The Cherenkov Telescope Array (CTA) is currently the biggest project of very high energy astrophysics, gathering at this time more than 1500 members spread in 32 countries. CTA represents the new generation of gamma-ray imaging Atmospheric Cherenkov telescope (IACTs), that will succeed to the current arrays H.E.S.S. (Namibia), VERITAS (Arizona - US), and MAGIC (La Palma - Canary islands). CTA will be composed of two distinct arrays, one for each hemisphere for a full-sky coverage. The northern array which will take place on the MAGIC site, is expected to hold 19 telescopes, while the southern one in Chili (Paranal) will be much bigger with an nominal configuration of 99 telescopes. Thanks to CTA, the far end of the electromagnetic spectra from 20 GeV up to 300 TeV will be observed with an unprecedented sensitivity and angular resolution.
With a partial array expected to start operating in 2018-2019, routine user operation beginning at the horizon 2022, and a lifetime of 30 years, CTA will be fully operational during the future SKA era. The scientific synergies between SKA and CTA will reveal the non-thermal universe by linking the both ends of the electromagnetic spectra for numerous common astrophysical topics, as referenced below.
Radio-loud active galactic nuclei
Active galactic nuclei (AGN) are the archetypal sources able to provide powerful emission of radio and very high energy (VHE) gamma-rays with strong but often non-trivial correlation between them. Many open questions about the nature of the non-thermal emission can only be answered by considering together these two energy domains. SKA1 will deeply enhance the sample of large scale jet morphologies and polarisation, increasing our understanding of jet global energetics and long term processes of particle acceleration and cooling. The future VLBI extension of SKA will also unveil the pc-scale structure and kinematic of numerous new sources.
CTA should boost the sample of AGN detected in the VHE range by about a factor 10, giving new sights from particle emission processes at super-massive black holes vicinity. Its sensitivity will also allow to catch extremely fast flares with variability under a min (Sol et al. 2013). Gamma-ray flares are known to have side effects on radio polarisation and VLBI kinematics still far to be understood which will be a main topic addressed to the future synergies with SKA. Combining such SKA and CTA results will shed new light on AGN and should solve the long-standing issue of unification scenarios of extragalactic radiosources
Transients: GRBs, gravitational waves and FRBs
CTA is developed to scan large portions of the sky dedicated to the search of VHE counterpart of transient phenomena, as gamma-ray bursts (GRBs) or gravitational waves (GWs) which present large uncertainty on their location. Its sensitivity allows much larger regions to scan than previous IACTs with promising detection results for covers as large as deg2 (Bartos et al. 2014). As for the radio GRB afterglows observations, SKA will significantly contribute to the search and characterisation of GWs. Detecting the same event through the two messengers would allow a better identification of the sources and their environment, and a refinement of their parameters.
Fast radio bursts (FRBs) are one of the most mysterious astrophysical phenomenon highlighted these last years, and are consequently one the main key science project of SKA. Following the progenitors of FRBs, strong gamma-ray emission is expected to be seen (Murase et al. 2016). CTA results from FRB observations will give important constraints on their nature, either by direct detections or upper limits.
Cosmology: dark matter and reionisation
The most accepted dark matter hypothesis considers weakly interacting massive particles (WIMPs) which can self-annihilate, converting their large rest masses into other particles, including gamma-rays. The search of a gamma-ray emission from dark matter halos is among the most critical research topics of CTA (Carr et al. 2015). SKA will be naturally associated to this quest by looking the possible indirect radio counterpart of such an annihilation. Indeed, a diffuse radio emission is expected to be emitted from secondary electrons interacting with the magnetised atmosphere of galaxy clusters and galaxies. Hence the two experiments would be able to provide independent cross-checks on the same astrophysical targets.
The study of the reionisation period via the redshifted 21 cm line will be one of the major SKA achievement, providing direct imaging over most of the redshift range z 6 - 28 with SKA1-LOW. Although CTA will not be able to access such a redshift, the AGN gamma-ray absorption by pair creation on the extragalactic background light (EBL) field was proven to give strong constraints on its density. The measurements of EBL until redshift 1 can thus provide important cross-checks of cosmic reionisation models that will be enhanced by SKA observations (Mazin et al. 2013).
Galactic sources: pulsars, PWN and supernova remnants
SKA will increase by a large number the detected pulsar population, as well as the understanding of pulsar magnetosphere thanks to its wide bandwidth and exceptional sensitivity. On the other hand, a major breakthrough happened these last years with the direct pulse detection of the the Crab and Vela pulsars by IACTs (Aliu et al. 2008; Gadjus et al. 2015). The improvements that CTA will bring in term of lower energy threshold and sensitivity are expected to provide a spectral gamma-ray characterisation of several pulsars and enhance their multi-wavelength emission models.
It is still unclear whether pulsar wind nebulae (PWN) and supernova remnants accelerate cosmic rays up to PeV energies. This fundamental question should have soon answers from both SKA and CTA. SKA1, using both the MID and LOW elements, will already unveil dozens of new PWN providing vital new insight in the composition of the wind and the acceleration of leptons. CTA will also increase the VHE detected number of PWN, but also define more precisely their spectral features (de Oña-Wilhelmi et al. 2013). And in a more general way, the angular resolution of CTA will lead to spectacular progresses to define the gamma-ray structure of supernova remnants (Nakamori et al. 2015).
Cosmic particles
Both experiments plan to better define the cosmic ray population from ground detection and analysis of air-showers. The capabilities of SKA1-LOW from the radio signature of air-showers will be optimised for particles from to eV. CTA will be mainly focused on the electron spectrum, reaching energies up to eV (Picozza & Boezio 2013). The deep knowledge on air-showers properties gained by the CTA community will be a strong asset for future common works with the SKA collaboration.
References:
Aliu, E., et al., 2008, Science, 322, 1221;
Bartos, I., et al., 2014, MNRAS, 443, 738;
Carr, J., et al., 2015, PoS, (ICRC2015)1203;
de Oña-Wilhelmi, E., et al., 2013, APh, 43, 287;
Gadjus, M., et al., 2015, PoS, (ICRC2015)841;
Mazin, D., et al., 2013, APh, 43, 241;
Murase, K., et al., 2016, MNRAS, 461, 1498;
Nakamori, T., et al., 2015, PoS, (ICRC2015)774;
Picozza, P. & Boezio M., 2013, APh, 43, 163;
Sol, H., et al., 2013, APh, 43, 215
3.9 LIGO and Virgo
A new era for transient astronomy began with the first gravitational-wave events detected by the Advanced LIGO detectors. One of the up-coming milestones is to connect this new type of observation with that of conventional astronomy by the detection of an electromagnetic counterpart to a gravitational-wave event. To this aim, an extensive electromagnetic follow-up program has been set up through collaborative agreements signed between the LIGO and Virgo collaborations and more than 80 astronomer teams around the world. This network of follow-up instruments includes several SKA precursors such as ASKAP, MeerKAT and the MWA. Alerts are generated from the gravitational-wave data and communicated to those teams through a dedicated network.
As of today, short-hard gamma-ray bursts are the most promising counterpart candidate. There are strong indications that those gamma-ray bursts are connected with compact binary mergers (including at least a neutron star). If this is true, gravitational-wave events from such binary mergers would then be associated with a prompt gamma-ray flash, and an afterglow emission that extends from X-rays down to radio frequencies. Only few short gamma-ray burst afterglows have been detected so far. Recent reviews (Chandra & Frail 2012) mention the afterglow detection for only two short gamma-ray bursts so far, i.e. GRB050724 and GRB051221A; both were observed by the Very Large Array at 8.5 GHz.
It is expected that the SKA will revolutionise this science. The SKA-MID survey will improve those detection rates by many orders of magnitude (Burlon et al. 2015). Furthermore, it is expected that the SKA will also detect many “orphan” afterglows associated to sources that are not pointing to Earth (see Sect. 2.5.1.3). Those future detections will be potentially associated to LIGO/Virgo events if they occur within the horizon of the gravitational-wave detectors.
The LIGO Scientific Collaboration and the Virgo Collaboration have produced a plan for the scientific observations to be conducted with the current second generation “advanced” detectors over the next 10 years, through 2025 (Abbott et al. 2016). Over this period, the Japanese KAGRA detector and the LIGO India observatory will also start operation. The SKA development plan is well in-line with this schedule.
The size of the gravitational-wave error region is determined by the ratio
between the observed gravitational wavelength by the distance between
gravitational detectors in the network. For instance, the LIGO network resolves
the source in a very large sky region, that extends over 1000 square degrees,
typically. Thanks to its very large field-of-view, including in the GHz range,
the SKA will be a powerful and versatile observatory for the follow-up of
gravitational-wave candidates.
References:
Chandra, P. & Frail, D. A., 2012, ApJ 746, 2;
Burlon, D., et al., 2015, AASKA14, 52;
Abbott, B. P., et al., 2016, LRR, 19, 1
3.10 CMB polarisation experiments
Measurements of the cosmic microwave background (CMB) provide the cleanest experimental approach to search for evidence of an inflationary phase in the early Universe. In particular, the primordial gravitational waves generated during that epoch induce a specific signature in its polarisation properties.
The CMB polarisation signal can be divided into even and odd parity - and -modes (Kamionkowski et al. 1997). -mode polarisation, sourced by both scalar (curvature) and tensor (gravitational wave) perturbations, has been detected at high significance. However, the primordial -mode polarisation signal, arising only from the intrinsically weaker tensor perturbations, has yet to be discovered. We quantify constraints on -modes in terms of the ratio, , of the tensor fluctuations (gravitational waves) to scalar (density) fluctuations, evaluated at a given spatial wavenumber. The -mode power spectrum has a peak at the horizon scale at recombination () with an amplitude proportional to this ratio. Reionisation then introduces an additional peak at low- () with an amplitude that depends on the optical depth of the Universe, .
Current measurements of the Galactic foreground emission imply that primordial -modes will be sub-dominant on all angular scales and over all observational frequencies in the microwave regime (Krachmalnicoff et al. 2016; Choi et al. 2015). Measurements of the CMB signal at the nK level thus requires subtraction of the foregrounds at sub-percent accuracy.
Analysis of the WMAP and Planck data has demonstrated that the polarised Galactic emission is well-described by the combinaton of synchrotron radiation and thermal dust emission (Planck Collaboration X 2016). Synchrotron emission, produced by cosmic ray electrons spiraling in the Galactic magnetic field, dominates at low frequencies ( GHz), while at higher frequencies polarised dust emission is the dominant foreground component. In principle, the CMB polarisation signal can be distinguished from these Galactic foregrounds by their different frequency spectra, and SKA should allow the study of the low frequency foregrounds up to the 12–14 GHz window.
The measured synchrotron emission is dependent on the density of the relativistic electrons along a given line-of-sight, and approximately to the square of the plane-of-sky magnetic field component, and can be strongly polarised in the direction perpendicular to the Galactic magnetic field. Its spectral energy distribution (SED) is typically modeled as a power law, although there is no precise determination of the spatial variation of the synchrotron spectral index, either in intensity or polarisation. Some form of spectral curvature is often considered relevant for the description of observations at microwave frequencies (Kogut et al. 2007). In detail, the observed polarised emission is seen to arise mainly in a narrow Galactic plane and well-defined filamentary structures that can extend over 100 degrees across the sky and be polarised at a level of 40% (Vidal et al. 2015). However, away from these features and at high latitudes, the polarisation fraction is less than 15%.
Although the synchrotron and thermal dust emission are the dominant contributors to the diffuse polarised Galactic foreground, uncertainties in the current data may still allow other components to contribute at fainter levels. The so-called ”Anomalous” microwave emission (AME) has been studied by Planck towards specific dust and H ii regions in intensity and defined the shape of its emission at frequencies above 30 GHz. If AME is solely due to spinning dust particles (Draine et al. 1998), then we expect it to have a polarisation percentage of less than 1%, and a polarisation fraction that decreases with increasing frequency. Indeed, the most recent theoretical work (Draine et al. 2016) predicts negligible polarisation at frequencies above 10 GHz. However, AME might arise from other physical mechanisms and it is important to confirm its polarisation properties empirically. While recent measurements imply that the level at which AME is polarised is low (Planck Collaboration XXV 2016), a failure to account for it could bias the measurement of in -mode searches (Remazeilles et al. 2016). SKA could provide detailed information about the low frequency emission of this foreground component.
Although these foregrounds are a particular obstacle to the extraction of the -mode signal on the largest angular scales, SKA high resolution and sensitivity maps of smaller regions will still contribute to an improved understanding of both their physical nature and statistical properties over the sky. Furthermore, the development of mosaicing techniques allowing matching between different fields-of-view and large-scale calibration will allow the mapping of the foregrounds on intermediate and large angular scales. Such information is crucial for component separation strategies that will benefit by extending the frequency range of various foreground templates adopted in the analysis and/or the inclusion of constraints about the spectral behaviour or statistical properties of the different components. In this context, a particularly important question is the extent to which the emission from a specific component is coherent across frequencies. As an example, the synchrotron emission along a given line-of-sight depends on the distribution of sources and the magnetic field structure. The detailed interplay of these physical structures, combined with the extent to which they are correlated or otherwise, can result in changes of both the polarisation fraction and angle with frequency. Moreover, this behaviour could incur departures from the power-law behaviour of either the frequency dependence of the emission, or power-spectrum parametrisation, as adopted in various component separation strategies. In addition, the extent to which foregrounds can be treated as Gaussian random fields, an assumption of other foreground cleaning approaches, will also be affected by this complex foreground behaviour.
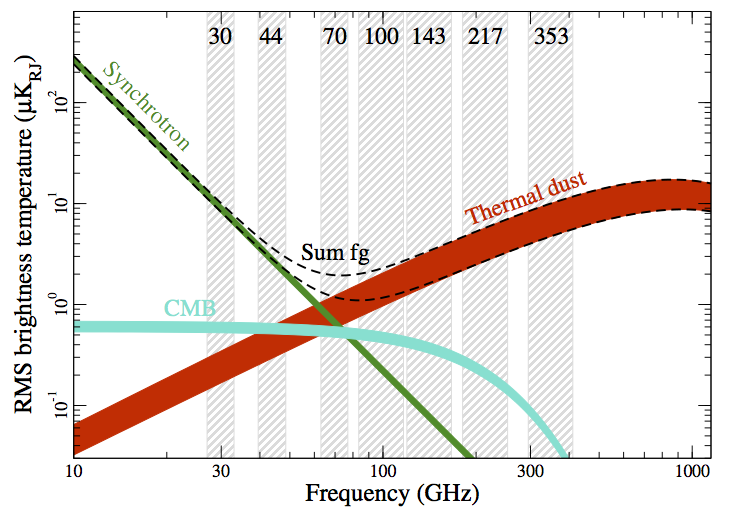
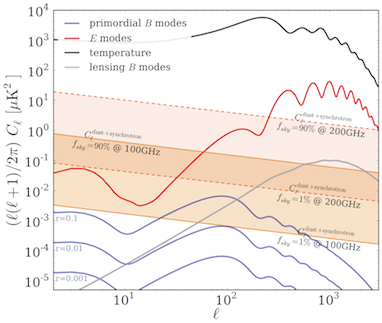
The presence of polarised extragalactic sources constitutes an
additional source of contamination. In general, the compact source
contribution does not impact the large angular scales (near the
reionisation peak), but can play an important role on intermediate and
small angular scales. It is likely that the contamination will need to
be removed with a combination of masking or subtracting individual
sources, and modelling residuals at the power-spectrum level.
We can seek to improve the source detection process using as a proxy
deep catalogues of compact sources detected by SKA. It should also be
noted that a large fraction of the radio sources that can be detected
in CMB experiments are variable. One way of addressing this problem is
to plan follow-up observations of sources in such a way that these
observations are performed near simultaneously with the CMB
observations.
References:
Choi, S. K. & Page L.A., 2015, JCAP, 12, 20;
Draine, B. T. & Lazarian A., 1998, ApJ, 508, 157;
Draine, B. T. & Hensley B. S., 2016, ApJ, 831, 59;
Errard, J., et al., 2016, JCAP, 03, 052;
Kamionkowski, M., et al., 1997, PRL, 78, 2058;
Kogut, A., et al., 2007, ApJ, 665, 355;
Krachmalnikoff, N., et al., 2016, A&A, 588, A65;
Planck Collaboration X, 2016, A&A, 594, A10;
Planck Collaboration XXV, 2016, A&A, 594, A25;
Remazeilles, M, et al., 2016, MNRAS, 458, 2032;
Vidal, M., et al., 2015, MNRAS, 452, 656
3.11 ALMA
The Atacama Large Millimetre Array (ALMA), located on the Chajnator plateau at 5000 m altitude in the Chilean Atacama desert, is a giant array of 66 radio antennas with baselines of up to 16 km. ALMA operates in the millimetre radio regime, in ten frequency bands between 40 and 960 GHz. This joint European/US and Japanese interferometer, which is now nearing full commissioning, is the most advanced millimetre radio facility in the world, with a strong focus on the cold neutral medium and star formation in the Milky Way and external galaxies. ALMA is groundbreaking in particular because it opens up new observational windows in the sub-millimetre regime, and because it offers the unique possibility of high-resolution observations with minimum beam sizes of currently about 0.02. Its main strengths are to characterise the cold interstellar medium, molecular clouds, and star and planet formation in the Milky Way, and to trace cold atomic and molecular gas and star formation in external galaxies throughout cosmic history. ALMA can image the gas kinematics in protostars and protoplanetary disks around young Sun-like stars in the nearest molecular clouds, and detect spectral line emission from CO or [CII] in a Milky-Way like galaxy at redshift . France is amongst the most competitive ALMA users, having reached the highest European proposal success rate in 2015.
Combining SKA and ALMA will boost our capabilities in studying star formation even further. Neither facility alone covers the full range of molecular transitions and star-formation tracers, which together characterise the immense complexity in the main environments where stars form, be it at the scales of planetary disks around young stars, giant molecular clouds and star-forming regions, or entire galaxies and galaxy clusters. Examples where SKA/ALMA synergies will be particularly fruitful range from the erosion of protoplanetary disks around nearby massive star to studies of large samples of galaxies over wide redshift ranges (e.g. Carilli et al. 1999).
For example, in protoplanetary disks, ALMA will trace the molecular gas, whereas SKA will probe the photoionised gas flow from the disk as well as the interaction zone between the gas and the impinging stellar wind (e.g, Fuller et al. 2014). ALMA and SKA will also be highly complementary in probing dust grain growth and the formation of complex molecules within these disks (Fuller et al. 2014), an important step towards understanding the origin of life on Earth, and potentially in other planetary systems. For extragalactic studies, SKA will quantify AGN and star formation activity from the synchrotron and free-free components of the centimetre continuum, and probe neutral atomic Hydrogen through HI, whereas ALMA will trace dense molecular clouds and warm dust heated by star formation. The tight empirical correlation between far-infrared and centimetre radio continuum (FRC) and radio polarimetry will open up novel avenues to probe star-formation histories and AGN content, and magnetic fields, cosmic ray budgets, and the internal structure of the interstellar medium in galaxies out to high redshift, which are hitherto very little explored for all but the most nearby galaxies. The FRC and HI surveys will provide redshifts for large samples of star-forming galaxies over wide redshift ranges, and enable targeted follow-up with ALMA of the molecular gas and dust. The SKA/ALMA synergy will be transformational to study how diffuse, ambient gas seen in HI condenses into molecular clouds, unimpeded by dust, and from the Milky Way to the most intensely star-forming galaxies at the peak in cosmic star formation history. Understanding the link between star formation and galaxy growth is one of the fundamental open questions of extragalactic astronomy today.
Another fundamental question is why star formation and baryon cooling are so inefficient, in individual molecular clouds abd distant galaxies, alike. Only about 1% of the available gas forms stars within a free-fall time (e.g. Shimajiri et al. 2017). Theory suggests that turbulence and magnetic fields both play a role, but only turbulence can be probed directly today with ALMA (e.g. Canameras et al. 2017). Magnetic fields are probably also important (e.g. Hennebelle et al. 2011), but can be studied directly and at high resolution only when SKA will become operational.
On top a wealth of complementary scientific themes, ALMA
illustrates also how a novel world-class facility can become the basis
of a new, transformative field at the forefront of current
research. The success of ALMA, one of the most competitive
observatories in the world today, is therefore an excellent example to
highlight the immense foreseeable scientific and community-building
potential of SKA.
References:
Canameras, R., et al., 2017, A&A accepted, astro-ph/1704.5853;
Carilli, C. L. & Yun, M.S., 1999, ApJL, 513, 13;
Fuller, G., et al., 2015, AASKA14, 152;
Hennebelle, P., et al., 2011, A&A, 528, 72;
Shimajiri, Y., et al., 2017, A&A accepted, astro-ph/1705.00213
3.12 NenuFAR
NenuFAR (the New extension in Nançay upgrading LOFAR) is a low-frequency SKA pathfinder presently in construction and commissioning in Nançay (Zarka et al. 2012, 2015a). Made of 100 hexagonal arrays of 19 antennas, it will be altogether and simultaneously a beamformer more sensitive than the LOFAR core (with instantaneous resolution) and a spectropolarimetric imager in the range 10-85 MHz. The imager will work in fast (1 sec) low resolution () mode, and in a slower mode (8 hours) providing 10’ resolution. Being connected to the LOFAR array, NenuFAR will also be a LOFAR super LBA station. All the different modes are usable together in parallel, with the only constraint that the analog beam of each elementary 19-antenna array can point at a single direction of the sky at any given time (bit different arrays can point to different directions and the instantaneous analog FoV is broad, of order of several 10’s degrees. NenuFAR will be equipped of various backends: the LOFAR station backend in super station mode, an autonomous beamformer (LaNewBa) capable of synthesising up to 768 beamlets of 200-kHz bandwidth independently steerable, and a LOFAR-like correlator. The beamformer will be connected to a pulsar receiver (computing in real-time dedispersion + dynamic spectra), and hopefully to a SETI-machine (computing super-high spectral resolution maps).
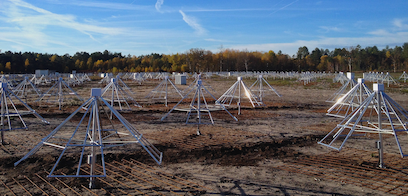
Beyond the technological experience gained through the development of NenuFAR, that can be partly applied to SKA (see Sect. 4.1.1), NenuFAR will also serve to prepare the French community, through the analysis of LF radioastronomy products (dynamic spectra and image cubes, in intensity and polarisation), to the exploitation of SKA. A large fraction of the French SKA community is interested in its pathfinder NenuFAR.
Being located in the northern hemisphere (at a latitude of 47.4∘ North and a longitude of 2.2∘ East), NenuFAR can cover the latitude range from 90∘ to about -20∘ latitude. SKA-LOW will be located in Western Australia at a latitude about 26.5∘ South and a longitude of 116∘ East, and will observe up to +20∘ latitude. The two instrument will thus share the equatorial sky. Being separated by 7.6 hours in longitude, they will be able to observe simultaneously any given target about 1 hour per day quite far from zenith, but conversely they can provide a complementary coverage for 16 hr per day of sources within latitude. NenuFAR covers the spectral range 10-85 MHz, whereas SKA-LOW will cover the range 50-350 MHz. Thus besides ensuring the above-mentioned coverage in the band 50-85 MHz, NenuFAR will considerably extend the SKA-LOW range toward the lowest frequencies observable from the ground.
SKA and NenuFAR will be very complementary for studying several scientific subjects. While SKA will be the best instrument to detect the Epoch of Reionisation signal, NenuFAR may be a serious competitor to SKA for the detection of the dark ages/cosmic dawn signal, due to its greater compacity (filling factor) (Koopmans et al. 2015). SKA will be a formidable pulsar detection machine, but NenuFAR may allow to study their spectra down to 10 MHz, identifying turnover frequencies, measuring DM with exquisite accuracy and addressing in a complementary way interstellar propagation effects and the physics of pulsar magnetospheres (Zakharenko et al. 2013). LOFAR detected far less non-pulsar transients than expected in imaging mode (Stewart et al. 2016), so that the outcome of SKA in that domain in difficult to predict. Conversely, the Ukrainian UTR-2 array detected many transient in its blind beamformed search of the northern sky (Zakharenko et al. 2015; Vasylieva 2015). NenuFAR being a sensitive beamformer, it is expected to be an efficient transients detector. The blind detection of transients by an instrument will motivate comparisons and follow-up studies with the other one.
SKA will study stellar emissions (flares, cool dwarfs – Sect. 2.4.4) and search for emissions induced by star-planet plasma interactions (Sect. 2.4.2), radio emissions from planetary magnetospheres themselves may be at too low frequencies for SKA (like Jupiter’s decametric auroral and satellite-induced emissions). They will be accessible with NenuFAR, down to 10 MHz. Jupiter itself, will have its synchrotron radiation studied with SKA (Sect. 2.4.1.1) but its decametre emission accessible from NenuFAR only. For Solar studies (Sect. 2.4.3), SKA and NenuFAR will be very complementary, covering respectively the altitude range (for plasma emissions) from 1. to 1.5 RS and from 1.2 to 3–5 RS. This also means that scintillation of radio sources through the Solar wind can be studied up to that distance with NenuFAR. NenuFAR and SKA will cover the different frequency ranges where planetary lightning (Saturn, Uranus, Venus? – Sect. 2.4.1.3), terrestrial lightning and transient luminous events (Sect. 2.4.1.4), meteors showers (Sect. 2.4.1.5), and Radio Recombination Lines (Asgekar et al. 2013; Oonk et al. 2014) can be usefully studied. It is also desirable that SETI searches be conducted in “piggyback” mode both on SKA (Sect. 2.4.5) and on NenuFAR. The science of NenuFAR has been described in a reference document (NenuFAR-France consortium 2014) that should be published soon.
References:
Asgekar, A., et al., 2013, A&A, 551, L11;
Koopmans, et al., 2015, AASKA14, 1;
NenuFAR-France consortium, 2014, https://nenufar.obs-nancay.fr/Argumentaire-scientifique.html;
Oonk, J.B.R., et al., 2014, MNRAS, 437, 3506;
Stewart, A.J., et al., 2016, MNRAS, 456, 2321;
Vasylieva, I., 2015, PhD thesis, https://tel.archives-ouvertes.fr/tel-01246634;
Zakharenko, V.V., et al., 2013, MNRAS, 431, 3624;
Zakharenko, V.V., et al., 2015, OAP, 28, 252;
Zarka, P., et al., 2012, SF2A-2012, S. Boissier et al.eds., 687;
Zarka, P., et al., 2015a, Int. Conf. Antenna Theory & Techniques, Kharkiv, Ukraine, 13;
Zarka, P., et al., 2015, AASKA14, 120
3.13 SVOM
Scheduled for a launch in 2021, SVOM (“Space-based multi-band astronomical Variable Objects Monitor”) is a Sino-French space mission dedicated to the study of the transient sky, focusing on the Gamma-Ray Bursts (GRBs).
The satellite payload encompasses a coded-mask telescope operating in the 4-150 keV energy range for real-time detection and localisation of all known types of GRBs, a non-imaging gamma-ray monitor extends the GRB spectroscopy up to MeV energies, and two narrow-field follow-up telescopes to refine the GRB positions and to study their afterglow emission in the X-ray and visible bands. The pointing strategy of the satellite has been optimised to favour the detection of GRBs and transients located in the night hemisphere, in order to enhance ground-based observations in the first minutes and to facilitate GRB redshift measurements by the largest telescopes. The SVOM ground segment combines a wide-field camera to catch the GRB prompt emission in the visible band and two robotic telescopes to measure the photometric properties of the early afterglow in the NIR/visible band.
All details of the SVOM mission and science perspectives are given in Wei et al. 2016. Fig. 66 summaries the spectral coverage of the different SVOM instruments.

The observation program of SVOM is split in three part :
-
•
CP : the Core Program is dedicated to the GRB science. Sect. 2.5.1.3 describes the GRB science with SKA. SVOM will provide GRB alerts to the community and is expected to play a central role in GRB science.
-
•
GP : the General Program consists in the targets the satellite will follow while waiting for a GRB. The General Program will allow the survey of interesting targets compliant with the satellite attitude law (Virgo cluster for example). Joint observations with SKA could be planned.
-
•
ToO : the Target of Opportunity program consists in the target programmed from the ground after the reception of an alert (there are different kind of ToO depending on the delay we accept for the start of the observations). The ToO program is of first interest for transient events detected by SKA. Fig. 67 shows interesting transient events that can be studied with SVOM. The nominal ToO program (ToO-NOM) allows one ToO per day of one orbit with a typical 48h delay (5 ToO-NOM per day after 3 years). With the ToO-NOM program we will be able to follow SKA transients events to characterise them both in X-rays and optical (with space and ground telescopes). The exceptional ToO-EX allows to reduce the delay to 12h in case of an interesting event (once per week in average) and permits to extend the observation to one day. Finally the multi-messenger ToO-MM will allow the follow-up of multi-messenger events whose localisation is uncertain by tiling a part of the error box region (gravitational wave will be of first importance (see Sect. 2.5.2.2) as well as HE neutrinos).
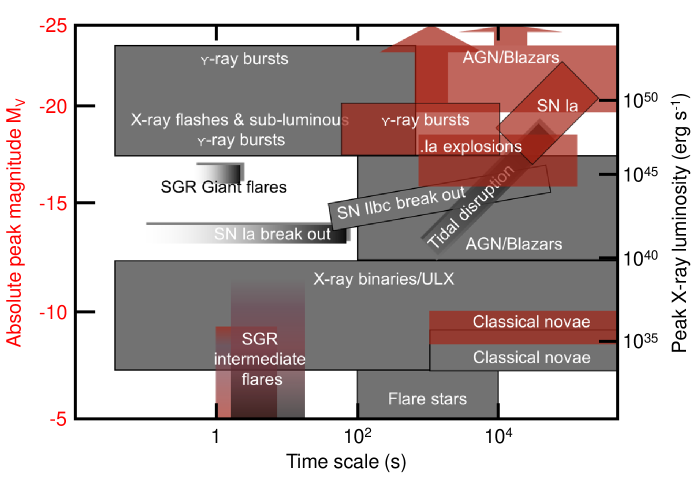
SKA and SVOM will be major instruments. At the interface we find the transient events observed in multi-wavelength (GRBs,…) and the multi-messenger astrophysics. Synergies have to be identified and dedicated programs built, in the following years, to be ready for the launch of SVOM.
References:
Wei, J., et al., 2016, arXiv:1610.06892 : The Deep and Transient Universe in the SVOM Era: New Challenges and Opportunities - Scientific prospects of the SVOM mission;
Jonker, P., et al., 2013, arXiv:1306.2336
3.14 VLBI
VLBI is a unique tool in astronomy to study the compact radio emission of celestial bodies in extreme details and to pinpoint their direction in the sky with unprecedented accuracy. The technique has been used in fundamental astronomy for establishing celestial reference frames and in astrophysics to investigate the non-thermal continuum and line emission of galactic and extragalactic objects. The main such targets studied with VLBI are the black-hole powered active galactic nuclei and their relativistic jets, disks, shells, and the atomic and molecular gas outflows in star forming regions, young stellar objects, stars, supernovae and their descendants. Additionally, ultra-precise relative VLBI astrometry has made possible the determination of distances and transverse velocities of Galactic objects out to a distance of tens of kpc through measurements of proper motions and parallaxes.
The current VLBI arrays which have the capability to observe in the SKA1-MID frequency range (350 MHz–14 GHz) are the European VLBI Network (EVN), which comprises antennas in Europe, China and South Africa, the Very Long Baseline Array (VLBA) in the United States, and the Australian Long Baseline Array (LBA). At higher frequencies (22 GHz and above), the VERA (VLBI Exploration of Radio Astrometry) array in Japan and the Korean VLBI Network (KVN) are also available. All such arrays are run independently, based on pier-reviewed scientific proposals submitted by the community. They can also conduct joint observations if needed. On the geodesy and astrometry side, VLBI observing is coordinated by the International VLBI Service for geodesy and astrometry (IVS). The primary mission of IVS is to monitor the Earth’s rotation and establish fundamental terrestrial and celestial reference frames. The Bordeaux (LAB) and Paris (SYRTE) VLBI groups are partners of IVS and contribute as analysis and data centres. Of particular interest is the next generation IVS system, namely VGOS (VLBI Global Observing System), designed to observe 24 hours a day, ultimately all year round, and in the process of deployment. VGOS will be made up of fast-moving 12-m antennas similar to those of the SKA DISH array and will observe a broad frequency band (2–14 GHz), largely overlapping with Bands 4 and 5 of SKA.
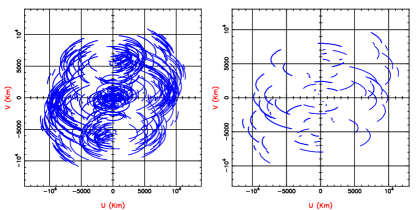
In Europe, the Joint Institute for VLBI in Europe (JIVE), an ERIC entity funded by 10 partners, including France, is charged with the processing of the observations acquired with the EVN using its high-level correlator. Additionally, JIVE provides assistance to the users at all stages of the observing process, from proposal preparation to data analysis. In the coming years, the technical capabilities and services offered by the institute will be further enhanced through the JUMPING JIVE (2017–2020) H2020 project, of which CNRS (through the LAB) is a partner. The enhancements include adding a geodetic/astrometric capability to the correlator, making the observation scheduling smoother, and preparing for the future, especially for SKA-VLBI. Work will also be directed towards incorporating new telescopes and developing new partnerships, notably in Africa, along with outreach.
The inclusion of a high-resolution component with baselines longer than 1000 km has long been considered an essential part of the SKA concept. Such a component will greatly broaden the science delivered by SKA by providing unparalleled flux density sensitivity on compact angular scales probed by VLBI. Different approaches will be considered for SKA1 and SKA2 to achieve high resolution. In SKA1, the SKA core will be incorporated as an additional element in existing VLBI networks, hence boosting their sensitivity, with correlation accomplished using current VLBI correlators. Key to the success of this approach will be the addition of a few (2–4) remote telescopes in Africa to provide the short and medium length baselines to the SKA core required to obtain good - coverage (Fig. 68). Ideal locations for these stations would be the developing African VLBI Network (AVN) stations in Zambia, Ghana, Kenya, and Madagascar (Gaylard et al. 2011). In the current era of rapidly expanding electronic-VLBI (e-VLBI) array, the organisation of such an array should not present any logistical problems. Implementation of the high-resolution component in SKA2 will be accomplished by having the remote stations an integral part of the array, with a significant portion of the collecting area (e.g. 25%) extending thousands of kilometres from the core, and with processing carried out with the SKA processor. This second-stage approach will make SKA a true array of transcontinental dimensions providing milliarcsecond resolution at sub-Jy sensitivities. An overview of the science to be achieved with such an instrument may be found in Godfrey et al. (2011) and Paragi et al. (2015). As for the reference frame area, further details are also given in Sect. 2.6.4 of this book.
References:
Gaylard, M. J., et al., 2011, Proceedings of SAIP2011, the 56th Annual Conference of the South African Institute of Physics, Eds. I. Basson and A. E. Botha, p. 425;
Godfrey, L., et al., 2011, SKA Memo No. 135;
Paragi, Z., et al., 2015, AASKA14, 143
4 Technological developments
Contributors of this section in alphabetic order:
M. Allen [Université de Strasbourg, CNRS, Observatoire astronomique de Strasbourg, UMR 7550, Strasbourg, France], R. Ansari [Laboratoire de l’Accélérateur Linéaire, IN2P3-CNRS, Université de Paris-Sud, Orsay Cedex, France], R. Ammanouil [Université Côte d’Azur, Observatoire de la Côte d’Azur, CNRS, Laboratoire Lagrange, Nice, France], J. Bobin [IRFU, CEA, Université Paris-Saclay, Gif-sur-Yvette, France;Université Paris-Diderot, AIM, Sorbonne Paris Cité, CEA, CNRS, Gif-sur-Yvette, France], S. Bosse [Station de Radioastronomie de Nançay, Observatoire de Paris, PSL Research University, CNRS, Univ. Orléans, Nançay, France], R. Boyer [L2S, UMR 8506, CentraleSupélec/CNRS/Université Paris-Sud, Université Paris-Saclay, Gif-sur-Yvette, France] M. Caillat [LERMA, Observatoire de Paris, École normale supérieure, PSL Research University, CNRS, Sorbonne Universités, UPMC Univ. Paris 06, Paris, France], J. Cohen-Tanugi [Laboratoire Univers et Particules de Montpellier, Université de Montpellier, CNRS/IN2P3, Montpellier, France], B. Da Silva [Station de Radioastronomie de Nançay, Observatoire de Paris, PSL Research University, CNRS, Univ. Orléans, Nançay, France], L. Denis [Station de Radioastronomie de Nançay, Observatoire de Paris, PSL Research University, CNRS, Univ. Orléans, Nançay, France], W. van Driel [GEPI, Observatoire de Paris, PSL Research University, CNRS, Meudon, France], M. N. El Korso [LEME, EA 4416, Université Paris-Ouest, Ville d’Avray, France], A. Ferrari [Université Côte d’Azur, Observatoire de la Côte d’Azur, CNRS, Laboratoire Lagrange, Nice, France], C. Ferrari [Université Côte d’Azur, Observatoire de la Côte d’Azur, CNRS, Laboratoire Lagrange, Nice, France], R. Flamary [Université Côte d’Azur, Observatoire de la Côte d’Azur, CNRS, Laboratoire Lagrange, Nice, France], N. Gac [L2S, UMR 8506, CentraleSupélec/CNRS/Université Paris-Sud, Université Paris-Saclay, Gif-sur-Yvette, France], S. Gauffre [Laboratoire d astrophysique de Bordeaux, Université de Bordeaux, CNRS, Pessac, France], F. Genova [Université de Strasbourg, CNRS, Observatoire astronomique de Strasbourg, UMR 7550, Strasbourg, France] J. Girard [IRFU, CEA, Université Paris-Saclay, Gif-sur-Yvette, France;Université Paris-Diderot, AIM, Sorbonne Paris Cité, CEA, CNRS, Gif-sur-Yvette, France], P. Larzabal [SATIE, UMR 8029, École Normale Supérieure de Cachan, Université Paris-Saclay, Cachan, France], D. Mary [Université Côte d’Azur, Observatoire de la Côte d’Azur, CNRS, Laboratoire Lagrange, Nice, France], D. Mourard [Université Côte d’Azur, Observatoire de la Côte d’Azur, CNRS, Laboratoire Lagrange, Nice, France], J.-F. Nezan [IETR, INSA Rennes, CNRS UMR 6164, Rennes, France], V. Ollier [SATIE, UMR 8029, École Normale Supérieure de Cachan, Université Paris-Saclay, Cachan, France;L2S, UMR 8506, CentraleSupélec/CNRS/Université Paris-Sud, Université Paris-Saclay, Gif-sur-Yvette, France], B. Quertier [Laboratoire d astrophysique de Bordeaux, Université de Bordeaux, CNRS, Pessac, France], S. Rakotozafy Harison [Station de Radioastronomie de Nançay, Observatoire de Paris, PSL Research University, CNRS, Univ. Orléans, Nançay, France], C. Richard [Université Côte d’Azur, Observatoire de la Côte d’Azur, CNRS, Laboratoire Lagrange, Nice, France], J.-L. Starck [IRFU, CEA, Université Paris-Saclay, Gif-sur-Yvette, France;Université Paris-Diderot, AIM, Sorbonne Paris Cité, CEA, CNRS, Gif-sur-Yvette, France], M. Tagger [LPC2E, CNRS, Université d’Orléans, Orleans, France], C. Tasse [GEPI, Observatoire de Paris, PSL Research University, CNRS, Meudon, France], S. Torchinsky [Astroparticule et Cosmologie APC, Université Paris Diderot, CNRS/IN2P3, CEA/IRFU, Observatoire de Paris, Sorbonne Paris Cité, Paris, France], P. Zarka [LESIA, Observatoire de Paris, PSL Research University, CNRS, Sorbonne Universités, UPMC Université Paris 06, Université Paris Diderot, Meudon, France;Station de Radioastronomie de Nançay, Observatoire de Paris, PSL Research University, CNRS, Univ. Orléans, Nançay, France]
4.1 SKA pathfinders and prototypes
4.1.1 LOFAR and NenuFAR
When they joined the international LOFAR collaboration and installed the LOFAR FR606 station in Nançay, French scientists and engineers started developing NenuFAR (the New extension in Nançay upgrading LOFAR), an original instrument aimed at pushing performances in the lowest frequency range of the telescope (10-85 MHz). The initial goal was to create a massive LOFAR “superstation”, replacing each of the 96 low-band antennae of FR606 by a mini-array of 19 analog-phased antennae, thus promising to enhance considerably and in many ways the performances of LOFAR. As the design progressed it became clear that, when used by LOFAR in single-station mode, this led to an instrument with unique capabilities. It was thus decided to add to NenuFAR a local dedicated back-end, that permits it to be operated simultaneously and independently, as two instruments: the LOFAR SuperStation (LSS) and a stand-alone fully autonomous instrument (Zarka et al. 2014). The only constraint is that the stand-alone observations must be done within the wide (10’s of degrees) station beam defined by LOFAR when the european network uses the superstation. More recently, it was decided to make the stand-alone NenuFAR an imaging instrument by adding a few () mini-arrays a few km from the core, enabling it to produce images with a strongly reduced confusion limit. When completed, NenuFAR will include 96 mini-arrays of 19 dual-polarised elements, densely covering a disk of 400 m in diameter, plus the remote ones. Its construction and operations are fully modular, so that it is presently under construction with funding secured for mini-arrays plus the imager, and commissioning is in progress. NenuFAR (see also Sect. 3.12 for the scientific synergies) has been labelled as a pathfinder of SKA.
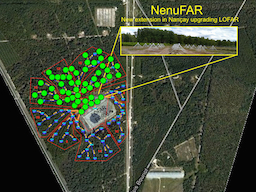
The technological developments have involved:
-
•
The antennae radiators: optimised parameters include a broad and smooth beam (nearly isotropic, albeit with extinction below 20 deg elevation) and maximum efficiency (related to electrical and ground losses), over a large frequency bandwidth; this implies an antenna radiation resistance and (low) reactance as constant as possible over the band of interest and versus time; cost effectiveness and compatibility with LOFAR strongly favoured linearly polarised crossed dipoles; the optimal compromise is a thick inverted- V dipole similar to the LWA Fork (see Fig. 65), with a metallic ground screen. Since the optimisation study resulted in a design extremely close to the one used for the LWA, the LWA radiator model was chosen.
-
•
The antennae contain each an ASIC preamplifier, whose design (made in France) ensures a very flat response over the whole (10-85 MHz) frequency range with a noise 10 dB below the sky noise level (Girard et al. 2012).
-
•
The phasing within the mini-arrays is performed by delay lines. In order for this to be cost-effective, they must be mutualised for groups of antennas, e.g. by arranging antennas with a regular spacing in two orthogonal directions. This has lead to a choice of 19 antennas per mini-array in a 3 / 4 / 5 / 4 / 3 pattern with each line shifted by 1/2 inter- antenna spacing relative to its neighbours. The absolute value of inter-antenna spacing was set to 5.5 m in order to maximise the effective area without overlap at LF, while keeping the NenuFAR extent compatible with its hosting at the Nançay station.
-
•
The 96 tiles are arranged in a relatively dense layout (see Fig. 69), providing a smooth overall beam with a low side lobe level. The optimal distribution of the 96 mini-arrays was computed using the “Boone algorithm” (Boone 2001), taking into account a site mask of the Nançay station including its limits and forbidden areas (the station FR606 itself and other antennas of the site). It gives NenuFAR a smooth, Gaussian distribution of visibilities in the (u,v) plane, and thus a near-Gaussian beam pattern. The layout of trenches and cables connecting the mini-arrays to the FR606 backend was optimised using a reasonable cost ratio per unit length of trench/cable in input to a specific optimisation algorithm.
-
•
Pointing will be controlled by a dedicated LCU (Local Command Unit) connected to 96 electronic modules, one in each LF tile, specifying the phasing scheme to be applied at any given time; these modules are designed to be completely radio-quiet outside pointing time; pointing will occur at intervals from 10 to 60 sec, ensuring low gain variation in the main beam direction. The NenuFAR LCU will be connected to the LOFAR LCU of station FR606. When NenuFAR is used in the SuperStation mode pointing commands will come from the LOFAR operations centre via the LOFAR LCU and be translated into phasing commands of the mini-arrays by the NenuFAR LCU; data recorded by the local LOFAR backend will be sent to the LOFAR central correlator. In Standalone mode, pointing orders will come from a local command computer, and the data will be recorded locally.
-
•
An autonomous beamformer (LaNewBa) has been developed for use in the stand-alone mode, LaNewBa can synthesise up to 768 independently steerable beamlets of 200-kHz bandwidth. A LOFAR-like correlator for the imager will be implemented. Furthermore, the beamformer will be connected to UnDySPuTeD, a pulsar receiver, computing in real-time dedispersion and dynamic spectra over the full 10-85 MHz band, with variable spectral and temporal resolution. Hopefully a SETI-machine (computing super-high spectral resolution maps) will be added.
All documentation can be found at the instrument website.
References:
Boone, F., 2001, A&A, 377, 368;
Girard, J., et al., 2012, C.R. Phys. 13, 33;
Zarka, P., et al., 2014, NenuFAR : instrument description and science case
4.1.2 EMBRACE
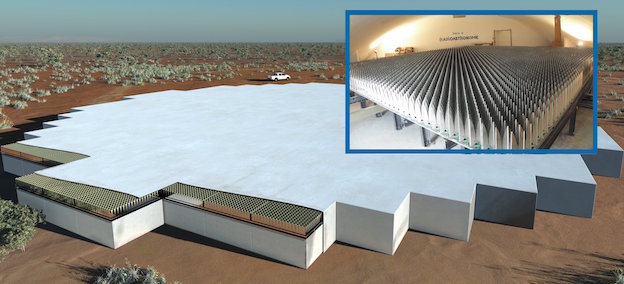
Modern digital technology has sparked a revolution in radio astronomy techniques, resulting in a fundamental change in how telescopes are built and operated. Instead of large mechanical structures, aperture arrays can be built which are composed of many small antennas with signals combined together to form the equivalent of a telescope with large collecting area. The design philosophy puts the hard work on the digital electronics, while the mechanical parts, such as dishes and antennas, are made as simply as possible. The result is an instrument built from many small mechanical components and electronically combined together with the power of fast digital processors. Not only is such a system easier to build and maintain, it also provides distinct operational advantages. Perhaps most importantly, aperture arrays have an extremely large field of view for fast surveys of the sky. This is the technology which makes the billion galaxy catalogue a feasible goal for the SKA, and in turn, will make a fundamental advance in our understanding of Dark Energy (Rawlings et al. 2004).
The challenge to move this design philosophy to higher frequencies is mainly driven by the large number of components and associated electronics. At frequencies around 1 GHz, the goal is to maintain the large field of view and observational flexibility made possible by the aperture array technology while surpassing the sensitivity of large parabolic dishes. This can only be done by fully sampling the aperture with antennas that are closely spaced together. The result is an instrument that collects all the available signal, as would do a dish of the same size, but having all the advantages of an aperture array, including the possibility for full sky imaging.
Observatoire de Paris has been a major partner in the development of dense phased arrays for radio astronomy since 2005, working closely with The Netherlands Foundation for Radio Astronomy (ASTRON). The joint project is called EMBRACE (Electronic MultiBeam Radio Astronomy Concept, Kant et al. 2011). With significant funding from European Commission FP6 project SKADS, an EMBRACE prototype was built and is operational at Nançay since 2010 (see Fig. 70, Torchinsky et al, 2016). The Observatoire de Paris developed the analogue integrated circuit responsible for the first stage of beam forming (Bosse et al. 2010), and also provided the sophisticated Monitoring and Control software (Taffoureau et al. 2011) Observatoire de Paris continues to be responsible for the characterisation and operation of the EMBRACE prototype with an on-going observing programme.
EMBRACE@Nançay has demonstrated its capability as a radio astronomy instrument,
including astronomical observations of pulsars and spectroscopic
observations of galaxies (Torchinsky et al. 2016). The multibeam
capability has also been demonstrated. For several years until 2017
when the prototype was ordered to shutdown, EMBRACE operated in the
manner of a facility instrument, doing regularly scheduled
observations showing that dense aperture array technology is stable
and reliable in the long term which is a key operational advantage for
the future Square Kilometre Array.
References:
Bosse, S., et al., 2010, Proc. EuMC, pp. 106–109;
Kant, G.W., et al., 2011, IEEE Trans. A&P, 59, 1990;
Rawlings, S., et al., 2004, NewAR, 48, 1013;
Taffoureau, C., et al., 2011, ADASS XXI, ASP Conf. Series, 461, 209;
Torchinsky, S.A., et al., 2016, A&A 589, 77
4.2 Participation in design studies
4.2.1 SKADS and PrepSKA
More than fifty years ago, Jean Heidmann at the Observatoire de Paris pointed out that a radiotelescope with nearly a square kilometre of collecting area was the next logical step in radioastronomy (Heidmann 1966). The Nançay Radio Telescope was just beginning operations and was the world’s largest collecting area for neutral hydrogen observations, but Heidmann already understood that a much bigger instrument was necessary in order to make cosmological surveys. He mentioned the possibility of cataloguing tens of millions of sources. This was visionary, and today the catalogue of a billion galaxies for cosmological studies remains a driving key project for the SKA.
When the International Astronomical Union (IAU) created the working group for a large radio telescope in 1993, French astronomers were active participants, and this effort continued through to the formal creation of the SKA Project by the IAU in 2000.
The most significant mobilisation of French effort for SKA began in 2004-2005 with the submission and start of the “Square Kilometre Array Design Studies” (SKADS). SKADS was funded by the European Commission Framework Programme 6 and had 26 international partners from 13 countries. Observatoire de Paris was a major partner in the SKADS consortium, having responsibility for the workpackage “Continuous assessment and critical reviews”, the vice-chairmanship of the Board, and a seat in the Management Team with the Project Scientist provided by Observatoire de Paris.
SKADS focussed on technological development for an aperture array implementation of SKA and also included science simulations to help inform the design process. The resulting “SKADS Simulated Skies” was the work of a number of PhD theses, including in France, and the papers produced by SKADS continue to be cited today (see for example, Baek et al. 2009; Levrier et al. 2009). The technology development led to the first astronomically capable dense aperture array for radio astronomy called EMBRACE (Kant et al. 2011; Torchinsky et al. 2016; see also Sect. 4.1.2). In particular, the EMBRACE prototype and the future Mid Frequency Aperture Array (MFAA) for SKA relies on integrated analogue beamforming technology developed at the Nançay Radio Observatory (Bosse et al. 2010; see Sect. 4.3.2). An overview of the SKADS project and results is published in the proceedings of the final conference (Torchinsky et al. 2009).
When the EC-FP6 funding ended for SKADS at the end of 2009, the EC-FP7 project PrepSKA was already underway, and SKADS partners naturally joined this effort. Much of the SKADS technical development evolved into the Aperture Array Verification Programme and was integrated to PrepSKA. The Observatoire de Paris maintained its leadership with the EMBRACE prototype testing, and developed EMBRACE into a functioning astronomically capable radio telescope with a long term observational programme (Torchinsky et al. 2016). The scientific efforts also continued, and French efforts in PrepSKA were instrumental in laying the groundwork for the next major step towards the SKA.
In 2011, France could not join for programmatic reasons as a full member of the new SKA Organisation. Nevertheless, thanks to the experience acquired during SKADS and PrepSKA, Observatoire de Paris provides the scientific leadership for the SKA MFAA consortium, with the Project Scientist having this rôle since more than a decade, and engineers from Nançay and Bordeaux still provide key technology for analogue integrated receiver, beamforming and digitisation (Sect. 4.3.2). The rest of this book details further and more recent SKA-related developments in France.
References:
Baek, S., et al., 2009, A&A 495, 389;
Bosse, S., et al,. 2010, Proc. EuMC, pp. 106–109;
Heidmann, J., 1966, L. Astr. 80, 157;
Kant, G.W., et al, 2011, IEEE Trans. A&P, 59, 1990;
Levrier, F., et al, 2009, PoS, 132, 5;
Torchinsky, S.A., et al., (eds). 2009, PoS, 132;
Torchinsky, S.A., et al,. 2016, A&A 589, 77
4.2.2 Interoperability Frameworks and Design Studies
The SKA will lead astronomy into a new era of Big Data where astrophysics research will rely on interoperable e-Infrastructures for the sharing and analysis of data. The realisation of multi-wavelength, multi-messenger and time domain astronomy requires that the SKA and other large observational and computational instruments of the discipline work together in an integrated way with common solutions. France is making significant contributions to build the necessary e-Infrastructures for astronomy and astroparticle physics that will directly benefit the SKA. This work is pursued via participation in the European H2020 projects “Astronomy ESFRI and Research Infrastructure Cluster Astronomy ESFRI and Research Infrastructure Cluster” ( ASTERICS), “Research Data Alliance” ( RDA) and “Advanced European Network of E-infrastructures for Astronomy with the SKA” (AENEAS), and builds on long term experience of developing the Virtual Observatory framework at the European and international levels(“European Virtual Observatory”, Euro-VO, Genova et. al 2015; “International Virtual Observatory Alliance”, IVOA), and the provision of reference data services such as the “Centre de Données Astronomiques de Strasbourg” ( CDS).
ASTERICS
The rationale of ASTERICS is to address cross-cutting synergies and common challenges shared by astronomy ESFRI facilities (CTA-SKA-KM3NeT-ELT). It brings together the astronomy, astrophysics and particle astrophysics communities, in addition to other related research infrastructures. Its major objectives are to support and accelerate the implementation of the ESFRI telescopes, to enhance their performance beyond the current state-of-the-art, and to see them interoperate as an integrated, multi-wavelength (MW) and multi-messenger (MM) facility. The French community is very active within ASTERICS.
CDS leads the “Data Access, Discovery and Interoperability” (DADI) work package of ASTERICS. The goal is to make the ESFRI and pathfinder project data available for discovery and usage by the whole astronomical community, interoperable in a homogeneous international framework, and accessible with a set of common tools. More specifically, the project is based on three actions: a) train and support ESFRI project staff in the usage and implementation of the VO framework and tools, b) train and support the wider astronomical community in scientific use of the framework, and c) adapt the VO framework and tools to the ESFRI project needs, and make sure European astronomers remain lead actors in the IVOA. The DADI work package also ensures a liaison with the RDA on data sharing initiatives.
The Laboratoire d’Annecy-le-Vieux de Physique de Particules (LAPP) leads the “OBservatory E-environments LInked by common ChallengeS” (OBELICS) work package. The objectives are to enable interoperability and software re-use for the data generation, integration and analysis of the ASTERICS ESFRI and pathfinder facilities. An essential ingredient is the creation of an open innovation environment for establishing open standards and software libraries for multiwavelength/multi-messenger data. Furthermore, development of common solutions for streaming data processing and extremely large databases is required. Study of advanced analysis algorithms and software frameworks for data processing and quality control is the third focus area. The specific objectives are: a) train researchers and data scientists in the ASTERICS ESFRI and pathfinder projects to apply state-of-the-art parallel software programming techniques, to adopt big-data software frameworks, to benefit from new processor architectures and e-science infrastructures, b) to maximise software re-use and co-development of technology for the robust and flexible handling of the huge data streams generated by the ASTERICS ESFRI and pathfinder facilities, c to adapt and optimise extremely large database systems to fulfil the requirements of the ASTERICS ESFRI projects, and d to study and demonstrate data integration across ASTERICS ESFRI and pathfinder projects using data mining tools and statistical analysis techniques on Petascale data sets.
Thanks to the links with ASTRONET, we are also chairing the Asterics Policy Forum, part of the management work package. The goal of the policy forum is to study how to harmonise joint and efficient scheduling, operation and interoperability of the various MW/MM telescopes. This global question will be addressed through 4 main strategic topics: 1/ Joint time allocation, 2/ observing strategies for MM campaigns, 3/ data access and sharing, and 4/ general policies of common interest (towards next generation ESFRI RI). The study is based on the four ESFRI RI involved in ASTERICS (CTA, E-ELT, KM3NET and SKA) but will also involve many other European astronomical facilities.
AENEAS
The AENEAS project is developing a concept and design for a distributed, federated European Science Data Centre (ESDC) to support the astronomical community in achieving the scientific goals of the SKA. The approach taken by AENEAS is to leverage existing products, technologies, services, best practices and standards offered by European e-Infrastructures and integrated e-Infrastructures worldwide.
AENEAS, which is coordinated by the Dutch institute ASTRON, includes participants from all the major European countries who are either official members or interested in the development of the SKA, as well as from the SKA Organisation and its international non-European partners. France is represented by CNRS/INSU, with four institutes taking part to two Work Packages (WP): WP2 (“Development of ESDC Governance Structure and Business Models”) and WP5 (“Access and Knowledge Creation”). Within this latter, particularly relevant is the role of CDS, which is contributing high level expertise on the development of interoperable systems for astronomical data services and the use of the Virtual Observatory framework. Also Françoise Genova (CDS) is mandated by RDA Europe to be the liaison with the AENEAS project.
Data from the SKA Observatory will have to be transported from South Africa and Australia to the regional data centres. Agreements with the network providers in the different host countries of these centres will have to be established. In Europe, a working group coordinated by the GÉANT infrastructure operates within the framework of the AENEAS project (WP4: “Analysis of Global SKA Data Transport and Optimal Storage Topologies”). Its objective is to assess the feasibility of transporting data from the SKA Observatory to Europe, as well as between the ESDC nodes. In order to prepare the transport of the data for a possible node in France, the coordination SKA France made contact with RENATER. Discussions related to specific challenges of these data centres are also underway within SKA France with experts of the field, both from industry (e.g. Bull-ATOS, DDN Storage, TAS) and from other academic institutes (e.g. INRIA).
The Strasbourg Astronomical Data Centre (CDS)
The CDS is an astronomy data centre that adds value to published and reference data, making them available via services that are widely used by the international astronomical community: SIMBAD, the reference database for astronomical objects, VizieR, for astronomical catalogues and associated data published in journals, the Aladin interactive sky atlas and Virtual Observatory portal, the CDS X-Match large astronomical catalogue cross-correlation service, and the CDS Portal.
The continuing role of CDS as a reference data centre in the era of SKA will include adaption of CDS services in support of the SKA. The CDS intends to host appropriate reference data generated by the SKA, and to support a high level of interoperability with remotely distributed data. The CDS will promote the application of HiPS technologies (Fernique et. al 2015) as a “hierarchical approach to Big Data” for the publishing, visualisation and analysis of SKA science-ready data, supporting models of distributed data hosting and remote computing. The CDS X-Match service and algorithms (Pineau et. al 2017) will also be developed for fast cross-correlation of the largest astronomical catalogues.
References:
Fernique, P., Allen, M.G., Boch, T., et al. 2015, A&A, 578, A114;
Pineau, F.-X., Derriere, S., Motch, C., et al. 2017, A&A, 597, A89;
Genova, F., Allen, M. G., Arviset, C., et al. 2015, Astronomy and Computing, 11, 181
4.3 Engagements in pre-construction phase
4.3.1 Signal processing
In an instrumental context such as that of the SKA, the processing of the signal recorded during the observations is an unprecedented challenge because of the complexity of the operations to be performed and the amount of acquired data that must be transmitted, stored and analysed. As described in Sect. 1.2, two SKA consortia are setting in place the operations that will transform the electric signals resulting from the array of thousands of antennas to the data product ready for science analysis: while the “Central Signal Processor” (CSP) is in charge of designing the hardware and software for the time-domain analysis and the correlation of interferometric data, the “Signal Data Processing” (SDP) element will transform raw visibilities in the deepest and highest resolution radio images of the sky.
The SDP pipeline will include complex mathematical operations for performing the essential steps of calibration and imaging. Sitting on an elegant and general formulation (the Radio Interferometry Measurement Equation; Hamaker & Bregman 1996; Hamaker et al. 1996), modern interferometry allows to create complex post-processing corrections, more powerful than the adaptive optics. But these new interferometers generate very large amounts of data (SKA will produce times more of data than all internet), and the inversion of a large () system of equation poses new and sometimes profound problems at the crossroads of mathematics, physics and algorithmic. Estimating the so-called “direction-dependent” terms in the measurement equation is a difficult and open problem (also known as “third generation calibration”, see Noordam & Smirnov 2011). Indeed, the system of many trillions of equations is non-linear, and sometimes ill conditioned.
As detailed in the next sections, the main contributions to the SKA data processing in France are related to the development of new algorithms for the radio interferometric calibration and imaging steps, and on hardware and software optimisation. Aware of this worldwide recognised French signal processing expertise and of the complexity of the SKA “Big Data” challenge, SKA France has undertaken an effort to coordinate the necessary know-how in France, both at academic and industry level. Several meetings dedicated to radio signal processing, in both its theoretical and applied aspects, have allowed to identify a group of French experts who are currently working on algorithmic developments for the SKA, including joint software and hardware tests that are unique in the international panorama and are based on the collaboration between industry and academic partners (see also Sect. 5.2.1). A press release of the SKA Organisation (“French researchers push forward radio image quality in view of the SKA telescope”121212The following links are available for more information: text of the press release, SKAO Science Highlights, interview about this topic of the SKA France coordinator.), published during the 2016 Science Conference in Goa ( “SKA 2016: Science for the SKA generation”), testifies the great interest with which the international community is following the signal processing developments of the French community.
Image reconstruction
An ideal radio interferometer composed of co-planar and identical antennas samples the sky in the Fourier domain. Reconstruction of the sky brightness consists of solving the hill-posed problem associated to these measures. However, for such arrays to provide meaningful images accurate, gain calibration which consists of solving for the unknown complex antenna directional gains, using a known (prior, or iteratively constructed) model of the sky is of critical importance.
Two researchers of Paris Observatory and Rhodes University / SKA South Africa (Cyril Tasse and Oleg Smirnov, respectively) have discovered that using recent theoretical results on complex optimisation, the bilinear structure of equation of the measure w.r.t. the unknown gains made it possible to obtain Jacobians and Hessians having exceptional properties. Compact but non-trivial structures appear in these matrices, and mathematical shortcuts can be used to solve the non-linear calibration problem (see Tasse 2014, and Smirnov & Tasse 2015 for more details). It then becomes possible to solve all the directions of the simultaneously and in full-polarization. The processing gain is of the order of the squared number of antenna ( for LOFAR and for SKA). A new imaging and deconvolution framework adapted to the specificities of Wirtinger’s algorithm (DDFACET, see Figs. 71 and 72) has also been developed (Tasse et al. 2017 in prep). This new family of complex optimisation algorithm are being applied to reduce the tens of Peta Bytes of the LOFAR surveys, see Fig. 71. The first light MeerKAT image has been produced using that method, see Fig. 72.
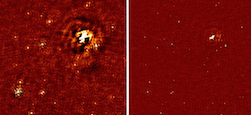
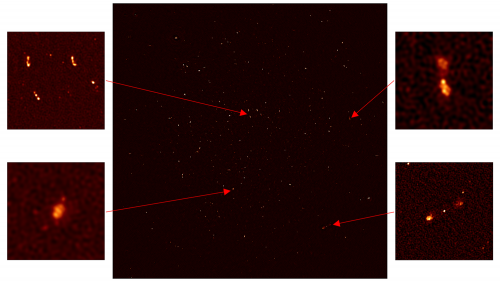
In parallel, two groups in France have started to develop sparse reconstruction techniques for radio interferometric (RI) and image deconvolution for SKA and pathfinder telescopes (such as LOFAR).
In the scope of Frontier Project FP3 (Labex UnivEarthS), researchers at CEA-AIM demonstrated with SASIR (“Sparse Aperture Synthesis Image Reconstruction”) the feasibility and the application to real LOFAR data, of using new imaging methods based on the latest mathematical frameworks of Compressed Sensing. They demonstrated that, in a “controlled” context (simulation and real data of good quality), SASIR brings better image reconstruction with low residuals and higher angular resolution compared to classical CLEAN-based methods (Garsden et al. 2015; Girard et al. 2015), see Fig. 73. The current phase of the development is to extend SASIR for multi-channel data: 1) in a “Time-agile” Sparse deconvolution algorithm (Girard et al., to be submitted) or “2D-1D” and 2) in a “Frequency-agile” Sparse deconvolution algorithm (Jiang et al., in press and to be submitted) or “fGMCA”. Accounting for Direction-Dependent Effects is performed using the imaging framework DDFACET described in the previous paragraph.
The first extension performs image reconstruction of radio transients associated with high-energy, catastrophic events involving particle/plasma/radiation interactions. They are difficult to image because they are either diluted (in time integrated image), or undetectable (low SNR of snapshot images). To cope with this problem, SASIR 2D1D deconvolution method was implemented by adding the temporal axis to the reconstruction (Girard et al., to be submitted). Sources in the data are deconvolved both spatially and temporally using 2D wavelet transforms (IUWT for spatial wavelets and 1D Haar or Daubechies wavelet as temporal in time). SASIR 2D1D brings an improvement (compared to snapshot imaging with CLEAN-based methods) of a factor of 5 in residuals in the images (root mean square) and factor of 2 improvement in the temporal profile reconstruction error on simulated data, thus increasing the probability of transients detection. A real 1 second VLA dataset containing a single pulsar event demonstrated the capability of temporal profile reconstruction.
The second extension of the CEA-AIM code relies on the formulation of wideband image deconvolution (i.e. multiple frequency channels) as a blind source separation problem. The sky is modelled as an unknown (spatial and frequency) mixture of unresolved and extended sources. Current methods rely on “serial” single-channel deconvolution or “joint” deconvolution. The fGMCA method combines: 1) frequency dependent PSF deconvolution using ForWard (Neelamani et al. 2004) and 2) “Blind Source Separation” solutions based on source morphology (gMCA, Bobin et al. 2007). fGMCA can not only reconstruct the data spatially, but also provide the independent frequency spectra of each recovered source. Main results of this theoretical work is the capability to disentangle the spectrum of Cygnus A (a complex extended source with filamentary structure) with a gaussian source blended with the central core of Cygnus A, below 1% reconstruction error. Application to real multi-channel RI data shows promising results in the context of the upcoming data from SKA1-MID and LOW.
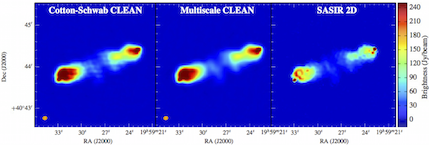
The Observatoire de la Côte d’Azur (OCA) has a long term experience in inverse problems for image reconstruction and actively develops algorithms for RI image deconvolution. The first main contribution is MORESANE (Dabbech et al. 2015), a greedy algorithm for narrow-band deconvolution which has been tested on SKA1 simulated observations of galaxy clusters (Ferrari et al. 2015). Since 2015, this research activity is developed within the ANR Project MAGELLAN (2015-18, PI OCA) which aims to investigate the potential of machine learning methods for the RI imaging. With regards to image deconvolution, they develop MUFFIN (Multi-Frequency Sparse Radio Interferometric imaging) which is a wide-band deconvolution algorithm based on sparse analysis priors and a state-of-the-art primal-dual optimisation algorithm (Deguignet et al. 2016). The spectral dimension critically blows up the size of this inverse problem. A major advantage of MUFFIN is that the most computing demanding steps (e.g. spatial wavelet decompositions and adjuncts of the decomposition operator) are separable w.r.t. the wavelengths, leading to an efficient parallel implementation on shared-memory architectures. A particular effort has been made to derive a scalable method for self tuning the various parameters, such as the regularisation coefficients (Ammanouil et al. 2017), see Fig. 74. Note that computer simulations are performed using the SKA Amazon Web Services Astrocompute Programme, in collaboration with SKA-SA. A collaboration with C. Tasse at Observatoire de Paris aims to integrate MUFFIN in the minor loop of DDFACET.
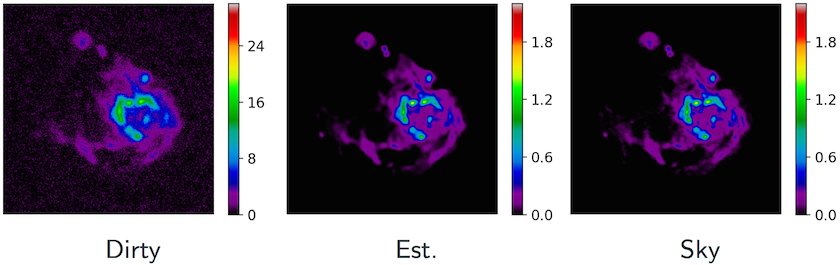
Calibration
Calibration is an essential challenge for the SKA, which is formed of a huge number of elementary antennas with a wide field of view, resulting in large collecting area and high resolution imaging. To achieve the theoretical optimal performance bounds, calibration, i.e., estimation of all unknown perturbation effects along the radiation propagation path, is a cornerstone of the imaging step. Indeed, lack of calibration results in severe distortions and artefacts during the image reconstruction step.
Several researchers in ENS Cachan, L2S Univ. Paris-Sud and Paris-Ouest have been working for since several years on this field. In Ollier et al. (2016), they proposed a novel scheme based on a broad class of distributions, gathered under the so-called spherically invariant random noise modeling (e.g., this includes the Student’s t and the K-distribution). With such flexible modeling, we can adaptively consider non-Gaussian heavy-tailed distributed noise in the presence of outliers, but also Gaussian noise when no outliers are present. The proposed algorithm is based on a step-wise numerical approach of the relaxed maximum likelihood estimation. It is worth noted that robust calibration can be even more enhanced if we exploit the known structure of some specific physical parameters across frequency. Considering the variation of parameters w.r.t. frequency leads to a more accurate direction dependent calibration and is particularly relevant for the SKA, since data volumes are huge and multiple frequency sub-bands are present. Based on this, in Ollier et al. (2017), they proposed a robust distributed calibration of radio interferometers with direction dependent distortions using the so-called Consensus-ADMM. Specifically, a set of computational agents is considered, each solving a local subproblem in a restricted frequency interval. Communication with a fusion center enforces consensus among agents thanks to known constraints, the goal being to solve a global constrained optimization problem while maintaining a low computational cost. Finally, numerical simulations highlighted the better estimation performance of the proposed technique w.r.t. non-robust and/or mono-frequency state-of-the-art cases (Ollier et al. 2016; Ollier et al. 2017). More specifically, the SIRP-based proposed algorithm reveals to be more robust than state-of-the-art calibration techniques, i.e., the classical non-robust Gaussian case which amounts to solve a least squares (Kazemi et al. 2011) and an alternative which proposes a Student’s t with independent and identically distributed entries (Kazemi & Yatawatta 2013) to model the noise and outlier contribution.
Developments on architectures
Between 30% and 40% of the SKA budget will be spent for the computing, including both hardware and software costs on both sites in Australia (SKA1-LOW) and Southern Africa (SKA1-MID). SKA1 represents 10% of the final system and approximately 1% of the data to compute. As described in Sect. 1.2, three processing systems will be developed (remote station, CSP, SDP) and the data from each telescope has to be processed independently and then correlated between each others in order to compute very high-resolution images of the sky (imaging part).
It is impossible to store the data in memories due to their huge amount (157 terabytes per second for SKA1-LOW for instance, enough to fill up 35000 DVD every second). Furthermore part of the computations must be done on site, as close as possible to the antennas to decrease the cost of the data transfers. The computers have thus to be powered with local production systems accurately sized. For each specific computing the best hardware/software solution must be found in terms of number of instruction per watt and per second.
The goal of a team of researchers at VAADER Rennes 1 University and L2S Univeristy Paris-Sud is to evaluate the best available technologies to provide this efficiency at low cost in a long-term perspective. This work is done with 2 laboratories already in SKA : the Auckland University of Technology (AUT - Andrew Ensor - New Zealand) and the Rhodes University (Oleg Smirnov - South Africa). Three technologies are especially investigated: FPGA (Field-Programmable Gate Array), GPU (Graphics Processing Unit) and the manycore MPPA (Massively Parallel Processor Array) from the French company Kalray. The transformation of the GPU to a manycore architecture has allowed a democratisation of its use since 10 years. It has been approved as a redoubtable powerful computing solution for massively parallel algorithms and experienced by the GPI team for several inverse problems (Gac et al. 2010). Nevertheless its energy efficiency is not always optimal and it could become in the future a barrier to its extensive use for big HPC project as SKA. Thats why, FPGA, known to be one of best energy efficient computation resources could be relevant in SKA context. FPGA will probably become more interesting with the emergence of new design tools known as HLS (High Level Synthesis). HLS tools reduce the time to market compared with the use of language description such as VHDL or Verilog. The Kalray MPPA has been designed from the beginning and exclusively as an efficient manycore architecture. MPPA is also a promising hardware accelerator for SKA data processing. All the CSP, SDP and SKA imaging algorithms are concerned by this work and the first to be studied are FFT, Cross Correlations, Gridding, Calibration algorithms.
References:
Ammanouil, R., et al., 2017, EUSIPCO;
Bobin, J., et al., 2007, IEEE Trans. on Im. Proc., 16, 11;
Dabbech, A., et al., 2015, A&A, 576, A7;
Deguignet, J., et al., 2015, EUSIPCO;
Ferrari, C., 2015, AASKA14, 75;
Gac, N., et al., 2010, proc. of CT meeting;
Girard, J. N., et al., 2015, JINST 10 C08013;
Garsden, H., et al., 2015, A&A, 575, 90;
Hamaker, J. P. & Bregman, J. D., 1996, A&AS, 117, 161;
Hamaker, J. P., et al., 1996, A&AS, 117, 137;
Hascoet, J., et al., 2015, DASIP;
Kazemi, S., et al., 2011, MNRAS, 414, 2;
Kazemi, S., Yatawatta, S., 2013, MNRAS, 435, 1;
Neelamani, R., et al., 2004, IEEE Trans. on Sig. Proc., 52, 2;
Noordam, J. E. & Smirnov, O. M., 2010, A&A, 524, 61;
Ollier, V., et al., 2017, IEEE TSP, DOI: 10.1109/TSP.2017.2733496;
Ollier, V., et al., 2017, submitted to IEEE SPL;
Smirnov, O. M. & Tasse, C., 2015, MNRAS, 449, 3;
Tasse C., 2014, arXiv:1410.8706
4.3.2 Research and Development on radio-frequency technologies
Both Paris Observatory and Laboratoire d’Astrophysique de Bordeaux (LAB) are involved on Research and Development (R&D) of radio-frequency (RF) technologies related to the next-generation radio telescopes. This activity includes a wide range of applications, from Low Noise Amplifiers (LNA) to fast digitisation, with analogue and digital conditioning techniques. In particular, Paris Observatory and its department Unité Scientifique de Nançay (USN) are specialised in RF related devices and sub-systems through the design of Application Specific Integrated Circuits (ASIC) and further application developments, while LAB develops the electrical cards (wide band digitiser and digital filtering cards) by using components off the shelf (COTS) to establish the link between the RF part and the digital processing back-ends (correlator).
The SKA-related R&D projects developed or proposed by USN and LAB concern different receiving technologies for different frequency bands, from 50MHz to 24GHz.
USN contribution for SKA Aperture Arrays
USN has been working on technological developments for dense aperture arrays since 2004 and is now the task leader of the Integrated Receiver within the AAMID consortium for the Mid-Frequency Aperture Array (MFAA). These developments were supported by funds of Paris Observatory, CNRS/INSU, Région Centre (more recently) and, from 2012 to 2016, by the French National Research Agency (ANR) through the AAIR project “Aperture Array Integrated Receiver”. Over the years, the work done by USN for SKA has also been considered of importance for other SKA consortia, such as, very recently, the AADC (Aperture Array Design and Construction) consortium for the Low Frequency Aperture Array (LFAA).
The technical challenges of interest for USN can be grouped mainly in three areas, which will be detailed below: LNA, analogue signal conditioning, fast digitisation and smart phased arrays.
LNA
To observe the sky, we need both antennas and signal amplification which do not add a significant thermal noise. The MFAA frequency bandwidth is nearly 2 octaves around 1 GHz and the sky noise within the band is 3-7 Kelvins (K). The MFAA consortium requirement for 2025 (Phase 2 of the SKA) is to have an amplifier with a maximum added noise of 30 K. With cooling, this can be easily achieved. But with the scale of MFAA, it is not possible to cryogenically cool the amplifier. This problem is mainly due to the cost (the number of antennas being extremely high). That is the reason why the 30 K value must be achieved without cooling, this being a very important performance parameter for the highest-frequency portion of the telescope. It is important to stress that the energy consumption is an important constraint, since the SKA antennas will be in the desert. Based on these elements, the technological specifications to realise the LNA must respect the following requirements: massive production capability and low cost for each LNA, low power consumption, and low noise temperature.
The micro-electronic group in USN has a wide expertise in the design of ASIC and in the fabrication of the circuit boards for wide band frequency range, particularly developing low noise receivers for SKA projects by using low cost and mature Silicon-Germanium (SiGe) technologies. SiGe technology seems indeed to be a good compromise in terms of cost/energy/performance. The SiGe ASIC design is a very good technology for MFAA, but also for LFAA. USN started SiGe ASIC LNA studies in collaboration with the company AMS Technologies in 2004; at the end of that year, a partnership was developed with the company NXP and, in particular, its French laboratory NXP-Caen.
The noise temperature of 30 K, without cooling, is very difficult to be achieved. The last ASIC LNA designed at USN has 45 K noise temperature at 1500 MHz. The requirement of 30 K being, as stated above, extremely important for the MFAA consortium, further development are under study at USN. Future designs could include a SiGe technology with a better optimisation and other topology (e.g. the use of a SiGe technology with a finer engraving, or of a GaAs process). However, with these solutions both cost and power consumption could be potentially higher. USN has recently also designed an LNA integrated on a time delay ASIC for the LFAA consortium.
Analogue signal conditioning
The digital backend and processing have often lead to significant cost and power consumption. So, in order to achieve a better compromise on performance over cost, one solution could be not to pursue a digital processing for each antenna. This solution could be of interest both for MFAA and LFAA (even if, for this latter case, it is not the currently adopted solution). In such a case, an analogue conditioning is potentially required by an analogue combination of many antennas while realising an analogue phase-shifting or time-delay. Within the community, USN has a leading expertise in this domain. For over 10 years, USN engineers have designed SiGe ASIC with phase-shifting or time-delay for MFAA and, only recently, for LFAA. With these ASIC, the cost and power consumption of phased array can be reduced. The first radio telescope prototype of the dense phased array, EMBRACE (see Sect.4.1.2), has been realised in 2009 with a phase-shifting ASIC conceived by USN. More recently, USN designed a time-delay ASIC for MFAA. The last time-delay based ASIC produced by USN, in which an LNA is integrated, has been for the LFAA consortium. This chip, called “Low Noise Delay” (LND) could reduce the cost enormously, lowering also the power consumption. SPI or I2C bus are integrated on these ASIC to control all the phase-shifting or time-delay states. The phase-shifting have 16 states on 360 degrees and the time-delay have 2.4 ns with plus or minus 20 ps of step for MFAA, and 40 ns with 150 ps of step for LFAA. Single-ended or differential mode with a rejection of common mode are important to decrease the power consumption. USN designs ASIC on these 2 modes. Differential mode is easily achieved with SiGe technology. USN can also designs ASIC to convert from a single-ended mode to a differential mode.
Fast digitisation
The SKA will need to digitise the beams with a large frequency bandwidth and a high dynamic range. Consequently, the cost and the power consumption are very high. USN can design fast ASIC ADC for MFAA based on SiGe technology. Flash and Interpolated Flash folding has been designed using bipolar transistors. This will lead to low-cost fast ADC but with a very high power consumption.
The expertise of USN on the analogue conditioning and the ability to design ASIC for analogue beamformer offers an option to reduce the overall cost on phased array. In addition, an ADC design with a lower power consumption is expected. This becomes a priority for the digitisation. USN will design ADC with a slow topology but a very low power consumption and a clock at 200 MHz for the moment. It will be based on CMOS technology for MFAA. Also, USN is interested in the demand from other consortia to design a very fast ADC on SiGe technology with the RF part on the same ASIC. In reality, the ADC on the radio telescopes are away from antennas. The link between the RF part and the digitisation is realised by RF cable or more recently by analogue optical fibre. To digitise the beams closed to antennas, the objectives of USN, is to reduce the cost. Then a new problem arise to synchronise a fast clock, due to the repartition of ADC on dense phased array. USN studies the different technical solutions for synchronisation. In the future, these solutions could be integrated within ASIC ADC.
Smart phased arrays
Energy is potentially the major obstacle for a dense phased array under study by MFAA. These arrays being built in the desert, the distribution of energy will lead to high cost, thus pushing for the lowest power consumption. This is particularly true for dense phased arrays. The analogue summation or combination allows a reduction in the power consumption, which is though still very high. To realise a gigantic radio telescope in the desert, and in particular for mid-frequency aperture arrays, a breakthrough technology is necessary for energy friendly requirement.
In this framework, USN is starting a first study to design new RF ASICs, which will allow a management of radio telescope power consumption. The electromagnetic environment is not the same over time during the day. Also, each scientific observation does not need the same technical performances. The aim of this breakthrough technology is therefore to realise an adjustment of the power consumption from a particular electromagnetic environment and scientific observation. In fact, the power consumption is the same whatever the parasitic power level and scientific observations. To fix this problem, the ASIC should have an adaptability on power consumption, versus an adjustable gain level and mostly adjustable intermodulation level. In addition, to minimise the power consumption, a possible solution would be to cancel the parasitic emissions, an ideal electromagnetic environment. By introducing a phase-shift of 180 degrees in the RF signal path at the spare time of the instrument, the parasitic power level will be highly reduced as well as the intermodulation levels; consequently, the overall power consumption could be much lower.
LAB contribution for SKA1-MID
The electronic group at LAB, a department of Bordeaux University, is specialised in both high speed analog and digital electronics. Over the past 10 years, LAB has acquired an expertise in digital electronics through its involvement in major ground-based and space projects. It has designed, fabricated, characterised and delivered the digitisation units for two major radio astronomy instruments: the ESA Herschel Space Observatory and the ALMA interferometer, including design, prototyping and manufacturing of the digital filtering sub-system of the ALMA correlator. In addition, LAB was involved in a number of academic and industrial R&D programs aiming at designing wide band digitisation module in order to prepare the new generation of radio telescopes. In the framework of the SKA radio telescope, LAB leads the SKA1-MID Band 5 receiver (RXS45) developments within the DISH and the WBSPF (Wide Band Single Pixel Feed) consortia. This receiver must be production ready for the Phase 1 of SKA, i.e. in early 2019. The electronic group of LAB uses low-cost components off the shelf (COTS) for designing the RXS45 receiver (shown in Fig. 75).
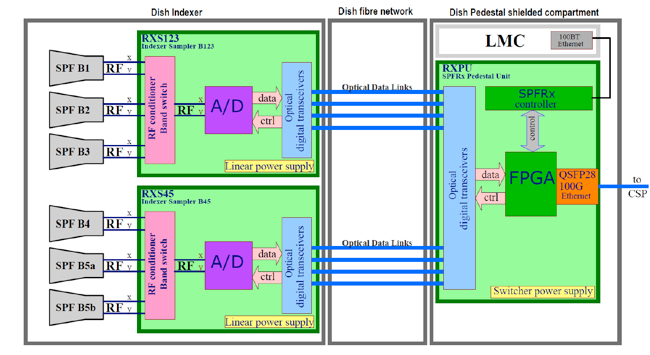
The RXS45 receiver is split into two parts:
-
•
the first one on the feed indexer platform, including the RF signal conditioner module, the digitiser and the optic data transmission boards;
-
•
the second one in the dish pedestal composed of the optic reception board and the Field-programmable gate array (FPGA) carrier board for data processing (DPU, Digital Process Unit). These boards are placed inside a shielded compartment.
The optical data links between the digitiser board and the digital process unit ensure a galvanic isolation to prevent the “pollution” of the receiver by the Radio Frequency Interferences (RFI) generated by the digital circuits.
For the RF signal conditioner module, a modular RF chain is developed to meet the input return loss (15 dB min) and ripple (1.5dBpp max) requirements for each frequency sub-band (4, 5a, 5b). This RF chain is composed of coaxial components, and, a more integrated modules with surface mount components, reported on 4 layers PCB (Printed Circuit Board) for cost and size savings. The digitiser board embeds two commercially available 3-bit, 10-level ADC s which allow to digitise both polarisation signals at 9 GSps for the SKA1 Band 5a (from 4.6 to 8.5 GHz) and at 16 GSps for the Band 5b (from 8.3 to 15.4 GHz).
The electronic group of LAB pursues a market survey on the wide band ADC’s for the SKA Phase 2 in order to implement two other frequency bands: Band 4 (from 2.8 to 5.18 GHz) and Band 5c (from 15 to 24 GHz). SKA2-MID requirements for the ADC are a 4-bit resolution with a minimum sampling of 25 GSps. LAB studies also the digital filter algorithm for extracting two 2.5 GHz sub-bands within the Band 5c for the logic programmable component (FPGA) selection and for the digital processing board design. This board allows to capture and process ADC data and to packetise and send the resulting data to CSP with an 100G link. The LAB contributions in SKA are funded by Bordeaux University, CNRS/INSU and Région Nouvelle Aquitaine.
5 Industrial perspectives and solutions
J.-T. Acquaviva [DDN Storage, Paris, France], K. Barriere [CNRS-INSU, Institut National des Sciences de l’Univers], F. Bellossi [ArianeGroup, Paris, France], M. Caillat [LERMA, Observatoire de Paris, École normale supérieure, PSL Research University, CNRS, Sorbonne Universités, UPMC Univ. Paris 06, Paris, France], J.-M. Denis [Bull, an ATOS company, Bezons, France], C. Ferrari [Université Côte d’Azur, Observatoire de la Côte d’Azur, CNRS, Laboratoire Lagrange, Nice, France], A. Julier [Thales Alenia Space, Domaine Observation & Sciences, Toulouse, France], G. Marquette [CNRS-INSU, Institut National des Sciences de l’Univers], C. Mazauric [Bull, an ATOS company, Bezons, France], X. Olive [Thales Alenia Space, Domaine Observation & Sciences, Toulouse, France], Y. Pennec [Air Liquide, Grenoble, France] E. Raffin [Bull, an ATOS company, Bezons, France], S. Rawson [Callisto, Villefranche de Lauragais, France], X. Vigouroux [Bull, an ATOS company, Bezons, France]
5.1 Overview
5.1.1 Context
As detailed in the previous sections, the Square Kilometre Array radio telescope will be one of the largest physics instruments ever designed and built worldwide. It aims at tackling fundamental questions, both in astrophysics and fundamental physics.
In France, the community of astronomers and physicists is strongly involved since more than ten years in the preparation of the scientific program as well as in the technical design of the instrument. Today this community is growing rapidly and around 400 scientists are now directly or indirectly working on scientific topics related to the SKA in France. In addition, this huge concentration of efforts is accompanied by a continuously increasing involvement of experts from the industry, which is summarised in this section.
In practice, about thirty French scientists are involved since the beginning in the SWG as core members or associate members, two of them being co-chairpersons. This number is rapidly increasing this last weeks. Industry and labs are jointly involved in five technical consortia through scientists and experts membership, as well as in Precursors (EMBRACE, Sect. 4.1.2) and Pathfinders (LOFAR and NenuFAR, Sect. 4.1.1).
Since 2016, large companies and Small- and Medium-size Enterprises (SMEs) are regularly meeting under the auspices of the SKA France coordination, to prepare for the re-entrance of France in SKA organisation and to be in position to propose the best technological solutions that SKA will require. In this perspective, collaborative projects through top level private-public partnerships are put together aiming at producing these technological solutions with the double objective of:
-
•
facing the main technical challenges brought by the SKA, still unsolved as per today,
-
•
contributing to enhance the performance of the instrument,
while coping with the economic limitations, both at CAPEX and OPEX levels.
5.1.2 The SKA challenges and French contribution
The SKA will be deployed on 2 sites, in South Africa and West Australia, and in 2 phases, SKA1 and SKA2. SKA1 will represent around 10% of the total capacity of the SKA, and will be realised by 2025, within a budget envelope capped to 674 M€. Today, due to the instrument complexity, the SKA relies on proven technologies, but currently used at lower scale. Here the gigantism of the instrument, as the data volume to be treated (data traffic greater than today s WWW internet traffic, already at SKA1 level), imposes to solve huge technical challenges to achieve the expected performances.
These challenges, accentuated by economic and environmental constraints, include:
-
•
the manufacturing, implementation and control-command of tens of thousands of high-tech mechanical and electronic devices,
-
•
the energy supply of these measurement devices distributed in desert areas over thousands of kilometres range,
-
•
the collection, transport and processing of enormous volumes of data produced by the instrument (several Petabits/s).
To apprehend them in the most efficient way, the SKA France coordination has performed a joint comprehensive analysis of both the expertise available in France and the needs of the SKA project not yet covered by the partnering countries. In France, the expertise in low and mid-frequency radio astronomy lies mainly in the development of detectors, dense phased-array technologies, signal processing and data distribution, prototype design and manufacturing (NenuFAR, EMBRACE). Based upon this analysis, an ensemble of workshops grouping industry and academic experts has led to the identification of 4 key axes:
-
•
high-frequency digitalisation technologies and HPC,
-
•
signal processing,
-
•
renewable energy production, distribution and storage,
-
•
system engineering.
Companies and labs have organised themselves together in project consortiums and have started working on enhancing their respective capacities through collaborative projects aligned with SKA targets.
Although this is an iterative process, the objective is to be in capacity to propose to the SKA technical solutions that are relevant, innovative, proven, and respectful of the environment, as well as to provide a complete cost-effective scenario for their implementation, operation and maintenance, all this in due time (i.e. before the accomplishment of the Critical Design Review).
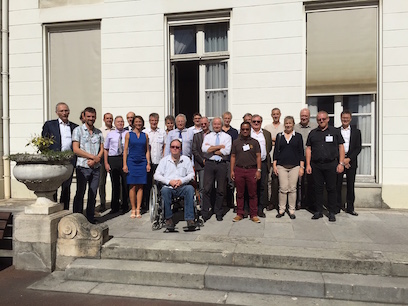
5.1.3 A systemic approach
Because of the interdisciplinary dimension of the SKA instrument and because of the transdisciplinary dimension presented by its challenges, no single solution will solve the equation posed by the SKA. It is also clear that a sequential approach leads to adding-up all constraints from each phase/technological development, both in terms of time and cost.
A systemic approach is thus needed to integrate in the same timeframe the objectives to be reached, the limited resources available and the technological performances available on due time. It makes re-thinking the whole process in particular at this crucial time of cost revision exercise by SKAO.
What stated above is particularly true for the four key axes identified in Sect. 5.1.2:
-
•
Energy supply for Low- and Mid-frequency antennas: production, distribution and storage of renewable energy in highly remote areas. Hybrid systems and energy efficiency will be at the heart of the solution to be put in place.
-
•
HPC and Big Data: the super-computer that will be able to cope with the huge demands of the SKA does not exist yet, neither the data storage system, nor the data transmission system. These topics is totally transversal and of interest to the whole industry and research world. Big Data and the “Plan Super-Calculateur” are part of the French “National Strategy for Research” and strongly supported at ministry level.
-
•
Energy and HPC: the massive computing performance is directly linked to the energy consumption (electricity, heat, etc.). French specialists from industry and labs work on the whole computing chain, hardware and software, from the processor (CPU, GPU) to the storage capacity and access speed, and to build a new algorithmic approach to optimise the computational time and performance. They work together with energy specialist to optimise the full energy chain.
-
•
Cryogenics and energy: leading companies in the domain of cooling and cryogenics work in partnership with research laboratories to develop multifunctional systems able to cool down to few tens of Kelvin, and at the same time feed, an energy device that produces the necessary electrical power for remote antennas.
-
•
System engineering: by definition, the global architect of the whole instrument. Worldwide leading companies, specialised in aerospace or marine projects, have already started working on the SKA as an “industry project” to bring the necessary system culture for the realisation of this giant radio telescope.
Although it is not a science/technology domain, financial engineering is also part of the game within this systemic approach. In particular, countries are more and more cautious vis a vis the engagements they sign for a number of decades. Then CAPEX and OPEX together, aligned with industry standards, lead to new business models, which include all the above in terms of investment, maintenance costs and service/products associated on a mid-long term perspective.
The SKA is therefore not only a cost, but an opportunity to generate new businesses, then revenue, either directly though the technologies developed, or through other applications and products/services, and/or through the image gained in being associated to a worldwide acknowledged scientific and technological adventure.
5.1.4 The benefits for the SKA and from the SKA
The SKA, because of its dimensions and its scientific perspectives, creates a fantastic momentum worldwide, at scientific and industry levels, but moreover at citizen level. As such it is a worldwide model to create scientific knowledge, to develop industry cooperation, and to enrich global citizens through jobs and value creation locally and for global application.
SKA, aggregator of talents and competencies
The multidisciplinary aspect of the SKA requires having experts and scientists from different scientific fields, technology domains working together: electronics (digital and analogic), mechanics, automatics, HW and SW, energy, etc. It creates multidisciplinary teams, sharing and exchanging their respective knowledge, bringing new ways of thinking. The benefit is systematic, resulting in a mutual enrichment from different work cultures, business, practices, etc.
SKA, international organisation, global player
Due to its global dimension and global perspectives, the playground of SKA is worldwide. All technologies developed in the scope of SKA can find other applications in other domains or in other geographical areas:
-
•
the energy system to be developed in South Africa for MeerKAT, then SKA1-LOW will be replicable in other remote areas, where people will benefit from 3 technological jumps immediately with energy system well adapted to their needs,
-
•
the satellite data transmission system will find many other potential applications,
-
•
the cryogenics/energy system will be a first demonstrator of multi-application.
SKA, use case for HPC and Big Data
It is crystal clear that what will be done for the SKA will be applied for many other Big Data consumers, such as meteorologists, geophysicists, biomedical scientists, etc. Then SKA is an opportunity to build a community of scientists and industry experts around this specific question and give a strong impetus to the whole HPC science and business.
SKA, a sustainable, ethical, environmentally-friendly project
The global realisation about climate change impact, thus the Paris agreement signature late 2015 on one side, and the digital revolution which have disrupted all societal value scales on the other side, SKA has a duty to be an emblematic example of a worldwide achievement respectful of the environment, knowledge-sharing oriented, technology-driven for the sake of humanity welfare, while guaranteeing the success of its gigantic scientific objectives.
The SKA will be a fantastic opportunity for everyone, thanks to its global visibility, and the scientific and technology it brings, to benefit from the outcome of this unique and universal instrument.
5.2 French industry capacity for the SKA
5.2.1 High performance computing
Hardware and application integration
High performance computing is getting standardised on off the shelf hardware components. It could be X86 (Intel instruction set) general purpose processing devices, NVidia accelerators or rising ARM based solutions. Even more specialised, high level of integration between hardware and applications with very specialised devices, using FPGA boards, or ASICS compute engines could be used for reaching extreme performances and for minimising the power consumption.
Whatever the chosen approach, some difficult technical points have to be addressed. The very first one if the adaptability of the software to the hardware platform, or the other way around, the adaptability of the hardware platform for the application, or algorithm. A wrong combination could drive to low performances, high power consumption and poor performance per watt ratio. It is today a challenge to identify that the chosen combination between hardware and software provides very bad results. It is even more difficult to obtain optimal results (high performance, low power consumption and best performance per watt ratio) when several combinations provide, at first touch, interesting results. One could say it is easy to answer this question: let’s test all or at least a significant number of combinations and let s choose the optimal one! While this holistic approach is relevant at the theoretical level, it is not possible to implement it in the “real and concrete life”. The very main reasons are time, resources, and cost.
At first, porting one application to several platforms is extremely time consuming when the hardware platform is emerging or extremely difficult to use (ASICS simulators, FPGA programming languages, …) and requires a collaborative effort between the scientist developing the algorithm and the computer scientist porting and optimising the algorithm to the platform. In second place, getting relevant numbers and comparing the relevant combinations requires, as just mentioned, a significant effort from many different resources with different skills: mathematicians, physicists, computer scientists, developers, parallel programming experts and so on. Those resources are scarce and it is often extremely difficult to get them available at the same time to work as a team. As a direct consequence of this team work from specialised experts which has to be sustained through a significant amount of time and the several hardware platforms to be evaluated, the cost is significant.
The SKA project as a whole, and specifically the SKA France coordination is willing to address this challenge, thanks to the world class expertise of the French astronomers in signal and image analysis and thanks to the contribution the French SKA organisation wants to bring to the global SKA project.
ATOS HPC community considers the problems the French SKA community is willing to address as representative of the future regular requests from the HPC and Big Data community (again, this is all about finding, for a given algorithm or a given class of algorithm the best possible combination between hardware and software to reach optimal performance for the minimal power consumption). Thus, through the collaboration with SKA France, ATOS expects to gain additional expertise, proves its expertise for addressing this general-purpose question and reach worldwide visibility as HPC and Big Data expert.
ATOS has expressed the deepest interest on the HPC challenges of the SKA project and, more particularly, on code optimisation activities within the SKA France coordination.
In this framework, two working groups led by ATOS, and in particular by its Center for Excellence in Parallel Programming (CEPP), have been identified, focusing on Co-design and Parallelisation of codes for radio data processing. SKA France is in charge of coordinating these activities, which include different partners. A wiki page has been set-up to organise and follow-up meetings and discussions. The main goal of this ATOS contribution is to probe CEPP skills and its interest to take part in the SKA France effort, targeting the SKA Science Data Processing (SDP) consortium.
As first experiments, Bull has worked on the most advanced code that has been developed in France, already widely used on radio astronomical data (e.g. LOFAR, MeerKAT, JVLA …), that is the imaging tool DDFacet by Cyril Tasse (see Sect. 4.3.1) and collaborators. DDFacet has been tested with two different compiler suites: GNU and Intel. The idea was to dive into the DDFacet software stack to understand the different phases of processing and to extract their respective part of the total execution time. The main outcome of this collaboration has highlighted the necessity to build a strong collaboration with developers to improve DDFacet performance.
Data storage, distribution and preservation
In our digital century, mastering data has become a national sovereignty issue. This results in the requirement to develop and maintain a set of skills and the corresponding industrial tools. Data has to be captured at the fastest possible pace, manipulated in a safe and efficient way, shared among multiple actors despite geographical distribution. This is the daunting task facing all modern organisations.
Data has not to be considered as a static element anymore, but to be envisioned for its whole life cycle from production, to transformation, to usage up to the production of value.
Regarding this data life cycle, for each and every stage, the Square Kilometre Array is pushing the borders to unseen levels. Traditional dichotomy between HPC workloads which are oriented toward massive ingestion of data and cloud functionalities designed for capacity and data sharing is irrelevant for the SKA project. Therefore, if the quantitative metrics related to data for the SKA project are mind-blowing, the real breakthrough may rely on the qualitative process of its data management. Considering the whole data value chain, SKA offers the ability to design dual technologies, which means designing and maturing to address the specific challenges of HPC, but in the longer term, being valuable to a broader, if not mainstream market.
The HPC nature of the SKA project is acknowledged by the community, as illustrated by the SKA Keynote to be delivered at the next supercomputing conference131313SC17, in Denver, November 2017. “Supercomputing” in the most important supercomputing conference in the world. The event takes place every year, always hosted in the United States.. Similarly, the SKA project is specifically addressed in the Strategic Research Agenda of the ETP4HPC consortium.
The ability to ingest data at a rate of several TeraByte/s is in reach of current supercomputers when they are augmented by I/O accelerator such as burst buffers. An illustration being 1 of the 10 largest supercomputers in the world, where DDN operates a burst buffer at 1.5 TB/s.
Such burst buffers are mandatory to deliver the ingestion bandwidth within a reasonable energy envelop, with the energy footprint being reduced by a factor of 20 compared to traditional technologies.
However the SKA challenge is not only about the deployment of the widest burst buffer in the world, but also to provide the ability to tolerate failures, to self-heal and to implement predictive maintenance. All of these functionalities, which are mandatory for the SKA, are still in gestation in the HPC market. The SKA project will dramatically foster these innovations.
In a movement, quite similar to what is observed at CERN, scaling simultaneously the volume of data and the degree of sharing bridge the gap between traditional HPC and cloud data centre. For instance the CERN file system named EOS presents many similarities with the Dropbox internal file system.
Therefore, the question asked by the SKA project: How to distribute hundreds of PetaBytes of data products per year to thousands of scientists around the world? This has its answer outside traditional HPC.
Geographic distribution and replication of data is mostly observed in media streaming where there is a need to deliver content from the closest data silo to the end user. Disaster recovery, prior to quite a different problem, implies also to protect, synchronise and migrate huge amounts of data across organisations.
As an example, to protect the company digital assets, DDN has deployed a trans-oceanic disaster recovery scheme for a major web actor leading to the movement of 15 PetaBytes per year.
The SKA project has been planed by the community for many years, notably by the design and installation of a pathfinder radio telescope to prepare the SKA initiative: the Karoo Array Telescope in South Africa.
The data backbone for the Karoo Telescope is The South African Very Large Database project. DDN has deployed geographical distributed data management solutions in both Johannesburg and Cap town for this project. Allowing scientists to share, replicate and manipulate data across sites. This previous experiment leads to a better understanding of the necessities and constraints of the astrophysicists.
DDN has recently established a R&D centre in Meudon, nearby Paris. This site hosts most of the emerging tech and Software Defined Storage department. The SKA project presents a major opportunity to showcase and develop DDN French engineering and at a broader extend to elevate the skills and expertise of its network of local partners.
Data science for monitoring
Being a major actor of the European space industry, Thales Alenia Space (TAS) use data science approach on several domains to handle massive volume of data belonging to space system or coming from Earth Observation system. Overall, TAS data scientists are representing a workforce of 20+ people.
Two major experiences are described hereafter.
-
•
TAS collect, store, process and monitor thousands of telemetries from dozens of satellites and space platforms. These telemetries are lengthy time signals collected during the whole satellite lifetime, making them 15-year long or more for one satellite. TAS has developed analysis tools with user utility as the main objective like synthetic views of the parameters state, tools designed to extract valuable information from thousands of signals that cannot be manually explored. TAS s approach relies on mathematical signal processing to provide a rich description of the signals. The semantic description of each signal is exploited for health monitoring (including predictive maintenance) and anomaly detection.
-
•
TAS has applied new technologies (big data, cloud architecture, …) to the Ground Mission Segment (GMS) data of Galileo. Two use cases have been implemented : global analysis of GMS’ log message (dashboard providing global indicators and high level synthesis of flow); architecture based on COTS and big data storage, to collect, parse and store all data flow transiting into GMS, allowing user-defined processing execution, template based reports and advanced visualisation tools.
TAS could support the definition, implementation and operational usage of such approach to monitor the SKA infrastructure (i.e. whole set of radio-telescopes), based on big data and information extraction technologies. TAS could also provide a more global support to SKA project, on big data computation through its own data scientist communities.
5.2.2 Cryogenics systems
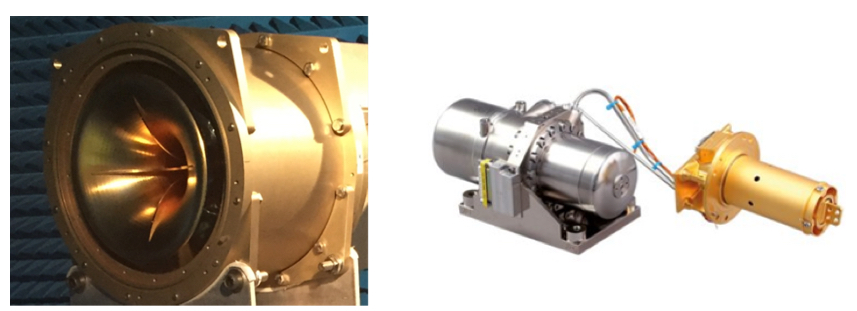
A key challenge for the Square Kilometre Array is to reduce both the capital and operations costs of the facility. Operations costs are a particular concern because over the lifetime of the facility the cost of ownership will exceed the original capital outlay by a large factor. The cost of electrical power dominates the operations budget, with maintenance costs also being significant.
To achieve the required sensitivity of the SKA mid-frequency dish array, the front-end receivers will require cryogenic cooling. Traditional implementation of such cryogenic receivers requires high-vacuum cryostats and closed-cycle helium refrigerators. The refrigerators draw a considerable amount of power. The cryogenic and vacuum systems require frequent preventative maintenance as well as corrective maintenance to repair failures. The SKA will require up to 10000 cryogenic receivers. Clearly innovative new cooling solutions are required to implement the SKA receivers if the project is to be affordable and viable.
Cryogenic refrigeration technology has been developed for more than 20 years for cooling instruments mounted on spacecraft which are required to be both energy efficient and highly reliable These technologies directly address the power consumption and maintenance challenges which are the weakness current cryogenic systems, which rely on G-M cycle refrigerators. In France, there is a great deal of expertise in industry (Air Liquide, Thales Cryogenics, Absolut System) as well as in public research institutions (CEA) on space-borne cryocoolers using Stirling cycle and Pulse Tube technology. This heritage can be levered to develop a design for high reliability, high efficiency cryocooler with performance suitable for the SKA, which requires operating temperatures below 30 Kelvin. Callisto, an SME based near Toulouse, has been producing cryogenic receivers for satellite communications and radio astronomy for over 20 years and has the capabilities and expertise to integrate this new technology into receivers for the SKA.
5.2.3 Energy production and storage
Energy is a global issue and SKA is a postcard example of the challenges at stakes. The telescope site of SKA-MID I requires more than 5 MW for powering the central computing facility as well as the dish antennas. The site needs and remoteness challenge the electrical grid network in terms of capacity, availability, efficiency and infrastructures.
The weather conditions on the site are very favorable to Solar Photovoltaic as a primary source of Energy. Recent and rapid progresses in technologies have brought down the cost sufficiently to become competitive with the grid. Nevertheless, PV is inherently intermittent in nature both at short (day), and long (weeks) cycle. In turns, it is mandatory to implement large capacity storage to buffer supply fluctuations.
Hydrogen is a well suited vector to address long cycle fluctuations as the storage capacity can be dimensioned separately from the power capacity. A typical Hydrogen Energy Storage includes an electrolyzer (PEM, SOFC, Alkalyne), a large capacity storage (Bag, Compressed, Liquid), and a power unit (PEM, SOFC, Turbine).
Air Liquide has a long standing heritage as a manufacturer and user of Hydrogen technologies starting with the Pioneering days of powering the Ariane Launcher, to its current activities in commercial cars refueling station or autonomous electrical units. Focusing on SKA needs, we have built a first small scale breadboard of a complete Hydrogen Energy Storage system. We foresee this prototype to address industrial scale application. As a major stepping stone in this development, Air Liquide has already delivered a 1 MW commercial PEM power unit and all ancillary services. Air Liquide has large subsidiaries worldwide (including in South Africa) dealing with the production and distribution of industrial gases throughout the countries.
SKA is a unique opportunity to deploy at full scale a Hydrogen Energy Storage. This energy vector can be applied both at the Dish site and at the Telescope site. We believe, this solution can answer the baseline requirement and improve on the system margins at a competitive cost with the grid. Looking forward, powering SKA with Hydrogen will pave the way for broad scale use of sustainable technologies for a green future.
5.2.4 System engineering
The landmark international science SKA project aims at building and operating a radio astronomy instrument of unprecedented sensitivity and accuracy. The project presents numerous significant challenges over an extremely wide scope of technical domains and technological, production, operations and management issues. Technological development and breakthroughs are necessary but not sufficient to make SKA project successful: its success can only be guaranteed through the implementation of a harmonised system engineering and management capacity for mega-projects.
SKA is to be considered as a system of systems: it is composed of different complex and interconnected systems dealing with a very wide variety of functions and interfaces; it is largely distributed between different locations over the world; the project organisation involves numerous multinational consortia with significant autonomy level. Demand to develop and manage such systems is constantly increasing, in particular for Very Large Research Infrastructures (VLRI) as well as in worldwide institutional projects and in space projects.
Early and continuous application of state-of-the-art system engineering and Assembly, Integration and Validation (AIV) process is a cornerstone to secure the on-time, on-quality and on-cost result of such programmes, and to guaranty final operational performances. In particular, SKA success deals with observation accuracy and sensitivity, overall availability and reliability, affordable and minimised CAPEX and OPEX, and with future evolution and upgrade capacity.
Two main companies in France have an internationally recognised system engineering expertise and are involved in SKA France activities: Ariane Group and TAS.
Ariane Group developed an expertise in management, system engineering and AIV of such complex projects, for their core programmes Ariane and Navy Deterrence Forces including their ground support and operational bases. Through a ten year diversification program, this expertise and associated processes and tools are now used for the benefit of a large scope of worldwide mega-projects such as ITER (nuclear fusion), Space Surveillance and SESAR (Air Traffic Management).
By its involvement and commitment on system engineering and AIV activities, Ariane Group could support the scientific community by securing the operational performances, the schedule and the good use of the fundings provided to the SKA project.
Thales has a recognised expertise and experience in the fields of complex system of system projects management, engineering, architecting and AIV.TAS has developed its own system capacities taking benefit of the Thales experience, tools and projects. Among more than 10 so called “system” programs under development, some significant examples are: a) Syracuse 3 & 4 (TAS and Thales are responsible for the design and development of the entire system), b) Galileo (TAS is responsible for system design and Ground Mission Segment), c) ALMA - Atacama large Millimeter Array (provision of 25 giant antennas for the most complex and powerful ground-based astronomical observatory ever built). TAS aims at bringing into the SKA project its experience, background and skills in system engineering, AIV and security domain, as well as its unrivalled European experience on such projects, acquired through ALMA.
5.2.5 Antenna design and Telecommunications
The antenna product portfolio of TAS covers most of the state of the art from UHF to W-band (10,GHz) : reflectors, feeds, arrays, passive, active, large bandwidth, low and high gain, …, supported by a unique expertise in radiation patterns of very complex antenna subsystems. TAS is the antenna supplier for CNES and DGA of active antenna arrays including anti-jamming capabilities. This category of antennas is very linked to the system, and includes digital processing and Beam Forming Network capability. TAS experience in system and complex antenna design could bring an important technical added-value to the SKA project.
A key challenge is the transmission of very large amounts of data from remote sites to user regional centres spread all over the world. Therefore, a wide range of telecommunication technologies shall be contemplated, from ground and deep-sea optical fibers to spatial transmissions. For SKA, Thales Alenia Space is ready to propose spatial solutions ranging from Ka-band, Q-band, V-band and above, as well as free space optical links which could bring unprecedented data rates (Terabits/s). Such solutions are based on single satellites or constellations, with or without inter-satellite links, and with various types of telecommunication payload and ground infrastructure. They may use existing satellites or dedicated one’s.
6 Interdisciplinary challenges
C. Ferrari [Université Côte d’Azur, Observatoire de la Côte d’Azur, CNRS, Laboratoire Lagrange, Nice, France], G. Marquette [CNRS-INSU, Institut National des Sciences de l’Univers], M. Pérault [LERMA, Observatoire de Paris, École normale supérieure, PSL Research University, CNRS, Sorbonne Universités, UPMC Univ. Paris 06, Paris, France], J.-P. Vilotte [Institut de Physique du Globe de Paris, Paris, France]
6.1 Introduction
The SKA is undoubtedly one of the biggest observational infrastructures ever conceived and, as such, it represents a fantastic opportunity to face a variety of challenges in a wide range of research fields.
As extensively described in the previous chapters of this book, as well as in the SKA Science Book produced by the international community ( “Advancing Astrophysics with the Square Kilometre Array”, AASKA14 reference in this volume), the SKA is interdisciplinary within the field of physical sciences itself, in view of the vast range of interlinked astronomical and fundamental physics questions that it will allow us to address. The investigations permitted by SKA will cover an unprecedented range of spatial scales and cosmological epochs, from the very initial phases of structure formation, to the study of planets and the search of extra-terrestrial life in the local Universe. In the meanwhile SKA will also turn our own Galaxy into the largest “instrument” capable of detecting gravitational waves through pulsar studies.
This wealth of topics is allowed by the unique combination of a huge frequency coverage, of gigantic collecting areas, exquisite site quality, immense computing resources and advanced algorithmic developments, none of which did exist a few dozens of years ago, when the embryo idea of what is now the SKA project started to be conceived by a few visionary pioneers. At that time, technology was not ready to allow such an observatory, which still represents an engineering challenge in many respects, appealing to many technological domains, as summarised in Sect. 6.2. Particularly important in terms of interdisciplinary interests, the SKA is one of the largest “Big Data” project ever conceived: SKA1 will produce a huge amount of data compared to current standards and capabilities, generating a data traffic equivalent to today’s global Internet traffic, and triggering ambitious developments in Data Science.
The SKA is not only a big project in terms of telescope size: it is the international scientific facility that will benefit of the largest variety of cultures and expertise from all over the world. In Sect. 6.3 we will summarise some of the most interesting human and society aspects that the international organisation preparing and later operating the SKA Observatory will have to face.
6.2 A wide variety of technical challenges
Already in Phase 1 of the project, the SKA telescopes, with components distributed over several hundred kilometres in desert areas, will pose particularly difficult engineering problems, which need to be faced by joint interdisciplinary and multi-approach expertise. Aware of this, the approach of the SKA Organisation and, at national level of SKA France (see Sects. 5 and 4), is to coordinate the activities of a wide range of both private companies and public research laboratories.
Among the main technological challenges of the SKA, which trigger a global transdisciplinary search for integrated solutions (co-design), we recall:
-
•
distribution of uninterrupted electrical energy under strong constraints (absence of electromagnetic interference in particular) in a desert environment;
-
•
minimising the costs, whilst maximising the reliability and ease of maintenance of all hardware components (antennas, receivers, computers, transmission lines);
-
•
accurate real-time control of a many-elements large-scale infrastructure;
-
•
complex problems of interferometric signal processing;
-
•
management of large data flows, with, for each of the 2 components of SKA1, a raw data rate of the order of 10 Tb/s, a required computing power of 100 Pflop/s, and an archiving capacity of hundreds of PB/year.
The last point of the list above is of greatest interest in terms of interdisciplinary developments. This is not only true because of the confluence of signal propagation, processing and control issues with the fundamental astrophysical challenges. But this is also true because the expected outcomes in data and signal processing are likely to trigger similar developments in other fields of application, far away from the SKA project and its astrophysical applications. Indeed, SKA represents a particularly stimulating “use case” for a very large subset of data science and high-performance information technologies, including:
-
•
onboard computing systems;
-
•
transport, storage and management of massive data sets;
-
•
co-design of massive processing and high-level statistical analysis of the signal, including advances in virtualisation technologies;
-
•
real-time and off-real-time control of particularly complex systems;
-
•
multi-scale analysis of data over a very wide frequency range, involving different antenna geometries and electrical signal processing;
-
•
probabilistic inference methods, including recent advances in Bayesian methods for complex and large-scale physical models, as well as machine learning methods.
In this framework, one of the current objectives of the SKA France Coordination is to initiate an interdisciplinary project in data science. This aim is motivated by the new technological (“container”: network, storage architecture, data-bases, computing architectures) and methodological (“content”: new methods of statistical analysis and probabilistic inference) challenges associated with the acquisition and exploitation of very large volumes of multimodal data (events, time series, images) that will be generated by the SKA.
Motivated by the complexity and challenges of the SKA in the data science domain, our action should allow us to identify and boost new collaborations and synergies with other applicative domains that share the same data issues and research practices, as well as with various data science disciplines (e.g. mathematics, computer research) whose research is based on statistical description of data, mathematical tools, computing and data technologies, virtualised environments. Our aim is that experts from different scientific communities will be able to work along two lines:
-
•
Interdisciplinarity through applications: identify SKA signal processing and analysis issues (scientific, methodological, technological) that are in common with other applicative domains (geophysics, meteorology, particle physics, medical imaging, etc.), allowing to share existing expertise and to construct multi- and inter-disciplinary collaborations.
-
•
Interdisciplinarity within the SKA project: identify how to respond to the challenges of the entire data processing and analysis chain by integrating the technological and methodological components.
6.3 A scientific project with a big expected impact on society
Actors from all around the World are committed to build and operate two gigantic scientific infrastructures which will be located in desert areas of Western Australia and South Africa: this ambitious endeavour simultaneously meets fascinating problems of cooperation and governance at this global scale, as well as issues related to the impact of the infrastructure and to the relations with the indigenous populations, which in turn might feed several domains of social sciences with interesting experiments.
6.3.1 Local development
The development of radioastronomy in Western Australia has given rise to a longstanding collaboration between the scientific community and Australian Aboriginal people (the Wajarri Yamatji), who are traditional custodians of the land on which the SKA1-LOW telescope will be built. For this reason, the Yamatji Marlpa Aboriginal Corporation is partner of the “Indigenous Land Use Agreement”, whose partners include also the Australian Government, the Western Australia Government, the Western Australian State Minister for Lands and the Commonwealth Scientific and Industrial Research Organisation (CSIRO). It is important to stress that, through their collaboration with the SKA project, the Wajarri Yamatji people receive a mixture of monetary and non-monetary benefits aimed at providing long term economic benefit (more information at SKA Australia web page).
Due to a more recent development of astronomical facilities in South Africa, the collaboration of local populations with SKA South Africa is rapidly evolving in current years, with a fantastic educational effort of SKA SA, in collaboration with the Ministry of Science and Technology. The construction of the SKA precursor MeerKAT has provided not only economical benefits (about 40% of the equipments come from local companies), but also the opportunity to train people. Many educational actions are organised with students, from primary schools up to university level. As announced at the SKA South Africa web page, in February 2017, about 826 students had benefited from SKA South Africa bursaries and scholarships, including many young persons from other African countries. Thanks to the SKA project, top-level international researchers are now moving to South Africa from all over the world, boosting the research and educational level, as well as the international visibility of the country. The most recent example is the organisation of the international conference “Astroinformatics 2017” in Cape Town on November 2017. As mentioned above, all these activities are not involving only South Africa, but the whole continent, since the SKA is expected to be extended in several different countries in its Phase 2 (Zambia, Namibia, Botswana, Kenya, Mozambique, Ghana, Madagascar). Nine countries are partners today of the Square Kilometre Array Africa organisation. An exciting recent event resulting from this collaboration happened at the beginning of July 2017, when the Ministries of Ghana and South Africa announced the successful conversion of a communications antenna in Ghana into a functioning Very Long Baseline Interferometry (VLBI) radio telescope.
The interest of French researchers to join the educational effort around the SKA project is clear, with already an active participation, for instance, to the annual Postgraduate Bursary Conference that, since 2006, brings together postdoctoral fellows, students, scientists and engineers in South Africa to develop an interactive community around the SKA project.
6.3.2 Science and Culture
In order to symbolically bring together “under one sky” all countries working within the SKA project, as well as the traditional populations of the lands that will host the telescopes, the SKA Organisation, in collaboration with SKA Australia and SKA South Africa, has organised “Shared Sky”, a collaborative travel exhibition celebrating humanity’s ancient cultural wisdom through artworks of both Aboriginal Australian and South African artists. The exhibition was officially opened by SKA Director General Prof. Phil Diamond during the 2014 SKA Engineering Conference and, since then, it is travelling all over the world, being generally associated with big scientific events related to the SKA project. In collaboration with the SKA Organisation, SKA France is trying to bring Shared Sky in France at the occasion of the “Euroscience Open Forum - ESOF 2018”, which will be held in Toulouse in July 2018. Two paintings of the exhibition are part of the cover image of this volume, a few other wonderful examples are shown in Fig. 78. The indigenous populations have been so enthusiastic of this initiative that others are following, in particular in Australia: in 2015 the “Balagardi Barnagardi” exhibition celebrated the unique relationship between the SKA project and the Wajarri community in Western Australia’s Mid-West region, and new paintings have been produced through the collaboration of artists from the Yamaji Art Centre with astronomers from CSIRO and Curtin University at the Murchison Radioastronomy Observatory.

6.3.3 Global governance
In parallel to these varied connections in the economic, educational and cultural domains, the global nature of the project requires the development of inventive solutions to the many problems that such a large scale collaboration requires in terms of political engagement, of governance, of communication, of economic and scientific return as well as of intellectual property protection, under the overarching requirement of uncompromis efficiency and scientific performance. The fascinating problems arising might undoubtedly trigger original work in the matter of governance and cooperation models of partner countries from the five continents.
6.4 Conclusion
Already when Phase 1 construction will be complete, the scale of the instrument will make it a project which will uniquely address key scientific questions in astrophysics and fundamental physics, with major connections with the rapidly developing field of data science. The construction of the project, on the other hand, is a challenging industrial undertaking calling for radical innovations, strongly motivating technology companies, in a large range of technological fields. Besides, geopolitical and cultural diversity issues place the project in a pioneering position in global cooperation and development programs. The fascinating questions arising for the design, construction and operation phases of the project are likely to foster interesting studies in various domains of social sciences.
7 Conclusions and Perspectives: towards the “Maison SKA France”
C. Ferrari [Université Côte d’Azur, Observatoire de la Côte d’Azur, CNRS, Laboratoire Lagrange, Nice, France], G. Marquette [CNRS-INSU, Institut National des Sciences de l’Univers], M. Pérault [LERMA, Observatoire de Paris, École normale supérieure, PSL Research University, CNRS, Sorbonne Universités, UPMC Univ. Paris 06, Paris, France]
7.1 France positioning assessment
Achievements and perspectives presented above result from the academic and industry partners’ work realised together since more than a year under the auspices of the SKA France Coordination put in place mid-2016.
The first step of this informal structure has been to evaluate, by discussing with SKAO and with international colleagues, where the scientific and technological open challenges of the SKA project reside, and where French actors could bring an added value using a different and complementary approach to jointly address SKA performance and cost. Capitalising on the results obtained by all the partners strongly involved in the SKA project since years, the objective of SKA France is indeed to make the possible entry of France among the SKA member countries a positive factor for everybody, the SKA project in first row. After this first analysis, the SKA France Coordination has invited the main stakeholders – scientific and industrials – to gather in a succession of workshops dedicated to specific topics matching both French available expertise and SKA needs: energy, HPC, signal processing, joint HPC and energy challenges, system integration.
This has led to the structuring of a huge scientific community, going far beyond astronomers: today more than 250 researchers are “SKA-earmarked” in France, with research fields going from radioastronomy to satellite communication, through Big Data, energy production and storage, as well as system integration. It has led also to the federation of companies and research institutes, resulting in the creation of ad-hoc consortia, grouping companies from different industry sectors and laboratories to prepare for the optimum scientific and technological solutions for SKA1 whenever possible, and for SKA2 on longer time-scales.
A full multi-disciplinary approach is almost the golden rule to allow a systemic vision which will allow us to optimise both the scientific and technology performances, imposed by the challenge of several breakthroughs to reach the gigantic SKA aims. This is particularly true for enabling scientists to fully exploit the gold-mine of SKA data through the next supercomputers generation, Big Data management and transport, and multi-functional energy systems, as discussed previously.
Finally the outstanding dimension of the SKA imposes the scientific instrument construction and operation to be treated as an industrial project. Hence the obligation to incorporate in the SKA industry landscape worldwide majors in the domain of project management. As such, the participation of international companies with strong experience in aerospace projects for instance is mandatory.
One year after the SKA France Coordination settling, the road which has been run is huge in terms of structuring and mobilisation of all the actors. This white book is a proof of this achievement. In the light of all the results harvested and the definite will of scientists and industry to demonstrate to all French stakeholders the need to go for the SKA now, it has been concluded that it was time to move to the next step and to organise differently in a common structure – The Maison SKA France – to best prepare French actors to this big challenge.
7.2 The “Maison SKA France”
The SKA France Coordination, together with its private partners, has decided to create the “Maison SKA France” as a forum for its members to meet, exchange, share strategy and perspectives in order to organise their participation to the preparatory works of the SKA and its IGO.
7.2.1 Rationale
SKA France private and public partners have proposed to organise themselves within a light but efficient legal structure to:
-
•
acknowledge the capacity and power of academic and industry partners to help achieve SKA’s goals;
-
•
be an attractor of the French competencies and expertise to strengthen the potential of SKA;
-
•
be a recognised body to interface with the ministries in France and with the organisation SKA;
-
•
be a force of proposition to evolve the SKA program in the best interests of the international astronomical community.
7.2.2 Objectives
-
•
Demonstrate to the French Research Ministry public-private mobilisation to bring France into the SKA Project Office as soon as possible, aiming at 2018;
-
•
promote and recognise the excellence of French scientific teams and industry to be at the fore-front of the science to be developed in SKA;
-
•
develop the expertise and technologies needed to meet the challenges of SKA through strong Private-Public Partnerships. Implementation through theses/postdocs and collaborative research projects financed by public and/or private funds through shared cost actions.
7.2.3 SKA France as an innovative financial model
Because of the perpetually increasing costs demand for Very Large Research Infrastructures, CAPEX and OPEX become monstrous and, even at global level, they cannot be borne anymore by public money only. This is particularly true in astronomy where the requests of the science is directly correlated to the technology performance. Therefore there is a need to put together new business models to cope with this stringency.
The “Maison SKA France” has been built in this perspective too, and has to be seen as a precursor of a new paradigm for industry and research relations, both having same calendar and performance agenda, but different final use perspectives. The multi-usage, transversal domain dimension of the SKA makes it a perfect case study for such new and innovative financial approach.
7.2.4 SKA for France
SKA, for France, is not only a fantastic scientific objective, not only one of the biggest technological challenge ever faced by scientific projects, not only an example for future research environmentally friendly, citizen-oriented tools, but also a precursor of sustainable, economic and societal instrument to develop technologies and business at global scale as well as worldwide knowledge sharing, education enhancement and cultural enrichment.
The “Maison SKA France” is ready to put this fantastic opportunity for France and SKA into action.
List of contributors
| Fabio ACERO | fabio.acero@cea.fr | Chargé de recherche |
| IRFU, CEA, Université Paris-Saclay, Gif-sur-Yvette, France; Université Paris-Diderot, AIM, Sorbonne Paris Cité, CEA, CNRS, Gif-sur-Yvette, France | ||
| Jean-Thomas ACQUAVIVA | jacquaviva@ddn.com | Senior Software at DataDirect Networks |
| DDN Storage, Paris, France | ||
| Rémi ADAM | remi.adam@oca.eu | Post-doctorant |
| Université Côte d’Azur, Observatoire de la Côte d’Azur, CNRS, Laboratoire Lagrange, Nice, France | ||
| Nabila AGHANIM | nabila.aghanim@ias.u-psud.fr | Directrice de recherche |
| Institut d’Astrophysique Spatiale, CNRS, UMR 8617, Université Paris-Sud, Université Paris-Saclay, Orsay, France | ||
| Mark ALLEN | mark.allen@astro.unistra.fr | Directeur de recherche |
| Université de Strasbourg, CNRS, Observatoire astronomique de Strasbourg, UMR 7550, Strasbourg, France | ||
| Marta ALVES | marta.alves@irap.omp.eu | Post-doctorante |
| IRAP, Université de Toulouse, CNRS, UPS, CNES, Toulouse, France | ||
| Rita AMMANOUIL | rita.ammanouil@oca.eu | Post-doctorante |
| Université Côte d’Azur, Observatoire de la Côte d’Azur, CNRS, Laboratoire Lagrange, Nice, France | ||
| Réza ANSARI | ansari@lal.in2p3.fr | Professeur des universités |
| Laboratoire de l’Accélérateur Linéaire, IN2P3-CNRS, Université de Paris-Sud, Orsay Cedex, France | ||
| Anabella ARAUDO | aaraudo@gmail.com | Post-doctorante |
| Laboratoire Univers et Particules de Montpellier, Université de Montpellier, CNRS/IN2P3, Montpellier, France | ||
| Eric ARMENGAUD | eric.armengaud@cea.fr | Ingénieur-Chercheur CEA |
| IRFU, CEA, Université Paris-Saclay, Gif-sur-Yvette, France | ||
| Begoña ASCASO | ascaso@apc.univ-paris7.fr | Post-doctorante |
| Astroparticule et Cosmologie APC, Université Paris Diderot, CNRS/IN2P3, CEA/IRFU, Observatoire de Paris, Sorbonne Paris Cité, Paris, France | ||
| Evangelie ATHANASSOULA | evangelie.athanassoula@lam.fr | Astronome |
| Aix Marseille Univ, CNRS, LAM, Laboratoire d’Astrophysique de Marseille, Marseille, France | ||
| Dominique AUBERT | dominique.aubert@unistra.fr | Maître de conférences |
| Université de Strasbourg, CNRS, Observatoire astronomique de Strasbourg, UMR 7550, Strasbourg, France | ||
| Stanislav BABAK | stanislav.babak@apc.in2p3.fr | Directeur de recherche |
| Astroparticule et Cosmologie APC, Université Paris Diderot, CNRS/IN2P3, CEA/IRFU, Observatoire de Paris, Sorbonne Paris Cité, Paris, France | ||
| Aurore BACMANN | aurore.bacmann@univ-grenoble-alpes.fr | Astronome-adjointe |
| Université Grenoble Alpes, CNRS, IPAG, Grenoble, France | ||
| Anthony BANDAY | abanday@irap.omp.eu | Directeur de recherche |
| IRAP, Université de Toulouse, CNRS, UPS, CNES, Toulouse, France | ||
| Kévin BARRIERE | kevin.barriere@cnrs-dir.fr | Ingénieur |
| CNRS-INSU, Institut National des Sciences de l’Univers | ||
| Frédéric BELLOSSI | frederic.bellossi@ariane.group | Program manager |
| ArianeGroup, Paris, France | ||
| Jean-Philippe BERNARD | Jean-Philippe.Bernard@irap.omp.eu | Directeur de recherche |
| IRAP, Université de Toulouse, CNRS, UPS, CNES, Toulouse, France | ||
| Maria Grazia BERNARDINI | bernardini@lupm.in2p3.fr | Post-doctorante |
| Laboratoire Univers et Particules de Montpellier, Université de Montpellier, CNRS/IN2P3, Montpellier, France | ||
| Matthieu BÉTHERMIN | matthieu.bethermin@lam.fr | Astronome-adjoint |
| Aix Marseille Univ, CNRS, LAM, Laboratoire d’Astrophysique de Marseille, Marseille, France | ||
| Elisabeth BLANC | elisabeth.blanc@cea.fr | Directeur de recherche CEA |
| CEA Commissariat à l’Energie Atomique DAM, Arpajon Cedex, France | ||
| Luc BLANCHET | luc.blanchet@iap.fr | Directeur de recherche |
| Sorbonne Universités, UPMC Univ Paris 6 et CNRS, UMR 7095, Institut d Astrophysique de Paris, Paris, France | ||
| Jérôme BOBIN | jerome.bobin@cea.fr | Ingénieur-Chercheur CEA |
| IRFU, CEA, Université Paris-Saclay, Gif-sur-Yvette, France; Université Paris-Diderot, AIM, Sorbonne Paris Cité, CEA, CNRS, Gif-sur-Yvette, France | ||
| Samuel BOISSIER | samuel.boissier@lam.fr | Chargé de recherche |
| Aix Marseille Univ, CNRS, LAM, Laboratoire d’Astrophysique de Marseille, Marseille, France | ||
| Catherine BOISSON | catherine.boisson@obspm.fr | Astronome |
| LUTh, Observatoire de Paris, PSL Research University, CNRS UMR 8109, Université Pierre et Marie Curie, Universit é Paris Diderot, Meudon, France | ||
| Alessandro BOSELLI | alessandro.boselli@lam.fr | Directeur de recherche |
| Aix Marseille Univ, CNRS, LAM, Laboratoire d’Astrophysique de Marseille, Marseille, France | ||
| Albert BOSMA | albert.bosma@lam.fr | Directeur de recherche |
| Aix Marseille Univ, CNRS, LAM, Laboratoire d’Astrophysique de Marseille, Marseille, France | ||
| Stéphane BOSSE | stephane.bosse@obs-nancay.fr | Ingénieur de recherche |
| Station de Radioastronomie de Nançay, Observatoire de Paris, PSL Research University, CNRS, Univ. Orléans, Nançay, France | ||
| Sandrine BOTTINELLI | sbottinelli@irap.omp.eu | Maître de conférences |
| IRAP, Université de Toulouse, CNRS, UPS, CNES, Toulouse, France | ||
| François BOULANGER | francois.boulanger@lra.ens.fr | Directeur de recherche |
| LERMA, Observatoire de Paris, École normale supérieure, PSL Research University, CNRS, Sorbonne Universités, UPMC Univ. Paris 06, Paris, France; Institut d’Astrophysique Spatiale, CNRS, UMR 8617, Université Paris-Sud, Université Paris-Saclay, Orsay, France | ||
| Rémy BOYER | remy.boyer@l2s.centralesupelec.fr | Maitre de conférences |
| L2S, UMR 8506, CentraleSupélec/CNRS/Université Paris-Sud, Université Paris-Saclay, Gif-sur-Yvette, France | ||
| Andrea BRACCO | andrea.bracco@cea.fr | Post-doctorant |
| Astroparticule et Cosmologie APC, Université Paris Diderot, CNRS/IN2P3, CEA/IRFU, Observatoire de Paris, Sorbonne Paris Cité, Paris, France | ||
| Carine BRIAND | carine.briand@obspm.fr | Astronome |
| LESIA, Observatoire de Paris, PSL Research University, CNRS, Sorbonne Universités, UPMC Université Paris 06, Université Paris Diderot, Meudon, France | ||
| Martin BUCHER | bucher@apc.univ-paris7.fr | Directeur de recherche |
| Astroparticule et Cosmologie APC, Université Paris Diderot, CNRS/IN2P3, CEA/IRFU, Observatoire de Paris, Sorbonne Paris Cité, Paris, France | ||
| Veronique BUAT | veronique.buat@lam.fr | Professeur des universités |
| Aix Marseille Univ, CNRS, LAM, Laboratoire d’Astrophysique de Marseille, Marseille, France | ||
| Laurent CAMBRESY | laurent.cambresy@astro.unistra.fr | Astronome |
| Université de Strasbourg, CNRS, Observatoire astronomique de Strasbourg, UMR 7550, Strasbourg, France | ||
| Michel CAILLAT | michel.caillat@obspm.fr | Ingénieur de recherche |
| LERMA, Observatoire de Paris, École normale supérieure, PSL Research University, CNRS, Sorbonne Universités, UPMC Univ. Paris 06, Paris, France | ||
| Jean-Marc CASANDJIAN | jean-marc.casandjian@cea.fr | Ingénieur-Chercheur CEA |
| IRFU, CEA, Université Paris-Saclay, Gif-sur-Yvette, France; Université Paris-Diderot, AIM, Sorbonne Paris Cité, CEA, CNRS, Gif-sur-Yvette, France | ||
| Emmanuel CAUX | Emmanuel.Caux@irap.omp.eu | Directeur de recherche |
| IRAP, Université de Toulouse, CNRS, UPS, CNES, Toulouse, France | ||
| S bastien CÉLESTIN | sebastien.celestin@cnrs-orleans.fr | Maître de conférences |
| LPC2E, CNRS, Université d’Orléans, Orleans, France | ||
| Matteo CERRUTI | mcerruti@lpnhe.in2p3.fr | Post-doctorant |
| Sorbonne Universités, UPMC Université Paris 06, Université Paris Diderot, Sorbonne Paris Cité, CNRS, Laboratoire de Physique Nucléaire et de Hautes Energies (LPNHE), Paris Cedex 5, France | ||
| Patrick CHARLOT | patrick.charlot@u-bordeaux.fr | Directeur de recherche |
| Laboratoire d astrophysique de Bordeaux, Université de Bordeaux, CNRS, Pessac, France | ||
| Eric CHASSANDE-MOTTIN | ecm@apc.in2p3.fr | Directeur de recherche |
| Astroparticule et Cosmologie APC, Université Paris Diderot, CNRS/IN2P3, CEA/IRFU, Observatoire de Paris, Sorbonne Paris Cité, Paris, France | ||
| Sylvain CHATY | chaty@cea.fr | Professeur des universités |
| IRFU, CEA, Université Paris-Saclay, Gif-sur-Yvette, France; Université Paris-Diderot, AIM, Sorbonne Paris Cité, CEA, CNRS, Gif-sur-Yvette, France; Institut Universitaire de France, Paris, France | ||
| Nelson CHRISTENSEN | nelson.christensen@oca.eu | Directeur de recherche |
| Université Côte d’Azur, Observatoire de la Côte d’Azur, CNRS, Laboratoire Artemis, Nice, France | ||
| Laure CIESLA | laure.ciesla@cea.fr | Post-doctorante |
| IRFU, CEA, Université Paris-Saclay, Gif-sur-Yvette, France; Université Paris-Diderot, AIM, Sorbonne Paris Cité, CEA, CNRS, Gif-sur-Yvette, France | ||
| Nicolas CLERC | nicolas.clerc@irap.omp.eu | Chargé de recherche |
| IRAP, Université de Toulouse, CNRS, UPS, CNES, Toulouse, France | ||
| Johann COHEN-TANUGI | johann.cohen-tanugi@umontpellier.fr | Chargé de recherche |
| Laboratoire Univers et Particules de Montpellier, Université de Montpellier, CNRS/IN2P3, Montpellier, France | ||
| Ismaël COGNARD | icognard@cnrs-orleans.fr | Directeur de recherche |
| LPC2E, CNRS, Université d’Orléans, Orleans, France | ||
| Françoise COMBES | francoise.combes@obspm.fr | Astronome; Professeur des universités |
| LERMA, Observatoire de Paris, Collège de France, École normale supérieure, PSL Research University, CNRS, Sorbonne Universités, UPMC Univ. Paris 06, Paris, France | ||
| Barbara COMIS | barbara.comis@lpsc.in2p3.fr | Post-doctorante |
| Laboratoire de Physique Subatomique et de Cosmologie, Université Grenoble Alpes, CNRS, Grenoble, France | ||
| Stéphane CORBEL | stephane.corbel@cea.fr | Professeur des universités |
| IRFU, CEA, Université Paris-Saclay, Gif-sur-Yvette, France; Université Paris-Diderot, AIM, Sorbonne Paris Cité, CEA, CNRS, Gif-sur-Yvette, France; Station de Radioastronomie de Nançay, Observatoire de Paris, PSL Research University, CNRS, Univ. Orléans, Nançay, France | ||
| Bertrand CORDIER | bcordier@cea.fr | Ingénieur-Chercheur CEA |
| CEA, IRFU/SAp, Université Paris-Saclay, Gif-sur-Yvette, France | ||
| Mickael CORIAT | mickael.coriat@irap.omp.eu | Astronome-adjoint |
| IRAP, Université de Toulouse, CNRS, UPS, CNES, Toulouse, France | ||
| Régis COURTIN | regis.courtin@obspm.fr | Chargé de recherche |
| LESIA, Observatoire de Paris, PSL Research University, CNRS, Sorbonne Universités, UPMC Université Paris 06, Université Paris Diderot, Meudon, France | ||
| Helene COURTOIS | helene.courtois@univ-lyon1.fr | Professeur des universités |
| Université Claude Bernard Lyon I, Institut de Physique Nucléaire, Lyon, France | ||
| Bruno DA SILVA | bruno.dasilva@obs-nancay.fr | Ingénieur de recherche |
| Station de Radioastronomie de Nançay, Observatoire de Paris, PSL Research University, CNRS, Univ. Orléans, Nançay, France | ||
| Emanuele DADDI | emanuele.daddi@cea.fr | Ingénieur-Chercheur CEA |
| IRFU, CEA, Université Paris-Saclay, Gif-sur-Yvette, France; Université Paris-Diderot, AIM, Sorbonne Paris Cité, CEA, CNRS, Gif-sur-Yvette, France | ||
| Richard DALLIER | richard.dallier@subatech.in2p3.fr | Maître-Assistant IMT Atlantique |
| SUBATECH, école des Mines de Nantes, CNRS-IN2P3, Université de Nantes, France | ||
| Emmanuel DARTOIS | emmanuel.dartois@u-psud.fr | Directeur de recherche |
| Institut d’Astrophysique Spatiale, CNRS, UMR 8617, Université Paris-Sud, Université Paris-Saclay, Orsay, France | ||
| Karine DEMYK | karine.demyk@irap.omp.eu | Directrice de recherche |
| IRAP, Université de Toulouse, CNRS, UPS, CNES, Toulouse, France | ||
| Jean-Marc DENIS | jean-marc.2.denis@atos.net | Head of Strategy, Big Data |
| Bull, an ATOS company, Bezons, France | ||
| Laurent DENIS | laurent.denis@obs-nancay.fr | Ingénieur de recherche |
| Station de Radioastronomie de Nançay, Observatoire de Paris, PSL Research University, CNRS, Univ. Orléans, Nançay, France | ||
| Arache DJANNATI-ATAÏ | djannati@in2p3.fr | Directeur de recherche |
| Astroparticule et Cosmologie APC, Université Paris Diderot, CNRS/IN2P3, CEA/IRFU, Observatoire de Paris, Sorbonne Paris Cité, Paris, France | ||
| Jean-François DONATI | jean-francois.donati@irap.omp.eu | Directeur de recherche |
| IRAP, Université de Toulouse, CNRS, UPS, CNES, Toulouse, France | ||
| Marian DOUSPIS | marian.douspis@ias.u-psud.fr | Astronome |
| Institut d’Astrophysique Spatiale, CNRS, UMR 8617, Université Paris-Sud, Université Paris-Saclay, Orsay, France | ||
| Wim van DRIEL | wim.vandriel@obspm.fr | Astronome |
| GEPI, Observatoire de Paris, PSL Research University, CNRS, Meudon, France | ||
| Mohammed Nabil EL KORSO | m.elkorso@parisnanterre.fr | Maître de conférences |
| LEME, EA 4416, Université Paris-Ouest, Ville d’Avray, France | ||
| Edith FALGARONE | edith.falgarone@ens.fr | Directrice de recherche |
| LERMA, Observatoire de Paris, École normale supérieure, PSL Research University, CNRS, Sorbonne Universités, UPMC Univ. Paris 06, Paris, France | ||
| Anthea F. FANTINA | anthea.fantina@ganil.fr | Chargé de recherche |
| Institut d’Astronomie et d’Astrophysique, CP-226, Université Libre de Bruxelles (ULB), Brussels, Belgium; Grand Accélérateur National d’Ions Lourds (GANIL), CEA/DRF CNRS/IN2P3, Caen, France | ||
| Thomas FARGES | thomas.farges@cea.fr | Expert senior CEA |
| CEA Commissariat à l’Energie Atomique DAM, Arpajon Cedex, France | ||
| André FERRARI | andre.ferrari@unice.fr | Professeur des universités |
| Université Côte d’Azur, Observatoire de la Côte d’Azur, CNRS, Laboratoire Lagrange, Nice, France | ||
| Chiara FERRARI | chiara.ferrari@oca.eu | Astronome |
| Université Côte d’Azur, Observatoire de la Côte d’Azur, CNRS, Laboratoire Lagrange, Nice, France | ||
| Katia FERRIÈRE | katia.ferriere@irap.omp.eu | Directrice de recherche |
| IRAP, Université de Toulouse, CNRS, UPS, CNES, Toulouse, France | ||
| Rémi FLAMARY | remi.flamary@unice.fr | Maître de conférences |
| Université Côte d’Azur, Observatoire de la Côte d’Azur, CNRS, Laboratoire Lagrange, Nice, France | ||
| Nicolas GAC | nicolas.gac@lss.supelec.fr | Maître de conférences |
| L2S, UMR 8506, CentraleSupélec/CNRS/Université Paris-Sud, Université Paris-Saclay, Gif-sur-Yvette, France | ||
| Stéphane GAUFFRE | Stephane.Gauffre@obs.u-bordeaux1.fr | Ingénieur de recherche |
| Laboratoire d astrophysique de Bordeaux, Université de Bordeaux, CNRS, Pessac, France | ||
| Françoise GENOVA | francoise.genova@astro.unistra.fr | Directrice de recherche |
| Université de Strasbourg, CNRS, Observatoire astronomique de Strasbourg, UMR 7550, Strasbourg, France | ||
| Julien GIRARD | julien.girard@cea.fr | Maître de conférences |
| IRFU, CEA, Université Paris-Saclay, Gif-sur-Yvette, France; Université Paris-Diderot, AIM, Sorbonne Paris Cité, CEA, CNRS, Gif-sur-Yvette, France | ||
| Isabelle GRENIER | isabelle.grenier@cea.fr | Professeur des universités |
| IRFU, CEA, Université Paris-Saclay, Gif-sur-Yvette, France; Université Paris-Diderot, AIM, Sorbonne Paris Cité, CEA, CNRS, Gif-sur-Yvette, France | ||
| Jean-Mathias GRIESSMEIER | jean-mathias.griessmeier@cnrs-orleans.fr | Astronome-adjoint |
| LPC2E, CNRS, Université d’Orléans, Orleans, France; Station de Radioastronomie de Nançay, Observatoire de Paris, PSL Research University, CNRS, Univ. Orléans, Nançay, France | ||
| Pierre GUILLARD | guillard@iap.fr | Maître de conférences |
| Sorbonne Universités, UPMC Univ Paris 6 et CNRS, UMR 7095, Institut d Astrophysique de Paris, Paris, France | ||
| Lucas GUILLEMOT | lucas.guillemot@cnrs-orleans.fr | Astronome-adjoint |
| LPC2E, CNRS, Université d’Orléans, Orleans, France; Station de Radioastronomie de Nançay, Observatoire de Paris, PSL Research University, CNRS, Univ. Orléans, Nançay, France | ||
| Francesca GULMINELLI | francesca.gulminelli@unicaen.fr | Professeur des universités |
| LPC2E, CNRS, Université d’Orléans, Orleans, France; Station de Radioastronomie de Nançay, Observatoire de Paris, PSL Research University, CNRS, Univ. Orléans, Nançay, France | ||
| Antoine GUSDORF | antoine.gusdorf@lra.ens.fr | Chargé de recherche |
| LERMA, Observatoire de Paris, École normale supérieure, PSL Research University, CNRS, Sorbonne Universités, UPMC Univ. Paris 06, Paris, France | ||
| Emilie HABART | emilie.habart@ias.u-psud.fr | Maître de conférences |
| Institut d’Astrophysique Spatiale, CNRS, UMR 8617, Université Paris-Sud, Université Paris-Saclay, Orsay, France | ||
| François HAMMER | francois.hammer@obspm.fr | Astronome |
| GEPI, Observatoire de Paris, PSL Research University, CNRS, Meudon, France | ||
| Patrick HENNEBELLE | patrick.hennebelle@cea.fr | Ingénieur-Chercheur CEA |
| IRFU, CEA, Université Paris-Saclay, Gif-sur-Yvette, France; Université Paris-Diderot, AIM, Sorbonne Paris Cité, CEA, CNRS, Gif-sur-Yvette, France | ||
| Fabrice HERPIN | fabrice.herpin@u-bordeaux.fr | Astronome |
| Laboratoire d astrophysique de Bordeaux, Université de Bordeaux, CNRS, Pessac, France | ||
| Olivier HERVET | ohervet@ucsc.edu | Post-doctorant |
| Santa Cruz Institute for Particle Physics and Department of Physics, University of California at Santa Cruz, Santa Cruz, CA, USA | ||
| Annie HUGHES | Annie.Hughes@irap.omp.eu | Astronome-adjointe |
| IRAP, Université de Toulouse, CNRS, UPS, CNES, Toulouse, France | ||
| Olivier ILBERT | olivier.ilbert@lam.fr | Astronome-adjoint |
| Aix Marseille Univ, CNRS, LAM, Laboratoire d’Astrophysique de Marseille, Marseille, France | ||
| Miho JANVIER | miho.janvier@ias.u-psud.fr | Astronome-adjoint |
| Institut d’Astrophysique Spatiale, CNRS, UMR 8617, Université Paris-Sud, Université Paris-Saclay, Orsay, France | ||
| Eric JOSSELIN | eric.josselin@obs-mip.fr | Maître de conférences |
| Laboratoire Univers et Particules de Montpellier, Université de Montpellier, CNRS/IN2P3, Montpellier, France; IRAP, Université de Toulouse, CNRS, UPS, CNES, Toulouse, France | ||
| Alain JULIER | alain.julier@thalesaleniaspace.com | Head of Future Projects Department |
| Thales Alenia Space, Domaine Observation & Sciences, Toulouse, France | ||
| Cyril LACHAUD | cyril.lachaud@in2p3 | Maître de conférences |
| Astroparticule et Cosmologie APC, Université Paris Diderot, CNRS/IN2P3, CEA/IRFU, Observatoire de Paris, Sorbonne Paris Cité, Paris, France | ||
| Guilaine LAGACHE | guilaine.lagache@lam.fr | Astronome |
| Aix Marseille Univ, CNRS, LAM, Laboratoire d’Astrophysique de Marseille, Marseille, France | ||
| Rosine LALLEMENT | rosine.lallement@obspm.fr | Directrice de recherche |
| GEPI, Observatoire de Paris, PSL Research University, CNRS, Meudon, France | ||
| Sébastien LAMBERT | sebastien.lambert@obspm.fr | Astronome-adjoint |
| SYRTE, Observatoire de Paris, PSL Research University, CNRS, Sorbonne Universités, UPMC Université Paris 06, LNE, Paris, France | ||
| Laurent LAMY | laurent.lamy@obspm.fr | Astronome-adjoint |
| LESIA, Observatoire de Paris, PSL Research University, CNRS, Sorbonne Universités, UPMC Université Paris 06, Université Paris Diderot, Meudon, France | ||
| Mathieu LANGER | mathieu.langer@ias.u-psud.fr | Maître de conférences |
| Institut d’Astrophysique Spatiale, CNRS, UMR 8617, Université Paris-Sud, Université Paris-Saclay, Orsay, France | ||
| Pascal LARZABAL | pascal.larzabal@satie.ens-cachan.fr | Professeur des universités |
| SATIE, UMR 8029, École Normale Supérieure de Cachan, Université Paris-Saclay, Cachan, France | ||
| Guilhem LAVAUX | guilhem.lavaux@iap.fr | Chargé de recherche |
| Sorbonne Universités, UPMC Univ Paris 6 et CNRS, UMR 7095, Institut d Astrophysique de Paris, Paris, France | ||
| Thibaut LE BERTRE | thibaut.lebertre@obspm.fr | Directeur de recherche |
| LERMA, Observatoire de Paris, École normale supérieure, PSL Research University, CNRS, Sorbonne Universités, UPMC Univ. Paris 06, Paris, France | ||
| Olivier LE FÈVRE | olivier.lefevre@lam.fr | Astronome |
| Aix Marseille Univ, CNRS, LAM, Laboratoire d’Astrophysique de Marseille, Marseille, France | ||
| Alexandre LE TIEC | letiec@obspm.fr | Chargé de recherche |
| LUTh, Observatoire de Paris, PSL Research University, CNRS UMR 8109, Université Pierre et Marie Curie, Universit é Paris Diderot, Meudon, France | ||
| Bertrand LEFLOCH | bertrand.lefloch@univ-grenoble-alpes.fr | Directeur de recherche |
| Université Grenoble Alpes, CNRS, IPAG, Grenoble, France | ||
| Matthew LEHNERT | lehnert@iap.fr | Directeur de recherche |
| Sorbonne Universités, UPMC Univ Paris 6 et CNRS, UMR 7095, Institut d Astrophysique de Paris, Paris, France | ||
| Marianne LEMOINE-GOUMARD | lemoine@cenbg.in2p3.fr | Chargée de recherche |
| Université Bordeaux, CNRS/IN2P3, Centre d Études Nucléaires de Bordeaux Gradignan, Gradignan, France | ||
| François LEVRIER | francois.levrier@ens.fr | Maître de conférences |
| LERMA, Observatoire de Paris, École normale supérieure, PSL Research University, CNRS, Sorbonne Universités, UPMC Univ. Paris 06, Paris, France | ||
| Marceau LIMOUSIN | marceau.limousin@lam.fr | Chargé de recherche |
| Aix Marseille Univ, CNRS, LAM, Laboratoire d’Astrophysique de Marseille, Marseille, France | ||
| Darek LIS | darek.lis@obspm.fr | Professeur des universités |
| LERMA, Observatoire de Paris, École normale supérieure, PSL Research University, CNRS, Sorbonne Universités, UPMC Univ. Paris 06, Paris, France | ||
| André LÓPEZ-SEPULCRE | lopez@iram.fr | Chargé de recherche |
| Institut de Radioastronomie Millimétrique (IRAM), Saint Martin d Hères, France | ||
| Juan MACIAS-PEREZ | macias@lpsc.in2p3.fr | Directeur de recherche |
| Laboratoire de Physique Subatomique et de Cosmologie, Université Grenoble Alpes, CNRS, Grenoble, France | ||
| Christophe MAGNEVILLE | christophe.magneville@cea.fr | Ingénieur-Chercheur CEA |
| IRFU, CEA, Université Paris-Saclay, Gif-sur-Yvette, France | ||
| Alexandre MARCOWITH | Alexandre.Marcowith@umontpellier.fr | Directeur de recherche |
| Laboratoire Univers et Particules de Montpellier, Université de Montpellier, CNRS/IN2P3, Montpellier, France | ||
| Jérôme MARGUERON | j.margueron@ipnl.in2p3.fr | Chargé de recherche |
| Institute for Nuclear Theory, University of Washington, Seattle, Washington, USA; Institut de Physique Nucléaire de Lyon, CNRS/IN2P3, Université de Lyon, Université Claude Bernard Lyon 1, Villeurbanne, France | ||
| Gabriel MARQUETTE | gabriel.marquette@cnrs-dir.fr | Délégué aux relations industrielles |
| CNRS-INSU, Institut National des Sciences de l’Univers | ||
| Douglas MARSHALL | douglas.marshall@cea.fr | Maître de Conférences |
| IRFU, CEA, Université Paris-Saclay, Gif-sur-Yvette, France; Université Paris-Diderot, AIM, Sorbonne Paris Cité, CEA, CNRS, Gif-sur-Yvette, France | ||
| Lilian MARTIN | lilian.martin@subatech.in2p3.fr | Chargé de recherche |
| SUBATECH, école des Mines de Nantes, CNRS-IN2P3, Université de Nantes, France; Station de Radioastronomie de Nançay, Observatoire de Paris, PSL Research University, CNRS, Univ. Orléans, Nançay, France | ||
| David MARY | david.mary@unice.fr | Professeur des universités |
| Université Côte d’Azur, Observatoire de la Côte d’Azur, CNRS, Laboratoire Lagrange, Nice, France | ||
| Sophie MASSON | Sophie.Masson@obspm.fr | Astronome-adjointe |
| LESIA, Observatoire de Paris, PSL Research University, CNRS, Sorbonne Universités, UPMC Université Paris 06, Université Paris Diderot, Meudon, France; Station de Radioastronomie de Nançay, Observatoire de Paris, PSL Research University, CNRS, Univ. Orléans, Nançay, France | ||
| Sophie MAUROGORDATO | sophie.maurogordato@oca.eu | Directrice de recherche |
| Université Côte d’Azur, Observatoire de la Côte d’Azur, CNRS, Laboratoire Lagrange, Nice, France | ||
| Cyril MAZAURIC | cyril.mazauric@atos.net | HPC Applications and performances expert |
| Bull, an ATOS company, Bezons, France | ||
| Yannic MELLIER | mellier@iap.fr | Astronome |
| Sorbonne Universités, UPMC Univ Paris 6 et CNRS, UMR 7095, Institut d Astrophysique de Paris, Paris, France | ||
| Marc-Antoine MIVILLE-DESCHÊNES | mamd@ias.u-psud.fr | Directeur de recherche |
| Institut d’Astrophysique Spatiale, CNRS, UMR 8617, Université Paris-Sud, Université Paris-Saclay, Orsay, France | ||
| Ludovic MONTIER | ludovic.montier@irap.omp.eu | Ingénieur de recherche |
| IRAP, Université de Toulouse, CNRS, UPS, CNES, Toulouse, France | ||
| Fabrice MOTTEZ | fabrice.mottez@obspm.fr | Directeur de recherche |
| LUTh, Observatoire de Paris, PSL Research University, CNRS UMR 8109, Université Pierre et Marie Curie, Universit é Paris Diderot, Meudon, France | ||
| Denis MOURARD | denis.mourard@oca.eu | Astronome |
| Université Côte d’Azur, Observatoire de la Côte d’Azur, CNRS, Laboratoire Lagrange, Nice, France | ||
| Nicole NESVADBA | nicole.nesvadba@ias.u-psud.fr | Chargée de recherche |
| Institut d’Astrophysique Spatiale, CNRS, UMR 8617, Université Paris-Sud, Université Paris-Saclay, Orsay, France | ||
| Jean-Fran ois NEZAN | jnezan@insa-rennes.fr | Professeur des Universités |
| IETR, INSA Rennes, CNRS UMR 6164, Rennes, France | ||
| Pasquier NOTERDAEME | noterdaeme@iap.fr | Chargé de recherche |
| Sorbonne Universités, UPMC Univ Paris 6 et CNRS, UMR 7095, Institut d Astrophysique de Paris, Paris, France | ||
| Jérôme NOVAK | jerome.novak@obspm.fr | Directeur de recherche |
| LUTh, Observatoire de Paris, PSL Research University, CNRS UMR 8109, Université Pierre et Marie Curie, Universit é Paris Diderot, Meudon, France | ||
| Pierre OCVIRK | pierre.ocvirk@astro.unistra.fr | Astronome-adjoint |
| Université de Strasbourg, CNRS, Observatoire astronomique de Strasbourg, UMR 7550, Strasbourg, France | ||
| Micaela OERTEL | micaela.oertel@obspm.fr | Chargée de recherche |
| LUTh, Observatoire de Paris, PSL Research University, CNRS UMR 8109, Université Pierre et Marie Curie, Universit é Paris Diderot, Meudon, France | ||
| Xavier OLIVE | xavier.olive@thalesaleniaspace.com | Head Ground Segment & Value-added Data section |
| Thales Alenia Space, Domaine Observation & Sciences, Toulouse, France | ||
| Virginie OLLIER | virginie.ollier@satie.ens-cachan.fr | Doctorante |
| SATIE, UMR 8029, École Normale Supérieure de Cachan, Université Paris-Saclay, Cachan, France; L2S, UMR 8506, CentraleSupélec/CNRS/Université Paris-Sud, Université Paris-Saclay, Gif-sur-Yvette, France | ||
| Nathalie PALANQUE-DELABROUILLE | nathalie.palanque-delabrouille@cea.fr | Directeur de Recherche CEA |
| IRFU, CEA, Université Paris-Saclay, Gif-sur-Yvette, France | ||
| Mamta PANDEY-POMMIER | mamtapan@gmail.com | Post-doctorante |
| Université Lyon, Université Lyon1, Ens de Lyon, CNRS, Centre de Recherche Astrophysique de Lyon UMR5574, France | ||
| Yan PENNEC | yan.pennec@airliquide.com | Scientist and Business Developer |
| Air Liquide, Grenoble, France | ||
| Michel PÉRAULT | michel.perault@ens.fr | Directeur de recherche |
| LERMA, Observatoire de Paris, École normale supérieure, PSL Research University, CNRS, Sorbonne Universités, UPMC Univ. Paris 06, Paris, France | ||
| Celine PEROUX | celine.peroux@lam.fr | Chargée de recherche |
| Aix Marseille Univ, CNRS, LAM, Laboratoire d’Astrophysique de Marseille, Marseille, France | ||
| Pascal PETIT | ppetit@irap.omp.eu | Astronome |
| IRAP, Université de Toulouse, CNRS, UPS, CNES, Toulouse, France | ||
| Jérôme PÉTRI | jerome.petri@astro.unistra.fr | Maître de conférences |
| Université de Strasbourg, CNRS, Observatoire astronomique de Strasbourg, UMR 7550, Strasbourg, France | ||
| Antoine PETITEAU | petiteau@apc.univ-paris7.fr | Maître de conférences |
| Astroparticule et Cosmologie APC, Université Paris Diderot, CNRS/IN2P3, CEA/IRFU, Observatoire de Paris, Sorbonne Paris Cité, Paris, France | ||
| Jérôme PETY | pety@iram.fr | Astronome |
| Institut de Radioastronomie Millimétrique (IRAM), Saint Martin d Hères, France; LERMA, Observatoire de Paris, École normale supérieure, PSL Research University, CNRS, Sorbonne Universités, UPMC Univ. Paris 06, Paris, France | ||
| Gabriel W. PRATT | gabriel.pratt@cea.fr | Ingénieur-Chercheur CEA |
| IRFU, CEA, Université Paris-Saclay, Gif-sur-Yvette, France; Université Paris-Diderot, AIM, Sorbonne Paris Cité, CEA, CNRS, Gif-sur-Yvette, France | ||
| Mathieu PUECH | mathieu.puech@obspm.fr | Astronome-adjoint |
| GEPI, Observatoire de Paris, PSL Research University, CNRS, Meudon, France | ||
| Benjamin QUERTIER | benjamin.quertier-dagorn@u-bordeaux.fr | Ingénieur de recherche |
| Laboratoire d astrophysique de Bordeaux, Université de Bordeaux, CNRS, Pessac, France | ||
| Erwan RAFFIN | erwan.raffin@atos.net | HPC Applications and performances expert |
| Bull, an ATOS company, Bezons, France | ||
| Sangitiana RAKOTOZAFY HARISON | sangitiana@obs-nancay.fr | Ingénieur de recherche |
| Station de Radioastronomie de Nançay, Observatoire de Paris, PSL Research University, CNRS, Univ. Orléans, Nançay, France | ||
| Stephen RAWSON | steve.rawson@callisto-space.com | CEO |
| Callisto, Villefranche de Lauragais, France | ||
| Matthieu RENAUD | matthieu.renaud@umontpellier.fr | Chargé de recherche |
| Laboratoire Univers et Particules de Montpellier, Université de Montpellier, CNRS/IN2P3, Montpellier, France | ||
| Benoît REVENU | benoit.revenu@subatech.in2p3.fr | Directeur de recherche |
| SUBATECH, école des Mines de Nantes, CNRS-IN2P3, Université de Nantes, France | ||
| Cédric RICHARD | cedric.richard@unice.fr | Professeur des universités |
| Université Côte d’Azur, Observatoire de la Côte d’Azur, CNRS, Laboratoire Lagrange, Nice, France | ||
| Johan RICHARD | johan.richard@univ-lyon1.fr | Astronome-adjoint |
| Université Lyon, Université Lyon1, Ens de Lyon, CNRS, Centre de Recherche Astrophysique de Lyon UMR5574, France | ||
| François RINCON | francois.rincon@irap.omp.eu | Chargé de recherche |
| IRAP, Université de Toulouse, CNRS, UPS, CNES, Toulouse, France | ||
| Isabelle RISTORCELLI | isabelle.ristorcelli@irap.omp.eu | Chargée de recherche |
| IRAP, Université de Toulouse, CNRS, UPS, CNES, Toulouse, France | ||
| Jerome RODRIGUEZ | jrodriguez@cea.fr | Ingénieur-Chercheur CEA |
| IRFU, CEA, Université Paris-Saclay, Gif-sur-Yvette, France; Université Paris-Diderot, AIM, Sorbonne Paris Cité, CEA, CNRS, Gif-sur-Yvette, France | ||
| Mathias SCHULTHEIS | mathias.schultheis@oca.eu | Astronome-adjoint |
| Université Côte d’Azur, Observatoire de la Côte d’Azur, CNRS, Laboratoire Lagrange, Nice, France | ||
| Carlo SCHIMD | carlo.schimd@lam.fr | Maître de conférences |
| Aix Marseille Univ, CNRS, LAM, Laboratoire d’Astrophysique de Marseille, Marseille, France | ||
| Benoit SEMELIN | benoit.semelin@obspm.fr | Professeur des universités |
| LERMA, Observatoire de Paris, École normale supérieure, PSL Research University, CNRS, Sorbonne Universités, UPMC Univ. Paris 06, Paris, France | ||
| Hélène SOL | helene.sol@obspm.fr | Directeur de Recherche |
| LUTh, Observatoire de Paris, PSL Research University, CNRS UMR 8109, Université Pierre et Marie Curie, Universit é Paris Diderot, Meudon, France | ||
| Jean-Luc STARCK | jstarck@cea.fr | Directeur de Recherche CEA |
| IRFU, CEA, Université Paris-Saclay, Gif-sur-Yvette, France; Université Paris-Diderot, AIM, Sorbonne Paris Cité, CEA, CNRS, Gif-sur-Yvette, France | ||
| Michel TAGGER | michel.tagger@cnrs-orleans.fr | Directeur de recherche |
| LPC2E, CNRS, Université d’Orléans, Orleans, France | ||
| Cyril TASSE | cyril.tasse@obspm.fr | Astronome-adjoint |
| GEPI, Observatoire de Paris, PSL Research University, CNRS, Meudon, France | ||
| Gilles THEUREAU | theureau@cnrs-orleans.fr | Astronome |
| LPC2E, CNRS, Université d’Orléans, Orleans, France; Station de Radioastronomie de Nançay, Observatoire de Paris, PSL Research University, CNRS, Univ. Orléans, Nançay, France; LUTh, Observatoire de Paris, PSL Research University, CNRS UMR 8109, Université Pierre et Marie Curie, Universit é Paris Diderot, Meudon, France | ||
| Stephen TORCHINSKY | steve.torchinsky@obspm.fr | Ingénieur de recherche |
| Astroparticule et Cosmologie APC, Université Paris Diderot, CNRS/IN2P3, CEA/IRFU, Observatoire de Paris, Sorbonne Paris Cité, Paris, France | ||
| Charlotte VASTEL | charlotte.vastel@irap.omp.eu | Astronome-adjointe |
| IRAP, Université de Toulouse, CNRS, UPS, CNES, Toulouse, France | ||
| Susanna D. VERGANI | susanna.vergani@obspm.fr | Chargée de recherche |
| GEPI, Observatoire de Paris, PSL Research University, CNRS, Meudon, France | ||
| Laurent VERSTRAETE | laurent.verstraete@ias.u-psud.fr | Professeur des Universités |
| Institut d’Astrophysique Spatiale, CNRS, UMR 8617, Université Paris-Sud, Université Paris-Saclay, Orsay, France | ||
| Xavier VIGOUROUX | xavier.vigouroux@atos.net | Head of CEPP |
| Bull, an ATOS company, Bezons, France | ||
| Nicole VILMER | nicole.vilmer@obspm.fr | Directrice de recherche |
| LESIA, Observatoire de Paris, PSL Research University, CNRS, Sorbonne Universités, UPMC Université Paris 06, Université Paris Diderot, Meudon, France | ||
| Jean-Pierre VILOTTE | vilotte@ipgp.fr | Professeur |
| Institut de Physique du Globe de Paris, Paris, France | ||
| Natalie WEBB | natalie.webb@irap.omp.eu | Astronome |
| IRAP, Université de Toulouse, CNRS, UPS, CNES, Toulouse, France | ||
| Nathalie YSARD | nathalie.ysard@ias.u-psud.fr | Chargée de recherche |
| Institut d’Astrophysique Spatiale, CNRS, UMR 8617, Université Paris-Sud, Université Paris-Saclay, Orsay, France | ||
| Philippe ZARKA | philippe.zarka@obspm.fr | Directeur de recherche |
| LESIA, Observatoire de Paris, PSL Research University, CNRS, Sorbonne Universités, UPMC Université Paris 06, Université Paris Diderot, Meudon, France; Station de Radioastronomie de Nançay, Observatoire de Paris, PSL Research University, CNRS, Univ. Orléans, Nançay, France |
List of additional French supporters to the SKA project
Members of the French community who are not co-authors of this White Book, but expressed their interest in the SKA project by completing the form at the web page “Le projet SKA m’intéresse”. Follow this link for a summary of their scientific interests.
| Laurence ALSAC | laurence.alsac@obs-nancay.fr |
| Station de Radioastronomie de Nançay, Observatoire de Paris, PSL Research University, CNRS, Univ. Orléans, Nançay, France | |
| Philippe AMRAM | philippe.amram@lam.fr |
| Aix Marseille Univ, CNRS, LAM, Laboratoire d’Astrophysique de Marseille, Marseille, France | |
| Slaheddine ARIDHI | slah@sensoriaanalytics.com |
| Sensoria Analytics | |
| Monique ARNAUD | monique.arnaud@cea.fr |
| IRFU, CEA, Université Paris-Saclay, Gif-sur-Yvette, France; Université Paris-Diderot, AIM, Sorbonne Paris Cité, CEA, CNRS, Gif-sur-Yvette, France | |
| Hakim ATEK | hakim.atek@iap.fr |
| Sorbonne Universités, UPMC Univ Paris 6 et CNRS, UMR 7095, Institut d Astrophysique de Paris, Paris, France | |
| Jonathan AUMONT | jonathan.aumont@ias.u-psud.fr |
| Institut d’Astrophysique Spatiale, CNRS, UMR 8617, Université Paris-Sud, Université Paris-Saclay, Orsay, France; IRAP, Université de Toulouse, CNRS, UPS, CNES, Toulouse, France | |
| David BARATOUX | david.baratoux@ird.fr |
| Institut de Recherche pour le Développement, France | |
| Bruno BARELAUD | bruno.barelaud@xlim.fr |
| XLIM UMR CNRS 7252, Université de Limoges, France | |
| Pierre BARGE | pierre.barge@lam.fr |
| Aix Marseille Univ, CNRS, LAM, Laboratoire d’Astrophysique de Marseille, Marseille, France | |
| Severin BARTH | severin.barth@obs-nancay.fr |
| Station de Radioastronomie de Nançay, Observatoire de Paris, PSL Research University, CNRS, Univ. Orléans, Nançay, France | |
| Alain BAUDRY | alain.baudry@u-bordeaux.fr |
| Laboratoire d astrophysique de Bordeaux, Université de Bordeaux, CNRS, Pessac, France | |
| Gérard BEAUDIN | gerard.beaudin@obspm.fr |
| LERMA, Observatoire de Paris, École normale supérieure, PSL Research University, CNRS, Sorbonne Universités, UPMC Univ. Paris 06, Paris, France | |
| Alexandre BEELEN | alexandre.beelen@ias.u-psud.fr |
| Institut d’Astrophysique Spatiale, CNRS, UMR 8617, Université Paris-Sud, Université Paris-Saclay, Orsay, France; Aix Marseille Univ, CNRS, LAM, Laboratoire d’Astrophysique de Marseille, Marseille, France | |
| Christophe BENOIST | christophe.benoist@oca.eu |
| Université Côte d’Azur, Observatoire de la Côte d’Azur, CNRS, Laboratoire Lagrange, Nice, France | |
| Matthieu BERTHOMIER | matthieu.berthomier@lpp.polytechnique.fr |
| LPP, École Polytechnique, Sorbonne Universités, Observatoire de Paris, Paris-Scalay | |
| Florian BOLGAR | florian.bolgar@obspm.fr |
| LERMA, Observatoire de Paris, École normale supérieure, PSL Research University, CNRS, Sorbonne Universités, UPMC Univ. Paris 06, Paris, France | |
| Sylvain BONTEMPS | sylvain.bontemps@u-bordeaux.fr |
| Laboratoire d astrophysique de Bordeaux, Université de Bordeaux, CNRS, Pessac, France | |
| Nicolas BOUCHE | nicolas.bouche@irap.omp.eu |
| IRAP, Université de Toulouse, CNRS, UPS, CNES, Toulouse, France | |
| François BOUCHET | bouchet@iap.fr |
| Sorbonne Universités, UPMC Univ Paris 6 et CNRS, UMR 7095, Institut d Astrophysique de Paris, Paris, France | |
| Géraldine BOURDA | bouchet@iap.fr |
| Laboratoire d astrophysique de Bordeaux, Université de Bordeaux, CNRS, Pessac, France | |
| Jean-Claude BOURET | jean-claude.bouret@lam.fr |
| Aix Marseille Univ, CNRS, LAM, Laboratoire d’Astrophysique de Marseille, Marseille, France | |
| Jonathan BRAINE | jonathan.braine@u-bordeaux.fr |
| Laboratoire d astrophysique de Bordeaux, Université de Bordeaux, CNRS, Pessac, France | |
| Denis BURGARELLA | denis.burgarella@lam.fr |
| Aix Marseille Univ, CNRS, LAM, Laboratoire d’Astrophysique de Marseille, Marseille, France | |
| Rémi CABANAC | rcabanac@irap.omp.eu |
| IRAP, Université de Toulouse, CNRS, UPS, CNES, Toulouse, France | |
| Sylvie CABRIT | sylvie.cabrit@obspm.fr |
| LERMA, Observatoire de Paris, École normale supérieure, PSL Research University, CNRS, Sorbonne Universités, UPMC Univ. Paris 06, Paris, France | |
| Benoit CARRY | benoit.carry@oca.eu |
| Université Côte d’Azur, Observatoire de la Côte d’Azur, CNRS, Laboratoire Lagrange, Nice, France | |
| Baptiste CECCONI | baptiste.cecconi@obspm.fr |
| LESIA, Observatoire de Paris, PSL Research University, CNRS, Sorbonne Universités, UPMC Université Paris 06, Université Paris Diderot, Meudon, France | |
| Benjamin CENSIER | benjamin.censier@obs-nancay.fr |
| Station de Radioastronomie de Nançay, Observatoire de Paris, PSL Research University, CNRS, Univ. Orléans, Nançay, France | |
| Stéphane CHARLOT | charlot@iap.fr |
| Sorbonne Universités, UPMC Univ Paris 6 et CNRS, UMR 7095, Institut d Astrophysique de Paris, Paris, France | |
| Bertrand CHAUVINEAU | chauvineau@oca.eu |
| Université Côte d’Azur, Observatoire de la Côte d’Azur, CNRS, Laboratoire Lagrange, Nice, France | |
| Thierry CONTINI | thierry.contini@irap.omp.eu |
| IRAP, Université de Toulouse, CNRS, UPS, CNES, Toulouse, France | |
| Vincent COUDÉ DU FORESTO | vincent.foresto@obspm.fr |
| LESIA, Observatoire de Paris, PSL Research University, CNRS, Sorbonne Universités, UPMC Université Paris 06, Université Paris Diderot, Meudon, France | |
| Audrey COUTENS | audrey.coutens@u-bordeaux.fr |
| Laboratoire d astrophysique de Bordeaux, Université de Bordeaux, CNRS, Pessac, France | |
| Karol DESNOS | kdesnos@insa-rennes.fr |
| IETR, INSA Rennes, UMR CNRS 6161, UBL, France | |
| Pierre-Alain DUC | pierre-alain.duc@astro.unistra.fr |
| Université de Strasbourg, CNRS, Observatoire astronomique de Strasbourg, UMR 7550, Strasbourg, France | |
| Laurent DUGOUJON | laurent.dugoujon@st.com |
| STMicroelectronics | |
| Jean-Baptiste DURRIVE | jean.baptiste.durrive@e.mbox.nagoya-u.ac.jp |
| Nagoya University, Japon | |
| Evan EAMES | evan.eames@obspm.fr |
| LERMA, Observatoire de Paris, École normale supérieure, PSL Research University, CNRS, Sorbonne Universités, UPMC Univ. Paris 06, Paris, France | |
| Benoît EPINAT | benoit.epinat@lam.fr |
| Aix Marseille Univ, CNRS, LAM, Laboratoire d’Astrophysique de Marseille, Marseille, France | |
| Stéphanie ESCOFFIER | escoffier@cppm.in2p3.fr |
| Centre de Physique des Particules de Marseille; CNRS/IN2P3 & AMU | |
| Gilles ESPOSITO-FARÈSE | gef@iap.fr |
| Sorbonne Universités, UPMC Univ Paris 6 et CNRS, UMR 7095, Institut d Astrophysique de Paris, Paris, France | |
| Alexandre FAURE | alexandre.faure@univ-grenoble-alpes.fr |
| Université Grenoble Alpes, CNRS, IPAG, Grenoble, France | |
| Thierry FOGLIZZO | foglizzo@cea.fr |
| CEA, IRFU/SAp, Université Paris-Saclay, Gif-sur-Yvette, France | |
| Maurice GHEUDIN | maurice.gheudin@obspm.fr |
| LERMA, Observatoire de Paris, École normale supérieure, PSL Research University, CNRS, Sorbonne Universités, UPMC Univ. Paris 06, Paris, France | |
| Olivier GODET | ogodet@irap.omp.eu |
| IRAP, Université de Toulouse, CNRS, UPS, CNES, Toulouse, France | |
| Paolo GOLDONI | goldoni@apc.in2p3.fr |
| Astroparticule et Cosmologie APC, Université Paris Diderot, CNRS/IN2P3, CEA/IRFU, Observatoire de Paris, Sorbonne Paris Cité, Paris, France | |
| Christian GOUIFFÈS | christian.gouiffes@cea.fr |
| CEA, DRF/IRFU/SAP/LEPCHE, Saclay, France | |
| Oliver HAHN | oliver.hahn@oca.eu |
| Université Côte d’Azur, Observatoire de la Côte d’Azur, CNRS, Laboratoire Lagrange, Nice, France | |
| Bernard JARRY | bernard.jarry@xlim.fr |
| CNRS UMR 7252, Université de Limoges, France | |
| Thierry LANZ | thierry.lanz@oca.eu |
| Université Côte d’Azur, Observatoire de la Côte d’Azur, CNRS, Laboratoire Lagrange, Nice, France | |
| Damien LE BORGNE | leborgne@iap.fr |
| Sorbonne Universités, UPMC Univ Paris 6 et CNRS, UMR 7095, Institut d Astrophysique de Paris, Paris, France | |
| Amandine LE BRUN | amandine.le-brun@cea.fr |
| Université Paris-Diderot, AIM, Sorbonne Paris Cité, CEA, CNRS, Gif-sur-Yvette, France | |
| Elena LEGA | elena.lega@oca.eu |
| Université Côte d’Azur, Observatoire de la Côte d’Azur, CNRS, Laboratoire Lagrange, Nice, France | |
| James LEQUEUX | james.lequeux@obspm.fr |
| LERMA, Observatoire de Paris, École normale supérieure, PSL Research University, CNRS, Sorbonne Universités, UPMC Univ. Paris 06, Paris, France | |
| Alan LOH | alan.loh@obspm.fr |
| LESIA, Observatoire de Paris, PSL Research University, CNRS, Sorbonne Universités, UPMC Université Paris 06, Université Paris Diderot, Meudon, France | |
| Benoit LOTT | lott@cenbg.in2p3.fr |
| Centre Etudes Nucl aires de Bordeaux Gradignan, CNRS, IN2P3, Bordeaux, France | |
| Sofian MAABOUT | sofian.maabout@u-bordeaux.fr |
| Laboratoire Bordelais de Recherche en Informatique (LaBRI), Université de Bordeaux, France | |
| Suzanne MADDEN | suzanne.madden@cea.fr |
| CEA, DRF/IRFU/SAP/LFEMI, Saclay, France | |
| Anna MANGILLI | anna.mangilli@irap.omp.eu |
| IRAP, Université de Toulouse, CNRS, UPS, CNES, Toulouse, France | |
| Jérôme MARGUERON | j.margueron@ipnl.in2p3.fr |
| Institut de Physique Nucléaire de Lyon, France | |
| Simona MEI | simona.mei@obspm.fr |
| LERMA, Observatoire de Paris, École normale supérieure, PSL Research University, CNRS, Sorbonne Universités, UPMC Univ. Paris 06, Paris, France | |
| Anne-Laure MELCHIOR | anne-laure.melchior@obspm.fr |
| LERMA, Observatoire de Paris, École normale supérieure, PSL Research University, CNRS, Sorbonne Universités, UPMC Univ. Paris 06, Paris, France | |
| Jean-Baptiste MELIN | jean-baptiste.melin@cea.fr |
| CEA, DRF/IRFU/SPP, Saclay, France | |
| Daniel MENARD | daniel.menard@insa-rennes.fr |
| INSA, Rennes, France | |
| Patrick MICHEL | michelp@oca.eu |
| Université Côte d’Azur, Observatoire de la Côte d’Azur, CNRS, Laboratoire Lagrange, Nice, France | |
| Héloïse MÉHEUT | heloise.meheut@oca.eu |
| Université Côte d’Azur, Observatoire de la Côte d’Azur, CNRS, Laboratoire Lagrange, Nice, France | |
| Thierry NOEL | thierry.noel@st.com |
| STMicroelectronics | |
| Déborah PARADIS | deborah.paradis@irap.omp.eu |
| IRAP, Université de Toulouse, CNRS, UPS, CNES, Toulouse, France | |
| Maxime PELCAT | mpelcat@insa-rennes.fr |
| IETR, INSA Rennes, CNRS UMR 6164, Rennes, France | |
| Valeria PETTORINO | valeria.pettorino@cea.fr |
| Université Paris-Diderot, AIM, Sorbonne Paris Cité, CEA, CNRS, Gif-sur-Yvette, France | |
| Sandrine PIRES | sandrine.pires@cea.fr |
| Université Paris-Diderot, AIM, Sorbonne Paris Cité, CEA, CNRS, Gif-sur-Yvette, France | |
| Simon PRUNET | prunet@cfht.hawaii.edu |
| CFHT | |
| Delphine RUSSEIL | delphine.russeil@lam.fr |
| Aix Marseille Univ, CNRS, LAM, Laboratoire d’Astrophysique de Marseille, Marseille, France | |
| Quentin SALOMÉ | quentin.salome@ias.u-psud.fr |
| Institut d’Astrophysique Spatiale, CNRS, UMR 8617, Université Paris-Sud, Université Paris-Saclay, Orsay, France | |
| Philippe SALOMÉ | philippe.salome@obspm.fr |
| LERMA, Observatoire de Paris, École normale supérieure, PSL Research University, CNRS, Sorbonne Universités, UPMC Univ. Paris 06, Paris, France | |
| Youssouf SAMEUT BOUHAIK | youssouf.sameut_bouhaik@hotmail.com |
| L2S, UMR 8506, CentraleSupélec/CNRS/Université Paris-Sud, Université Paris-Saclay, Gif-sur-Yvette, France | |
| Norma SANCHEZ | norma.sanchez@obspm.fr |
| LERMA, Observatoire de Paris, École normale supérieure, PSL Research University, CNRS, Sorbonne Universités, UPMC Univ. Paris 06, Paris, France | |
| Aurore SAVOY-NAVARRO | aurore.savoy-navarro@apc.univ-paris7.fr |
| Astroparticule et Cosmologie APC, Université Paris Diderot, CNRS/IN2P3, CEA/IRFU, Observatoire de Paris, Sorbonne Paris Cité, Paris, France | |
| Daniel SCHAERER | daniel.schaerer@unige.ch |
| CNRS & Observatoire de Genève | |
| Hayato SHIMABUKURO | hayato.shimabukuro@obspm.fr |
| LERMA, Observatoire de Paris, École normale supérieure, PSL Research University, CNRS, Sorbonne Universités, UPMC Univ. Paris 06, Paris, France | |
| Eric SLEZAK | eric.slezak@oca.eu |
| Université Côte d’Azur, Observatoire de la Côte d’Azur, CNRS, Laboratoire Lagrange, Nice, France | |
| David SMITH | smith@cenbg.in2p3.fr |
| CENBG/IN2P3/CNRS, France | |
| Genevieve SOUCAIL | gsoucail@irap.omp.eu |
| IRAP, Université de Toulouse, CNRS, UPS, CNES, Toulouse, France | |
| Philippe STEE | philippe.stee@oca.eu |
| Université Côte d’Azur, Observatoire de la Côte d’Azur, CNRS, Laboratoire Lagrange, Nice, France | |
| Antoine STRUGAREK | antoine.strug@cea.fr |
| CEA | |
| Christian SOURACE | christian.surace@lam.fr |
| Aix Marseille Univ, CNRS, LAM, Laboratoire d’Astrophysique de Marseille, Marseille, France | |
| Christophe TAFFOUREAU | ctaffoureau@obs-nancay.fr |
| Station de Radioastronomie de Nançay, Observatoire de Paris, PSL Research University, CNRS, Univ. Orléans, Nançay, France | |
| Lidia TASCA | lidia.tasca@lam.fr |
| Aix Marseille Univ, CNRS, LAM, Laboratoire d’Astrophysique de Marseille, Marseille, France | |
| Cedric VIOU | Cedric.Dumez-Viou@obs-nancay.fr |
| Station de Radioastronomie de Nançay, Observatoire de Paris, PSL Research University, CNRS, Univ. Orléans, Nançay, France | |
| Valentine WAKELAM | valentine.wakelam@u-bordeaux.fr |
| Laboratoire d astrophysique de Bordeaux, Université de Bordeaux, CNRS, Pessac, France |