Collective behavior of colloids due to critical Casimir interactions
Abstract
If colloidal solute particles are suspended in a solvent close to its critical point, they act as cavities in a fluctuating medium and thereby restrict and modify the fluctuation spectrum in a way which depends on their relative configuration. As a result effective, so-called critical Casimir forces (CCFs) emerge between the colloids. The range and the amplitude of CCFs depend sensitively on the temperature and the composition of the solvent as well as on the boundary conditions of the order parameter of the solvent at the particle surfaces. These remarkable, moreover universal features of the CCFs provide the possibility for an active control over the assembly of colloids. This has triggered a recent surge of experimental and theoretical interest in these phenomena. We present an overview of current research activities in this area. Various experiments demonstrate the occurrence of thermally reversible self-assembly or aggregation or even equilibrium phase transitions of colloids in the mixed phase below the lower consolute points of binary solvents. We discuss the status of the theoretical description of these phenomena, in particular the validity of a description in terms of effective, one-component colloidal systems and the necessity of a full treatment of a ternary solvent-colloid mixture. We suggest perspectives on the directions towards which future research in this field might develop.
I Introduction
Finite-size contributions to the free energy of a spatially confined fluid give rise to an effective force per area acting on the confining surfaces Evans:1990 . Fisher and de Gennes Fisher-et:1978 made the crucial observation that this fluid-mediated interaction acquires a universal, long-ranged contribution if the bulk critical point of the fluid is approached. This is due to critical fluctuations, and hence the notion ‘critical Casimir force’, in analogy with quantum-mechanical Casimir forces which are due to quantum fluctuations of confined electromagnetic fields Casimir:1948 ; Kardar-et:1999 . In the case of colloidal suspensions with near-critical suspending fluids (referred to as solvents), the typically micrometer-sized colloidal particles act as cavities inside the critical solvent. At the colloid surfaces these cavities impose boundary conditions for the fluctuating order parameter of the solvent and perturb the order parameter field on the length scale of the bulk correlation length . Such modifications of the order parameter and the restrictions of its fluctuation spectrum depend on the spatial configuration of the colloids. Following the argument by Fisher and de Gennes Fisher-et:1978 , this gives rise to CCFs between the colloids, which is attractive for identical particles and has a range set by the bulk correlation length of the solvent. Since , where is a standard bulk critical exponent, this range diverges upon approaching the bulk critical temperature of the pure solvent.
The collective behavior of colloids dissolved in the near-critical solvent is determined by the interplay between the CCFs and other interactions acting between the constituents. In general, in colloidal suspensions the dissolved particles interact directly via van der Waals interactions; these are attractive and lead to irreversible aggregation (called coagulation) VarweyOverbeek:1948 . In charge-stabilized suspensions, the colloids acquire surface charges due to dissociation of the surface groups in water or due to chemical functionalization of the surface of the particles. This causes the formation of electric double layers around the colloids and results in electrostatic repulsion between them. In sterically-stabilized suspensions, the short polymer chains grafted onto the surface of colloidal particles give rise to a repulsive interaction which is of entropic origin. Additionally, the presence of other smaller solute particles or macromolecular additives such as polymers, surfactants, or micelles Likos:2001 , induces effective entropic interactions between the colloids, called depletion forces, which are predominantly attractive and short-ranged Asakura-et:1954 ; Vrij:76 . If the CCFs between colloidal particles are attractive and sufficiently strong to overcome the direct repulsive forces, one may expect the occurrence of a thermodynamically stable colloid-rich liquid or solid phase - even in the absence of any direct attractive interactions. If the resulting attractive potential is sufficiently strong, the condensation transition from a colloid-poor (’gas’) to a colloid-rich (’liquid’) phase may be preempted (on the characteristic time scales of the observations) by the formation of non-equilibrium aggregates in which the colloidal particle stick together. In general, such aggregates may grow or shrink and their structure varies from loose fractals through gels and glasses to crystals, depending on the packing fraction of the colloidal particles in the aggregates and on the strength of the attraction among the colloidal particles.
Beysens and Estève Beysens-et:1985 were the first to study experimentally aggregation phenomena for colloids suspended in binary solvents. These authors studied silica spheres immersed in a water-lutidine mixture by using light scattering. They found the formation of aggregates which sediment upon approaching the bulk coexistence region of demixing from the one-phase region of the binary liquid mixture at constant composition of the solvent. Strikingly, the observed aggregation was thermally reversible; moving back the thermodynamic state deeply into the one-phase region the sediments dissolved again. In the decade following this pioneering work, quite a number of further experiments were performed leading to a similar behavior for various binary solvents and a variety of colloids. The structure of the aggregates as well as the the kinetics of aggregation and the reverse process of fragmentation have been investigated. Silica, quartz powder, and polystyrene particles immersed in water-lutidine mixtures were studied in Refs. Gurfein-et:1989 ; gallagher:92 ; Broide-et:1993 ; narayanan:95 ; Kurnaz , whereas in Refs. narayanan:93 ; Jayalakshmi-et:1997 ; Kline-et:1994 ; Koehler-et:1997 ; grull:97 other solvents were employed; for corresponding reviews see Refs. Beysens-et:1994 ; Beysens-et:1999 ; Law:2001 . These experiments, which were performed mostly in the one-phase region of a binary liquid mixture, revealed that reversible aggregation (termed flocculation) is accompanied by a strong adsorption phenomenon in the vicinity of the bulk two-phase coexistence curve. Generically, colloidal particles have a preference for one of the two components of the binary solvent. At the surface of the colloid this preference gives rise to an effective surface field conjugate to the order parameter at the surface and thus leads to an adsorption layer rich in this preferred component. The measurements demonstrated that the temperature - composition region in which colloidal aggregation appears is not symmetric about the critical composition of the binary solvent. Strong aggregation occurs on that side of the critical composition which is rich in the component not preferred by the colloids.
Various mechanisms were put forward for strong adsorption giving rise to attraction which in turn could explain the occurrence of (non-equilibrium) flocculation. For example, capillary condensation and/or wetting can occur when particles come close together via diffusion, even far off the critical composition of the solvent. In this case a liquid ’bridge’ can form which induces attractive solvation forces Bauer-et:2000 . Another possibility is that the presence of an adsorption layer around the colloidal particles increases the strength of the direct attractive dispersion interactions. However, in the close vicinity of the bulk critical point of the solvent, in line with the predictions of Fisher and de Gennes, effective attraction induced by critical fluctuations is expected be dominant. In their original paper, Beysens and Estève have identified an “aggregation line” in the temperature-composition phase diagram of the solvent with a prewetting line. However, they have observed that this aggregation line extends to temperatures below the lower demixing critical point of a solvent. However, in general such an extent of prewetting lines has not been found up to now, neither for planar nor for spherical substrates. Actually, positive curvature even shortens prewetting lines Bieker-et:1998 . (Regrettably, the wetting behavior of this system in planar geometry has never been investigated.) The authors did not comment on this difference nor did they admit the role of critical fluctuations and Casimir forces for aggregation in the critical region. They have presumed that the aggregation process results from the attractive forces between the colloids due to the presence of the adsorption layer and have referred to de Gennes deGennes as the one who had proposed such fluctuation induced interactions at and near the bulk critical point of the solvent, but they have not put their results into the proper context of de Gennes’s predictions. According to another interpretation of the experimental findings mentioned above, the observed phenomenon is regarded as a precursor of a bona fide phase transition in the ternary mixture rather then a non-equilibrium flocculation of colloidal particles Kline-et:1994 ; Jayalakshmi-et:1997 ; Koehler-et:1997 . A few theoretical Sluckin:1990 and simulation Loewen:1995 ; Netz:1996 attempts have been concerned with such an interpretation. The status of knowledge about reversible aggregation of colloids in binary solvents up to the late 1990s has been reviewed by Beysens and Narayanan (see Ref. Beysens-et:1999 and references therein). More recently, the scenario of ’bridging’ transitions has again been studied theoretically in Refs. Archer-et:2005 ; Okamoto-et:2011a ; Okamoto-et:2013 ; Labbe-Laurent-et:2017 .
In spite of the relevance of aggregation phenomena for the stability of colloidal suspensions, the basic understanding of the collective behavior of colloids dissolved in a near-critical solvent has started to emerge only recently. This progress had to await the advances made during the last decade concerning the statistical mechanical theory and computer simulations of CCFs. The accumulated theoretical knowledge of two-body CCFs has triggered also an increase of experimental activities in this field. This renewed interest is driven by application perspectives, in particular concerning the buildup of nanostructured materials of well defined structure by using self-assembly of colloidal particles. In order to achieve a desirable morphology of aggregates, one has to be able to control colloidal self-assembly and to manipulate the particles. The remarkable features of CCFs offer such possibilities. The range and the strength of the CCFs, which depend sensitively on temperature via the bulk correlation length , can be tuned reversibly and continuously by moving the thermodynamic state of the solvent around its critical point. The sign of can be manipulated as well by suitable surface treatments of the colloids Hertlein-et:2008 ; Gambassi-et:2009 ; Nellen-et:2009 . Additional interest is sparked by the potential relevance of CCFs for lipid membranes. These are two-dimensional (2d) liquids consisting of two (or more) components, such as cholesterol and saturated and unsaturated lipids, which can undergo phase separation into two liquid phases, one being rich in the first two components and the other rich in the third membranes1 . Lipid membranes serve as model systems for cell plasma membranes LS . Recent experiments suggest that cell membranes are tuned to the miscibility critical point of the Ising model membranes ; Machta-et:2016 so that CCFs may arise between macromolecules embedded in the membrane sehtna ; Machta-et:2012 ; Benet-et:2017 .
Other mechanisms, which — similar to the ones generating the critical Casimir effect — also induce solvent-mediated long-ranged interactions, occur inter alia in a chemical sol upon approaching its percolation transition Gnan-et:2014 , in a binary liquid mixture subjected to a steady temperature gradient due to the concomitant nonequilibrium concentration fluctuations Kirkpatrick-et:2015 , in driven noncohesive granular media due to hydrodynamic fluctuations Cattuto-et:2006 , or if the solvent comprises active matter such as bacteria or self-propelled colloidal particles Ray-et:2014 ; Ni-et:2015 .
Compared with other effective forces between colloid particles or macromolecules, CCFs have two advantages. First, due to the concept of universality for critical phenomena, to a large extent CCFs do not depend on microscopic details of the system. Second, whereas adding depletion agents or ions changes the resulting effective forces de facto irreversibly, the tuning of via temperature is fully and easily reversible.
The present article discusses current theoretical and numerical approaches towards the description of the static, equilibrium properties of colloidal suspensions with a near-critical binary solvent. The related experimental body of research is put into the corresponding context and a number of intriguing possible developments are highlighted. Recent developments concerning colloidal assembly due to CCFs with a focus on the experimental observations is reviewed in Ref. Schall_review .
II Effective one-component approach
A common approach to the statistical mechanics description of colloidal suspensions follows the ideas developed for multi-component molecular liquids, such as ionic solutions, by considering the colloidal particles as ’supramolecules’ VNFA:78 ; Hansen:93 ; Likos:2001 . Within this approach, the degrees of freedom of the solvent and the ions, in the case of charged-stabilized suspensions, are traced out in order to construct an effective one-component system of colloidal particles interacting via state- and configuration-dependent forces. For most cases, carrying out the integration over microscopic degrees of freedom can be done only approximately, leading to additive pairwise interactions between the colloidal particles (see the corresponding discussion below). For any binary mixture with pair interactions for which the volume integral is finite, a formal expression for an effective Hamiltonian, describing particles of one species only but in the presence of the particles of the other species, has been given in Ref. Dijkstra-et:1999 . This effective Hamiltonian consists of zero-body, one-body, two-body, three-body, and higher-body interactions, which depend on the density of the second species and have to be determined one by one. For additive hard-sphere mixtures with a large size asymmetry, a comparison with direct simulations of true binary mixtures has shown that the pairwise (depletion) potential approximation of the effective Hamiltonian between two large particles accounts remarkably well for the phase equilibria, even in limits for which one might expect that higher-body terms cannot be neglected. This success encourages one to use an effective one-component approach (with the approximation of an additive pairwise potential) to colloids suspended in a near-critical solvent, despite the fact that the CCFs are inherently non additive. The critical Casimir interaction between two colloidal particles depends on the (instantaneous) spatial configuration of all colloids Mattos-et:2013 ; Mattos-et:2015 ; Hobrecht-et:2015 ; Volpe-et . Only for dilute suspensions or for temperatures sufficiently far away from the bulk critical temperature of the pure solvent, such that the range of the critical Casimir interaction between the colloids is much smaller than the mean distance between them, the assumption of pairwise additive CCFs is expected to be reliable.
II.1 Effective interactions
In most of the experimentally studied systems, the solvent is a binary mixture of molecular liquids and the colloidal particles are micro-sized spheres of a radius . For such a sizewise highly asymmetric multi-component system, one can ignore the discrete nature of the solvent and use a simplified pair potential model for the background interaction potential between the colloids, which is present also away from the critical temperature of the solvent. Such a model is supposed to capture only the essential features of a stable suspension on the relevant, i.e., mesoscopic, length scale. Besides the van der Waals contribution, which will be discussed below, these features are the hard core repulsion for center-to-center distances and a soft repulsive contribution, for which one can employ the Yukawa potential. This leads to the screened Coulomb model of suspensions which are charge-stabilized against flocculation Russel-et:1989 ; Hansen_Loewen:2000 ; Barrat-et:2003 :
| (1) |
where is the surface-to-surface distance and is the Boltzmann constant. The range of the repulsion is the Debye screening length (see, e.g., Ref. vdW ), where is the elementary charge, the permittivity of the solvent relative to the vaccum, C2/(Jm) is the vacuum permittivity, and the number densities of all ions (regardless of the sign of their charges). A simplified, purely exponential form of the repulsive pair potential,
| (2) |
is often used for suspensions in which for distances , for which all curvature effects associated with the spherical geometry of the colloidal particles effectively drop out Israelachvili:1998 ; Levin:2002 . The corresponding condition is practically satisfied for the experimentally relevant systems for which the Debye length is of the order of 10 nm and the colloidal size of the order of 1. For the effective Coulomb interaction screened by counterions the amplitude is given by Russel-et:1989
| (3) |
where is the surface charge density of the colloid. The purely exponential form of repulsion (Eq. (2)) can also describe sterically stabilized suspensions beyond the hard-sphere model Israelachvili:1998 . In that case the range of the repulsion is associated with the length of the grafted polymers and the strength of the repulsion depends on the surface coverage of grafted polymers.
Upon approaching the bulk critical point ) of the solvent, CCFs between the particles emerge and the corresponding pair potential adds to the background contribution. In the well defined scaling limit of all length scales of the system being large on molecular scales, attains a scaling form Barber:1983 ; privman ; Krech-et:1992 in terms of suitable dimensionless scaling variables describing the distance between the colloids, the dependence on the thermodynamic state of the solvent, and the shape of the colloidal particles. For example, for the spherical particles one has
| (4) |
In Eq. (4), is a universal scaling function. Here , with for an upper () and a lower () critical point, respectively, is the true correlation length governing the exponential decay of the solvent bulk two-point order parameter (OP) correlation function for and where is the bulk ordering field conjugate to the OP. The amplitudes (with referring to the sign of ) are non-universal but their ratio is universal. The correlation length governs the exponential decay of the solvent bulk two-point OP correlation function for and , where is a non-universal amplitude related to via universal amplitude ratios; , , and are standard bulk critical exponents Pelissetto-et:2002 . For the demixing phase transition of a binary liquid mixture, the OP is proportional to the deviation of the concentration of species, say ,
| (5) |
from its value at the critical point, i.e., ; here , , are the number densities of the particles of species and , respectively. The bulk ordering field, conjugate to this order parameter, is proportional to the deviation of the difference of the chemical potentials , , of the two species from its critical value, i.e., . We note, that the actual scaling fields of fluids are linear combinations of and of the reduced temperature .
The minimal model for a pair potential describing the effects of a critical solvent on dissolved colloids due to CCFs, i.e., corresponding to the sum of Eqs. (2) and (4), has been used in Refs. Bonn-et:2009 ; Gambassi-et:2010 ; Mohry-et:2012a ; Mohry-et:2012b ; Mohry-et:2014 ; Nguyen-et:2013 ; Dang-et:2013 . In Ref. Zvyagolskaya-et:2011 , instead of a soft repulsive potential of the form as in Eqs. (2) and (3), the electrostatic repulsion has been modeled via a hard disc repulsion with an effective diameter. In some of the studies cited above, a simplified functional form of the universal scaling function has been employed Bonn-et:2009 ; Gambassi-et:2010 ; Nguyen-et:2013 ; Dang-et:2013 , such as using a form valid only asymptotically for large values of the temperature scaling variable neglecting the dependence on the other, also relevant scaling variables. Since, however, the shape of the total pair potential depends sensitively on details of the CCFs pair potential, there is a need to discuss them (see Subsec. II.2 below).
In order to be able to describe certain experimental systems, one has to consider also the interaction which accounts for effectively attractive dispersion forces. For two spheres, the (nonretarded) van der Waals forces contribute to the total potential through a term (see, e.g., Refs. Chen:1996 ; vdW )
| (6) |
where is the Hamaker constant. As increases, this term crosses over from the behavior to . The Hamakar constant depends on the dielectric properties of the materials involved in the experiment under consideration vdW . By using index-of-refraction-matched colloidal suspensions Israelachvili:1998 its value can be strongly reduced. This way dispersion forces can be effectively switched off. (A detailed discussion of the Hamakar constant for a polystyrene colloid near a silica glass substrate immersed in a mixture of water and 2,6-lutidine can be found in Ref. Gambassi-et:2009 .)
Additionally, in the presence of small co-solutes such as free polymer coils or smaller colloids in a stericly stabilized colloidal suspension, one has to consider depletion interactions which arise between large colloidal particles due to entropic effects caused by the small solutes. This so-called depletion interaction is mainly attractive and has a range proportional to the size of the depletant Asakura-et:1954 ; Vrij:76 . There are several theories and approximations for the depletion potential, which are summarized in Refs. Goetzelmann-et:1998 ; Roth-et:2000 . For example, for a fluid of large hard spheres of radius and a small spherical depletant of diameter , which on its own behaves as an ideal gas, the depletion potential is Vrij:76
| (7) |
where . In Eq. (7) is the bulk number density of the small spheres. Note that in Eq. (7) is equal to the pressure () times the overlap volume between the excluded volumes denied to the centers of the small spheres around each big sphere. Taking into account hard-core repulsion among the depletants produces a repulsive contribution to the depletion interaction as well as an oscillatory decay at large distances Goetzelmann-et:1998 ; Roth-et:2000 . For many actual colloidal suspensions the depletion attraction is strong enough to induce colloidal aggregation and, despite of its rather short range, a gas-liquid-like phase separation, because even a small degree of polydispersity or non-sphericity of the particles causes the fluid phase to be not preempted by crystallization.
If the depletant is only a co-solute in the suspension in which the solvent becomes critical, the resulting depletion potential simply adds to the background potential. It may, however, occur that due to an effective depletant-depletant interaction the depletant itself exhibits a phase transition with a critical point. This means that the solvent, which is common to both the big spheres and the depletant, does not display a critical point of its own as the one discussed above. A system which realizes this interesting scenario was studied experimentally in Refs. Buzzaccaro-et:2010 ; Piazza-et:2011 and via Monte Carlo simulations Gnan-et:2012a (see Secs. II.2.5 and IV.5 below where we shall review the results of these studies). In such a case one expects that the depletant produces one unique effective pair potential between the big particles. Far away from the critical point of the depletant, this unique pair potential has the character of a depletion interaction, whereas close to the critical region of the depletant it should display the features of the CCFs pair potential. As has been shown in Refs. Buzzaccaro-et:2010 ; Piazza-et:2011 , the framework of density functional theory (DFT) Evans:1979 , which is commonly adopted in colloidal science, can provide both forms for the effective pair potential in the corresponding limits (see Sec. II.2 below for details). In Ref. Gnan-et:2012a , the effective pair potential between two big hard-sphere colloids has been determined numerically for two models of the depletant particles within a wide range of state points, including the critical region. In the first model, the spherical depletant particles interact via a pairwise square-well potential (SW):
| (8) |
where is the center-to-center distance between two depletant particles, is a dimensionless well width, and is the well depth. The second depletant model is an anisotropic three-patches (3P) Kern-Frenkel system which consists of hard-sphere particles decorated with three attractive sites KF . The critical packing fraction of these patchy particles is very small - as in the experimental system studied in Refs. Buzzaccaro-et:2010 ; Piazza-et:2011 . For this kind of depletant, the numerically determined effective pair potential between two big spheres has subsequently been used in a grand canonical off-lattice MC simulation in order to analyze the stability of the colloidal suspension for a system of colloidal particles interacting via the pairwise additive interaction , where is a hard-sphere potential. The results of this study will be discussed below in Sec. II.2.5.
II.2 Critical Casimir pair potential
A crucial ingredient for an effective one-component approach is to have an accurate critical Casimir potential (CCP) between two colloidal particles. This is not only relevant for the investigation of aggregation or the bulk phase behavior of colloids, but it is also of intrinsic scientific interest. In recent years an experimental technique (total internal reflection microscopy (TIRM) Walz-97 ; Prieve-99 ; h-th ) has been developed which allows one to measure directly and with fN resolution the effective potential of the CCF between a colloidal particle, suspended in a near-critical binary mixture, and a fixed object such as a planar wall Hertlein-et:2008 ; Nellen-et:2009 ; Gambassi-et:2009 . Video microscopy has also been used in order to determine the potential of the CCF between two spherical colloids Nguyen-et:2013 ; Dang-et:2013 ; Shelke-et:2013 ; Marcel-et . Although the resolution and the sophistication of such experiments increase, it is difficult to interpret the data of these measurements mainly due to the inevitable, simultaneous presence of various contributions to the effective pair potential. Therefore reliable theoretical results are required in order to improve the interpretations.
The solvent-mediated force between two spherical particles, a surface-to-surface distance apart, is defined as the negative derivative of the excess free energy ,
| (9) |
where is the bulk free energy density of the solvent and is the free energy of the solvent in the macroscopically large volume excluding the volume of two suspended colloids. The CCF is the long-ranged universal contribution to which emerges upon approaching the bulk critical point of the solvent. The associated critical Casimir potential (CCP) is
| (10) |
so that the critical Casimir force (CCF) is given by . According to finite-size scaling theory Barber:1983 ; privman , the CCP exhibits scaling described by a universal scaling function as given by Eq. (4). This scaling function is determined solely by the so-called universality class of the continuous phase transition occurring in the bulk, the geometry of the setup, and the surface universality classes of the confining surfaces Diehl:1986 ; Krech:1990:0 ; dantchev ; gambassi:2009 . The relevant bulk universality class for colloidal suspensions is the Ising universality class in spatial dimension or . For the CCF one has
| (11) |
The main difficulty in determining theoretically the scaling function of CCFs and their potential lies in the character of the critical fluctuations; an adequate treatment has to include non-Gaussian fluctuations. Usually colloidal particles exert a potential on the surrounding fluid which is infinitely repulsive at short distances and attractive at large distances. Such potentials give rise to pronounced peaks in the density profile of the fluid near the surface of the particle, i.e., there is strong adsorption. In terms of a field-theoretical description this corresponds to the presence of a strong (dimensionless) surface field . For binary liquid mixtures one has so that there is a local increment at the surface of the chemical potential difference between the two species. It determines which species of the solvent is preferentially adsorbed at the surface of the colloid. The preference for one component of a binary liquid mixture may be so strong as to saturate the surface of the colloids with the preferred component, which corresponds to . For two colloids this gives rise to symmetry-breaking boundary conditions (denoted by or ) for the solvent order parameter. The resulting spatial variation of the order parameter poses a significant complication for obtaining analytic results. Moreover, non-planar geometries lower the symmetry of the problem. Apart from a few exceptions and limiting cases, the presently available analytical results for CCFs are of approximate character.
At first, for two spherical colloidal particles, the corresponding CCP has been studied theoretically right at the bulk critical point. De Gennes deGennes has proposed the singular effective interaction potential between two widely separated spheres by using a free energy functional, which goes beyond mean-field in the sense that it incorporates the non-classical bulk critical exponents, but neglects the critical exponent ; is the standard bulk critical exponent for the two-point correlation function at criticality with in and in Pelissetto-et:2002 . Within this approach he has found that for the energy of interaction in the limit is . For that interaction potential, the so-called protein limit, which corresponds to , and which is based on exact arguments using conformal invariance, renders, within a small-sphere expansion Burkhardt-et:1995 ; Eisenriegler-et:95 ,
which implies for the scaling function in Eq. (4) . In Ref. Burkhardt-et:1995 the amplitude of in has been estimated to be slightly larger than , which is a factor of ca 15 smaller than the above prediction given by de Gennes deGennes . In the opposite, the so-called Derjaguin limit , one has Burkhardt-et:1995 ; Eisenriegler-et:95
which in turn implies for the scaling function in Eq. (4) . These results confirm that the CCFs can indeed successfully compete with direct dispersion Dantchev-et:2007 ; Dantchev-et:2017 or electrostatic forces in determining the stability and phase behavior of colloidal systems.
II.2.1 Mean field theory
Concerning the full range of parameters, theoretical predictions for the universal scaling function of the CCP between spheres are available only within mean field theory Hanke-et:1998 ; Schlesener-et:2003 . Within this Landau - Ginzburg - Wilson approach, the CCF is conveniently calculated using the stress tensor in terms of the mean field profile Eisenriegler-et:1994 :
| (14) |
where is an arbitrary -dimensional surface enclosing a colloid, is the outward normal of this surface, and is the force between two colloids, where is a unit vector along the line connecting their centers. The orientation of is such that corresponds to attraction (repulsion). In most cases the mean-field profile is determined by numerical minimization of the Landau-Ginzburg-Wilson Hamiltonian encompassing suitable surface contributions from the colloid surfaces in order to account for symmetry-breaking boundary conditions there. In spatial dimensions such a theory is approximate. In the spirit of a systematic expansion in terms of , it is exact in for four-dimensional spheres. Recently, the same approach has been employed in order to calculate the scaling function of the CCFs for three-dimensional spheres posing as hypercylinders in spatial dimension 111In the present notation and correspond to and used in Ref. Mohry-et:2014 , respectively. Mohry-et:2014 , where . The obtained results differ from the ones for four-dimensional spherical particles in . This raises the question whether or renders the better mean-field approximation for the physically relevant case of three-dimensional spheres in . Due to this uncertainty more accurate theoretical approaches are highly desirable. Recent MC simulations of a sphere near a wall constitute a first step in this direction Hasenbusch .
The mean field Landau-Ginzburg-Wilson theory is a versatile approach for calculating CCFs. In the case of the simple film geometry, this approximate approach reproduces correctly the qualitative behavior of CCFs (i.e., their sign, functional form, and structure) for various combinations of surface universality classes. Therefore it has been used to calculate CCFs for various shapes of colloidal particles and for other geometries. Non-spherical, i.e., highly ellipsoidal or sphero-cylindrical colloids, or elongated particles such as cylindrical micelles cyl_mic , block copolymers block_copol , the mosaic tobacco virus mos_tob_vir , and carbon nanotubes carbon_nan are experimentally available and widely used in the corresponding current research efforts, with application perspectives towards new materials in mind. The orientation dependent CCP for ellipsoidal particles near a planar wall at vanishing bulk field has been studied in Ref. Kondrat-et:2009 . In this case, due to the anisotropy of the particles, there is not only a force but also a torque acting on the particle. This may lead to additional interesting effects such as the orientational ordering of nonspherical colloids in a critical solvent. The behavior of hypercylinders and near planar, chemically structured substrates have been studied in Ref. Troendle-et:2009-10 . In Ref. Mattos-et:2013 , the scaling function associated with CCFs for a system consisting of two spherical particles facing a planar, homogeneous substrate has been calculated. This allows one to determine the change of the lateral CCF between two colloids upon approaching a wall which acts like a large third body. Within the applied mean field theory, this many body contribution can reach up to 25 of the pure pair interaction. As one would expect, the many-body effects were found to be more pronounced for small distances, as well as for temperatures close to criticality. This trend has been confirmed by studying three parallel hypercylinders within mean field theory Mattos-et:2015 and three discs in within MC simulations Hobrecht-et:2015 . Three-body interactions in for spherical colloids have been determined experimentally Volpe-et . However, at the present stage these data cannot yet be compared quantitatively with theoretical results. In Ref. Labbe-Laurent the CCP for and the ensuing alignment of cylindrical colloids near chemically patterned substrates has been determined within mean field theory. The case in which the particles exhibit spatially inhomogeneous surface properties, forming so-called Janus particles which carry two opposing boundary conditions, has also been considered Labbe-Laurent-et:2016 . The experimental fabrication of such particles is of research interest in itself fabrication ; Labbe-Laurent-et:2016 as is the theoretical understanding of the interactions between spherical spherical_Janus ; Labbe-Laurent-et:2016 or non-spherical Janus particles Labbe-Laurent-et:2016 ; nonspherical_Janus , because they are considered to be promising building-blocks for self-assembling materials materials ; Iwashita-et:2013 ; Iwashita-et:2014 .
II.2.2 Beyond mean field theory
Beyond mean field theory, theoretical predictions for the CCP for two spheres immersed in a critical fluid are available from conformal field methods, which, however, are restricted to the bulk critical point of the solvent and to . As mentioned in passing, the exact analytical results for the limiting behavior of spheres which nearly touch (Eq. (II.2)) and spheres which are widely separated (Eq. (II.2)) have been obtained by using conformal invariance of the free energy and taking the Derjaguin limit in the first case and applying the small-sphere expansion in the second case, respectively Burkhardt-et:1995 . For the Ising universality class, the CCP has been calculated numerically Burkhardt-et:1995 within the full range of distances between two spheres. More recently this was achieved also analytically Machta-et:2012 via the partition function of the critical Ising model on a cylinder, using a conformal mapping onto an annulus. For non-spherical colloidal particles with their dummbell or lens shapes being small compared to the correlation length and to the interparticle distances, exact results for the orientation-dependent CCFs have been obtained by using a small-particle operator expansion and by exploiting conformal invariance for and Eisenriegler:2004 . In fact, in conformal field theory provides a general scheme for critical Casimir interactions between two (or more) objects of arbitrary shape Bimonte-et:2013 . This can be achieved by using the local conformal mappings of the exterior region of two such objects onto a circular annulus for which the stress tensor is known. Assuming the availability of a simple transformation law for the stress tensor under any such (local) conformal mappings, the CCFs are obtained from the contour integral of the transformed stress tensor along a contour surrounding either one of the two objects Bimonte-et:2013 .
Another nonperturbative approach, which allows one to calculate CCFs directly at a fixed specific spatial dimension — potentially an advantage over field-theoretic approaches based on a systematic expansion in terms of — is the use of semi-empirical free energy functionals for critical inhomogeneous fluids and Ising-like systems. They have been developed by Fisher and Upton Fisher-et:1990 in order to extend the original de Gennes-Fisher critical-point ansatz Fisher-et:1978 ; Fisher-et:1980 . Upon construction, these functionals fulfill the necessary analytic properties as a function of and a proper scaling behavior for arbitrary . The only input needed is the bulk Helmholtz free energy and the values of the critical exponents. (However, the available functional is valid only for symmetry breaking boundary conditions.) The predictions of this functional for films with boundary conditions are in very good agreement with previous results obtained -expansion and conformal invariance for the scaling function of the order parameter and for the critical Casimir amplitudes Borjan-et:1998 . Also the predictions for the full scaling functions of the CCFs at Borjan-et:2008 are in good agreement with results from Monte Carlo simulations. These predictions have been obtained from a linear parametric model, which in the neighborhood of a critical point provides a simple scaled representation of the Helmholtz free energy in terms of “polar” coordinates centered at the critical point , where is a measure of the distance from the critical point, and which assumes a linear relationship between the OP and . A similar local-functional approach proposed by Okamoto and Onuki Okamoto-et:2012 uses a form of the bulk Helmholtz free energy which differs from the one employed in Ref. Borjan-et:2008 , in that it is a field-theoretic expression for the free energy with (in the sense of renormalization group theory) renormalized coefficients. Such a version does not seem to produce more accurate results for the Casimir amplitudes Okamoto-et:2012 . Within this renormalized local-functional approach, the CCFs between two spherical particles immersed in a near-critical binary mixture (consisting of and particles) has been calculated as a function of both scaling fields, and Okamoto-et:2013 . The focus of the study is the situation that the -rich phase forms on the colloid surfaces in thermal equilibrium with the subcritical -rich bulk solvent ( and ). This gives rise to a bridging transition between two spherical particles and the resulting effective forces are of different nature than the CCFs. We note that the validity of the extended de Gennes-Fisher or renormalized local-functional approach in the presence of bulk ordering fields has not yet been tested, not even for the simple film geometry.
II.2.3 Computer simulations
In cases in which one cannot obtain analytical results, Monte Carlo simulations offer a highly welcome tool in order to overcome the shortcomings of approximate theoretical approaches and to study CCPs within the whole temperature range and also in the presence of the bulk ordering field . In the case that the solvent is a simple fluid and in the spirit of the universality concept of critical phenomena, one can study the simplest representative of the corresponding universality class of the critical solvent, e.g., spin models such as the Ising lattice gas model. In the case of a lattice, the derivative in Eq. (9) is replaced by a finite difference associated with a single lattice spacing. This also requires to introduce a lattice version of a spherical particle. In general, Monte Carlo methods are not efficient to determine quantities, such as the free energy, which cannot be expressed in terms of ensemble averages. Nevertheless, free energy differences can be cast into such a form via, e.g., the so-called “coupling parameter approach” (see, e.g., Ref. Mon ). This approach can be applied for systems characterized by two distinct Hamiltonians and but the same configurational space. In such a case, one can introduce the crossover Hamiltonian , which interpolates between and as the crossover parameter increases from 0 to 1. The difference between the free energies of two systems characterized by these different Hamiltonians can be conveniently expressed as an integral with respect to over canonical ensemble averages of (with the averages taken by using the corresponding crossover Hamiltonian for a given value of the coupling parameter). Alternatively, the free energy difference can be determined by integrating the corresponding difference of internal energies over the inverse temperature. The drawback of both methods is that they usually require knowledge of the corresponding bulk free energy density (as in the case of CCFs for a slab geometry). The accurate computation of the bulk free energy density poses a numerical challenge by itself and extracting it from finite-size data requires a very accurate analysis. Moreover, the internal energy differences, when determined by using standard MC algorithms, are affected by huge variances, especially for non-planar geometries such as the sphere - planar wall or the sphere - sphere geometry. In such geometries, the differences between local energies of the two systems with different (by one lattice spacing) sphere - wall or sphere - sphere distances are large only close to the sphere or the wall. This implies that the variance is dominated by the remaining part of the system, for which the local energy difference is very small. Recently a more sophisticated algorithm Hasenbusch and new approaches Hobrecht_Hucht:14 have been developed in order to overcome these problems. The numerical method proposed in Ref. Hobrecht_Hucht:14 is analogous to the experimental one used by Hertlein et al. Hertlein-et:2008 according to which the CCP is inferred directly from the Boltzmann distribution function of the positions of the two interacting objects. (In this experiment a sphere performs Brownian motion near a planar substrate.) So far, the improved algorithm of Ref. Hasenbusch and the dynamic method of Ref. Hobrecht_Hucht:14 have been applied only to the slab geometry and to the geometry of a single sphere (or disc) near a planar wall. The only available simulation data for two quasi-spheres in the Ising model have been obtained by using a method based on the integration of the local magnetization over the applied local magnetic field Vasilyev:2014 . In that study, the CCP has been calculated at fixed distances between the two spheres as a function of the temperature scaling variable (related to ) for a few values of , or as a function of the bulk field scaling variable (related to ) for several temperatures. Results of this calculation have been obtained only for small separations , where (in units of the lattice spacing ) is the radius of the particle, because the strength of the potential decreases rapidly upon increasing . The accuracy of these data deteriorates at low temperatures.
Alternative ways of computing the sphere - sphere CCP via MC simulations have been used for two-dimensional lattice models. One of them Machta-et:2012 uses Bennet’s method Bennet:76 , according to which one can efficiently estimate the free energy difference between two canonical ensembles, characterized by two different energies and with the same configuration space, provided that these two ensembles exhibit a significant overlap of common configurations. This method has been employed for the Ising model, with frozen spins forming two quasi-spheres with an effective radius ; in the reference ensemble (with energy ) the quasi-spheres are separated by a distance whereas in the second ensemble (with energy ), they are separated by a distance Machta-et:2012 . In order to estimate the corresponding free energy difference, within this approach one considers a trial move which keeps the configuration space the same but switches the energy from to , e.g., by mimicking the move of one of the particles from a distance to a distance by suitably changing and exchanging spins. The estimate of the free energy difference is given by , where the canonical ensemble average is taken with respect to the “reference” ensemble with the energy . Integrating this free energy difference up to infinity, one obtains the CCP. Reference Machta-et:2012 provides the results for the CCP as a function of distance for four values of the temperature in the disordered phase of the solvent, i.e., and . At the critical temperature, these MC simulation results agree well with the analytical ones obtained from conformal field theory. Still another route towards determining the CCP from MC simulations has been followed in Refs. bob-et:2014 ; Tasios-et:2016 for two quasi-discs immersed in a lattice model of a binary liquid mixture Rabani-et:2003 . Here, the pair potential has been obtained from the numerically determined probability of finding one colloid at position provided that another one is fixed at the origin: . In order to determine accurately at fixed values of and , the so-called Transition Matrix Monte Carlo technique Errington:2003 has been employed. This technique relies on monitoring the attempted transitions between macrostates, as defined, for example, by specific positions of the two quasi-discs, and on using this knowledge in order to infer their relative probability , where and are two distinct states of the system; once sufficient transition data are collected, the entire probability distribution can be constructed. The studies in Refs. bob-et:2014 ; Tasios-et:2016 have been focused on the case that the b-rich phase adsorbs on the colloid surfaces in thermal equilibrium with a supercritical a-rich bulk solvent ( and ). It has been found that data for obtained for and collapse on a common master curve if multiplied by and plotted as a function of , i.e., . The scaling exponent 1/2 for the prefactor agrees with the prediction in Eq. (II.2) for , which is obtained based on the conformal invariance in the Derjaguin limit , and which implies .
The standard algorithms used for the MC simulation studies described above are based on trial moves generating a trial configuration, which are local (Metropolis-type flips of spins) and hence become very slow near the critical point. This critical slowing down effect can be weakened by using so-called cluster algorithms such as the Swendsen and Wang Swendsen-et:1987 or the Wolff algorithm Wolff:1989 in which instead of a single spin a whole cluster of spins is flipped simultaneously. The Wolff algorithm constructs clusters which consist of spins that are aligned and connected by bonds. The proof that the Wolff algorithm obeys detailed balance, and hence generates the Boltzmann distribution, hinges on the spin inversion symmetry of the Hamiltonian. (The Wolff algorithm can be generalized to systems which contain bulk or surface fields Binder_Landau .) One can exploit also other symmetries in order to to develop a cluster method, for example, by using geometric operations on the spin positions such as, e.g., point reflection or rotation with respect to a randomly chosen “pivot”. Hobrecht and Hucht Hobrecht-et:2015 have extended the geometric cluster algorithm (GCA), introduced by Heringa and Blöte for bulk Ising models in the absence of external fields Heringa-et:98 , to the case of Ising systems containing areas of spins with a fixed orientation, facilitated by infinitely strong bonds, which mimic a colloidal suspension. The GCA makes use of the invariance of the Hamiltonian with respect to a point inflection in order to construct two symmetric clusters of spins which are then exchanged. Contrary to the Wolff cluster algorithm, the GCA conserves the order parameter. The modification due to Hobrecht and Hucht consists of including into the clusters not only spins but also the bond configuration between them. This way, the particles —encoded into the bond configuration —can be moved and the configuration of a solvent represented by the Ising spins can be updated within one cluster step. In the cluster exchange the neighboring lattice sites and as well as the connecting bond are mapped via point reflection with respect to a pivot onto the sites and and the bond , respectively. Using this apparently very efficient MC cluster algorithm, the authors of Ref. Hobrecht-et:2015 have studied two-dimensional systems with a fixed number of identical, disclike particles defined as regions of fixed positive spins, which thus effectively impose symmetry-breaking (+) BCs onto the surrounding free spins. Within this scheme, they have calculated the two- and three-body CCP at the bulk critical point of the Ising model. The authors report strong finite-size effects: for periodic simulation boxes with a fluctuating total magnetization, the presence of a nonzero number density of colloidal particles with a non-neutral surface preference for up and down spins shifts the system away from the critical point. As a result, their MC results for the CCP do not exhibit the form expected to hold at the critical point for a single pair of particles in solution (Eqs. (II.2) and (II.2). In order to suppress this effect, the authors of Ref. Hobrecht-et:2015 have proposed to use a fixed total magnetization or to insert in addition the same number of particles but with the opposite surface preference.
II.2.4 Derjaguin approximation
Within the so-called Derjaguin approximation curved, smooth surfaces are approximated by surfaces which are a steplike sequence of parallel planar pieces Derjaguin:1934 . Between two vis-à-vis, flat pieces of the opposing surfaces partitioned this way, locally a force acts like in the slab geometry and the total force is taken to be the sum of the forces between each individual pair with the appropriate areal weight. The Derjaguin approximation is widely used to estimate CCFs forces between colloidal particles, because the forces between parallel surfaces are much easier to calculate. Indeed, for the slab geometry the CCFs are known even beyond mean field theory (see below). Therefore, by using this approximation one can account even for non-Gaussian critical fluctuations, albeit at the expense of not fully considering the shape of the particles. The Derjaguin approximation is valid for temperatures which correspond to , because under this condition the CCFs between the colloids act only at surface-to-surface distances which are small compared with . In many cases this approximation is surprisingly reliable even for Gambassi-et:2009 ; Troendle-et:2009-10 . In the absence of a bulk ordering field, i.e., for and strongly adsorbing confining surfaces the results for the critical Casimir interactions in the film geometry have been provided by field-theoretical studies Krech:1997 , the extended de Gennes - Fisher local functional method Borjan-et:2008 ; Okamoto-et:2012 ; Mohry-et:2014 , and Monte Carlo simulations of the Ising model Vasilyev-et:2007 ; Vasilyev-et:2009 ; Hasenbusch:2012 or improved models which offer the benefit that the amplitude of the leading bulk correction to scaling vanishes Hasenbusch:2012 ; Hasenbusch:2010 ; Francesco-et:2013 ; Hasenbusch:2015 . Within MC simulations also the case of weakly adsorbing surfaces has been considered Vasilyev-et:2011 ; Hasenbusch:2011 . In this latter case the corresponding surface field might be so small that upon approaching the critical point one effectively observes a crossover of the type of boundary condition imposed on the order parameter from symmetry preserving to symmetry breaking boundary conditions. In this case there appears to be no effective enhancement of the order parameter upon approaching the confining wall. The CCP reflects such crossover behaviors; depending on the film thickness, the CCP can even change sign Vasilyev-et:2011 ; Hasenbusch:2011 ; Mohry-et:2010 . On the basis of scaling arguments one expects that for moderate adsorption preferences the scaling function of the CCP in film geometry additionally depends on the dimensionless scaling variables , where and are the effective surface fields at the two confining surfaces, and are nonuniversal amplitudes, Hasenbusch:2011 is the surface crossover exponent at the so-called ordinary surface phase transition.
The knowledge of the dependence of CCPs on the bulk ordering field is rather limited, although it is crucial for understanding the aggregation of colloids near the bulk critical point of their solvent. The presently available MC simulations for Ising films provide such results only along the critical isotherm Vasilyev-et:2013 . In Refs. Schlesener-et:2003 ; Mohry-et:2012a ; Mohry-et:2012b ; Mohry-et:2014 the variation of CCFs with has been approximated by adopting the functional form obtained within mean field theory (MFT, ) by using a field-theoretical approach within the framework of the Landau - Ginzburg theory, but by keeping the actual critical exponents in for the scaling variables. Within this “dimensional” approximation, the scaling function of the CCF for the film geometry with macroscopically large surface area of one wall (see the text below Eq. (10)) is taken to be , where has been adopted from MC simulation data Vasilyev-et:2007 ; Vasilyev-et:2009 . (The normalization by eliminates a nonuniversal prefactor carried by the Landau - Ginzburg expression for the scaling function of CCFs.) In Ref. Mohry-et:2014 the scaling functions resulting from the “dimensional” approximation have been compared with those obtained within the extended de Gennes - Fisher local functional. This allows us to compare in Fig. 1 (unpublished) results for the scaling function of the sphere - sphere CCP (see Eq. (4)) within the Derjaguin approximation, i.e., Mohry-et:2014 , where is obtained by using these two aforementioned approaches. Only for weak bulk fields the curves in Fig. 1 for both approaches compare well. Otherwise there are clear quantitative discrepancies, the origin of which is not clear. The “dimensional” approximation might deteriorate upon increasing . On the other hand, as already mentioned in passing, the reliability of the local functional approach for has not yet been tested systematically. For example, the result of the local functional approach for the scaling function of the CCFs along the critical isotherm differs substantially from the one obtained from MC simulations Mohry-et:2014 . In Refs. Buzzaccaro-et:2010 ; Piazza-et:2011 results of a long wavelength analysis of density functional theory for the scaling function of CCF have been reported (see also Sec. II.2.5 below ); they are in qualitative agreement with the results obtained using the extended de Gennes - Fisher local functional Mohry-et:2014 . The first microscopic off-lattice results for the scaling function of CCF, both along the critical isochore and in the off-critical regime, have been worked out in Ref. Anzini-et:2016 . The authors of Ref. Anzini-et:2016 have studied a hard core Yukawa model of a fluid by using density functional theory (DFT) within a specific weighted density approximation Leidl-et:1993 , coupled with hierarchical reference theory Parola-et:1995 . This kind of DFT weighted density approximation, related to the one proposed early on by Tarazona and, independently, by Curtin and Ashcroft Tarazona:1985 ; Curtin-et:1985 , captures the short-ranged correlations of the underlying hard sphere fluid rather accurately, whereas the hierarchical reference theory is able to account also for the critical properties of a homogeneous fluid. In Ref. Anzini-et:2016 , this technique has been applied in order to determine the effective interaction between two hard walls immersed in that fluid. This approach facilitates to investigate the crossover between depletion-like roots of such effective forces at high temperatures and the critical Casimir effect upon approaching the critical point of the fluid. It appears that for hard core Yukawa fluids the universal features of CCF emerge only in close neighborhood of the critical point. The predictions obtained in Ref. Anzini-et:2016 for the scaling function of the CCF for various temperatures along the critical isochore () differ significantly from the Ising model MC simulation results in Ref. Vasilyev-et:2009 . Moreover, the data along various isotherms do not collapse as expected from scaling theory. The authors of Ref. Anzini-et:2016 interpret these deviations as an indication of strong corrections to scaling occurring in the hard core Yukawa fluid.
As far as experimental data for the film geometry are concerned, they are available only indirectly from measurements of the thickness of wetting films; they correspond to opposing boundary conditions Fukuto-et:2005 ; Rafai-et:2007 . The scaling function of the CCF determined by Fukuto et al. Fukuto-et:2005 compare well with the theoretical predictions. The measurements performed by Rafai et al. Rafai-et:2007 have provided data which show stronger deviations from the theoretical curves, in particular around the maximum of the CCF. The scaling function of CCFs for wetting films corresponding to boundary conditions could not be determined due to the collapse of the incomplete wetting film in the course of the measurements Rafai-et:2007 . Based on exact results in Evans_Stecki ; Abraham_Maciolek:2010 ; Abraham_Maciolek:2013 and in Krech:1997 , and based on the predictions from the local-functional approach in Borjan-et:2008 , it is expected that the CCF between two planar walls with symmetry-breaking boundary conditions at separation varies as for and , i.e., in the one-phase region of the solvent. This implies that the asymptotic behavior of the scaling function is given by , where is a universal number valid for boundary conditions Gambassi-et:2009 . By applying the Derjaguin approximation to this functional form of the CCFs, one obtains the following asymptotic behavior of the scaling function for the sphere - sphere CCP :
| (15) |
so that in this limit (Eq. (4)).
II.2.5 Pair potential in the presence of depletants
In order to calculate the effective pair potential between two large hard spheres immersed into a fluid of depletants close to their gas-liquid critical point, the authors of Refs. Buzzaccaro-et:2010 ; Piazza-et:2011 have used density functional theory (DFT), which is a powerful tool for describing equilibrium properties of colloidal suspensions (see the last two paragraphs in Sec. II.1). The hard spheres have been analyzed within the Derjaguin approximation, which is inherent in recent approaches to depletion forces acting in hard-sphere mixtures. In this context, the Derjaguin approximation relates the force between the two big objects to the integral of the solvation force of the small particles (i.e., the depletant agents) confined between two parallel planar walls with cross-sectional area . (The film solvation force per surface area , , is an excess pressure over the bulk value of the confined fluid described by the grand potential .) In the limiting case of hard walls exposed to an ideal gas of depletants, this relation reproduces the well known Asakura-Oosawa result for depletion forces Asakura-et:1954 . This scheme can be fruitfully applied also to interacting systems. In fact such a relation is equivalent to the general formula obtained by Derjaguin Derjaguin:1934 relating the force between two convex bodies to the free energy, in excess of its bulk value, of a fluid confined between planar walls. Within an actual DFT approach this formula holds even for approximations of the excess part of an intrinsic Helmholtz free energy functional of a fluid. The authors of Refs. Buzzaccaro-et:2010 ; Piazza-et:2011 have employed the square gradient local density approximation for the intrinsic Helmholtz free energy functional entering into DFT, which is valid for spatially slowly varying depletant number densities such that . They have simplified the Derjaguin approximation by replacing the two big spheres by two planar parallel walls. Within the square gradient local density approximation, the effective (solvation) force per area between two parallel walls is expressed solely in terms of the bulk free energy density of the depletant host fluid and in terms of the value of the equilibrium number density profile of such a fluid at the midpoint between the two walls. The solution of the extremum condition for the free energy functional provides the second equation relating, albeit in an implicit way, and to the density at the wall , which in turn depends on the wall-fluid interactions. In order to incorporate the non-Gaussian behavior near the gas-liquid critical point of the depletant, in the spirit of the Fisk - Widom or local-functional approach Fisk:1969 ; Fisher-et:1990 ; Okamoto-et:2012 , the authors of Refs. Buzzaccaro-et:2010 ; Piazza-et:2011 have used the scaling form for the singular part of the bulk free energy density of the fluid with the scaling variable , where is the bulk order parameter OP, and are non-universal, dimensional constants, and and are bulk critical exponents Pelissetto-et:2002 . In the scaling limit, the general expression for the effective force between two parallel walls can be expressed in terms of , the rescaled midpoint OP , and the universal amplitude ratio Pelissetto-et:2002 . This expression takes the scaling form characteristic of CCFs. By using a parametric expression for Pelissetto-et:2002 and the critical exponents of Ising universality class, the authors have obtained very good agreement between their analytic theory and the scaling function of CCFs obtained from MC simulations Vasilyev-et:2009 at . This is not surprising because, within the square gradient local-density approximation, DFT reduces to the local-functional approach which proved to capture correctly critical fluctuations Fisher-et:1990 ; Borjan-et:1998 ; Borjan-et:2008 , at least for .
This theoretical approach has been followed up by MC simulation studies Gnan-et:2012a aiming at the computation of the CCP between two hard-sphere colloids suspended in an implicit solvent in the presence of interacting depletant particles. In this off-lattice MC simulations of fluctuation induced forces, the effective potential between two hard spheres has been determined upon approaching the gas-liquid critical point of the depletant for two different depletant models, one for SW and one for 3P particles (see Eq. (8) and thereafter). Given the computational limitations, the authors have considered the size ratio between the hard-sphere depletant and the hard-sphere colloid within the range . The resulting effective colloid-colloid force has been evaluated by using canonical Monte Carlo simulations for various fixed values of the depletant concentration in the reservoir. The method consists of performing virtual displacements of each colloid from its fixed position and of computing the probability of encountering at least one collision with a depletant particle. The effective colloid-colloid potential follows from integrating the corresponding force. These MC results show that upon cooling the effective potential between two colloidal particles gradually looses its high-temperature, pure hard-sphere depletion character of exhibiting oscillations and transforms into a completely attractive potential with a progressive and significant increase of its range, signaling the onset of critical Casimir forces. For large distances between the surfaces of the two colloids, the MC data for the CCP fit well to the asymptotic form given by Eq. (15). This numerical study has been extended to the case in which colloids interact with SW depletant particles; this interaction has been continuously modified from hard-core repulsion to strong attraction, thus changing from boundary conditions (i.e., preference for the gas phase) to boundary conditions (i.e., preference for the liquid phase) Gnan-et:2012c . For strong colloid-depletant attraction, the effective colloid-colloid potential exhibits oscillations, as they occur for the high-temperature depletion potential, modulating its exponentially decaying attractive tail. The variation of the colloid-colloid effective potential upon crossing over from to and from to boundary conditions has been determined, too. In the asymptotic spatial range these two crossovers are the same. However, in the numerical study of Ref. Gnan-et:2012c only the behavior at short distances has been probed, where the effective potential is dominated by non-universal aspects of the solvent-colloid interaction so that the aforementioned pairs of boundary conditions are no longer equivalent.
II.2.6 Main properties of CCFs
We close this section by listing the main properties of critical Casimir interactions between two colloidal particles in very dilute suspensions. The results for spheres in , obtained from the variety of methods described above, tell that they share the same qualitative features of the CCFs with “spheres” in and as well as with planar walls. This refers to the property that for like boundary conditions CCFs are attractive and it refers to the position of a force maximum along various thermodynamic paths. Around the consolute point of a binary solvent the main features of the CCFs between two planar walls are summarized in Fig. 2 in terms of the force scaling function obtained from Landau theory (see Fig. 1 in Ref. Mohry-et:2014 ). The main message conveyed by Fig. 2 is the asymmetry of the CCFs around the critical point of the solvent with the maximum strength occurring at . This asymmetry is due to the presence of surface fields, which in films lead to capillary condensation Evans:1990 , whereas between spherical colloids to bridging Bauer-et:2000 ; Archer-et:2005 ; Okamoto-et:2013 . Near these phase transitions, the effective force acting between the confining surfaces is attractive, exhibits (within Landau theory) a cusp, and is very strong: the depth of the corresponding CCPs can reach a few hundred . The concomitant strong increase of the absolute value of the force is reflected by its corresponding universal scaling function and extends to the thermodynamic region above the capillary condensation or bridging critical point, even to temperatures .
II.3 Stability
Knowing the effective pair potential for the colloids one can investigate the stability of colloidal suspensions and the aggregation of colloids. These phenomena are related to kinetic processes (see Ref. Russel-et:1989 and references therein), which are based on the diffusion of single particles in the presence of other particles of the same kind, interacting with them via interaction potentials which contain both attractive and repulsive contributions. Aggregation occurs if the attractive interactions of the particles dominate over their thermal kinetic energy, which is responsible for the Brownian motion of the particles. Hydrodynamic interactions may also play a role, e.g., by slowing down the aggregation process for solvents with high viscosity.
In order to quantify the behavior of interacting particles, which irreversibly stick together once their surfaces touch each other, Fuchs has introduced the concept of a stability ratio Fuchs:1934 . It is defined as the ratio between the Brownian motion induced pair formation rate in the absence of other than excluded volume interactions between the particles, and the corresponding formation rate of particle pairs in the presence of such interactions. can be calculated by extending Smoluchowski’s diffusion equation for the radially symmetric relative motion of two coagulating spherical particles of radius in order to account for their interaction potential Fuchs:1934 :
| (16) |
The analysis, which leads to this expression, is valid only in the early stages of coagulation before triplets etc. are formed. However, it neither deals with the very beginning of the coagulation process but considers only the steady-state situation, which is established quickly. In the analysis based on Smoluchowski’s equation hydrodynamic interactions are neglected. From the definition of it follows that for hard spheres , while for () the repulsive (attractive) part of the pair potential dominates. In the case of a potential barrier, i.e., if for a certain range of distances , which leads to , one can expect that on intermediate time scales the suspension will be in a (meta)stable homogeneous state. The cluster formation will set in only on a very large time scale. This time scale is proportional to the ratio between the characteristic times for diffusion of a single particle, , and for the formation of a pair of particles, Russel-et:1989 :
| (17) |
with the packing fraction where is the number density of the colloidal particles. For a near-critical solvent, the pair potential can be taken as (see Eqs. (2) and (4); )
| (18) |
For the mixed phase of the solvent the ratio has been calculated in Ref. Mohry-et:2012b . The results of this calculation show that the CCF can lead to a rapid coagulation, setting in within a narrow temperature interval, and that the extent of the coagulation region reflects the fact that the CCFs are stronger for compositions of the solvent slightly poor in the component preferred by the colloids. The effective pair potential given by Eq. (18) is applicable only for sufficiently large distances , because it takes into account only the electrostatic repulsive interactions and neglects possible short-ranged contributions to the effective van-der-Waals interactions. Furthermore, the CCP attains its universal form as given by the scaling function only in the scaling limit, i.e., for distances which are sufficiently large compared with the correlation length amplitude . Analogously, also and must be sufficiently large compared with microscopic scales. From the behavior of the scaling function (discussed in Ref. Mohry-et:2012b within the Derjaguin approximation) it follows that along the typical thermodynamic paths realized experimentally, the range of attraction due to the CCFs grows steadily upon increasing the bulk correlation length , but the amplitude of the CCFs is a nonmonotonic function of with its maximal strength attained for an intermediate value of . Depending on the values of in Eq. (18) and of , the CCFs compensate the repulsion for all values of or only within certain ranges of , i.e., a secondary attractive minimum of can occur at a certain distance (in addition to the primary, global minimum at ) while for small distances and for the potential maintains a repulsive part. The presence of the repulsive barrier and of the attractive secondary minimum in the effective potential, and thus the occurrence of coagulation, depends on temperature. But also in the case, in which for all values of a repulsive barrier remains, coagulation can appear, due to a deep secondary minimum. The nonmonotonic dependence of the maximal strength of the CCF on temperature results in a nonmonotonic behavior of the ratio , which is shown in Figs. 2 and 3 of Ref. Mohry-et:2012b .
In Ref. Mohry-et:2012b , the analysis of the stability ratio for the diversity of possible shapes of the effective pair potential given in Eq. (18) has been complemented by the analysis of the bulk structure of colloidal suspension. To this end the radial distribution function has been calculated within the integral equation approach by using the hypernetted-chain and the Percus-Yevick closure Hansen-et:1976 . The results for both types of closure are almost the same. (The applicability and reliability of this integral equation approach is discussed in detail in Ref. Caccamo:1996 .) For temperatures far away from the critical temperature of the solvent, the colloids behave effectively as hard spheres with an effective diameter due to the soft repulsive background contribution . Accordingly, for such values of , has the corresponding characteristics of a fluid of hard spheres, such as the rather broad first peak for small values of . Due to the emerging attractive CCFs, for increasing the radial distribution function is enhanced close to the surfaces of the colloids. This implies an enhanced short-ranged order and that the formation of colloidal dimers is favored. The way in which the shape of the radial distribution function changes upon increasing the temperature reveals whether the effective potential exhibits a repulsive barrier at small values of and is attractive throughout large distances or whether an attractive minimum develops at intermediate values of upon increasing temperature while repulsion remains at small and large values of .
One can address the issue whether a relationship can be established between the onset of aggregation and the behavior of a certain quantity, which is accessible both theoretically and experimentally, such as the second virial coefficient . For dilute suspensions, the second virial coefficient Hansen-et:1976 provides information about the strength of the radially symmetric attraction between spherical particles:
| (19) |
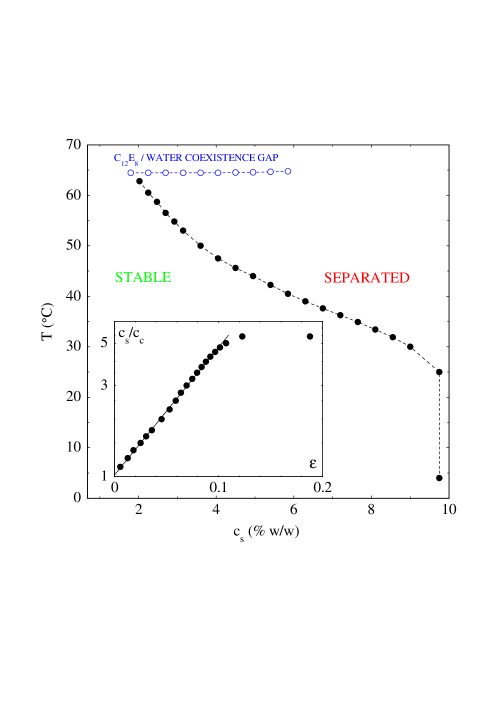
Beyond the ideal gas contribution it determines the leading non-trivial term in the expansion of the pressure in terms of powers of the number density . In Ref. Mohry-et:2012b has been calculated for the potential given by Eq. (18) at the state points for which, according to the experiments reported in Ref. gallagher:92 , aggregation sets in. It turns out that at these states of aggregation onset the values of are close to each other and that to a certain extent those -isolines, which emerge by belonging to these experimental data points, agree with each other and with the possible shape of the aggregation onset line (see Fig. 3). However, based on this analysis one cannot state definitely that can serve as a quantitative indicator for the onset of aggregation. Further efforts, both theoretically and experimentally, are needed to provide more precise values of the relevant quantities.
II.4 Phase behavior
In suspensions with sufficiently large packing fractions of colloids, the attraction among them due to CCFs can induce a so-called “liquid-gas” phase separation of the colloids, i.e., the separation of two phases which differ with respect to their colloidal number density. Adopting the effective one-component approach allows one to use standard liquid state theory in order to determine the onset of phase separation. Within this effective approach feedback mechanisms of the colloids, acting on the solvent and changing its critical behavior, are neglected. Therefore this approximation does not allow one to describe reliably all details of the full many-component system. However, one can identify certain regions of the thermodynamic phase space for which this approach is applicable. One expects the effective one-component model to work well for temperatures corresponding to the one-phase region of the pure solvent and for an intermediate range of values of the colloid number density . The latter should be large enough so that the competition between the configurational entropy and the potential energy due to the effective forces can induce a phase separation, but small enough so that the approximation of using an effective pair potential between the colloids is valid and the influence of the colloids on the phase behavior of the solvent is secondary.
In Ref. Mohry-et:2012a , for particles interacting via the effective pair potential given in Eq. (18), the phase coexistence curve with the critical point temperature and the spinodal (i.e., the loci where, within mean-field theory, the isothermal compressibility diverges) have been calculated using density functional theory within the so called random phase approximation Evans:1979 and the integral equation approach Hansen-et:1976 . The results obtained from these two approaches, which are presented in Fig. 4 (Fig. 2 in Ref. Mohry-et:2012a ), differ only slightly. The loci of the phase separation depends sensitively on the strength of the repulsive part of the effective pair potential (Eq. (3)) and the solvent compositions. For solvent compositions, which are somewhat poor in the component preferred by the colloids, even short correlation lengths suffice to bring about phase separation. The critical value of the colloidal packing fraction (in terms of number density ) is rather small, i.e., , because the effective hard sphere diameter , which results from the soft repulsion , is larger than . Furthermore, the binodals shown in Fig. 4 are rather flat compared with, e.g., the ones for hard spheres interacting via a short-ranged, attractive, and temperature independent potential. In the present system, the deviation of from the critical temperature which corresponds to a range of for the coexisting phases as large as the one shown in Fig. 4, is about ‰, whereas for a system of hard spheres with an additional attractive interaction the corresponding temperature deviation is a few percent. The critical temperature obtained within DFT agrees with the simple prediction , acting as an implicit equation for , as suggested by Vliegenthart and Lekkerkerker Vliegenthart-et:2000 and Noro and Frenkel Noro-et:2000 (VLNF), where is the reduced second virial coefficient and is the critical value of for Baxter’s model of adhesive hard spheres Baxter:1968 . is the second virial coefficient of a suitable reference system of hard spheres (HS) with diameter . The effective hard-sphere diameter can be taken as , with . One can adopt also other definitions of (for a discussion see Ref. Andersen-et:1971 ). According to VLNF, is a useful indicator of the occurrence of a phase separation into a colloidal-rich (“liquid”) and a colloidal-poor (“gas”) phase. An extended law of corresponding states proposed by VLNF predicts that the value of the reduced second virial coefficient at the critical point is the same for all systems composed of particles with short-ranged attractive interactions, regardless of the details of these interactions. This (approximate) empirical rule is supported by experimental data Vliegenthart-et:2000 and theoretical results thN .
III Multicomponent mixture
III.1 General discussion
For the kind of systems considered here, the determination of phase equilibria is rather subtle because — due to the concomitant adsorption phenomena, which are state dependent — the effective potential between the colloids depends on the thermodynamic state itself. Experiments have revealed gallagher:92 ; grull:97 that for suspensions very dilute in colloids and with a phase separated solvent, basically all colloidal particles are populating the phase rich in the component, say , preferred by the colloids (this phase has concentration ). This implies that in coexisting distinct phases the effective potential acting between the particles is different. This is not captured by the effective potential approach discussed above. Besides the colloid-solvent also the solvent-solvent interactions can influence the effective potential and, accordingly, the phase behavior of the effective colloidal system. This has been demonstrated by recent MC studies in which various kinds of model solvents have been used Gnan-et:2012a . On the other hand, the presence of colloidal particles may alter the phase behavior of the solvent. In the case of molecular fluids, it is well established that the phase diagrams of ternary mixtures, as they emerge from those of binary mixtures by adding a third component, are distorted and become more complex relative to the underlying original binary ones Andon-et:1952 ; Prafulla-et:1992 . Similar distortions and complex features of phase diagrams are observed experimentally Kline-et:1994 ; Jayalakshmi-et:1997 ; Koehler-et:1997 upon adding colloidal particles to binary solvents. In particular, one finds a decrease of the lower critical temperature. These observations tell that for reliably determining such phase diagrams the full, many component mixture has to be considered. The importance of considering the colloidal suspension with a binary solvent as a truly ternary mixture has been already pointed out in Ref. Sluckin:1990 . Taking into account the features of the CCP one can try to predict the expected topology of the phase diagrams for ternary solvent-solvent-colloid mixtures Mohry-et:2012a . Upon adding colloids, the two-phase region of the demixed phases of the pure solvent extends into the three-dimensional thermodynamic space of the actual colloidal suspension. At fixed pressure this space is spanned by , the concentration of the component of the binary solvent, and, e.g., by the colloidal number density . The actual shape of the two-phase region forming a tube-like manifold is expected to depend sensitively on all interactions present in the ternary mixture (see Fig. 5). The foremost difficulty in describing such mixtures theoretically or in dealing with them via computer simulations consists of the fact that the sizes of their constituents differ by, a few, orders of magnitude. This property distinguishes them significantly from mixtures of hard spheres, needles, and polymers Schmidt-et:2002 ; Schmidt:2011 , for which the constituents are of comparable size, i.e., none of them is larger by a factor of ten or more than the others. In contrast to molecular ternary mixtures as modeled, e.g., in terms of a lattice gas terMixTheory , in colloidal suspensions the colloidal particles influence the other two components not only by direct interactions but also via strong entropic effects. These occur because their surfaces act as confinements to fluctuations of the concentration of the solvent and they also generate a sizeable excluded volume for the solvent particles.
III.2 Monte Carlo studies
MC simulations for a lattice model of ternary mixtures, suitably mimicking colloidal particles suspended in a near-critical binary solvent, offer the advantage over other available approaches that they account for both fluctuations and nonadditivity of the emerging CCFs. Due to the large size difference between the colloid and solvent particles and due to the critical slowing down of the ternary mixture upon approaching its critical point, studying the corresponding three-dimensional systems by MC simulations is computationally challenging. As a computationally cheaper substitute, two-dimensional lattice models have been treated by this method in Refs. bob-et:2014 ; Tasios-et:2016 ; Hobrecht-et:2015 . In a first of such a MC simulation study bob-et:2014 , the colloids have been modeled as discretized hard discs of radius (in units of the lattice spacing) occupying a fraction of sites on the square lattice. The remaining lattice sites have been taken to be occupied by a solvent molecule of either species or with no empty sites left. A similar model of solvent-solvent-colloid mixtures has been considered earlier by Rabani et al. Rabani-et:2003 in order to study drying-mediated self-assembly of nanoparticles. In Refs. bob-et:2014 ; Tasios-et:2016 , only the nearest neighbor repulsive interactions between the components of a binary solvent have been considered. This drives phase segregation, which in the absence of colloids has a critical point belonging to the Ising universality class. In order to mimic the preference of the colloids for component of the binary solvent, a nearest-neighbor attractive interaction between the colloid and component has been taken into account. It has been assumed that there is only a nearest-neighbor repulsion between the colloid and component . In the limit of the chemical potential difference between the components and , the ternary mixture reduces to a binary mixture of hard-discs and solvent component , which exhibits coexistence between a fluid and a solid phase. In the study by Edison et al. bob-et:2014 , the preclusion of solvent-mediated colloidal aggregation, arising from complete wetting and capillary condensation, has been implemented by focusing on colloids, which are immersed in a supercritical mixed phase of components and , such that -rich critical adsorption layers (for critical adsorption profiles at spheres and cylinders see Refs. Hanke-et:1999 ; Yubanaka-et:2017 and references therein) form on the colloid surfaces in equilibrium with a supercritical -rich solvent in the bulk. The careful simulation study in Ref. Tasios-et:2016 , in which the solvent has been treated grand canonically at constant pressure, has revealed the existence of gas-liquid and fluid-solid transitions, occurring in a region of the thermodynamic variables of ternary mixtures which extends well away from the critical point of the solvent reservoir (especially concerning the fluid-solid transitions). It has been found that in all phases the local solvent composition is strongly correlated with the local colloid density. The coexisting colloidal liquid and solid phases are poor in component , whereas in the gas phases coexisting with the liquid or the solid phases the solvent composition is very close to the composition of the solvent reservoir, which, however, is far from its critical composition. These features agree with experimental observations gallagher:92 ; grull:97 and cannot be captured by an effective one-component approach as discussed in the previous section. As expected Evans-et:1994 , all pair correlation functions decay exponentially on the scale of the same correlation length. Strikingly, the correlation length found in the homogeneous supercritical state of the ternary mixture was much larger than the colloid radius (), which in turn clearly exceeded the correlation length of the solvent reservoir. Upon adding a small volume fraction of colloids, the gas-liquid critical point of a ternary mixture shifts continuously from that of the colloid-free solvent to the negative values of , which decrease upon increasing . In addition, the MC simulation data indicate the existence of a second, lower metastable gas-liquid critical point located at larger values of . The gas-liquid-solid triple point is also expected to occur near the fluid-solid coexistence of pure hard discs shown as the vertical dashed lines in Fig. 6. The authors of Ref. Tasios-et:2016 have checked to which extent a description in terms of an effective pair potential can account for the phase behavior observed in their MC simulations. They have concluded that those approaches, which exclusively employ effective pair potentials, as obtained from, e.g., planar slit studies combined with the Derjaguin approximation, overestimate the extent of gas-liquid coexistence and underestimate how much the critical point of the ternary mixture is shifted relative to that of the solvent reservoir.
In Ref. Hobrecht-et:2015 , the two-dimensional Ising model, with embedded colloids represented as disclike clusters of spins with fixed orientation, has been treated by the geometric cluster algorithm (see Sec. II.2.3). However, the focus of this study has not been the phase behavior of a ternary mixture but rather the two- and three-body CCP. Employing the geometric cluster algorithm facilitated the study of the same lattice model as in Refs. bob-et:2014 ; Tasios-et:2016 but in Tasios-et:2017 . As anticipated in Refs. bob-et:2014 ; Tasios-et:2016 , the phase diagram displays the same qualitative features as in the two-dimensional case.
III.3 Mean field theory
The mean field approximation of the model considered in Ref. Tasios-et:2016 was studied in more detail in Ref. Edison-et:2015b . It is based on free-volume arguments, according to which the Helmholtz free energy is taken as the sum of three contributions, describing the direct interactions among the pure colloids, the pure binary mixture of solvent and solvent , and the colloid - solvent mixture. For the pure-colloid contribution the hard-disc free energy has been employed, with its distinct expressions for the fluid Santos-et:1995 and the solid Young-et:1979 phase. In the free space between the colloids, the mean field free energy for the mixture has been taken; the solvent is excluded from the volume of the colloids. Concerning the colloid - solvent contribution, the mean adsorption energy of component at the colloid surface has been taken. As can be inferred from Fig. 6, the topology of the resulting phase diagram and its temperature dependence agree qualitatively with the one obtained from simulations (see Fig. S2 in the Supplemental Material for Ref. Tasios-et:2016 and Fig. 1 in Ref. Edison-et:2015b ). In particular, a lower critical point has been found. However, as already expected on the basis of the different spatial dimensions, there is no quantitative agreement; the parameter values used in order to obtain phase diagrams, which are similar to those from simulations, were chosen empirically. It seems that in these studies the underlying mean field approximation severely underestimates the effect of the hard-core repulsion of the colloids. In addition to the colloidal gas and colloidal liquid, this theory predicts the occurrence of two crystal phases which have the same (hexagonal) structure but with different lattice spacings. In the 3d thermodynamic state space of a ternary mixture spanned by , , and one finds also upper and (metastable) lower colloidal gas-liquid critical lines and a colloidal solid-solid critical line. (The critical points in Fig. 6(a) lie in the planes cutting the full phase diagram at three constant temperatures.) The fluid-solid transition corresponds to a first-order freezing transition. The critical point of the colloid-free solvent (, , ) is shifted considerably upon adding a small amount of colloids (see the red dots in Fig. 6(a)). The authors of Ref. Edison-et:2015b have pointed out that experiments on colloidal aggregation are typically performed by suspending a fixed number of colloids in a solvent at a fixed (pure) solvent composition, which we denote by , and then by adjusting the temperature of the system to reversibly induce aggregation. They have identified the so-called aggregation line, i.e., the loci of the points at fixed and at which aggregation is observed first, as the line which demarcates the one-phase region of the ternary mixture, which lies at the outside of the line, and the region at its inside where colloidal phase separation can be found. Such a line (see Fig. 7) ends at an -dependent critical point of the ternary mixture, which is shifted from the critical point of the pure solvent towards a higher (-dependent) temperature. In the vicinity of their end points these lines are slightly bent, which indicates reentrant dissolution. Such lines qualitatively resemble the experimental results for strong aggregation reported by Beysens and Estève in Ref. Beysens-et:1985 (see the solid line in Fig. 3 therein). This tends to support the view on the aggregation lines as the line of onset of colloidal phase separation in the full ternary mixture. The above mean field calculation has been performed in bob-et:2014 and then extended to Edison-et:2015b but no new features of the phase behavior have been found. Although the uncertainties generated by the large differences of length scales prevent a quantitative comparison with the available experimental data, the studies reported in Refs. bob-et:2014 ; Edison-et:2015b are very valuable because they reveal the possible scenarios for the phase behavior, which can occur in such ternary mixture, highlighting the physical mechanisms behind it.
IV Experiments
IV.1 Phase transitions and aggregation in bulk
The view, that aggregation, as observed in pioneering experiments by Beysens and Estève Beysens-et:1985 , is in fact a reversible phase transition in a ternary suspension, has been tested via early experimental studies by Wegdam, Schall et al. Guo-et:2008 . In these studies, charge-stabilized polystyrene spheres of radius nm suspended in a mixture of 3-methylpyridine (3MP), water, and heavy water near its lower critical point have been considered. The mass fractions of the components of this latter mixture have been chosen such that the mass density of the solvent mixture closely matches that of the colloidal particles in the region of the parameter space where phase transitions have occurred. If the system is density-matched, the growth of the nucleated liquid or solid phases is not perturbed by gravity at a very early stage and can be followed until macroscopically large coexisting phases are formed. In order to characterize the phase behavior of the system the authors have used small angle -ray scattering (SAXS). Transition temperatures were also determined by measuring the sample turbidity. Moreover, the samples have been observed directly with a CCD camera. The only information, which has been provided by the authors about the phase diagram of the 3MP-water-heavy water mixture at the mass fractions actually used, is the coexistence temperature ℃ at which this (chemically in fact binary) solvent mixture demixes. The schematic phase diagram shown as Fig. 1(a) in Ref. Guo-et:2008 suggests that the considered mass fraction of 3-methylpyridine investigated in this study (and therein denoted as ) has been smaller than the critical one. Instead of , the authors of Ref. Guo-et:2008 have used the deviation as the actual control parameter. Upon increasing the temperature from a value in the one-phase region of the pure solvent towards , the onset of colloid aggregation, at which the system separates into a colloid-rich and a colloid-poor phase as indicated by regions of high and low turbidity and by the appearance of peaks in the structure factor, has been observed at a sharply defined temperature . Depending on the particle volume fraction of the colloids in the suspension (which is the ratio between the volume of all colloids in the suspension and the volume of the system), two or three phases of the colloidal suspension have been found: at low volume fractions this is a fluid phase in equilibrium with a fcc crystal, whereas at larger volume fractions there is a gas phase in equilibrium with a liquid phase and this liquid phase is coexisting with a fcc solid. Interestingly, upon increasing temperature quickly the measured structure factor indicated the formation of a glassy state as in a molecular system. On the basis of the experimental results reported in Ref. Guo-et:2008 , it is not possible to infer uniquely the physical origin of the attractive potential which gives rise to the observed reversible aggregation. The authors concluded that all mechanisms discussed in Sec. II can play a role. Concerning the role of CCFs in this experiment, one finds that the temperature of the onset of aggregation is ca. K (depending on the volume fraction of the colloids) below , which corresponds to , which seems to lie outside the critical region. However, in Ref. Guo-et:2008 the actual critical temperature of the solvent is not given; if is lower, it is possible that the corresponding values of the reduced temperature actually lie within the critical region. The bulk correlation length of the solvent at has been estimated from light scattering to be ca. 8 nm, which is somewhat short. However, the experiments were performed at an off-critical composition of 3MP such that along the corresponding thermodynamic path the phase is relatively poor in the solvent component preferred by the colloids. If , this composition precludes that colloidal aggregation arises from complete wetting and capillary condensation Evans:1990 . On the other hand, it is this thermodynamic region where the CCFs are expected to be strongest although their range, governed by bulk correlation length, is smaller than the one at the critical composition. Thus it is rather plausible that CCFs are playing a crucial role in this experiment.
In a subsequent study by Wegdam, Schall et al. Bonn-et:2009 , the aggregation of colloidal particles suspended in the same (quasi-) binary mixture of 3MP, water, and heavy water has been observed directly by using confocal microscopy. The fluorescent fluorinated latex colloids of radius nm used in this study exhibit affinity for water. In this experiment the refractive indices between the colloids and the solvent have been matched closely. Two different compositions of 3MP have been studied, one below (mass fraction ) and one above (mass fraction ) the critical composition . (In Ref. Bonn-et:2009 the critical mass fraction of 3MP is denoted as .) The colloid volume fraction has been kept fixed at the rather small value 0.002 and the D2O/H2O mass ratio was chosen as . For the suspension poor in 3MP no aggregation has been observed upon increasing temperature within the homogeneous one-phase region of the solvent until phase separation of the whole mixture has taken place. This is expected to occur for 3MP mass fractions so far off the critical value that the CCFs are negligibly small. Above , within a rather wide temperature range of K, reversible aggregation has been observed. For the very small volume fraction of colloids used, the formation of clusters rather than a colloid phase transition has been observed and the kinetics of this aggregation process has been studied. The clusters have been a few particle diameters wide. The sizes of the clusters, as inferred from the maximum of the confocal image intensity in Fourier space, have been found to to increase linearly as function of time. The fractal dimension of these aggregates has indicated that the growth process is diffusion limited. Because the particles have desorbed from the clusters at a certain finite rate, the authors have been able to estimate the energy scale of the attraction between the particles by comparing the observed escape frequency with the corresponding attempt frequency, which is the inverse of the Brownian time, i.e., the time in which a particle diffuses a distance equal to its radius, and by assuming that this whole process is thermally activated; this renders 3 as the estimate of for the energy scale of attraction. The authors rightfully argued that the CCFs alone are sufficient to induce aggregation in charged-stabilized colloids. In order to show that this is indeed the case for their experiments, they analyzed their data using a simple expression for the effective pair potential between the colloidal particles. As in Eq. (18), it consists of two competing contributions with the repulsive part decaying exponentially on the scale of the Debye screening length (denoted as in Ref. Bonn-et:2009 .) Concerning the CCP contribution, a rather simple expression has been adopted. First, although the solvent in the actual experiment has not been at the critical composition, the occurrence of the corresponding relevant scaling variable (Eq. (4)) or, equivalently, (Fig. 1) has been neglected. Second, the Derjaguin approximation (Eq. (15)) has been employed with set to 2. As both contributions decay exponentially, the hypothesis was put forward that aggregation should occur when both decay lengths, and , become comparable. This hypothesis has been tested by adding salt in order to vary the range of the repulsive Coulomb interactions and by changing temperature in order to vary the critical Casimir attraction. The Debye screening length follows from the formula (see below Eq. (1)) with , where are the number densities of all ions (regardless of the sign of their charges), is the Avogadro number, and is the ionic strength (i.e., the molar density of positively charged ions) of the solvent. The bulk correlation length has been determined independently using X-ray and light scattering. The data representing the onset of aggregation for various values of fit well to the anticipated relation .
This data analysis has been objected and redone in Ref. Gambassi-et:2010 with the conclusion that, in fact, most of the data reported in Ref. Bonn-et:2009 for the onset of aggregation have been located within ranges of values of and for which the proposed pair potential does not apply or, in other words, the model proposed in Ref. Bonn-et:2009 does not predict aggregation to occur at . The comment Gambassi-et:2010 linked to Ref. Bonn-et:2009 pointed out the following weaknesses of the theoretical analysis in Ref. Bonn-et:2009 . The majority of the experimental data correspond to rather small bulk correlation lengths, i.e., , for which the adopted form of the CCP is not valid and should be complemented by corrections to scaling. Moreover, the effect of screening of the surface charge upon adding salt to the solution, which changes the amplitude of the repulsive contribution to the pair potential (Eq. (18)), has been neglected. Therefore, as a function of and the total pair potential exhibits richer forms than the two forms (a purely repulsive potential above the line and in addition an attractive potential well below the line ) shown in Ref. Bonn-et:2009 (see Fig. 8). The model pair potential actually used in Ref. Bonn-et:2009 is valid in the range where the distances between the colloids (denoted as in Refs. Bonn-et:2009 and Gambassi-et:2010 ), which are close to the position of the minimum of the total potential, satisfy . Together with the requirement that the potential depth should be at least , this leads to a range of applicability of the model which is much more stringent than as indicated in Refs. Bonn-et:2009 . However, the reanalysis presented in Ref. Gambassi-et:2010 does not exclude the possibility that the observed aggregation is not solely due to the competing effects of repulsive electrostatic and attractive critical Casimir interactions.
IV.2 Effective colloid-colloid pair potential
In Refs. Nguyen-et:2013 ; Dang-et:2013 the effective pair potential between colloidal particles for a dilute (volume fraction 2%) suspension of poly--isopropyl acrylamid microgel (PNIPAM) particles with a radius of nm has been inferred from the pair correlation function . For a sufficiently dilute suspension of solute, the potential of mean force can be identified with the effective pair potential ; has been determined from the images obtained by confocal microscopy. The spatial resolution has been estimated to be ca. in the image plane and ca. in the direction perpendicular to it. The solvent was, as before, a (quasi) binary mixture of 3MP - water - heavy water with various compositions, including the critical one and compositions slightly off the critical one (towards the 3MP poor phase). The measurements have been performed for various temperatures upon approaching the solvent two-phase coexistence curve from the homogeneous mixed phase. The obtained pair potential displayed a very soft repulsion at small separations and developed an increasingly deep minimum as approaches the coexistence temperature of the solvent. At low temperatures, at which is purely repulsive, the authors have been able to fit to the screened electrostatic, exponentially decaying potential (see Eq. (2)) with plausible values of the parameters. From this the CCP has been then determined by the best fit to the exponential form given in Eq. (15), but with the amplitude and the decay length treated as fit parameters, assuming that the total is the sum of and (as in Eq. (17)). This assumption is justified for small salt concentrations ions which has been the case for the samples studied there. (There is experimental Nellen-et:2011 and theoretical ions evidence that at larger salt concentrations the coupling between the charge density and the order parameter can alter significantly the standard critical adsorption and CCFs.) Moreover, it has been assumed that for the temperatures studied, within a range , the ‘background’ repulsive contribution is de facto temperature independent. This data analysis has rendered the length scale for the experimental decay of the CCP, which, however, differs from the bulk correlation length. This discrepancy as well as the softness of the repulsion at small separations have been attributed to the fluffiness of the colloidal particles. The choice of PNIPAM particles has been motivated by their special properties when dissolved in the solvent described above. They swell, which prevents sedimentation, and in this swollen state their refractive index matches that of the solvent.
In a subsequent paper Dang-et:2013 , the fitting procedure has been improved in the sense that the bulk correlation length has not been anymore an adjustable parameter. Assuming the standard scaling law for as a function of temperature, the amplitude has been used as a fit parameter in addition to the amplitude and the decay length of . Using one set of these three fit parameters, Dang and coworkers Dang-et:2013 have fitted all experimental data to the sum of two exponentially decaying functions. The fitted analytic expression for the potential has been further used for performing Monte Carlo (MC) simulations of the colloidal sample. The colloidal gas-liquid coexistence has been investigated by using Gibbs Ensemble MC Frenkel-et:2001 whereas colloidal liquid-solid coexistence has been determined by using Kofke’s Gibbs-Duhem integration technique Kofke:1993 . The conclusiveness of these MC simulation results for the actual colloidal phase behavior may be questioned because the fits of the experimental data to the analytic expression for the potential are not completely satisfactory. The strongest deviations have occurred at small separations, where the potential has been finite even for center-to-center separations smaller than the diameter of the particles. Moreover, the pair potentials obtained from fitting have not followed the data around the minimum of the total potential, especially close to . Also these deviations have been attributed to the softness of the PNIPAM particles and to the fact that the scaling variable describing off-critical compositions has been neglected. It has been tested if all these deviations may significantly affect the observed phase behavior by calculating the reduced second virial coefficient . Empirically, gas-liquid phase transitions are expected to occur for Vliegenthart-et:2000 ; Noro-et:2000 . Applying this criterion for experimentally determined and fitted potentials has led to an estimate for an upper bound for the deviation K of the temperature , at which a colloidal gas-liquid transition takes place, from that of the pure solvent phase separation (i.e., ), which is in agreement both with the experiments and the simulations reported in Ref. Dang-et:2013 . The comparison between computed and measured phase diagrams at fixed composition of a pure solvent in the plane spanned by and by the colloidal volume fraction (in Ref. Dang-et:2013 denoted as ) is shown in Fig. 9 (Fig. 2 in Ref. Dang-et:2013 ). For solutions with off-critical compositions of a (pure) solvent, a reasonable agreement has been found, given the large uncertainties in the experimental determinations of the volume fraction and of , as well as given the simplified functional form taken for . On the other hand, for solutions with the (supposedly) critical composition, the agreement is less good. Deviations occur concerning the shape of the colloidal gas-liquid coexistence curve, which in simulations is shifted towards values of lower than those for the experimental data. Such a shift suggests that the fitted potentials underestimate the attractions between the colloids. According to the authors, this is due to many-body interactions and too small simulation boxes; both are particularly relevant for systems at the critical composition. Another possibility is that the effective one-component approach is not adequate to describe the considered experimental system. Concerning the colloidal liquid-solid phase coexistence in this system, there are no experimental data.
The experimental data for at a 3MP mass fraction of , which is close to the critical value, have been re-analyzed in Ref. Mohry-et:2014 . The main improvement over the earlier analyses has been due to a better treatment of the CCP contribution to the total pair potential, where is a background term. Within this approach, also the dependence of on the solvent mass fraction has been taken into account. The scaling function of as a function of the scaling variable (see Eq. (18) and Fig. 1) has been calculated within the Derjaguin approximation by using a local functional approach. In order to minimize the number of fit parameters, the amplitude has been set to the value extracted from the experimental data presented in Ref. Sorensen-et:1985 . However, the value of the critical mass fraction of the 3MP-heavy water binary liquid mixture is not well established. The inaccuracy of the value for enters into the reduced order parameter , where is the non-universal amplitude of the bulk coexistence curve . Via the equation of state, which close to the critical point attains its scaling form, this determines the scaling variable , where refers to the sign of . (In Ref. Mohry-et:2014 the scaling functions have been obtained by using the equation of state within a linear parametric model.) Because depends sensitively on , it has been natural to use the reduced order parameter as a fitting parameter for achieving the weakest variation of the background potential with temperature. A fair agreement with the experimental data has been obtained by allowing the value of to differ significantly from the value cited by the authors of the experiment (see Fig. 5 in Ref. Mohry-et:2014 ). The fit has rendered the background potential which varies slightly with temperature and has an attractive part. This might be due to the the coupling between critical fluctuations and electrostatic interactions and thus deserves further studies.
This detailed knowledge of the CCFs as function of and has been used by the authors of Ref. Mohry-et:2014 to re-analyze the experimental data for the phase segregation, obtained in Ref. Dang-et:2013 and shown in Fig. 9(a). The colloidal gas-liquid coexistence has been calculated within the effective one-component DFT approach using the pair potential fitted to the experimental data as described above, where has the scaling form as in Eq. (18). The random-phase (RPA) approximation has been employed for the free energy together with the Percus-Yevick expression for the hard-sphere reference contribution. For the off-critical composition of the solvent, which renders the best expression (i.e., the least temperature dependent one) for extracted from the experimental data of Ref. Dang-et:2013 (with, however, still varying slightly with temperature), the phase diagram has been calculated by taking the mean curve of those which correspond to the various temperatures considered. The corresponding results together with the experimental and MC simulation data from Ref. Dang-et:2013 are shown in Fig. 10. At high colloidal densities, the RPA is in surprisingly good agreement with the experimental data. On the other hand, at low densities the RPA agrees well with the Monte Carlo simulations, while for these densities both approaches underestimate the experimental values which, in turn, agree well with the RPA spinodal. While this latter ‘agreement’ might be accidental, it nevertheless raises the question whether the experimental system had actually been fully equilibrated at the time of the measurements. As pointed out in Refs. Nguyen-et:2013 ; Dang-et:2013 , the phase diagrams shown in Fig. 9 are analogous to those of molecular fluids modeled, e.g., by Lennard-Jones or square-well fluids, but with a lower critical point. The peculiarity of the CCP, i.e., the strong temperature dependence of the shape of the potential and of its range, is mirrored by the small temperature range over which colloidal gas-liquid coexistence extends and in the shift of the critical point and of colloidal liquid-solid coexistence to lower volume fractions.
Experience gained from the studies summarized above tells that a meaningful comparison of experimental data and theoretical predictions for the CCP requires accurate experimental knowledge of the solvent bulk phase diagram and of the solvent bulk correlation length. Such corresponding dedicated measurements have been reported in Ref. Marcel-et for PNIPAM particles suspended in a binary liquid mixture of 3MP and heavy water with addition of 1mM KCl salt. The solvents have been prepared with 3MP mass fractions (and therein denoted as and given in units of weight percentage wt% 3MP) ranging from 23.5% to 33% around the critical value %, and for each of them the temperature has been varied from the homogeneous, mixed phase towards the solvent two-phase coexistence. In order to achieve intrinsic consistency of the experimental data and to link them to theoretical predictions, the measurements of the pair potentials of the particles in terms of radial distribution functions have been complemented with dynamic light scattering measurements of the solvent phase diagram and of the bulk correlation length. Below the lower critical temperature , the solvent correlation lengths have been inferred from the temperature-dependent correlation functions determining the scattered intensity, which are well-described by single-exponential decays with a characteristic time scale related to the effective diffusion coefficient , where is the wave vector of the incident wave (equal to 19 in these specific measurements). This effective diffusion coefficient depends on the linear extent of the correlated regions via a relation analogous to the Stokes-Einstein relation for Brownian particles. However, close to the critical point one has to take into account that decomposes into a critical and a background part Sorensen-et:1985 , where Sorensen-et:1985 ; Burstyn-et and Here, is a universal dynamic amplitude ratio Das-et:2007 ; Burstyn-et , is the Kawasaki function Kawasaki , Burstyn-et is a correction to scaling amplitude and is the background viscosity. The latter has been obtained as a function of and by extrapolating the available viscosity data Oleinikova-et:1999 to the critical region. This detailed analysis has allowed one to determine the correlation length for various compositions and to extract the amplitude nm. The phase separation temperatures have been defined as those which correspond the minimum of the diffusion constant for for various values of . They are fitted to the relation with the fixed critical exponent leading to the estimate for the OP amplitude. The diameter m of the particles has been deduced by using confocal microscopy whereas their surface charge density e nm-2 has been obtained from electrophoresis. The experimental radial distribution function , determined by particle tracking, reveals a very soft repulsion, according to which the measured effective potential fulfills and is very large but not infinite as one would expect for hard core repulsion. As already mentioned in the present section, in the previous studies Nguyen-et:2013 this softness has been attributed to the fluffiness of the colloidal particles. A plausible alternative explanation for this softness consists of the inaccuracy associated with determining a three-dimensional from two-dimensional images and, in addition, a certain polydispersity. In Ref. Marcel-et this inaccuracy of the experimental radial distribution function has been compared with the projected theoretical function , where , , and are the probability distributions, which account for the uncertainty in the two horizontal directions and the vertical direction, respectively, with the in-plane spreads being equal. In Ref. Marcel-et these distributions have been taken to be the normal ones. Building upon the consistent description of the bulk properties of the binary solvent, the comparison between the measured pair potentials and the theoretical model, given by Eq. (18) within the Derjaguin approximation for the CCP, would have not required any fitting parameter if the surface of the colloids had exhibited strong preferential adsorption. However, the PNIMP particles are only weakly hydrophilic. In such a case the CCP depends also on the surface field via the scaling variable , where is the surface counterpart of the bulk gap exponent Diehl:1986 (see Secs. II.2 and II.2.4). For the film geometry, within mean field theory the dependence on at the critical concentration () can be reduced to a re-mapping with a rescaling parameter , which depends on Mohry-et:2010 . The authors of Ref. Marcel-et have found that within the experimentally accessible range of the CCP scaling function, which usually consists of only its exponential tail, one may mimic such a rescaling by using an effective temperature offset which shifts the reduced temperature according to . Assuming that such a rescaling is valid also beyond mean-field theory, the authors of Ref. Marcel-et have been able to fit all pair correlation functions, for a variety of temperatures and even of off-critical compositions, by taking the single parameter to vary smoothly with composition. Based on these fits the predictions for the pair potential are also given (see Fig. 11). Remarkably, any distorting influence on , which can be described by probability distribution functions which are symmetric about their argument, leaves the second virial coefficient unchanged. This holds because is determined by the integrated pair potential (see Eq. (19)). Taking advantage of this property, the authors of Ref. Marcel-et could compare virial coefficients computed from the raw data of directly with theoretical predictions, without any need to account for experimental inaccuracies and particle polydispersity. The experimental and the theoretical values of show very good agreement in the entire temperature-composition plane (see Fig. 12). The comparison based directly on the raw data provides clear evidence that in the investigated solvent composition range it is indeed the critical Casimir interaction which underlies the colloidal attraction. Hence, this direct comparison suggests that not only at the critical composition, but also at these off-critical compositions, the attraction is described in terms of a critical Casimir force rather than by wetting effects. Yet, at even larger off-critical compositions, wetting effects are expected to eventually take over and dominate the attraction as observed clearly in Ref. Hertlein-et:2008 .
Using the same experimental imaging and particle tracking techniques, in Ref. Newton-et:2017 the effective interaction potentials for non-spherical dumbbell particles have been extracted from observed radial and angular distributions. The colloidal patchy dumbbell particles have been suspended in heavy water and 3MP with a mass fraction (therein denoted as ). At this subcritical composition, the hydrophobic spherical ends prefer 3MP, while the neck joining these two spherical ends (called by the authors “shell”) prefers water. While the one-to-one mapping between radial distribution function and the effective, angularly averaged pair potential still holds for the anisotropic particles, the simple procedure of inferring the effective potential from the radial distribution function is not valid anymore. In order to find an optimal effective potential the authors of Ref. Newton-et:2017 have assumed that dumbbells are the rigid construction of two isotropic spheres each of which interacts via an isotropic pair potential. They have used the following three distinct distribution functions which facilitate the comparison of simulations, theory, and experiment —this way determining that set of potential parameters which renders the best match: (1) the minimum distance radial distribution, for which only the minimum center-to-center distance between two spheres and belonging to dumbbell and , respectively, contributes, (2) the, “site-site” radial distribution between sphere ( called site) on dumbbell and a sphere (site) on a different dumbbell , and (3) the bond-angle distribution, which measures the mutual orientation of the particles forming dumbbells. As a first approximation, the observed site-site radial distribution function has been matched to an underlying potential between the dumbbell particles using the so-called reference interaction site model (RISM) in the context of integral equation theory for molecular fluids Chandler-et:1972 . Within the latter theory, a molecule is taken to contain several interaction sites so that the total interaction between two molecules is the sum of the site-site interactions. The RISM equation is a generalization of the Ornstein-Zernike equation OZ for hard-core site-site interactions. The authors of Ref. Newton-et:2017 have used the hypernetted chain approximation as a closure. All three measured distributions have been compared with the ones computed using MC simulations of the dumbbell system in which every pair of spheres, apart from the one on the same dumbbell interacts via an effective potential as given by Eq. (18). Because the corresponding experimental system has not been density matched, the particles sedimented, which was taken into account by including the gravitational potential and a surface field in order to describe the interaction with the bottom wall. Concerning the CCP, the authors of Ref. Newton-et:2017 adopted an oversimplified expression as the one given by Eq. (15), in line with Refs. Bonn-et:2009 ; Nguyen-et:2013 ; Dang-et:2013 . As discussed above, such a form is valid only in the limit and at the critical composition. Both conditions are not met in the experiment under consideration. Moreover, the amplitude of the bulk correlation length of the solvent and the surface charge, which determines the strength and the decay length of the electrostatic repulsion, respectively, have not been measured. As a consequence, the numerous adjustable parameters have been used to fit the theoretically proposed effective potentials to the measured ones. Following Ref. Marcel-et , the authors of Ref. Newton-et:2017 have used the projected theoretical distribution functions in order to mimic the experimental uncertainties. Nevertheless, the extent of agreement between the measured and the theoretically proposed effective potentials depends on temperature and is not satisfactory. The results for the dumbbell effective pair potentials, based on so many crude approximations and numerous fit parameters, are not conclusive and cannot be predictive. In particular, the quantitative modeling carried out in Ref. Newton-et:2017 is not able to provide the explanation for the observed two ranges of temperatures featuring distinct aggregation behaviors (see Sec. IV.3 below).
IV.3 Applications of CCF for self-assembly and aggregation of colloids
The possibility of controlled aggregation by exploiting CCFs has been used, near the lower critical point of the suspension, for the self-assembly of cadium telluride quantum dots in water - 3MP liquid mixtures with NaCl salt Marino:2016 . By measuring the intensity of scattered light as a function of time and by following the time evolution of the intensity correlation function, it has been found that 1 K below the phase separation temperature of the suspension the hydrophilic quantum dots with a size of ca. 2.6 nm form aggregates with an average radius of ca. 700 nm. As expected, for a composition with the 3MP volume fraction being larger than its critical value, i.e., corresponding to the phase poor in the component preferred by the quantum dots, aggregation takes place on shorter time scales and within a larger temperature interval than for a mixture with a 3MP volume fraction being smaller than the critical one.
Critical Casimir interactions can be utilized for aggregation of colloids being induced by a substrate such that the colloids follow the chemical pattern designed on the surface of a substrate which characterizes the boundary conditions. This is because CCFs respond sensitively to the chemical properties of the confining surfaces. As already discussed in Sec. II, depending on whether the surfaces of the colloid and of the substrate have the same or opposite preferences for the species of the solvent (symmetric or asymmetric boundary conditions), attractive or repulsive CCFs arise. In Refs. Soyka-et:2008 ; Troendle-et:2011 , charged polystyrene (PS) spheres with have been suspended in a water-2,6-lutidine (WL) mixture at its critical composition, i.e., a lutidine mass fraction of . The suspension has been exposed to a chemically patterned substrate with well defined, spatially varying adsorption preferences. This has been achieved by first coating the glass surface with a monolayer of hexamethyldisilazane (HMDS) which rendered the glass surface hydrophobic with a preferential adsorption of lutidine, corresponding to a () boundary condition. Spatial patterning of the boundary conditions has been obtained by using a focused ion beam (FIB) of positively charged gallium (Ga) ions which created well-defined hydrophilic () areas with a lateral resolution on the order of several tens of nanometers extending over an area of approximately . Close to the lower critical demixing point of WL Beysens-et:1985 , normal and lateral CCFs lead to a strongly temperature dependent attraction between the hydrophilic () PS particles and the hydrophilic squares (forming a square lattice of locally symmetric boundary conditions) and to a repulsion from the hydrophobic regions () (locally asymmetric boundary conditions). This gives rise to the formation of highly ordered colloidal self-assemblies, the structure of which is controlled by the underlying chemical pattern (see Fig. 13). At higher particle concentrations, additional CCFs between neighboring particles arise and eventually lead to the formation of three-dimensional, facetted colloidal islands on the substrate. In order to quantify lateral CCFs, substrates with a periodic one-dimensional chemical pattern have been created forming hydrophilic () and hydrophobic () stripes with widths of 24.6 and 5.2 , respectively. For these one-dimensional surface patterns the particle distribution has been measured by digital video microscopy and from the two-dimensional projection of this distribution the effective one-dimensional CCP has been determined by resorting to the Boltzmann factor. In Ref. Troendle-et:2011 the experiment has been repeated for substrates with the chemical pattern created by micro-contact printing, which provided sharper, chemical steplike, onedimensional interfaces between alternating regions of antagonistic adsorption preferences than the FIB technique does. The reason for the disadvantage of FIB is that the ion beam charges the substrate surface and thus deflects the incoming beam which gives rise to fuzzy chemical steps. It turns out that the agreement between theory and the experimental data is so sensitive (Fig. 13), that the CCP can be used to probe the geometry of the chemical structures, which at present cannot be achieved by other experimental techniques. Accordingly CCFs can be used as a novel surface sensitive probe.
Reversible aggregation of spherical Janus particles has been studied experimentally for micro-sized silica particles half covered by a layer of gold and suspended in the WL mixture at the critical concentration Iwashita-et:2013 . The gold caps of the particles have been modified chemically by sulfonic groups, which have bestowed a large charge density on their surfaces, leading to an adsorption property which differs from that of the bare silica surfaces. Due to this anisotropy, the particles assembled to clusters with a very specific structure, followed by a hierarchical growth of the clusters. These structures depend on the “valence” of the Janus particle, i.e., the maximum possible number of bonded nearest neighbors. In two spatial dimensions, which applies to the dispersion of the sedimented particles considered in the experiment, the valence is equal to six. Direct visual observation has revealed that particles, randomly dispersed at low temperatures, have started to form micellar structures upon increasing towards the lower critical point of the WL mixture. Most of the clusters have been trimers and tetramers, with gold-coated hemispheres inside the micelle and silica hemispheres always facing outwards. No “inverted” micelles have been observed, which indicates that the effective attraction between golden patches of colloids has been much stronger than the attraction between the silica parts of the particles. At higher temperatures small clusters, mostly tetramers, have assembled into chain-like structures, finally forming a percolating network. The reversibility of the aggregation, the value of the onset temperature, and the apparent increase of the strength of attraction upon approaching , have supported the expectation that this aggregation is due to CCFs. The structures of the clusters observed in the experiments are similar to those obtained within MC simulations of hard discs with a pairwise square-well potential acting between the semi-circular patches of the particles. However, the strength of attraction could not be determined from the experimental data. The analysis of the cluster structures corresponding to the lowest internal energy and of the hierarchical clustering suggested the possibility that the self-assembly of Janus particles is governed by the valence structure of the clusters and not by that of a single particle.
Recent progress in synthesizing colloidal building blocks allowed the authors of Ref. Nguyen-et:2017 ; Nguyen-et:2017a to fabricate particles with complex shapes and surface patch properties which act as analogues of molecular valence. Multivalent particles, such as dimers, trimers, and tetramers have been produced by swelling and polymerizing clusters of PMMA spheres with a methylmethacrylate/methacrylic acid shell, resulting in geometrically well-defined patches. The specific solvent affinity of the particle patches has been achieved by grafting a polyhydroxy stearic acid-copolymer (PHSA) onto the surface patch, which renders it hydrophobic. The central part of the patchy particles is made hydrophilic by using the ionic initiator potassium persulfate. The particles have been suspended in the homogeneous phase of a binary solvent of heavy water and 3-methylpyridine (3MP) at temperatures below the lower critical temperature ℃, which has been determined by light scattering and microscopy from solvent phase separation at the critical composition. The solvents were prepared with 3MP mass fractions and 0.31 (therein denoted as ), i.e., slightly below and above the critical composition , respectively. The hydrophobic patches have a strong affinity for the non-aqueous component 3MP of the binary solvent, while the hydrophilic central part has an affinity for water. It has been observed that, in solvents poor in the component preferred by the particle patches, the patches approach each other at temperatures close to , and that dimer particles assemble into directed, chain-like structures. The bending stiffness of the chains has been measured directly by monitoring thermally activated bending fluctuations. In contrast, in 3MP-rich solvents, the particles approach each other sideways resulting in distinct parallel structures. For trimers, the patch-to-patch binding in 3MP-poor solvents leads to staggered chains, while the side-by-side binding in 3MP-rich solvents leads to bent filaments associated with the dense alternating stacking of trimers. In all cases, the assembly is fully reversible as confirmed by the break-up of aggregates upon lowering the temperature several degrees below . Interestingly, in the case that the chain structure is formed by dimers, upon further approaching , the authors of Ref. Nguyen-et:2017 have observed that the chain spontaneously collapses into a compact state, the dimer particles approach each other sideways, and eventually form a close-packed arrangement. It has been argued that in this close-packed state, a particle has more bonding neighbors, and hence a more negative bond energy. The authors of Ref. Nguyen-et:2017 regard this as being similar to the collapse transition of a polymer, which occurs if the solvent conditions go from good to poor. For polymers, too, the reduction of the conformational entropy of the chain is offset by the stronger interparticle interaction energy. Using MC simulations with the effective pair potential determined in Ref. Newton-et:2017 (see the preceding Sec. IV.2), it has been argued in Ref. Nguyen-et:2017 , that the colloidal chain collapse results from the enlarged interaction range due to the increase of the solvent correlation length upon approaching the solvent critical point. In Ref. Nguyen-et:2017a , the effect of patch width on the topology of colloidal aggregates has been experimentally investigated.
IV.4 Colloidal mixtures
The way the unique properties of CCFs can be harnessed to manipulate colloidal suspensions has been demonstrated by experiments on colloidal mixtures Zvyagolskaya-et:2011 . This experimental system has been composed of a binary mixture of micro-sized latex particles with slightly different diameters which were suspended in the WL mixture. For this small size difference of the colloids the inherent depletion interaction cannot induce demixing. However, the CCFs can accomplished this, if the two types of particles carry opposite adsorption preferences. The -type particles were functionalized with silane rendering them hydrophobic, i.e., BC, whereas the -type particles had a strong adsorption preference for water, i.e., BC. For such BCs the CCFs among the -type particles and among the -type particles are attractive, whereas between -particles and -particles they are repulsive. At the same temperature and the same distance, the repulsive CCF is stronger than the attractive CCF. In the system under consideration, the van der Waals forces have been eliminated by index matching so that besides the CCFs the only remaining forces have been the screened electrostatic interactions. In the suspension, this mixture of colloids sedimented at the bottom of the cell forming a dense monolayer. One species has been labeled with a fluorescent dye and traced by using video microscopy. As expected, upon approaching the (lower) critical point of the binary solvent at its critical composition, large structural changes in the colloidal mixture have been observed, signaling the demixing process. It was found that the morphology of this process depends strongly on the mixing ratio of - and -particles, where are the number density of and particles (see Fig. 16, which has been taken from Ref. Zvyagolskaya-et:2011 ). For and at low temperatures an initially random distribution of particles transforms into a bicontinuous network, which is coarsening further upon increasing the temperature. For , no bicontinuous structure has been observed; demixing has proceeded via the growth of small clusters of the minority phase (here rich in -particles).
In the theoretical part of this study Zvyagolskaya-et:2011 , the effective approach has been employed in order to construct an approximation for the Helmholtz free energy of the colloid mixture. It has been assumed that the effective pair potential , can be split into a hard-disc part and into a tail, which for identical particles is attractive and for the distinct ones repulsive. For the hard-disc part of the free energy the scaled particle approximation has been used, whereas the attractive or repulsive tail has been treated within the mean field van der Waals approximation. The predictions of this simple theory for the locations of the colloid demixing transitions and their critical point agree fairly well with the experimental data.
IV.5 Effects of depletants on colloidal phase separations
Piazza and collaborators Buzzaccaro-et:2010 ; Piazza-et:2011 have studied experimentally the colloidal phase separation in suspensions with a depletion agent, which occurred near the critical point of the depletant enriched solvent. They have used the so-called HyflonTM MFA latex particles (a copolymer of tetrafluoroethylene (TFE) and perfluoromethylvinylether (PF-MVE); the producer does not provide the meaning of the acronym MFA) of average size nm suspended in water with the nonionic surfactant C12E8. Salt (NaCl) has been added in order to screen electrostatic interactions between the colloids, caused by their surfaces carrying a negative charge. In addition, this surfactant has provided also steric stabilization of the suspension due to its spontaneous adsorption on the colloid surfaces. What makes this system interesting is, that at concentrations above the critical micellar concentration, C12E8 in water forms globular micelles with a radius nm. These micells act as a depletant for the MFA particles. Moreover, the surfactant-water mixture exhibits a liquid-liquid phase transition terminating at a lower critical point with a very small value of the critical concentration of the surfactant (1.8% mass fraction , where is the mass of the surfactant and is the total mass of the sample). (We use the superscript as an acronym for the solvent and the subscript as the one for the surfactant.) Above this critical point two liquid phases exist, one rich and the other poor in micelles. The authors have determined, as a function of temperature, the minimum concentration of surfactants required to induce colloidal gas-liquid phase separation. The onset of this phase separation has been assumed to manifest itself via the sudden increase of turbidity followed by fast sedimentation of the colloidal particles. The results of these measurements (see Fig. 15, taken from Ref. Piazza-et:2011 ) show a drastic decrease of upon increasing temperature towards the consolute point of the surfactant-water mixture, such that approaches as . Far below the surfactant-water miscibility gap, the colloidal phase separation has been obtained due to the action of depletion forces, provided that a sufficient amount of surfactant has been added. The range of the depletion interaction is set by the ratio between the micelle and the particle size and is very short, but the strength depends on the concentration of the micelles. In Fig. 17, the full dots show the minimum amount of surfactant required to induce colloidal phase separation at the temperature . These points are expected to correspond to the thermodynamic states of the surfactant-water solvent for which the strength of the effective attractive potential between the colloidal particles is roughly constant. The authors have interpreted the reduction in observed at higher temperatures as an increase of depletant “efficiency” suggesting that the emerging critical Casimir interactions near the critical point of the surfactant-water mixture can be considered as an extreme case of depletion forces in which the correlated regions of micelles act as a depletant of “renormalized” size, i.e., bigger than that of a micelle, which acts as a bare depletant. However, this interpretation is overstreched because depletion and Casimir forces originate from very different physical mechanisms. In particular, upon approaching the critical point the correlated regions of the emerging phases do not form bubbles but self-similar, bicontinuous structures.
Inspired by these experiments, Sciortino and co-workers Gnan-et:2012a have performed a numerical study of the phase separation of hard spheres dispersed in an implicit solvent (i.e., there are no direct interactions, beyond the hard-core ones, between the solvent molecules and these spheres) in the presence of interacting depletant particles. The particles have been taken to interact via the corresponding effective potential as determined by MC simulations for SW and 3P models of depletants (see Eq. (8) as well as Secs. II and IV.5). The phase separation of the colloids as a function of the depletant concentration for various depletant-colloid size ratios has been determined within grand canonical MC simulations. The numerically determined loci of the onset of colloidal gas-liquid phase separation has been displayed within the phase diagram of the depletant which exhibits an upper critical point. This revealed that almost for all parameters studied in the MC simulations, the colloidal phase separation induced by CCFs is preempted by the one driven by standard depletion forces. The important message of this study is that only by weakening the attractive depletion interactions, either by lowering the critical depletant concentration or by introducing a repulsive interaction between the colloids, it is possible to exploit CCFs for the fine tuning of the self-assembly of colloids in solvents with interacting depletant agents.
IV.6 Aggregation kinetics and structures of aggregates
Aggregation of colloids in a near-critical binary solvent has been studied experimentally on the ground and under microgravity conditions Bonn-et:2009 ; Veen-et:2012 ; Shelke-et:2013 ; Potenza-et:2014 . The advantage of the critical Casimir effect of providing the ability to tune the effective interactions between the colloids by varying the temperature has been used in order to study systematically the internal structure of the aggregates as a function of their interparticle attraction. Direct visual observations via confocal microscopy of a dilute suspension of latex particles of radius in a mixture have revealed the formation of fractal clusters of colloidal particles near the critical point of the solvent Bonn-et:2009 . The analysis of the time-dependent intensity revealed that exhibits a maximum at , which corresponds to the inverse of the mean cluster size. It has been found that in the course of time decreases as and that this linear growth of the size of the clusters with time is self-similar. The latter property has been inferred from the data collapse of plotted as a function of the rescaled wave vector with min222In the original paper Bonn-et:2009 is given as , which we consider as a typo. The fractal dimensions determined from projection images have indicated that this system exhibits diffusion-limited cluster aggregation rather than diffusion-limited particle aggregation, for which is larger Dutcher-et:2004 . The fractal dimension reflects the internal structure of an aggregate and relates its radius of gyration to the number of particles according to ; corresponds to a close packed structure. measures the mean size of the fractal aggregate. It is defined in terms of the mass density of the particles at a distance from the center of mass of the aggregate as or, alternatively, based on the pair correlation function of colloidal particles (see, e.g., Ref. vanSaarloos:1987 ). For fractal structures consisting of spheres with spherically symmetric mass density distribution , one has , where is the largest radius beyond which the aggregate has zero mass. The images from confocal microscopy have shown that the width of the branches of the clusters is a few particle sizes and that the particles escape from the aggregate at a finite rate. The latter observation and the assumption that this process is thermally activated, allows one to estimate the energy scale of attraction between the particles as ca. . A more detailed investigation of the structure of the clusters and its evolution was impeded by sedimentation.
In order to avoid this complication, using near field light scattering (NFS), new measurements for the same type of particles have been performed under microgravity conditions on board of the International Space Station and, simultaneously, on the ground Veen-et:2012 ; Potenza-et:2014 . (For these experiments, the composition of the solvent and the volume fraction of the colloidal particles have been taken to be different from those in Ref. Bonn-et:2009 . Moreover, different amounts of salt (NaCl) have been added. Thus the results of both studies cannot be compared directly.) The light scattering intensity has provided information about the time evolution of the structure and of the mean size of the aggregates. Its normalized variance, defined as , with the angular brackets denoting the time average, has revealed the onset and the time scale of the aggregation process. The time dependence of the normalized variance results from variations of the number density of the scatters. Accordingly, the start of aggregation has been marked by the time at which this quantity starts to increase from zero. From the slope in the log-log plot of at large momentum transfer , which has been temporally constant during the growth process (which is characteristic of scattering off fractal structures), a fractal dimension has been inferred. It has been found that, upon varying the temperature towards , has decreased from a value, which is close to the theoretical one of 2.5 for diffusion-limited aggregation, to about 1.8. This indicates that more open structures of clusters are formed if - as expected - the strength of the attraction increases. This has been interpreted to the effect that for an attractive interaction potential with a well depth of ca. the restructuring of the aggregates into more compact objects can proceed, whereas for deeper attraction wells restructuring gradually stops and the resulting structure is more open. Such more open structures have been observed in the presence of gravity with for all temperatures studied. In both cases, i.e., in the presence and absence of gravity, only a slight variation with the salt concentration has been found. Moreover, it has been observed that independent of temperature, and thus the strength of the attraction, the aggregates grow similarly. Specifically, the scattered intensity of the growing aggregates as obtained at different times has been reduced to a scaling function , where the time dependent characteristic momentum transfer has been determined from the best fit in the sense of yielding data collapse to a function of a single variable . Based on this apparent scaling behavior, an analogy has been drawn between the observed aggregation process and spinodal decomposition processes. For the latter, a similar scaling holds with replaced by the spatial dimension Carpineti:1992 . As for spinodal decomposition, exhibits a maximum at corresponding to the inverse of the characteristic length in the system. In the course of time the momentum shifts to smaller values indicating the growth of this characteristic length. The decrease of for small values of reflects the fact that a region around the cluster is depleted of colloids Carpineti:1992 . The growth rate of the characteristic length scale of the aggregates has been found to be a power law with exponent , regardless of the salt concentration. This is characteristic of diffusion-limited models of aggregation WittenMeakin . Under gravity, the growth rate has been observed to be significantly faster and nonmonotonic (see Fig. 18, which is taken from Ref. Veen-et:2012 ). At early stages it has followed the purely diffusive behavior. After that, aggregation has been influenced strongly by convection of the solvent and by sedimentation. The aggregation among clusters has been found to set in rather fast, resulting in an exponential growth rate, which is characteristic of reaction limited aggregation with a strong dependence on temperature and thus on the strength of the attraction. At still later times, a sudden drop in has been observed, which corresponds to the sedimentation of the largest clusters.
Whereas in Ref. Veen-et:2012 the static properties of the aggregates, i.e., their structure factor , have been measured as aggregation proceeds, in the subsequent NFS study of this system Potenza-et:2014 the dynamical counterpart of , the intermediate scattering function has been measured under microgravity conditions. The aim has been to determine the ratio of the hydrodynamic radius of the aggregate and its gyration radius . This ratio provides information about the density distribution within an aggregate as function of its fractal dimension, which in turn depends on the strength of the particle attraction. The hydrodynamic radius of the aggregate is defined through the translational diffusion coefficient , where is viscosity of the solvent. For a densely packed spherical aggregate of radius and with one expects to be very close to . The intermediate scattering function is the spatial (three-dimensional) Fourier transform of the van Hove distribution function , which is the dynamical counterpart of the radial distribution function Hansen-et:1976 . The NSF technique enables one to measure instantaneously, on the time scale of the much slower aggregation and diffusion processes. This provides the concurrent measurement of from the dynamic and from the static structure factor, simultaneously for all accessible wave vectors. follows from the Fisher-Burford expression FB , which is valid for monodisperse fractal aggregates. has been determined via the effective diffusion constant obtained from the measured decay time of via followed by relating to by using Lin . It has been concluded that in order to obtained reliable data for , one has to consider the late stages of aggregation, in which the clusters reach sizes large enough to exhibit a well-defined fractal dimension and internal structure and in which the actual polydispersity of the aggregates does not play a significant role. The analysis of the data has shown, that upon approaching the critical point of demixing (i.e., for stronger attraction) the ratio has varied between 0.76 for and 0.98 for at the onset of aggregation (i.e., for weaker attraction). The authors of Ref. Potenza-et:2014 have assumed that the fractals are spherically symmetric. Accordingly they have defined the radial density distribution of the fractal objects as , where is the distance from the center of mass of the cluster and is a cutoff function which accounts for the finite size of the aggregates. (The exponent follows from the fact that , where is the number of particles within a sphere of radius from the center of the cluster and is the volume of such sphere.) The expected behavior of the ratio for various forms of a cutoff function has been then compared with the experimental data. It has been observed (see Fig. 19, which is taken from Ref. Potenza-et:2014 ) that the data for the ratio have been closest to those values which correspond to the assumption of fully compact objects with a Heaviside step function for , independent of the strength of the attraction and of the fractal dimension.
The way to avoid sedimentation for experiments performed on the ground Shelke-et:2013 has been to use poly-n-isopropyl acrylanid particles (PNIPAM), which swell in solution. This swelling adjusts their buoyancy, preventing particle sedimentation. This also has allowed the authors to observe directly individual particles (after labeling them with a fluorescent dye) even deep in the bulk of the suspension. Using confocal microscopy, the compactness of aggregates of PNIPAM particles, suspended at small volume fractions in the 3MP - D2O/H2O mixture, has been studied by determining the number of particles within a sphere of radius from the center of the cluster for quenches with various temperature deviations from and below the lower critical point of the demixing transition of the solvent. These data have confirmed the fractal character of the structures, i.e., the relation , with decreasing continuously upon increasing temperature towards from to . This indicates the formation of more compact structures for weaker attraction (see Fig. 19(h) which is taken from Ref. Shelke-et:2013 ), in agreement with the behavior observed for the latex particles under microgravity (see the above paragraph). Monte Carlo simulations of diffusion-limited particle aggregation in and have been used in order to relate to the attractive effective interaction potential of the particles. Experimentally, the pair potential has been determined from the radial distribution function of the colloids in a way similar to that described in Ref. Nguyen-et:2013 . The depth of the attractive well of this pair potential has been related to the quantity used in the simulations for the probability with which the particles can detach from the growing cluster. The experimental variations of as a function of and of in simulations exhibit a common curve after suitable rescaling. The authors have interpreted this result as a manifestation of a certain type of universality which occurs although the corresponding simulations have been carried out for different spatial dimensions ( and ) and although the mechanisms of aggregation differ, i.e., diffusion-limited cluster aggregation in the actual experiments, in which clusters aggregate to form a fractal, and diffusion-limited particle aggregation in simulations, in which a fractal grows by aggregation of single particles.
V Perspectives
It remains as a challenge to accurately determine the critical Casimir pair potential and its scaling function within the range of the relevant parameters and boundary conditions. This applies to chemically homogeneous or Janus particles of spherical or anisotropic shapes such as cylinders, ellipsoids, cubes, or even more complex shapes such as dummbells or -like ones. Quantitative reliability demands to go beyond mean field theory and the Derjaguin approximation. This requires the development of new theoretical approaches and simulation algorithms. Janus particles have already been used in experiments on aggregation in near-critical binary solvents Iwashita-et:2013 . Colloids with chemically homogeneous or inhomogeneous surfaces, forming patchy colloids Schall_review ; Garcia-et:2017 , with various shapes as well as their mixtures are attractive building blocks for generating a large variety of self-assembled structures by using CCFs. In order to make further progress in understanding the interplay between CCFs and other forces, such as electrostatic ones, for aggregation phenomena, more elaborate and combined experimental and theoretical investigations are required. Concerning the thermodynamic properties of colloidal suspensions with near-critical solvents, a multi-component theory beyond the effective approach and beyond mean field theory is needed. One of the challenges along this line is to construct a suitable theory, which accounts for all relevant degrees of freedom of the solvent and of the solute particles and masters the size differences of the various species. An interesting line of research would be to study aggregation of colloids in lipid membranes — close to the corresponding lipid phase segregation — or in a liquid analogue of such quasi two-dimensional systems.
References
- (1) R. Evans, J. Phys.: Condens. Matter 2, 8989, 1990.
- (2) M. E. Fisher and P. G. de Gennes, C. R. Acad. Sci. Paris Ser. B 287, 207 (1978).
- (3) H. G. B. Casimir, Proc. R. Acad. Sci. Amsterdam 51, 793, 1948, online available at the KNAW digital library, http://www.dwc.knaw.nl?DL/publications/PU00018547.pdf.
- (4) M. Kardar and R. Golestanian, Rev. Mod. Phys. 71, 1233 (1999).
- (5) E. J. W. Varwy and J. T. G. Overbeek, Theory of the Stability of Lyophobic Colloids (Elsevier, Amsterdam, 1948).
- (6) C. N. Likos, Phys. Rep. 348, 267 (2001).
- (7) S. Asakura and F. Oosawa, J. Chem. Phys. 22, 1255 (1954).
- (8) A. Vrij, Pure Appl. Chem. 48, 471 (1976).
- (9) D. Beysens and D. Estève, Phys. Rev. Lett. 54, 2123 (1985).
- (10) V. Gurfein, D. Beysens, and F. Perrot, Phys. Rev. A 40, 2543 (1989).
- (11) (a) P. D. Gallagher and J. V. Maher, Phys. Rev. A 46, 2012 (1992); (b) P. D. Gallagher, M. L. Kurnaz, and J. V. Maher, Phys. Rev. A 46, 7750 (1992).
- (12) M. L. Broide, Y. Garrabos, and D. Beysens, Phys. Rev. E 47, 3768 (1993).
- (13) T. Narayanan, J.-M. Petit, M. E. Broide, and D. Beysens, Phys. Rev. E 51, 4580 (1995).
- (14) (a) M. L. Kurnaz and J. V. Maher, Phys. Rev. E. 51, 5916 (1995); (b) M. L. Kurnaz and J. V. Maher, Phys. Rev. E 55, 572 (1997).
- (15) T. Narayanan, A. Kumar, E. S. R. Gopal, D. Beysens, P. Guenoun, and G. Zalczer, Phys. Rev. E 48, 1989 (1993).
- (16) Y. Jayalakshmi and E. W. Kaler, Phys. Rev. Lett. 78, 1379 (1997).
- (17) S. R. Kline and E. W. Kaler, Langmuir 10, 412 (1994).
- (18) R. D. Koehler and E. W. Kaler, Langmuir 13, 2463 (1997).
- (19) (a) H. Grüll and D. Woermann, Ber. Bunsenges. Phys. Chem. 101, 814 (1997); (b) B. Rathke, H. Grüll, and D. Woermann, J. Colloid Interface Sci. 192, 334 (1997).
- (20) D. Beysens, J.-M. Petit, T. Narayanan, A. Kumar, and M. L. Broide, Ber. Bunsenges. Phys. Chem. 98, 382 (1994).
- (21) D. Beysens and T. Narayanan, J. Stat. Phys. 95, 997 (1999).
- (22) B. M. Law, Prog. Surf. Sci. 66, 159 (2001).
- (23) C. Bauer, T. Bieker, and S. Dietrich, Phys. Rev. E 62, 5324 (2000).
- (24) P. G. de Gennes, C. R. Acad. Sci. (Paris) 292, 701 (1981).
- (25) T. Bieker and S. Dietrich, Physica A 252, 85 (1998); 259, 466 (1998).
- (26) T. J. Sluckin, Phys. Rev. A 41, 960 (1990).
- (27) H. Löwen, Phys. Rev. Lett. 74, 1028 (1995).
- (28) R. R. Netz, Phys. Rev. Lett. 76, 3646 (1996).
- (29) A. J. Archer, R. Evans, R. Roth, and M. Oettel, J. Chem. Phys. 122, 084513 (2005).
- (30) R. Okamoto and A. Onuki, Phys. Rev. E 84, 051401 (2011).
- (31) R. Okamoto and A. Onuki, Phys. Rev. E 88, 022309 (2013).
- (32) M. Labbé-Laurent, A. Law, and S. Dietrich, J. Chem. Phys. 147, 104701 (2017).
- (33) C. Hertlein, L. Helden, A. Gambassi, S. Dietrich, and C. Bechinger, Nature 451, 172 (2008).
- (34) A. Gambassi, A. Maciołek, C. Hertlein, U. Nellen, L. Helden, C. Bechinger, and S. Dietrich, Phys. Rev. E 80, 061143 (2009).
- (35) U. Nellen, L. Helden, C. Bechinger, EPL 88, 26001 (2009).
- (36) S. L. Veatch and S. L. Keller, Biochim. Biophys. Acta, Mol. Cell Res. 1746, 172 (2005).
- (37) D. Lingwood and K. Simons, Science 327, 46 (2010).
- (38) A. R. Honerkamp-Smith, P. Cicuta, M. D. Collins, S. L. Veatch, M. den Nijs, M. Schick, and S. L. Keller, Biophys. J. 95, 236 (2008); M. C. Heinrich, I. Levental, H. Gelman, P.A. Janmey, and T. Baumgart, J. Phys. Chem. B 112, 8063, 2008.
- (39) E. Gray, J. Karslake, B. B. Machta, and S. L. Veatch, Biophys. J. 105, 2751 (2013); B. B. Machta, E. Gray, M. Nouri, N. L. C. McCarthy, E. M. Gray, A. L. Miller, N. J. Brooks, and S. L. Veatch, Biophys. J. 111, 537 (2016); O. Kimchi and B. B. Machta, Biophys. J. 108, 437 (2015).
- (40) B. B. Machta, S. Papanikolaou, J. P. Sethna, and S. L. Veatch, Biophys. J. 100, 1668 (2011).
- (41) B. B. Machta, S. Veatch, and J. P. Sethna, Phys. Rev. Lett. 109, 138101 (2012).
- (42) J. Benet, F. Paillusson, and H. Kusumaatmaja, Phys. Chem. Chem. Phys. 14, 24188 (2017).
- (43) N. Gnan, E. Zaccarelli, and F. Sciortino, Nature Commun. 5, 3267 (2014).
- (44) T. Kirkpatrick, J. O. de Zárate, and J. Sengers, Phys. Rev. Lett. 115, 035901 (2015).
- (45) C. Cattuto, R. Britto, U. M. B. Marconi, F. Nori, and R. Soto, Phys. Rev. Lett. 96, 178001 (2006).
- (46) D. Ray, C. Reichhardt, and C. O. Olson Reichhardt, Phys. Rev. E 90, 013019 (2014).
- (47) R. Ni, M. A. C. Stuart, and P. G. Bolhuis, Phys. Rev. Lett. 114, 018302 (2015).
- (48) V. D. Nguyen, M. T. Dang, T. A. Nguyen, and P. Schall, J. Phys.: Condens. Matter 28, 04301 (2016).
- (49) A. Vrij, E. A. Nieuwenhuis, H. M. Fijnout, and W. G. M. Agtero, Faraday Disc. 65, 101 (1978).
- (50) J.-P. Hansen, J. Phys.: Condens. Matter 5, B117 (1993).
- (51) M. Dijkstra, R. van Roij, and R. Evans, Phys. Rev. Lett. 81, 2268 (1998); Phys. Rev E 59, 5744 (1999).
- (52) T. G. Mattos, L. Harnau, and S. Dietrich, J. Chem. Phys. 138, 074704 (2013).
- (53) T. G. Mattos, L. Harnau, and S. Dietrich, Phys. Rev. E 91, 042304 (2015).
- (54) H. Hobrecht and A. Hucht, Phys. Rev. E 92, 042315 (2015).
- (55) S. Paladugu, A. Callegari, Y. Tuna, L. Barth, S. Dietrich, A. Gambassi, and G. Volpe, Nature Comm. 7, 11403 (2016).
- (56) W. B. Russel, D. A. Saville, and W. R. Schowalter, Colloidal Dispersions (Cambridge University Press, Cambridge, 1989).
- (57) J.-P. Hansen and H. Löwen, Annu. Rev. Phys. Chem. 51, 209 (2000).
- (58) J.-L. Barrat and J.-P. Hansen, Basic concepts for simple and complex liquids (Cambridge University Press, Cambridge, 2003).
- (59) V. A. Parsegian, Van der Waals forces (Cambridge University Press, New York, 2006).
- (60) J. N. Israelachvili, Intermolecular and Surface Forces (Academic, London, 1998).
- (61) Y. Levin, Rep. Prog. Phys. 65, 1577 (2002).
- (62) M. N. Barber in Phase Transitions and Critical Phenomena, edited by C. Domb and J. L. Lebowitz (Academic, New York, 1983), Vol. 8, p. 145.
- (63) V. Privman, in Finite Size Scaling and Numerical Simulations of Statistical Systems, edited by V. Privman (World Scientific, Singapore, 1990), p. 1.
- (64) M. Krech and S. Dietrich, Phys. Rev. A 46, 1886 (1992).
- (65) A. Pelissetto and E. Vicari, Phys. Rep. 368, 549 (2002).
- (66) T. F. Mohry, A. Maciołek, and S. Dietrich, J. Chem. Phys. 136, 224902 (2012).
- (67) T. F. Mohry, A. Maciołek, and S. Dietrich, J. Chem. Phys. 136, 224903 (2012).
- (68) D. Bonn, J. Otwinowski, S. Sacanna, H. Guo, G. H. Wegdam, and P. Schall, Phys. Rev. Lett. 103, 156101 (2009).
- (69) A. Gambassi and S. Dietrich, Phys. Rev. Lett. 105, 059601 (2010).
- (70) T. F. Mohry, S. Kondrat, A. Maciołek, and S. Dietrich, Soft Matter 10, 5510 (2014).
- (71) V. D. Nguyen, S. Faber, Z. Hu, G. H. Wegdam, and P. Schall, Nature Commun. 4, 1584 (2013).
- (72) M. T. Dang, A. V. Verde, V. D. Nguyen, P. G. Bolhuis, and P. Schall, J. Chem. Phys. 139, 094903 (2013).
- (73) O. Zvyagolskaya, A. J. Archer, and C. Bechinger, EPL 96, 28005 (2011).
- (74) J. Chen and A. Anandarajah, J. Colloid Interface Sci. 180, 519 (1996).
- (75) Götzelmann, R. Evans, and S. Dietrich, Phys. Rev. E 57, 6785 (1998).
- (76) R. Roth, R. Evans, and S. Dietrich, Phys. Rev. E 62, 5360 (2000).
- (77) S. Buzzaccaro, J. Colombo, A. Parola, and R. Piazza, Phys. Rev. Lett. 105, 198301 (2010).
- (78) R. Piazza, S. Buzzaccaro, A. Parola, and J. Colombo, J. Phys.: Condens. Matter 23, 194114 (2011).
- (79) N. Gnan, E. Zaccarelli, P. Tartaglia, and F. Sciortino, Soft Matter 8, 1991 (2012).
- (80) R. Evans, Adv. Phys. 28, 143 (1979).
- (81) N. Kern and D. Frenkel, J. Chem. Phys. 118, 9882 (2003).
- (82) C. Hertlein, Messung kritischer Casimir-Kräfte mit TIRM, doctoral thesis, University of Stuttgart (2008); available at http://elib.uni-stuttgart.de/opus/volltexte/2008/3712/.
- (83) J. Y. Walz, Curr. Opin. Colloid Interface Sci. 2, 600 (1997).
- (84) D. C. Prieve, Adv. Colloid Interf. Sci. 82, 93 (1999).
- (85) P. B. Shelke, V. D. Nguyen, A. V. Limaye, and P. Schall, Adv. Mater. 25, 1499 (2013).
- (86) S. G. Stuij, M. Labbé-Laurent, T. E. Kogder, A. Maciołek, and P. Schall, Soft Matter 13, 5233 (2017).
- (87) H. W. Diehl, in Phase Transitions and Critical Phenomena, edited by C. Domb and J. L. Lebowitz (Academic, New York, 1986), Vol. 10, p. 76.
- (88) M. Krech, Casimir Effect in Critical Systems (World Scientific, Singapore, 1994); J. Phys.: Condens. Matter 11, R391 (1999).
- (89) J. G. Brankov, D. M. Dantchev, and N. S. Tonchev, The Theory of Critical Phenomena in Finite-Size Systems - Scaling and Quantum Effects (World Scientific, Singapore, 2000).
- (90) A. Gambassi, J. Phys.: Conf. Ser. 161, 012037 (2009).
- (91) T. W. Burkhardt and E. Eisenriegler, Phys. Rev. Lett. 74, 3189 (1995).
- (92) E. Eisenriegler and U. Ritschel, Phys. Rev. B 51, 13717 (1995).
- (93) D. Dantchev, F. Schlesener, and S. Dietrich, Phys. Rev. E 76, 011121 (2007).
- (94) G. Valchev and D. Dantchev, Phys. Rev. E 96, 022107 (2017).
- (95) A. Hanke, F. Schlesener, E. Eisenriegler, and S. Dietrich, Phys. Rev. Lett. 81, 1885 (1995).
- (96) S. Yabunaka and A. Onuki, arXiv:1708.08848v1.
- (97) F. Schlesener, A. Hanke, and S. Dietrich, J. Stat. Phys. 110, 981 (2003).
- (98) E. Eisenriegler and M. Stapper, Phys. Rev. B 50, 10009 (1994).
- (99) M. Hasenbusch, Phys. Rev. E 87, 022130 (2013).
- (100) J. B. Gilroy, T. Gädt, G. R. Whittell, L. Chabanne, J. M. Mitchels, R. M. Richardson, M. A. Winnik, and I. Manners, Nature Chem. 2, 566 (2010).
- (101) A. Walther, M. Drechsler, S. Rosenfeldt, L. Harnau, M. Ballauff, V. Abetz, and A. H. E. Müller, J. Am. Chem. Soc. 131, 4720 (2009).
- (102) K. Namba and G. Stubbs, Science 231, 1401 (1986).
- (103) Y. Zhao and J. Fang, Langmuir 22, 1891 (2006); J. Pérez-Juste, I. Pastoriza-Santos, L. M. Liz-Marzán, and P. Mulvaney, Coord. Chem. Rev. 249, 1870 (2005).
- (104) S. Kondrat, L. Harnau, and S. Dietrich, J. Chem. Phys. 131, 204902 (2009).
- (105) M. Tröndle, S. Kondrat, A. Gambassi, L. Harnau, and S. Dietrich, EPL 88, 40004 (2009); M. Tröndle, S. Kondrat, A. Gambassi, L. Harnau, and S. Dietrich, J. Chem. Phys. 133, 074702 (2010).
- (106) M. Labbe-Laurent, M. Tröndle, L. Harnau, and S. Dietrich, Soft Matter 10, 2270 (2014).
- (107) M. Labbe-Laurent and S. Dietrich, Soft Matter 12, 6621 (2016).
- (108) A. Walther, M. Drechsler, S. Rosenfeldt, L. Harnau, M. Ballauff, V. Abetz, and A. H. E. Müller, J. Am. Chem. Soc. 131, 4720 (2009); N. Prasad, J. Perumal, C.-H. Choi, C.-S. Lee, and D.-P. Kim, Adv. Funct. Mater. 19, 1656 (2009); G.-R. Yi, D. J. Pine, and S. Sacanna, J. Phys.: Condens. Matter 25, 193101 (2013).
- (109) F. Sciortino, A. Giacometti, and G. Pastore, Phys. Rev. Lett. 6, 2510 (2009); L. Hong, A. Cacciuto, E. Luijten, and S. Granick, Nano Lett. 6, 2510 (2006).
- (110) W. Li, Y. Liu, G. Brett, and J. D. Gunton, Soft Matter 8, 6027 (2012); Y. Liu, W. Li, T. Perez, J. D. Gunton, and G. Brett, Langmuir 28, 3 (2012).
- (111) L. Viry, C. Mercader, P. Miaudet, C. Zakri, A. Derre, A. Kuhn, M. Maugey, and P. Poulin, J. Mater. Chem. 20, 3487 (2010); K. Jiang, J. Wang, Q. Li, L. Liu, C. Liu, and S. Fan, Adv. Mater. 23, 1154 (2011).
- (112) Y. Iwashita and Y. Kimura, Soft Matter 9, 10694 (2013).
- (113) Y. Iwashita and Y. Kimura, Soft Matter 10, 7170 (2014).
- (114) E. Eisenriegler, J. Chem. Phys. 121, 3299 (2004).
- (115) G. Bimonte, T. Emig, and M. Kardar, EPL 104, 2101 (2013).
- (116) M. E. Fisher and P. J. Upton, Phys. Rev. Lett. 65, 2402 (1990); ibid 3405 (1990).
- (117) M. E. Fisher and H. Au-Yang, Physica A 101, 255 (1980).
- (118) Z. Borjan and P. J. Upton, Phys. Rev. Lett. 81, 4911 (1998).
- (119) Z. Borjan and P. J. Upton, Phys. Rev. Lett. 101, 125702 (2008).
- (120) R. Okamoto and A. Onuki, J. Chem. Phys. 136, 114704 (2012).
- (121) K. K. Mon, Phys. Rev. B 39, 467 (1989); K. K. Mon and K. Binder, Phys. Rev. B 42, 675 (1990).
- (122) H. Hobrecht and A. Hucht, EPL 106, 56005 (2014).
- (123) A. O. Vasilyev, Phys. Rev. E 90, 012138 (2014).
- (124) C. H. Bennet, J. Comput. Phys. 22, 245 (1976).
- (125) J. R. Edison, N. Tasios, S. Belli, R. Evans, R. van Roij, and M. Dijkstra, Phys. Rev. Lett. 114, 038301 (2015).
- (126) N. Tasios, J. R. Edison, R. van Roij, R. Evans, and M. Dijkstra, J. Chem. Phys. 145, 084902 (2016).
- (127) E. Rabani, D. R. Reichman, P. L. Geissler, and L. E. Brus, Nature 426, 271 (2003).
- (128) J. R. Errington, Phys. Rev. E 67, 012102 (2003).
- (129) R. H. Swendsen and J. S. Wang, Phys. Rev. Lett. 58, 86 (1987).
- (130) U. Wolff, Phys. Rev. Lett. 62, 361 (1989).
- (131) D. P. Landau and K. Binder, A Guide to Monte Carlo Simulations in Statistical Physics 3rd edition (Cambridge University Press 2009).
- (132) J. R. Heringa and H. W. J. Blöte, Phys. Rev E 59, 4976 (1989).
- (133) B. Derjaguin, Kolloid Zeitschrift 69, 155 (1934).
- (134) M. Krech, Phys. Rev. E 56, 1642 (1997).
- (135) O. Vasilyev, A. Gambassi, A. Maciołek, and S. Dietrich, EPL 80, 60009 (2007).
- (136) O. Vasilyev, A. Gambassi, A. Maciołek, and S. Dietrich, Phys. Rev. E 79, 041142 (2009).
- (137) M. Hasenbusch, Phys. Rev. B 85, 174421 (2012).
- (138) M. Hasenbusch, Phys. Rev. B 82, 104425 (2010); ibid 85, 174421 (2012).
- (139) F. Parisen Toldin and S. Dietrich, J. Stat. Mech.: Theory and Experiment, P11003 (2010); F. Parisen Toldin, M. Tröndle, and S. Dietrich, Phys. Rev. E 88, 052110 (2013).
- (140) M. Hasenbusch, Phys. Rev. E 91, 022110 (2015).
- (141) O. Vasilyev, A. Maciołek, and S. Dietrich, Phys. Rev. E 84, 041605 (2011).
- (142) M. Hasenbusch, Phys. Rev. B 83, 134425 (2011).
- (143) T. F. Mohry, A. Maciołek, and S. Dietrich, Phys. Rev. E 81, 061117 (2010).
- (144) O. A. Vasilyev and S. Dietrich, EPL 104, 60002 (2013).
- (145) P. Anzini and A. Parola, Phys. Rev. E 94, 052113 (2016).
- (146) R. Leidl and H. Wagner, J. Chem. Phys. 98, 4142 (1998).
- (147) P. Tarazona, Phys. Rev. A 31, 2672 (1985).
- (148) W. A. Curtin and N. W. Ashcroft, Phys. Rev. A 32, 2909 (1985).
- (149) A. Parola and L. Reatto, Adv. Phys. 44, 2909 (1995).
- (150) M. Fukuto, Y. F. Yano, and P. Pershan, Phys. Rev. Lett. 94, 135702 (2005).
- (151) S. Rafaï, D. Bonn, and J. Meunier, Physica A 386, 31 (2007).
- (152) R. Evans, and J. Stecki, Phys. Rev. B 49, 8842 (1994).
- (153) D. B. Abraham and A. Maciołek, Phys. Rev. Lett. 105, 055701 (2010).
- (154) D. B. Abraham and A. Maciołek, EPL 101, 2006 (2013).
- (155) S. Fisk and B. Widom, J. Chem. Phys. 50, 3219 (1969).
- (156) N. Gnan, E. Zaccarelli, and F. Sciortino, J, Chem. Phys. 137, 084903 (2012).
- (157) N. Fuchs, Z. Phys. Chem. 171, 199 (1934).
- (158) J. P. Hansen and I. R. McDonald, Theory of Simple Liquids (Academic, London, 1986).
- (159) C. Caccamo, Phys. Rep. 274, 1 (1996).
- (160) G. A. Vliegenthart and H. N. W. Lekkerkerker, J. Chem. Phys. 112, 5364 (2000).
- (161) M. G. Noro and D. Frenkel, J. Chem. Phys. 113, 2941 (2000).
- (162) R. J. Baxter, J. Chem. Phys. 49, 2770 (1968).
- (163) H. C. Andersen, J. D. Weeks, and D. Chandler, Phys. Rev. A 4, 1597 (1971).
- (164) (a) J. Largo and N. B. Wilding, Phys. Rev. E 73, 036115 (2006); (b) G. Foffi and F. Sciortino, Phys. Rev. E 74, 050401(R) (2006); (c) P. Orea and Y. Duda, J. Chem. Phys. 128, 134508 (2008); (d) D. Gazzillo, J. Chem. Phys. 134, 124504 (2011).
- (165) R. J. L. Andon and J. D. Cox, J. Chem. Soc., 4601 (1952); J. D. Cox, J. Chem. Soc., 4606 (1952).
- (166) B.V. Prafulla, T. Narayanan, and A. Kumar, Phys. Rev. A 46, 7456 (1992).
- (167) M. Schmidt and A. R. Denton, Phys. Rev. E 65, 021508 (2002).
- (168) M. Schmidt, J. Phys.: Condens. Matter 23, 415101 (2011).
- (169) D. Mukamel and M. Blume, Phys. Rev. A 10, 610 (1974); J. Sivardière and J. Lajzerowicz, Phys. Rev. A 11, 2090 (1975).
- (170) A. Hanke and S. Dietrich, Phys Rev. E 59, 5081 (1999); G. Flöter and S. Dietrich, Z. Phys. B 97, 213 (1995).
- (171) R. Evans, R. J. F. Leote de Carvalho, J. R. Henderson, and D. C. Hoyle, J. Chem. Phys. 100, 591 (1994).
- (172) N. Tasios and M. Dijkstra, J. Chem. Phys. 146, 134903 (2017).
- (173) J. R. Edison, S. Belli, R. Evans, R. van Roij, and M. Dijkstra, Mol. Phys. 113, 2546 (2015).
- (174) A. Santos, M. López de Haro, and S. Bravo Yuste, J. Chem. Phys. 103, 4622 (1995).
- (175) D. A. Young and B. J. Alder, J. Chem. Phys. 70, 473 (1979).
- (176) H. Guo, T. Narayanan, M. Sztuchi, P. Schall, and G. H. Wegdam, Phys. Rev. Lett. 100, 188303 (2008).
- (177) F. Pousaneh and A. Ciach, J. Phys.: Condens. Matter 23, 412101 (2011); M. Bier, A. Gambassi, M. Oettel, and S. Dietrich, EPL 95, 60001 (2011); F. Pousaneh, A. Ciach, and A. Maciołek, Soft Matter 8, 3567 (2012).
- (178) U. Nellen, J. Dietrich, L. Helden, S. Chodankar, K. Nygard, J. F. van der Veen, and C. Bechinger, Soft Matter 7, 5360 (2011).
- (179) D. Frenkel and B. Smit, Understanding Molecular Simulations: From Algorithms to Applications, 2nd ed. (Academic, San Diego, CA, 2001).
- (180) D. A. Kofke, J. Chem. Phys. 98, 4149 (1993).
- (181) C. M. Sorensen and G. A. Larsen, J. Chem. Phys. 83, 1835 (1985).
- (182) H. C. Burstyn, J. V. Sengers, J. K. Bhattacharjee, and R. A. Ferrell, Phys. Rev. A 28, 1567 (1983); H. C. Burstyn, and J. V. Sengers, Phys. Rev. A 25, 448 (1982).
- (183) S. K. Das, J. V. Sengers, and M. E. Fisher, J. Chem. Phys. 127, 144506 (2007).
- (184) K. Kawasaki, in Phase Transitions and Critical Phenomena, edited by C. Domb and J. L. Lebowitz (Academic, New York, 1986), Vol. 5A, p. 165.
- (185) A. Oleinikova, L. Bulavin, and V. Pipich, Int. J. Thermophys. 20, 889 (1999).
- (186) A. C. Newton, T. A. Nguyen, S. J. Veen, D. J. Kraft, P. Schall, and P. G. Bolhuis, Soft Matter 13, 4903 (2017).
- (187) D. Chandler and H. C. Andersen, J. Chem. Phys. 57, 1930 (1972).
- (188) L. S. Ornstein and F. Zernike, Proc. Acad. Sci. Amsterdam 17, 793 (1914).
- (189) E. Marino, T. E. Kodger, J. Bart ten Hove, A. H. Veders, and P. Schall, Solar Energy Materials and Solar Cells 158, 154 (2016).
- (190) F. Soyka, O. Zvyagolskaya, C. Hertlein, L. Helden, C. Bechinger, Phys. Rev. Lett. 101, 208301 (2008).
- (191) M. Tröndle, O. Zvyagolskaya, A. Gambassi, D. Vogt, L. Harnau, C. Bechinger, and S. Dietrich, Mol. Phys. 109, 1169 (2011).
- (192) T. A. Nguyen, A. Newton, S. J. Veen, D. J. Kraft, P. G. Bolhuis, and P. Schall, Adv. Mater. 29, 1700819 (2017).
- (193) T. A. Nguyen, A. Newton, D. J. Kraft, P. G. Bolhuis, and P. Schall, Materials (Basel) 10, 1265 (2017).
- (194) S. J. Veen, O. Antoniuk, B. Weber, M. A. C. Potenza, S. Mazzoni, P. Schall, and G. H. Wegdam, Phys. Rev. Lett. 109, 248302 (2012).
- (195) M. A. C. Potenza, A. Manca, S. J. Veen, B. Weber, S. Mazzoni, P. Schall, and G. H. Wegdam, EPL 106, 68005 (2014).
- (196) J. R. Dutcher and A. G. Maragoni, Soft Materials: Structure and Dynamics (Marcel Dekker, New York, 2004).
- (197) W. van Saarloos, Physica 147A, 280 (1987).
- (198) M. Carpineti and M. Giglio, Phys. Rev. Lett. 68, 3327 (1992).
- (199) T. A. Witten and L. M. Sander, Phys. Rev. B 27, 5686 (1983); P. Meakin, J. Colloid Interface Sci. 102, 491 (1984).
- (200) M. E. Fisher and R. J. Burford, Phys. Rev. 156, 583 (1967).
- (201) M. Y. Lin, H. M. Lindsay, D. A. Weitz, R. Klein, R. C. Ball, and P. Meakin, Phys. Rev. A 41, 2005 (1990)
- (202) N. A. Garcia, N. Gnan, and E. Zaccarelli, Soft Matter 13, 6051 (2017).
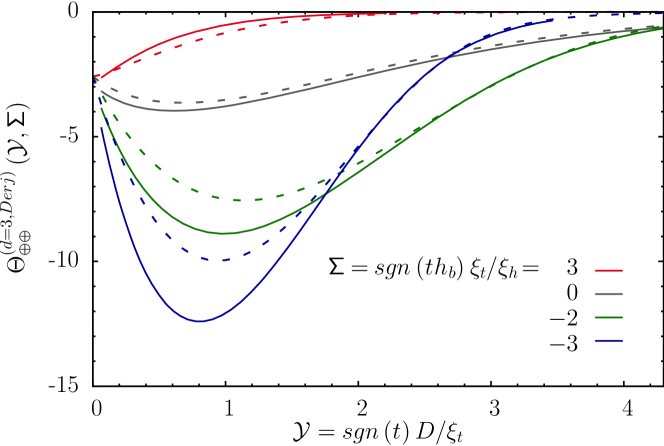
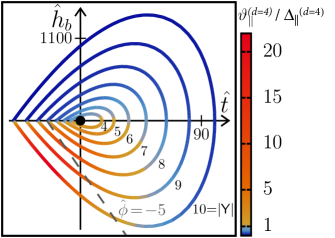
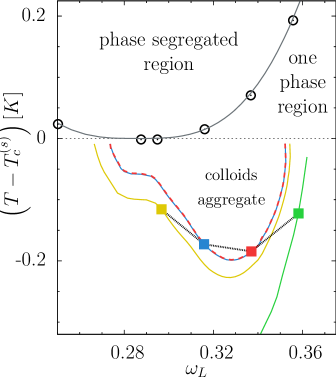
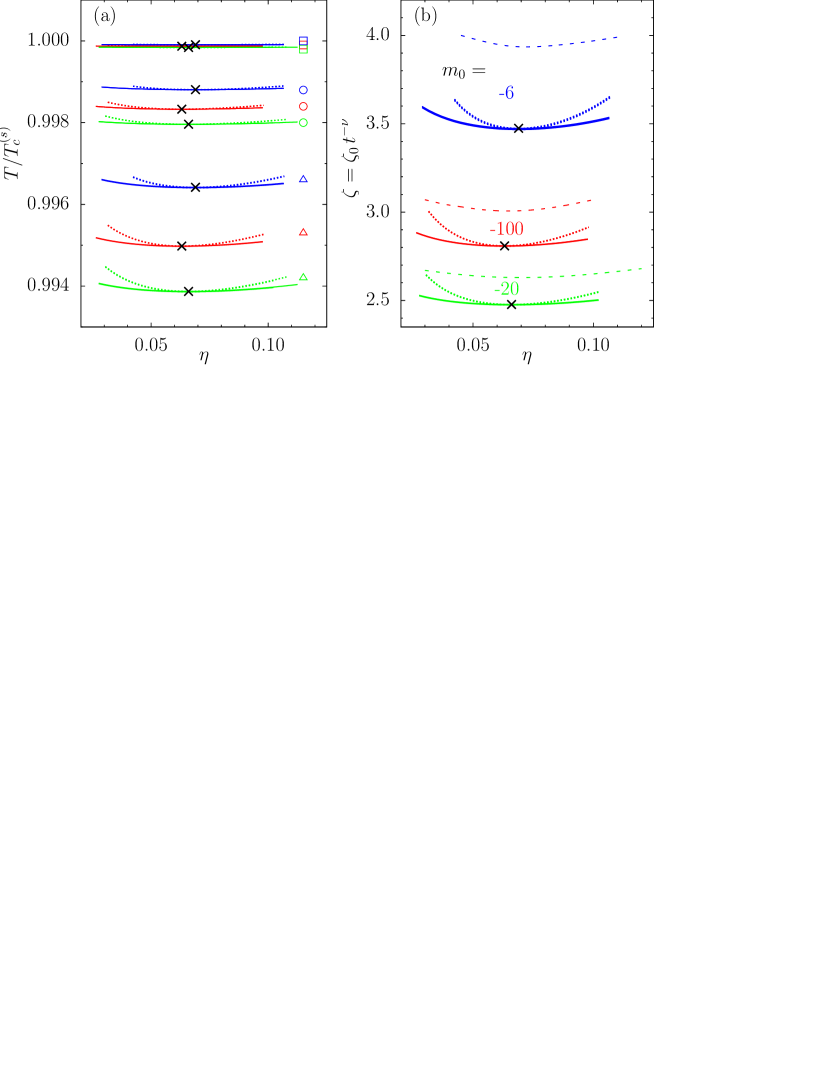
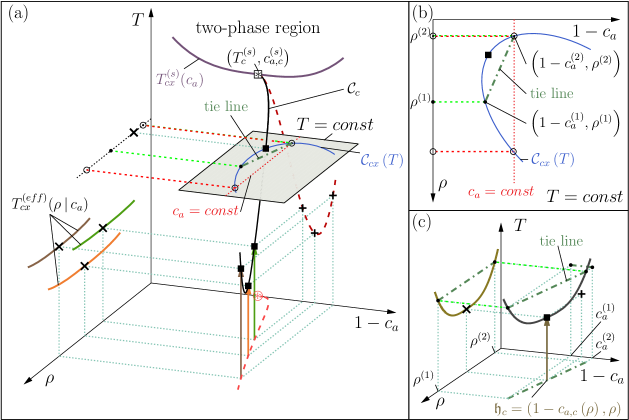
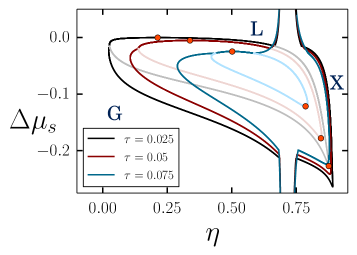
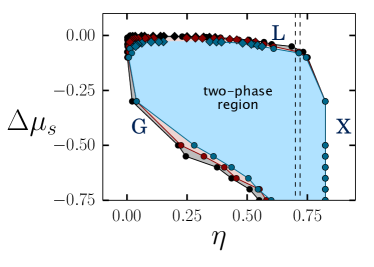
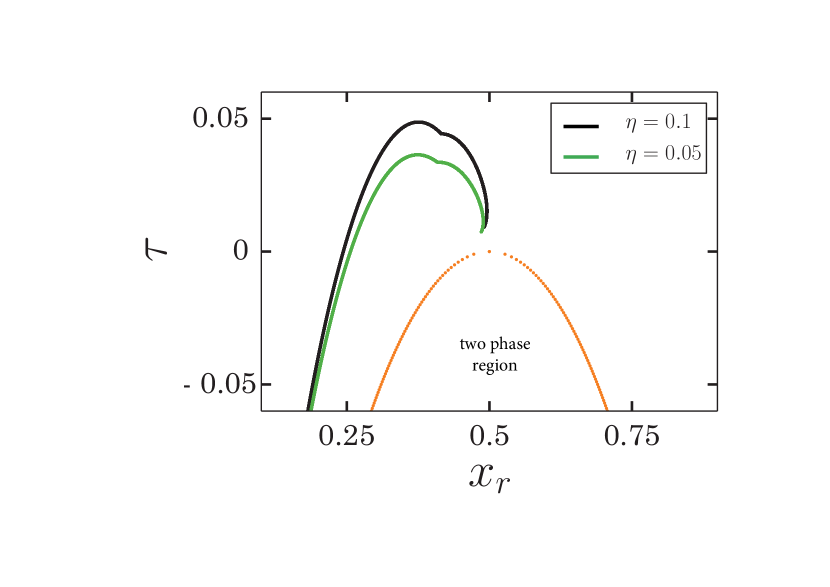
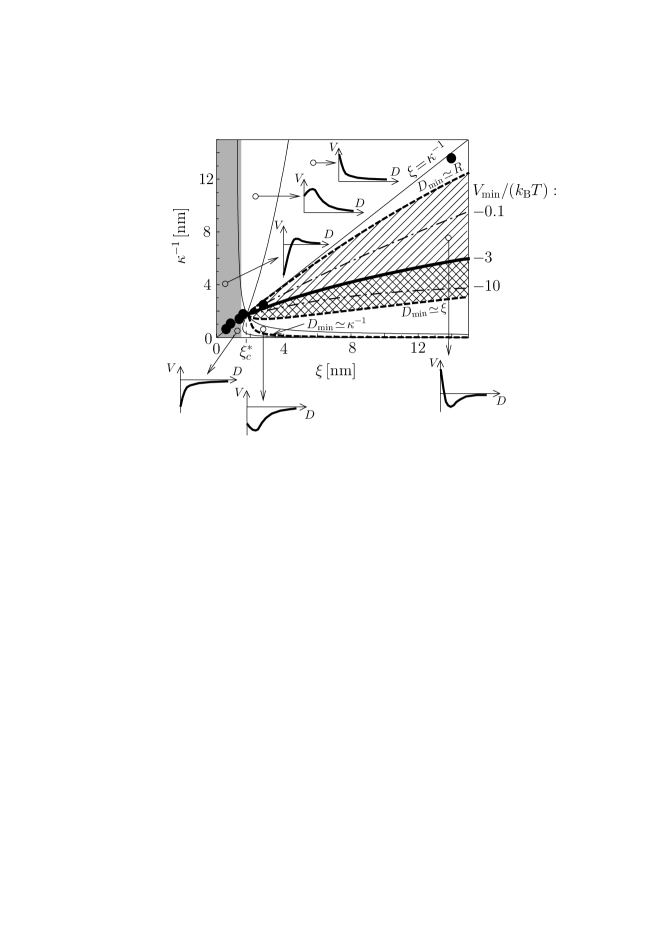
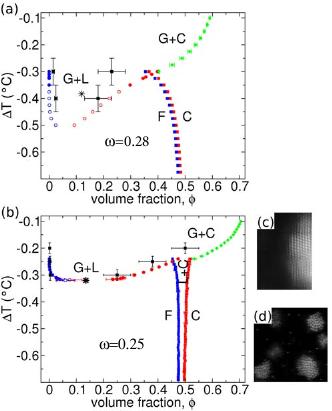
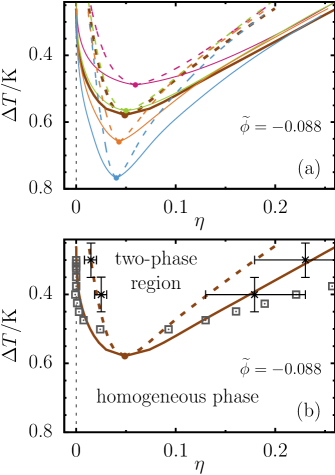
(a)
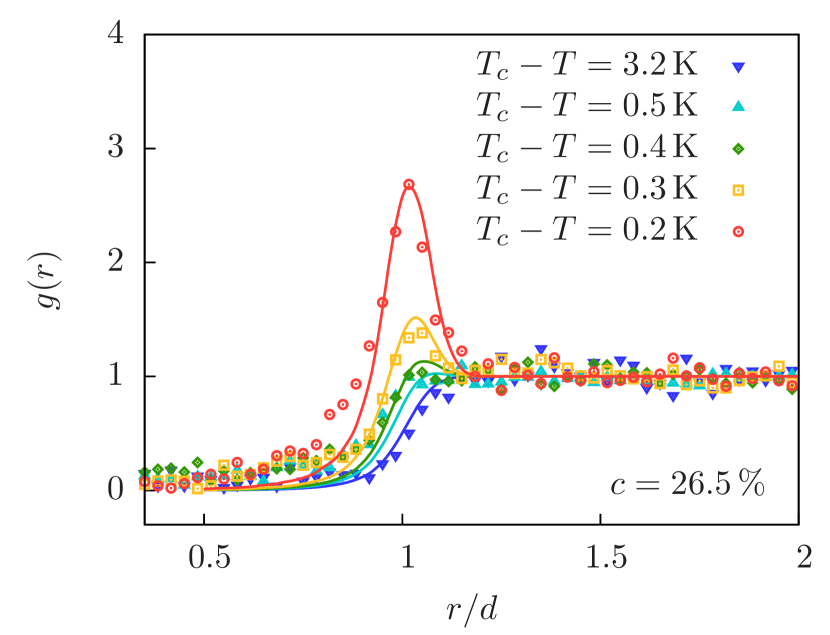
(b)
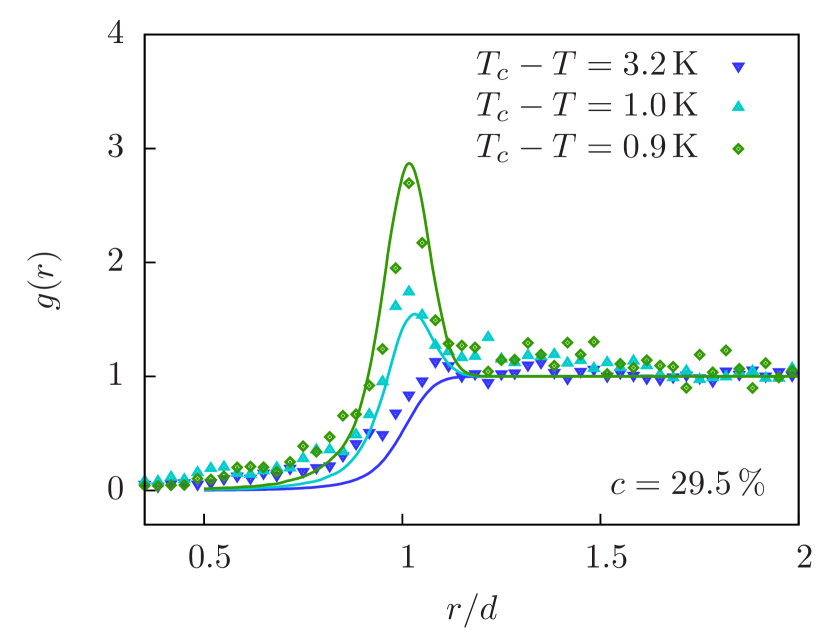
(c)
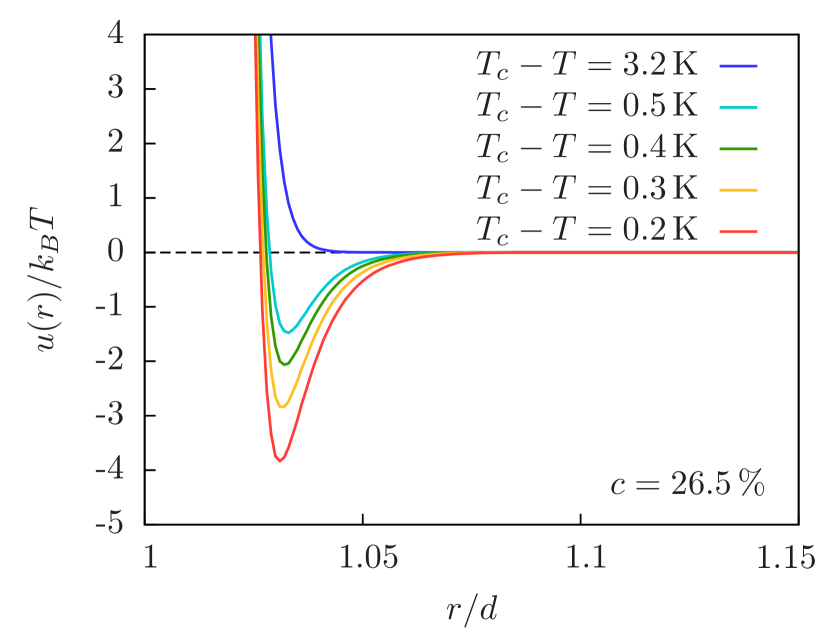
(d)
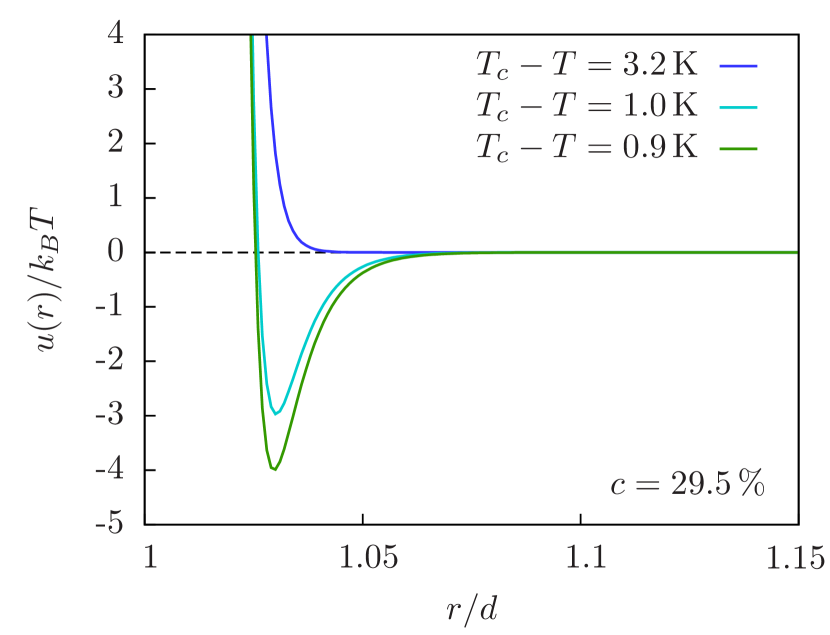
(a) (b)
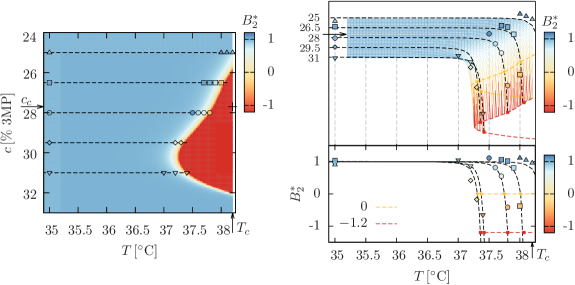
(c)