Simultaneous multiwavelength observations of V404 Cygni during its 2015 June outburst decay strengthen the case for an extremely energetic jet-base
Abstract
We present results of multiband optical photometry of the black hole X-ray binary system V404 Cyg obtained using Wheaton College Observatory’s 0.3m telescope, along with strictly simultaneous INTEGRAL and Swift observations during 2015 June 25.15–26.33 UT, and 2015 June 27.10–27.34 UT. These observations were made during the 2015 June outburst of the source when it was going through an epoch of violent activity in all wavelengths ranging from radio to -rays. The multiwavelength variability timescale favors a compact emission region, most likely originating in a jet outflow, for both observing epochs presented in this work. The simultaneous INTEGRAL/Imager on Board the Integral Satellite (IBIS) 20–40 keV light curve obtained during the June 27 observing run correlates very strongly with the optical light curve, with no detectable delay between the optical bands as well as between the optical and hard X-rays. The average slope of the dereddened spectral energy distribution was roughly flat between the - and -bands during the June 27 run, even though the optical and X-ray flux varied by 25 during the run, ruling out an irradiation origin for the optical and suggesting that the optically thick to optically thin jet synchrotron break during the observations was at a frequency larger than that of -band, which is quite extreme for X-ray binaries. These observations suggest that the optical emission originated very close to the base of the jet. A strong H emission line, probably originating in a quasi-spherical nebula around the source, also contributes significantly in the -band. Our data, in conjunction with contemporaneous data at other wavelengths presented by other groups, strongly suggest that the jet-base was extremely compact and energetic during this phase of the outburst.
1 Introduction
Outbursts of transient X-ray binary (XRB) systems offer unique opportunities to study accretion flows and outflows near compact stellar remnants such as black holes and neutron stars. Given that the duration of an XRB outburst is typically weeks to months, during which the luminosity can vary by many orders of magnitude, dense multiwavelength observations during such outbursts offer a window through which to study poorly understood aspects of accretion processes in strong-field gravity such as changes in the accretion flow and the flow’s geometry, dominant emission mechanisms, and disk–jet coupling.
The XRB system V404 Cyg, located at a parallax distance of kpc (Miller-Jones et al., 2009), harbors a M⊙ black hole accretor and a M⊙ donor of K3 III spectral type (Shahbaz et al., 1994; Khargharia et al, 2010). The orbital period of the system is 6.5 days (Casares et al., 1992) and near-infrared (NIR) spectroscopic observations by Khargharia et al (2010) indicate an orbital inclination of with respect to our line of sight (however, see also Cantrell et al., 2010, for a discussion on how changes in the quiescent light curve morphology and/or uncertainty in the disk-to-total flux ratio can affect mass and inclination measurements). The orbital period of V404 Cyg is significantly larger than that of most black hole XRBs discovered so far (see, e.g. Corral-Santana et al., 2016; Tetarenko et al., 2016, for recent compilations of properties of XRBs). It has been speculated that the large orbital period and consequently large size of the accretion disk may at least be partly responsible for the violent outbursts of V404 Cyg (Kimura et al., 2016). In contrast, outbursts of typical transient XRB systems go through a fast-rise and exponential-decay (FRED) light curve morphology (see Chen et al., 1997, for a review) that is thought to be driven by instabilities in the accretion disk (Lasota, 2001).
After 26 years of inactivity (Rana et al., 2016) V404 Cyg went through a violent outburst starting 2015 mid-June, when enhanced hard X-ray activity was noticed by the Burst Alert Telescope (BAT) on board the Swift mission (Barthelmy et al., 2015). Reports of detections at other wavelengths spanning from radio to -rays followed soon after, triggering pointed observations using numerous space-borne as well as ground-based telescopes (see Sivakoff et al., 2015, for a list of circulars and telegrams covering this outburst)111An expanded list of multi-wavelength observations made during the outburst is available at http://deneb.astro.warwick.ac.uk/phsaap/v404cyg/data/.
As in the previous outburst of V404 Cyg in 1989, strong and rapid variability at all wavelengths was observed during the 2015 June outburst, manifested by dramatic changes in flux within timescales of minutes to seconds. Hard X-ray flares with luminosities exceeding 6 Crab were observed with INTEGRAL (Rodriguez et al., 2015). Analyzing the INTEGRAL observations made between 2015 June 17–20, Natalucci et al. (2015) and Roques et al. (2015) reported highly variable Compton-upscattered hard X-ray emission with seed photons that likely originated in a synchrotron-driven jet. Analysis of Fermi Gamma-Ray Burst Monitor (GBM) data from V404 Cyg during the outburst by Jenke et al. (2016), where the source reached up to 30 Crab with emission detected as high as 300 keV, also supports a jet component in the observed emission. Walton et al. (2017), using NuSTAR observations, established that the X-ray emission region should be quite compact. Their modeling suggests that an intense source of X-rays lies only a few (10) gravitational radii above the black hole, and that this region serves as a “lamp post” illuminating the accretion disk below to produce the strong reflection features. They interpret this as likely indicating that the X-rays come from a jet. This is certainly a viable possibility, but we emphasize that there is no direct evidence that the X-ray emission comes from a bipolar outflow, rather than a compact inflowing region. Modeling of the 0.6–250 keV X-ray spectrum obtained on MJD 57194 from strictly simultaneous Swift and INTEGRAL observations, Motta et al. (2017) supported strong reflection as well. Motta et al. (2017) also argued for significant absorption and obscuration, akin to spectral features seen in highly accreting but obscured active galactic nuclei. Analyzing 602 spectra in the energy range 20–200 keV obtained by INTEGRAL Imager on Board the Integral Satellite (IBIS/ISGRI) throughout the outburst, Sánchez-Fernández et al. (2017) found evidence for variable absorption as well, with the absorbing column becoming Compton thick between flares. These authors conclude that the flaring activity may not be solely due to intrinsic variability of the emission source, but may also be due to changes in the absorbing column and/or scattering. We note that such highly variable absorption is also atypical of most XRBs, and perhaps seen only in sources like V404 Cyg and V4641 Sgr (see, e.g. Maitra & Bailyn, 2006) which exhibit extremely violent activity during outbursts.
At higher energies, Siegert et al. (2016) reported detection of a positron annihilation line near 511 keV with INTEGRAL, suggesting a compact, energetic region where the optical depth to pair production was non-negligible. The AGILE satellite detected 50–400 MeV -ray emission from V404 Cyg between MJD 57197.25–57199.25 at 4.3 level (Piano et al., 2017). An excess 0.1–100 GeV -ray emission from the direction of V404 Cyg by the Fermi Large Area Telescope (LAT) was detected on MJD 57199 (Loh et al., 2016). These -ray detections strengthen the argument for the existence of a jet in V404 Cyg. At the other end of the electromagnetic spectrum, the source was highly active in radio through sub-mm wavelengths as well (see e.g. Tetarenko et al., 2017, and references therein). Multiple Jansky-level flares were observed during a 4 hr observing window on MJD 57195, in eight frequency bands ranging from 5 GHz to 666 GHz. Simultaneous modeling of these radio light curves suggests multiple ejection events at relativistic speeds (Tetarenko et al., 2017).
Softer (10 kev) X-ray spectra obtained using Chandra HETGS on 2015 June 22 and 23 showed strong, narrow lines due to various species of Mg, Si, S, and Fe (King et al., 2015). Analyzing these lines, King et al. (2015) inferred that the central engine is obscured and the outer accretion disk is illuminated. As noted above, modeling of the broadband X-ray spectra during the outburst also supports variable, and often Compton-thick, absorption (Sánchez-Fernández et al., 2017; Motta et al., 2017). Additionally, King et al. (2015) noted the presence of strong disk winds, based on observed P-Cygni profiles, during epochs of highest flux. P-Cygni profiles were observed not only in soft X-rays, but also in optical spectra obtained during this outburst, suggesting a strong outflow from the cooler, outer accretion disk (Muñoz-Darias et al., 2016). Based on estimates of the mass-loss rate due to the wind, Muñoz-Darias et al. (2016) have suggested that the brief but violent epochs of activity of XRB transients with large accretion disks (such as V404 Cyg, V4641 Sgr, GRS 1915+105) may be regulated by these strong winds, which can deplete the disk mass and bring the outburst to a halt. Analyzing Swift/X-Ray Telescope (XRT) + BAT data in the 0.5–150 keV range, Radhika et al. (2016) also inferred the presence of a wind outflow and a possible short-term depletion of the inner accretion disk before a massive radio flare.
Optical spectra obtained during the outburst by Muñoz-Darias et al. (2016), Gandhi et al. (2016), and Rahoui et al. (2017) indicate that the equivalent widths of the optical emission lines became extremely large after MJD 57200. In particular, Muñoz-Darias et al. (2016) reported H equivalent widths up to 2000 Å on MJD 57201, and Rahoui et al. (2017) reported an H equivalent width of 1129Å on MJD 57200. Furthermore, a multitude of emission lines from different species appeared after MJD 57200, and the H-to-H flux ratio increased from 2.5 to 6. These changes in the optical spectra led Muñoz-Darias et al. (2016) to suggest that a short-lived nebular phase was triggered around this time.
Tanaka et al. (2016) observed V404 Cyg at various epochs between MJD 57190–57194 and did not find any evidence of intrinsic optical or NIR linear polarization, or any significant change in the amount of polarization or the polarization position angle. However, observations made between MJD 57191.62–57191.84 using the MASTER robotic telescope network showed a 4%–6% change in the optical linear polarization (Lipunov et al., 2016). As shown in Fig. 1 of Lipunov et al. (2016), the polarization change is anticorrelated with flux change. A similar, though smaller (1%), change in the amount of polarization was also noted by Shahbaz et al. (2016) between MJD 57197.12 and 57197.2.
While the most active phase of this outburst lasted only for about a couple of weeks, low-level activity continued for a couple of months. Based on Swift monitoring data, Sivakoff et al. (2015) estimated that the source activity declined back to quiescence sometime between 2015 August 5 and August 21. The radio and X-ray decay of this outburst into quiescence has been studied by Plotkin et al. (2017).
In the context of these results, we were interested in understanding the origin of the optical emission. While the optical emission during high (mass accretion rate) epochs of a typical XRB outburst is usually thermal-dominated, a non-thermal component sometime appears during epochs of low and hard X-ray spectral state (Russell et al., 2013b). In sources such as GRS 1915+105 and XTE J1550-564, the optical and NIR occasionally also reveals the presence of a non-thermal component during extreme flaring events (Buxton et al., 2012; Russell et al., 2010). In this paper we focus on ground-based optical observations made in the -, -, and -bands during 2015 June 25 and 27. We also present the INTEGRAL/IBIS (20-40 keV), Swift/XRT (0.3-10 keV), and Swift/Ultraviolet and Optical Telescope (UVOT) U-band light curves that are strictly simultaneous with our observations, and the corresponding time-series auto- and cross-correlation analyses of our ground-based data as well as INTEGRAL data. The observation details and data reduction process are detailed in §2, data analysis is presented in §3, and we discuss our conclusions in §4.
2 Observations and data reduction
2.1 Wheaton College Observatory data of V404 Cyg
V404 Cyg was observed using Wheaton College Observatory’s (WCO; located in Norton, Massachusetts, USA; latitude = 41965617 N, longitude = 71184063 W, altitude = 40m) 0.3m Meade LX600-ACF Schmidt-Cassegrain reflector telescope during the nights of 2015 June 25-26 local time (MJD 57198), and June 27-28 local time (MJD 57200). The telescope is equipped with an SBIG STT-8300M charge-coupled device (CCD) detector (operated at -20C during our observations) and standard Johnson-Cousins , , , , and filters.
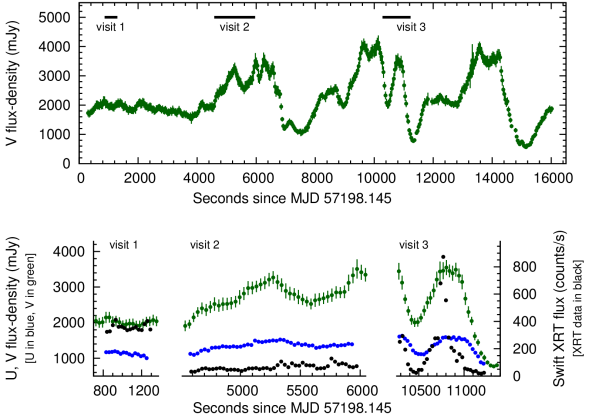
During the first night (MJD 57198) we repeatedly obtained 30s exposures in the -band. A 5s delay between successive exposures was programmed to ensure CCD readout. This was continued throughout the night, with the exception of a few 1-2 minute-long interruptions to remove condensation on the telescope’s corrector plate. Since images of V404 Cyg and the reference stars in the field of view are equally affected by condensation, our results obtained using differential photometry are not affected. Preliminary photometric results from this night’s observing run were reported in Scarpaci & Maitra (2015). Standard optical data reduction processes (bias correction, dark subtraction, and flat-fielding) were done using astroImageJ v3.0.0 (Collins et al., 2017). Three field stars with AAVSO Unique Identifiers 000-BCL-467, 000-BCL-468, and 000-BCL-455 were used to carry out differential photometry of V404 Cyg, using Aperture Photometry Tool v2.4.7 (Laher et al., 2012). The final -band light curve, after correcting for interstellar reddening and contribution from a blended interloper (see §3 below for details), is shown by green points in Fig. 1.
This observing run on MJD 57198 coincided with three Swift observations of V404 Cyg. The periods of Swift overlap are shown by horizontal lines near the top of Fig. 1. The Swift XRT 0.5–10 keV and the UVOT U-band light curves, along with simultaneous WCO -band light curve, are shown in the bottom three subpanels of Fig. 1. A summary of the observation logs is presented in Table 1.
During the second night (MJD 57200) we cycled through the -, -, and -band filters throughout the night. Preliminary photometric results from this night’s observing run were reported in Scarpaci et al. (2015). As in the first night, we initially started with 30s exposures in all three bands, but had to increase the integration times as the source started to fade dramatically after local midnight. During the latter part of the night, the -band exposures were five minutes each, and the - and -band exposures were one minute each.
As indicated in Table 1, this observing run on MJD 57200 fully coincided with INTEGRAL revolution number 1557, when INTEGRAL was observing V404 Cyg as well. The , , light curves and simultaneous INTEGRAL/IBIS light curves are shown in Fig. 2.
| Observation Date | Observation Duration | Instrument and | Remarks |
|---|---|---|---|
| (UT) | (MJD) | Bandpass Analyzed | |
| 2015 Jun 25 | 57198.148 – 57198.330 | WCO 0.3m; V-band | 440 exposures throughout the night, each 30s duration |
| 2015 Jun 25 | 57198.155 – 57198.160 | Swift; XRT & UVOT U-band | ObsID:00031403057, visit I |
| 2015 Jun 25 | 57198.198 – 57198.214 | —”— | ObsID:00031403057, visit II |
| 2015 Jun 25 | 57198.264 – 57198.275 | —”— | ObsID:00031403057, visit III |
| 2015 Jun 27 | 57200.100 – 57200.340 | 0.3m; VRI cycled | 64 -band, 66 -band, and 65 -band images |
| with 30–300s exposures depending on source brightness | |||
| 2015 Jun 27 | 57200.000 – 57200.947 | INTEGRAL; IBIS 20–40 keV | REV 1557, Observation:1270003/0001 |
2.2 Swift and INTEGRAL observations strictly simultaneous with WCO
While both the INTEGRAL and Swift missions observed V404 Cyg extensively during the outburst, a full analysis of the entire data set is beyond the scope (and focus) of this current work. In order to compare with our optical observations, in this work we only analyze INTEGRAL’s IBIS (Ubertini et al., 2003) 20–40 keV data, Swift’s XRT (Burrows et al., 2005) light curve in 0.5–10 keV range, and the U-band light curve obtained using Swift’s UVOT (Roming et al., 2005; Poole et al., 2008), that are strictly simultaneous with our WCO observations. This includes three Swift visits to V404 Cyg on MJD 57198 under ObsID: 00031403057 and the INTEGRAL observations made during REV 1557 on MJD 57200.
Because the source was very bright, the XRT was operated in windowed-timing (WT) mode. The data extraction and reduction were performed using the HEASOFT software (v6.17; NASA HEASARC, 2014) developed and maintained by NASA’s High Energy Astrophysics Science Archive Research Center (HEASARC). We followed the extraction steps outlined in Reynolds & Miller (2013), and we refer the reader to that paper for greater details about the XRT and UVOT data reduction. In summary, the raw XRT data were reprocessed using the xrtpipeline tool in order to ensure that the latest instrument calibrations and responses were used. Because the XRT data were collected in WT mode, events were extracted from a rectangular region containing the source. Neighboring source-free regions were used to extract the background properties. For the UVOT U-band data, the pipeline-processed level II images were used. These images were aspect-corrected using the uvotskycorr tool, and then the source flux was extracted from a 5″ aperture centered on the source. The background was extracted from a neighboring source-free region. Note that the 5″ aperture radius for the source implies that this also includes the light from the blended interloper, as in the case of the WCO observations. The count-rate to flux-density conversion for the UVOT U-band data was carried out using the appropriate multiplier given in Table 2 of the instrument calibration document SWIFT-UVOT-CALDB-16-R01222http://heasarc.gsfc.nasa.gov/docs/heasarc/caldb/swift.
We extracted IBIS/ISGRI (Lebrun et al., 2003) data from revolution 1557 using INTEGRAL Off-line Scientific Analysis 10.2 and following the standard IBIS/ISGRI cookbook procedure for image, mosaic, and spectral extractions. Because of the partly very low count rates of V404 Cyg outside of the flares, we employed the alternative ii_light routine for light curve extractions (see Grinberg et al. (2011) for a comparison between the different light curve extraction algorithms) and extracted light curves with a time resolution of 60 s, taking into account three bright sources active in the IBIS field of view (FOV) during the observation (V404 Cyg, Cyg X–1 and Cyg X–3).
3 Analysis
3.1 Dereddening and subtraction of flux from a blended interloper
A star that lies 1.4″ to the north of V404 Cyg (Udalski & Kaluzny, 1991) is completely blended in our WCO images. Casares et al. (1993) report the following magnitudes for the blended star: mag, mag, and . Hynes et al. (2002) suggested an F-type spectrum for the blended star based on the strong H absorption feature in its spectra. Hynes et al. (2002) also noted that an A, i.e. similar to that of V404 Cyg, is needed for the photometric colors of the blended star to agree with that of an F-type star. If the blended star is an unrelated interloper, there is no reason for it to have the same extinction as that of V404 Cyg. However, based on tables of intrinsic colors of main sequence stars (Fitzgerald, 1970; Ducati et al., 2001)333Provided online at http://www.stsci.edu/~inr/intrins.html, if the blended star is an F2 star then it has the same reddening as V404 Cyg, suggesting a similar distance. We further noted that an F2V star (of absolute magnitude =2.99; see, e.g., Pecaut et al. 2012 and Pecaut & Mamajek 2013) extincted by AV = 4.04 (same as that of V404 Cyg) would appear to have a -band magnitude of 18.9 if it is at a distance of 2.36 kpc. Therefore, an F2 star at the same distance as V404 Cyg is consistent in both color and brightness to those of the blended star. In fact, this distance estimate to the blended star is so close to that of the parallax distance to V404 Cyg (2.39 kpc; Miller-Jones et al., 2009) that we speculate in passing whether the blended star is truly unrelated to the V404 Cyg system, or whether they form a triple system where the blended star is at least 3,300 au away from V404 Cyg, orbiting with a period of at least 50,000 years.
We estimated the flux density of the blended star at other bands assuming that it is an F2 star, reddened by = 4.04. We note that this value of is consistent with the derived by Rahoui et al. (2017) based on the equivalent width of the diffuse interstellar band near 5779 Å observed in a VLT/FORS2 spectrum obtained between MJD 57200.266–57200.296 (i.e. inside the time window spanned by our observations on the second night).
The extinction law of Cardelli et al. (1989) was used to compute the dereddened fluxes. The ratio of total to selective optical extinction was taken to be 3.1. The flux from the blended star, assumed to be constant over our observation timescale, and estimated using the procedure outlined above, was subtracted from our observed fluxes in each band.
3.2 Evolution of the optical colors
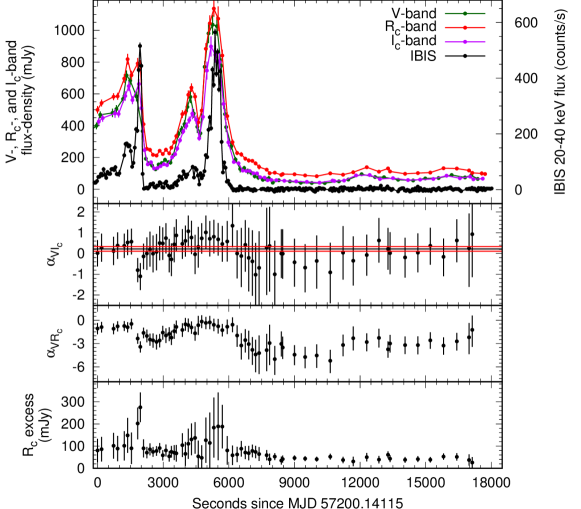
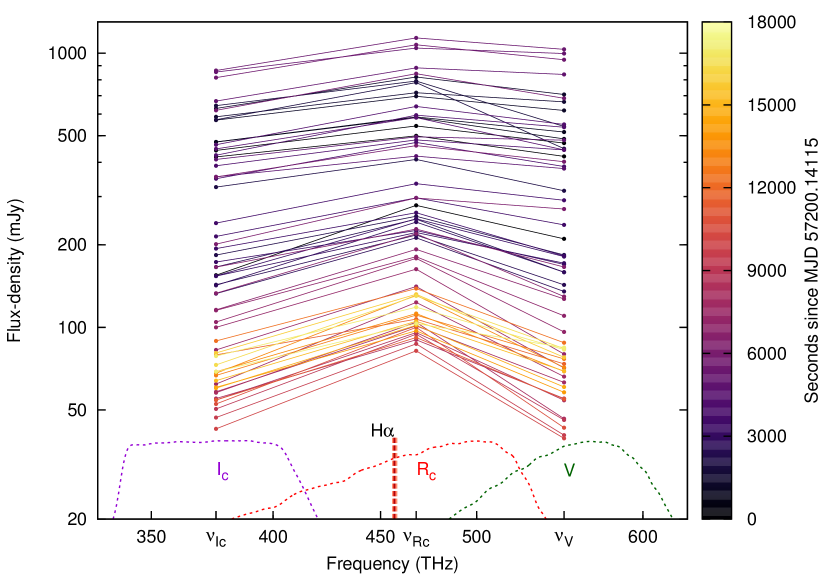
Pronounced evolution of the – color, well correlated with the source luminosity, was observed during the night of MJD 57200 (i.e. the second night, when we cycled among the filters throughout the night). This is displayed in the third panel (from top) of Fig. 2, which shows time variation of the power law spectral slope between - and -bands. This is also evident in Fig. 3, where evolution of the dereddened, interloper-subtracted spectral energy distribution (SED) during the course of the second night’s observing run is shown. Each quasi-simultaneous flux triplet is shown by a connected pair of lines. The color of each triplet indicates the observation time. Because we cycled through the filters, the , , and data points were not obtained strictly simultaneously, and the quasi-simultaneous SEDs were created by choosing observations closest in time. During the first half of the night, when the source was bright and flaring, our exposures were 30s in each band and about 5 s of dead time between images for readout and filter change. Therefore, spectral changes occurring in timescales less than a minute were not probed during the first half of the night. Similarly, during the second half of the night when the source became significantly fainter and less variable, the integration times were increased to five minutes in and one minute each in and , implying that spectral variability occurring in timescales less than four minutes were not probed during the latter half of the night. Fig. 3 clearly shows that the power law slope of the SED during the brightest epochs is quite flat, whereas at low overall brightnesses the and -band fluxes are significantly less than the -band flux, creating a bump in the SED near the -band. As discussed in greater detail in the §4, the appearance of this bump in the -band at lower source luminosities is most likely due to the presence of a strong H emission line originating in a quasi-spherical nebula surrounding the source (Muñoz-Darias et al., 2016; Rahoui et al., 2017).
We also computed the power law spectral slope, , between - and -bands. The second panel from the top of Fig. 2 shows the time variation of . Notice that the value of is almost always close to zero (the best-fit value of is 0.220.11). However, both and tend to approach zero only at highest luminosities. This spectral behavior is naturally expected if the H line flux from the nebular emission (which varies on a much slower timescale than the jet) holds roughly steady as the overall broadband continuum flux (dominated by the jet) goes down. The fact that largely stays constant with a near-flat slope can be an indication that (a) these bands trace the optically thick jet continuum, and (b) the slope of the underlying jet continuum is not strongly correlated with the luminosity and the slope remains near-flat even for luminosity changes of .
If the underlying broadband emission is indeed due to a jet, then this would imply that the optically thick to optically thin break lies at a frequency shorter than that of the -band. This would be quite atypical of most X-ray binaries, and is discussed in more detail in §4. While the average slope does not vary much over the course of the night, the errors on our slope estimation are large enough that we cannot rule out small (0.5–0.8) changes in the slope during individual observations, especially when the source is faint. For example, the slope during the lowest flux epoch, about 37 minutes of data centered around MJD 57200.25, is . On the other hand, excluding this low flux interval and keeping the remaining data yields a slope of . Thus, there may be a hint of the slope becoming slightly negative during epochs of low flux. The VLT spectrum obtained during such an epoch of low flux inside our observation window on MJD 57200 does indeed slope down at the blue end (see Rahoui et al.’s Fig. 10). However, phenomenological modeling of that spectrum also suggests a break at 3.641014 Hz (Rahoui et al., 2017), which is still atypically high for XRBs. The phenomenon of the break moving to lower frequencies during epochs of low luminosity, and the slight anti-correlation between optical polarization and luminosity found by Lipunov et al. (2016) and Shahbaz et al. (2016) may both be related to the jet’s break frequency being directly related to the energetics of the jet base. A more energetic jet base would naturally create the break at higher frequency.
Under the assumption that the broadband continuum emission between and is a single power law, the amount of excess emission in the -band for every triplet can be readily evaluated by subtracting the interpolated – power law emission from the observed -band emission. This -band excess is shown in the bottom panel of Fig. 2. We note a slight positive correlation between the -band excess and the continuum emission. For example, the excess is larger at the flare peak near MJD 57200.2 compared to that during the fainter epoch between MJD 57200.25–57200.35. Note, however, that the -band flux-density changes by a factor of about 25 between the abovementioned flare peak and the fainter epoch, suggesting that the correlation between the excess and flux-density, while positive, is not linear.
3.3 Light curve analysis
In order to study the light curve morphology and search for time lags and inherent variability timescales in the data, we computed the discrete autocorrelation functions (ACFs) and cross-correlation functions (CCFs) of the light curves using the -transformed discrete correlation function (ZDCF) method of Alexander (1997). The ZDCF is based on the classic discrete correlation function (DCF) proposed by Edelson & Krolik (1988); however, unlike the DCF it (a) bins the data points into equal population bins and (b) employs Fisher’s -transform of the linear correlation coefficient in order to estimate the confidence level of a measured correlation. Simulations (see, e.g., Alexander, 2013) show that the ZDCF provides more reliable and unbiased error estimation of time lags than the classic DCF method. When calculating the ZDCFs we chose to bin a minimum of 11 points per time-lag bin to ensure convergence of the -transform, omitted zero-lag points in order to avoid spurious peaks, and ran 1000 Monte Carlo simulations for reliable error estimation. The error on the width of the CCF peak was obtained using a likelihood method outlined in Alexander (2013), which gives the 68% fiducial interval444As cautioned by Alexander (2013), the concept of a fiducial interval is different from that of the standard notion of confidence interval. Rather, “[t]he fiducial interval can be interpreted as the interval where 68% of the likelihood-weighted ensemble of all possible CCFs reach their peaks” (Alexander, 2013)..
| Observation | Lag Type | CCF Peak | Likelihood at | Lag at CCF | 68% Fiducial Interval |
|---|---|---|---|---|---|
| Value | Peak | Peak (s) | for Peak (s) | ||
| MJD 57200 | -band to -band | 0.99 | 0.83 | -54 | (-162,22) |
| —”— | -band to -band | 0.99 | 0.85 | -58 | (-183,18) |
| —”— | -band to -band | 0.97 | 0.59 | -105 | (-173,29) |
| —”— | 20–40 keV to -band | 0.85 | 0.72 | 54 | (-27,135) |
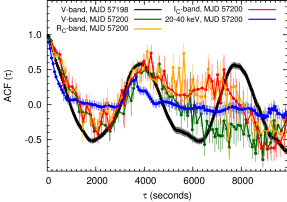
The ACF of first night’s -band light curve, shown in black in Fig. 4, is remarkably smooth compared to the original light curve, and apart from the primary peak at zero lag, the ACF exhibits peaks at 4000s and at sub-harmonics of the 4000s peak. The -, -, and -band ACFs from the second night (also shown in Fig. 4), though noisier than first night’s ACF due to fading of the source as well as sparse sampling, also show a similar feature at 4000s. The morphology of the optical ACFs may hint that the strong flares are not entirely random, but might be a manifestation of some limit-cycle type behavior of the unstable accretion flow (see, e.g., Honma et al., 1991; Szuszkiewicz & Miller, 1998; Nayakshin et al., 2000). In fact, quasi-repetitive, short-term, large-amplitude optical variability has been reported throughout the bright phase of this outburst of V404 Cyg by Kimura et al. (2016), who attributed this behavior to disruptions in the inner disk’s mass accretion rate. This claim has recently been supported by contemporaneous optical spectroscopic observations by Muñoz-Darias et al. (2016), who reported strong outflows of neutral material from the cooler, outer accretion disk. Analyzing Swift/XRT, Fermi/GBM, Chandra/Advanced CCD Imaging Spectrometer (ACIS), NuSTAR, and INTEGRAL’s IBIS/ISGRI/Joint European X-Ray Monitor (JEM-X) data obtained during this outburst, Huppenkothen et al. (2017) reported quasi-periodic oscillations (QPOs) at 18 mHz, 73 mHz, 136 mHz, and 1.03 Hz (i.e. periods of 55.6 s, 13.7 s, 7.4 s, and 0.97 s respectively) during various observations. During the previous outburst of V404 Cyg in 1989, optical QPOs with 210s and 450s periods were reported by Gotthelf et al. (1991). No strong QPOs were found in the Ginga X-ray data of the 1989 outburst (Oosterbroek et al., 1997). There was a period of extreme flaring near the start of the 1989 outburst of V404 Cyg (see, e.g., the light curves presented by Wagner et al., 1991). However, the data quality and multiwavelength coverage was poorer in 1989, and hence it is not clear if the hour-timescale optical variability seen during the 2015 outburst, seen in our data as well as in the data presented by Kimura et al. (2016), was seen during the 1989 outburst.
The ACF of the INTEGRAL/IBIS 20–40 keV light curve that is strictly simultaneous with our WCO data on MJD 57200 is shown in blue in Fig. 4. Similar to the optical ACFs, the 20–40 keV ACF also shows a peak at 4000s. The strong sub-harmonic in the -band data from the first night, peaking near 8000s, is either absent or highly diminished in the 20–40 keV ACF. At near-zero lag the X-ray ACF is narrower than the optical, likely suggesting a smaller hard X-ray emission region than the optical emission region.
Because the strong optical flux variability without overall color variability rules out a predominantly disk origin, we suggest that the disruption in the inner flow leads to a disruption in the ‘feeding’ of the jet as well. This scenario implies a disk–jet coupling where the mass outflow rate through the jet is directly related to the mass inflow rate through the disk. If other jet parameters remain largely non-varying, changes in the mass outflow rate through the jet would cause the flux-densities to change as well, but would not change the spectral shape as long as all these three optical bands lie in the optically thick part of the jet synchrotron emission.
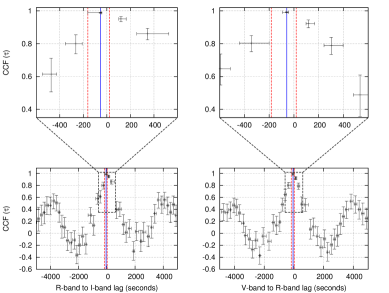
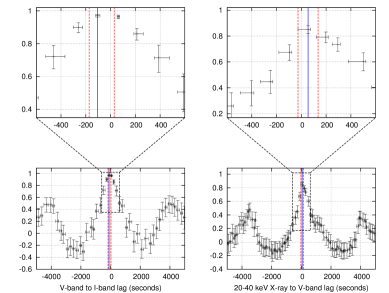
The CCFs between - and -, - and -, - and , and 20–40 keV and -bands on the second night are shown in Fig. 5. The location of the CCF peak and the 68% fiducial interval for the peak are also indicated. The error on the width of the CCF peak, estimated from the 68% fiducial interval, suggests that the 20–40 keV X-ray to -band lag is 54s, the - to -band lag is -105s, the - to -band lag is -58s, and the - to -band lag is -54s. That is, the data are consistent with no delay between the 20–40 keV, -, -, and -band light curves. Apart from the main peak, all of the CCFs show a peak at 4000s. Properties of the CCFs between the various bands are summarized in Table 2. Strictly simultaneous Swift+WCO data were obtained on MJD 57198 for only nine minutes during visit I (see Fig. 1), for 21.5 minutes during visit II, and for minutes during visit III. The relatively short duration of simultaneity compared to the 35s -band observing cadence (30s exposures + 5s readout) resulted in noisy CCFs from which no significant conclusions could be drawn.
4 Discussion and Conclusions
Based on our observations, and comparing them with those of other published results of this outburst of V404 Cyg so far, we draw the following conclusions.
(1) The power law slope of the SED between the - and -bands stays at 0.220.11 during the entire night of our second observing run, modulo uncertainties in dereddening the fluxes. For the - and -band filters used in computing the spectral slope, a 10% uncertainty in would lead to a 0.5 uncertainty in the spectral slope. However, we also note that spectroscopic measurements of obtained by Rahoui et al. (2017), based on the equivalent width of the diffuse interstellar band near 5779 Å, observed using VLT/FOcal Reducer/low dispersion Spectrograph 2 (FORS2) during our second night’s observations, are consistent with previous estimates of 4 during quiescence. Thus, it seems unlikely that systematic errors in our spectral slope estimations are significant. Taken at face value, the average value of the slope that we obtain is marginally consistent with an optically thick accretion disk, where a slope of 1/3 would be theoretically expected for a steady-state disk radiating due to viscous dissipation alone. However, we note that observations of a sample of UV and optical spectra of short-period black hole X-ray transients in outburst obtained by Hynes (2005) show that the optical slope is usually steeper than 1/3 and in the range of . Thus, in conjunction with the variability argument presented below, the – slope favors an optically thick jet origin rather than a disk origin, not to mention the slope is a more natural fit to what is seen from compact jets in other black hole binaries (see. e.g. Stirling et al. (2001) for the case of Cyg X-1).
Because several different emission components of an XRB (e.g. viscous dissipation, X-ray reprocessing, jet synchrotron) can contribute significantly in the optical bandpass, it is sometimes possible to model a flat optical spectrum by adding different amounts of different components. For example, the SED of XTE J1118+480 obtained by Hynes et al. (2000) yielded a flat spectrum with less than 10% variation in over a factor of 50 in wavelength (1000–50000Å). Nonetheless, the SED could be well described with a model where the jet break was between optical and NIR, and a disk component rising into the UV conspired with the jet to create a flat spectrum (Markoff et al., 2001; Maitra et al., 2009). However, such a spectrum should not be robust during large flux variations, as seen in our observations of V404 Cyg. The variability spectrum obtained during a later (2005) outburst of XTE J1118+480 did indeed suggest a contribution from optically thin synchrotron (Hynes et al., 2006). Thus, in the case of V404 Cyg, the persistence of the spectrum through large variability is the key to confirming its origin as an optically thick jet synchrotron.
The relatively small changes in the amount of linear optical polarization seen by Lipunov et al. (2016) and Shahbaz et al. (2016) may be an indication that while the jet’s break frequency was higher than that of the -band during most of the time, the break was not at a much higher frequency. During epochs when the jet base became less energetically compact, e.g. when the rate at which mass was fed to the jet decreased and/or when the jet was less magnetically dominated, the jet break started moving into the optical band, thereby increasing the amount of polarization.
Additionally, we note that the optical spectral index during the “slow variations” (with 100–1000s timescale) reported by Gandhi et al. (2016) during their ULTRACAM observation of this outburst of V404 Cyg is also similar to what we observe. For the slow variations, they find a mean spectral index of +0.370.11 between the and bands and an index of -0.450.09 between the and filters (the flux from the H line is included in the slope estimation here; the authors note that correcting for the H will increase the – spectral slope, making it flatter).
Further indication that the observed optical emission originated in an optically thick jet comes from comparing simultaneous radio observations. The 13-18 GHz light curve from the Arcminute Microkelvin Imager-Large Array (AMI-LA) published by Walton et al. (2017) shows that around MJD 57198.3 the 13-18 GHz flux-density from V404 Cyg was 0.4-0.5 Jy. Our observed -band flux at this time was between 3-4 Jy (see Fig. 1). This optical flux extrapolated to AMI-LA frequencies, assuming a spectral slope of that we found two nights later, results in an expected AMI-LA flux of around 0.3-0.4 Jy, which is remarkably close to the AMI-LA flux that was actually observed.
(2) No significant changes occurred in the average – spectral slope during the 5 hr of continuous observing on MJD 57200, even though the flux in individual bands changed by as much as a factor of 25. In a jet scenario the easiest way to reproduce this observation would be the case where the rate at which matter is fed to the jet’s base changes rapidly as well, without any significant change in the other jet parameters. The ‘disrupted mass flow into the inner regions’ scenario based on the detection of strong outflowing winds from the outer accretion disk (Kimura et al., 2016; Muñoz-Darias et al., 2016) would naturally account for such a disrupted feeding of the jet. However, Muñoz-Darias et al. (2016) found that from MJD 57200 onwards the P-Cygni profiles were either not present or extremely weak, suggesting that the dense outflowing winds stopped, or became optically thin, around that time. The appearance of many strong optical lines in the spectra after MJD 57200, accompanied by an increase in the H to H flux from 2.5 to 6, indicates the formation of a nebular phase during this time (Muñoz-Darias et al., 2016; Rahoui et al., 2017). Our WCO observations were obtained during the early onset of this nebular phase.
(3) The presence of a strong, slowly varying H emission line was also indirectly inferred in the -band. Strictly simultaneous spectroscopic observations of the source reported by Rahoui et al. (2017), where a strong H emission line was indeed observed, further strengthen our identification of this spectral feature. In our broadband filter observations the flux from this line creates a ‘bump’ in the -band. As shown in Fig. 3, this bump becomes weaker at high luminosities, or, in other words, the line becomes weaker relative to the continuum. This anti-correlation between the line’s equivalent width and continuum flux is clearly visible in the simultaneous 10 minute-long VLT spectra (Rahoui et al., 2017). While the equivalent width decreases with increasing source luminosity, the integrated line flux increases with the luminosity. Such an anti-correlation has also been noted during outbursts of other X-ray binaries (Fender et al., 2009). In our data this is shown in the bottom panel of Fig. 2 where the -excess is essentially a proxy for the integrated line flux. That the increase of the line flux is slower than the increase in the continuum flux (the line flux changes only by a factor of 3 when the continuum flux changes by a factor of 25 or more) was also noted by Rahoui et al. (2017) and attributed to the line being optically thick.
(4) Within the limits of our data, the 20–40 keV X-ray light curve on MJD 57200 exhibits no lead or lag with respect to the -band light curve obtained simultaneously. Similarly, we do not find any lead or lag among the -, -, and -band light curves. Given that the orbital separation in V404 Cyg is 2.2107 km or 73 lightseconds, our optical sampling (and hence the DCFs) is insensitive to delays due to the reprocessing of inner X-rays at the outer disk or the surface of the donor. Therefore, the absence of X-ray–optical lag does not rule out an irradiation origin for the optical. However, the – power law slope remained remarkably constant at 0.220.11 throughout the observing run, insensitive to flux changes of in the optical (and larger X-ray flux changes). If the optical were due to irradiation or reprocessing of the X-rays at the outer disk, then the optical slope would not have stayed constant. This is because we expect , where is the temperature of the irradiated disk and is the X-ray luminosity; and because changes in X-ray luminosity were 25, that would have shifted the irradiation peak by more than a factor of two in wavelength, leading to observable changes in the optical spectral slope that were not seen. Thus, the combination of strong variability, lack of time lag, and lack of optical spectral slope change leads us to suggest that a dominant fraction of the optical emission originates in a jet. The stronger variability of the X-rays compared to the optical, and the narrower ACF of the X-rays, suggests that the X-rays are produced in a smaller region closer to the central black hole, whereas the observed optical emission is from the optically thick regions of the jet located much farther out.
Based on the data presented in this paper, we cannot conclusively say whetheror not the X-rays during this epoch were also from a jet. The X-ray flux from a jet would be directly proportional to the optical flux in a scenario where both the jet break frequency and the jet’s broadband spectral shape (i.e. spectral slopes above and below the jet break) does not change. Indeed, as our light curves from the second night show, the X-ray variations are larger than optical variations. This may imply that either the X-rays are not coming from a jet, or perhaps that the X-rays are coming from a jet whose break frequency and/or its optically thin spectral index is rapidly changing. From what we know about black hole jets from theory, observations, and modeling, we expect both the break frequency to change (e.g. due to changing accretion rate, and/or changing magnetic field strength, and/or changing the spatial location of particle acceleration regions) and the optically thin spectral index to change as well (due to changes in shocks and/or particle acceleration processes).
While observations such as larger X-ray variability than optical (it would likely require a high-degree of fine tuning a jet model that produces larger optical variability than X-ray variability), a very hard X-ray spectrum extending well beyond 100 keV (Siegert et al., 2016), and strong reflection features well modeled by a ‘lamp post’ above/blow the accretion disk (Walton et al., 2017) are nods toward a jet origin for the X-rays, based on our data alone we cannot strongly constrain the origin of the X-rays.
If the above conclusions are correct and we were indeed observing optically thick jet synchrotron at frequencies as high as that of the -band, the optically thick to optically thin break in the jet spectrum would be at a frequency even higher than that of the -band. This would be extreme in the context of transient XRBs, where most systems exhibit a break at lower frequencies (Russell et al., 2013a). Russell et al. (2013a) also found that during the 1989 outburst of V404 Cyg the break frequency was at (1.8 0.3) 1014 Hz, significantly lower than that of the current outburst. The SED data used to estimate the jet break during the 1989 outburst, however, was obtained around MJD 47728–47729. This was about two months after the 1989 outburst had started, and by this time the optical/IR flux was more than a factor of 10 lower than that during the peak of the 1989 outburst. While the coverage of the 1989 outburst was not as good as that during the 2015 outburst, Russell et al. (2013a) noted that a nearly simultaneous radio and optical-NIR SED obtained on MJD 47676 (near the 1989 outburst peak) suggested optically thin radio synchrotron and a blue optical-NIR SED with spectral index . As the fluxes during this time (i.e. around MJD 47676) were comparable to our 2015 fluxes, better multiwavelength coverage during this phase of the 1989 would probably have allowed a better comparison with our 2015 outburst data.
It is still not clear why the outburst behavior of V404 Cyg is so different from that of most other XRBs. Dense multiwavelength monitoring of future outbursts of V404 Cyg and similarly behaved sources like V4641 Sagittarii (which has a similar, relatively large orbital period and therefore a large accretion disk as well) and Cygnus X–3 (which has shown similar high-energy -ray flares), will be key to unraveling their secrets.
References
- Alexander (2013) Alexander, T. 2013, arXiv:1302.1508
- Alexander (1997) Alexander, T. 1997, Astronomical Time Series, 218, 163
- Barthelmy et al. (2015) Barthelmy, S. D., D’Ai, A., D’Avanzo, P., Krimm, H. A., Lien, A. Y., Marshall, F. E., Maselli, A., & Siegel, M. H. 2015, GRB Coordinates Network, 17929, 1
- Burrows et al. (2005) Burrows, D. N., Hill, J. E., Nousek, J. A., et al. 2005, Space Sci. Rev., 120, 165
- Buxton et al. (2012) Buxton, M. M., Bailyn, C. D., Capelo, H. L., et al. 2012, AJ, 143, 130
- Cantrell et al. (2010) Cantrell, A. G., Bailyn, C. D., Orosz, J. A., et al. 2010, ApJ, 710, 1127
- Cardelli et al. (1989) Cardelli, J. A., Clayton, G. C., & Mathis, J. S. 1989, ApJ, 345, 245
- Casares et al. (1992) Casares, J., Charles, P. A., & Naylor, T. 1992, Nature, 355, 614
- Casares et al. (1993) Casares, J., Charles, P. A., Naylor, T., & Pavlenko, E. P. 1993, MNRAS, 265, 834
- Chen et al. (1997) Chen, W., Shrader, C. R., & Livio, M. 1997, ApJ, 491, 312
- Collins et al. (2017) Collins, K. A., Kielkopf, J. F., Stassun, K. G., & Hessman, F. V. 2017, AJ, 153, 77
- Corral-Santana et al. (2016) Corral-Santana, J. M., Casares, J., Muñoz-Darias, T., et al. 2016, A&A, 587, A61
- Ducati et al. (2001) Ducati, J. R., Bevilacqua, C. M., Rembold, S. B., & Ribeiro, D. 2001, ApJ, 558, 309
- Edelson & Krolik (1988) Edelson, R. A., & Krolik, J. H. 1988, ApJ, 333, 646
- Fender et al. (2009) Fender, R. P., Russell, D. M., Knigge, C., et al. 2009, MNRAS, 393, 1608
- Fitzgerald (1970) Fitzgerald, M. P. 1970, A&A, 4, 234
- Gandhi et al. (2016) Gandhi, P., Littlefair, S. P., Hardy, L. K., et al. 2016, MNRAS, 459, 554
- Gandhi et al. (2017) Gandhi, P., Bachetti, M., Dhillon, V. S., et al. 2017, Nature Astronomy, 1, 859
- Gotthelf et al. (1991) Gotthelf, E., Patterson, J., & Stover, R. J. 1991, ApJ, 374, 340
- Grinberg et al. (2011) Grinberg, V., Kreykenbohm, I., Fürst, F., et al. 2011, Acta Polytechnica, 51, 33
- Honma et al. (1991) Honma, F., Kato, S., & Matsumoto, R. 1991, PASJ, 43, 147
- Huppenkothen et al. (2017) Huppenkothen, D., Younes, G., Ingram, A., et al. 2017, ApJ, 834, 90
- Hynes et al. (2000) Hynes, R. I., Mauche, C. W., Haswell, C. A., et al. 2000, ApJ, 539, L37
- Hynes et al. (2002) Hynes, R. I., Zurita, C., Haswell, C. A., et al. 2002, MNRAS, 330, 1009
- Hynes (2005) Hynes, R. I. 2005, ApJ, 623, 1026
- Hynes et al. (2006) Hynes, R. I., Robinson, E. L., Pearson, K. J., et al. 2006, ApJ, 651, 401
- Jenke et al. (2016) Jenke, P. A., Wilson-Hodge, C. A., Homan, J., et al. 2016, ApJ, 826, 37
- Khargharia et al (2010) Khargharia, J., Froning, C. S., & Robinson, E. L. 2010, ApJ, 716, 1105
- Kimura et al. (2016) Kimura, M., Isogai, K., Kato, T., et al. 2016, Nature, 529, 54
- King et al. (2015) King, A. L., Miller, J. M., Raymond, J., Reynolds, M. T., & Morningstar, W. 2015, ApJ, 813, L37
- Laher et al. (2012) Laher, R. R., Gorjian, V., Rebull, L. M., et al. 2012, PASP, 124, 737
- Lasota (2001) Lasota, J.-P. 2001, New A Rev., 45, 449
- Lebrun et al. (2003) Lebrun, F., Leray, J. P., Lavocat, P., et al. 2003, A&A, 411, L141
- Lipunov et al. (2016) Lipunov, V. M., Gorbovskoy, E., Kornilov, V., et al. 2016, ApJ, 833, 198
- Loh et al. (2016) Loh, A., Corbel, S., Dubus, G., et al. 2016, MNRAS, 462, L111
- Maitra & Bailyn (2006) Maitra, D., & Bailyn, C. D. 2006, ApJ, 637, 992
- Maitra et al. (2009) Maitra, D., Markoff, S., Brocksopp, C., et al. 2009, MNRAS, 398, 1638
- Markoff et al. (2001) Markoff, S., Falcke, H., & Fender, R. 2001, A&A, 372, L25
- Miller-Jones et al. (2009) Miller-Jones, J. C. A., Jonker, P. G., Dhawan, V., et al. 2009, ApJ, 706, L230
- Motta et al. (2017) Motta, S. E., Kajava, J. J. E., Sánchez-Fernández, C., Giustini, M., & Kuulkers, E. 2017, MNRAS, 468, 981
- Muñoz-Darias et al. (2016) Muñoz-Darias, T., Casares, J., Mata Sánchez, D., et al. 2016, Nature, 534, 75
- NASA HEASARC (2014) NASA High Energy Astrophysics Science Archive Research Center (HEASARC) 2014, Astrophysics Source Code Library, ascl:1408.004
- Natalucci et al. (2015) Natalucci, L., Fiocchi, M., Bazzano, A., et al. 2015, ApJ, 813, L21
- Nayakshin et al. (2000) Nayakshin, S., Rappaport, S., & Melia, F. 2000, ApJ, 535, 798
- Oosterbroek et al. (1997) Oosterbroek, T., van der Klis, M., van Paradijs, J., et al. 1997, A&A, 321, 776
- Pecaut et al. (2012) Pecaut, M. J., Mamajek, E. E., & Bubar, E. J. 2012, ApJ, 746, 154
- Pecaut & Mamajek (2013) Pecaut, M. J., & Mamajek, E. E. 2013, ApJS, 208, 9
- Piano et al. (2017) Piano, G., Munar-Adrover, P., Verrecchia, F., Tavani, M., & Trushkin, S. A. 2017, ApJ, 839, 84
- Plotkin et al. (2017) Plotkin, R. M., Miller-Jones, J. C. A., Gallo, E., et al. 2017, ApJ, 834, 104
- Poole et al. (2008) Poole, T. S., Breeveld, A. A., Page, M. J., et al. 2008, MNRAS, 383, 627
- Radhika et al. (2016) Radhika, D., Nandi, A., Agrawal, V. K., & Mandal, S. 2016, MNRAS, 462, 1834
- Rahoui et al. (2017) Rahoui, F., Tomsick, J. A., Gandhi, P., et al. 2017, MNRAS, 465, 4468
- Rana et al. (2016) Rana, V., Loh, A., Corbel, S., et al. 2016, ApJ, 821, 103
- Reynolds & Miller (2013) Reynolds, M., & Miller, J. 2013, ApJ, 769, 16
- Rodriguez et al. (2015) Rodriguez, J., Cadolle Bel, M., Alfonso-Garzón, J., et al. 2015, A&A, 581, L9
- Roming et al. (2005) Roming, P. W. A., Kennedy, T. E., Mason, K. O., et al. 2005, Space Sci. Rev., 120, 95
- Roques et al. (2015) Roques, J.-P., Jourdain, E., Bazzano, A., et al. 2015, ApJ, 813, L22
- Russell et al. (2010) Russell, D. M., Maitra, D., Dunn, R. J. H., & Markoff, S. 2010, MNRAS, 405, 1759
- Russell et al. (2013a) Russell, D. M., Markoff, S., Casella, P., et al. 2013, MNRAS, 429, 815
- Russell et al. (2013b) Russell, D. M., Russell, T. D., Miller-Jones, J. C. A., et al. 2013, ApJ, 768, L35
- Sánchez-Fernández et al. (2017) Sánchez-Fernández, C., Kajava, J. J. E., Motta, S. E., & Kuulkers, E. 2017, A&A, 602, A40
- Scarpaci & Maitra (2015) Scarpaci, J., & Maitra, D. 2015, The Astronomer’s Telegram, 7721, 1
- Scarpaci et al. (2015) Scarpaci, J., Maitra, D., Hynes, R., & Markoff, S. 2015, The Astronomer’s Telegram, 7737, 1
- Siegert et al. (2016) Siegert, T., Diehl, R., Greiner, J., et al. 2016, Nature, 531, 341
- Shahbaz et al. (1994) Shahbaz, T., Ringwald, F. A., Bunn, J. C., et al. 1994, MNRAS, 271, L10
- Shahbaz et al. (2016) Shahbaz, T., Russell, D. M., Covino, S., et al. 2016, MNRAS, 463, 1822
- Sivakoff et al. (2015) Sivakoff, G. R., Bahramian, A., Altamirano, D., et al. 2015, The Astronomer’s Telegram, 7959, 1
- Stirling et al. (2001) Stirling, A. M., Spencer, R. E., de la Force, C. J., et al. 2001, MNRAS, 327, 1273
- Szuszkiewicz & Miller (1998) Szuszkiewicz, E., & Miller, J. C. 1998, MNRAS, 298, 888
- Tanaka et al. (2016) Tanaka, Y. T., Itoh, R., Uemura, M., et al. 2016, ApJ, 823, 35
- Tetarenko et al. (2017) Tetarenko, A. J., Sivakoff, G. R., Miller-Jones, J. C. A., et al. 2017, MNRAS, 469, 3141
- Tetarenko et al. (2016) Tetarenko, B. E., Sivakoff, G. R., Heinke, C. O., & Gladstone, J. C. 2016, ApJS, 222, 15
- Ubertini et al. (2003) Ubertini, P., Lebrun, F., Di Cocco, G., et al. 2003, A&A, 411, L131
- Udalski & Kaluzny (1991) Udalski, A., & Kaluzny, J. 1991, PASP, 103, 198
- Wagner et al. (1991) Wagner, R. M., Bertram, R., Starrfield, S. G., et al. 1991, ApJ, 378, 293
- Walton et al. (2017) Walton, D. J., Mooley, K., King, A. L., et al. 2017, ApJ, 839, 110