Interstellar communication. VI. Searching X-ray spectra for narrowband communication
Abstract
We have previously argued that targeted interstellar communication has a physical optimum at narrowband X-ray wavelengths nm, limited by the surface roughness of focusing devices at the atomic level (Hippke & Forgan, 2017). We search archival X-ray spectra (of unique objects) for such features and present 19 sources with monochromatic signals. Close examination reveals that these are most likely of natural origin. The ratio of artificial to natural sources must be %. This first limit can be improved in future X-ray surveys.
1 Introduction
Our previous work found the optimal frequency for data rate maximizing interstellar communication, given advanced technology, to be limited by the surface roughness of focusing devices at the atomic level. Depending on the material used for the reflective coating, the optimal wavelength is nm (keV) for distances out to kpc (Hippke & Forgan, 2017). While this limit can be surpassed by beam-forming with electromagnetic fields (e.g. using a free electron laser), such methods are not energetically competitive. Current lasers are not yet cost efficient for nm wavelength, with a gap of two orders of magnitude, but future technological progress may converge on the physical optimum.
As detailed in Hippke & Forgan (2017), the ideal spectrum for a maximum data rate connection will have a hard cut at nm due to mirror surface roughness. Bandwidth depends on the trade-off between the number of modes and the beam angle width. More wavelengths encode more bits per photon, however longer wavelengths have larger angular spread. The encoding efficiency follows a logarithmic relation with the number of modes (Hippke, 2017), so that the bandwidth will be small (%) in realistic cases. As nanosecond time slots give modes per second, the monochromatic number of photons can be up to before the mode penalty exceeds 1% in bit rate. Consequently, a GB/s connection will be monochromatic if nanosecond technology is available. Such a connection over pc distances can be achieved with aperture sizes m at modest (MW) power.
Optimal communication will be tightly focused with beam angles at the optimum wavelength nm of (m) due to diffraction. Randomly intercepting such beams between a large () club of communicating galactic civilizations is unlikely (Forgan, 2014). Thus, we may only hope that such communication is directed at Earth.
Based on these assumptions, we may search the sky for narrowband or monochromatic sources between 0.5 and a few nm. A comparable search for optical laser signals in spectra was carried out by Tellis & Marcy (2017) with a null result for FGKM stars. There are X-ray sources visible to XMM-Newton over the entire sky (Cappelluti et al., 2007), and spectra have been taken for ( of the visible sources). Checking these spectra for artificial features can place a first upper bound to the number of optimally communicating (towards us) civilizations.
2 Method
X-rays can only be observed from space due to atmospheric absorption. Several current X-ray satellites cover the wavelengths of interest: Swift (0.2–10 keV, Burrows et al., 2005), Chandra (0.1–10 keV, Garmire et al., 2003) and XMM-Newton (0.1–12 keV, Jansen et al., 2001), while INTEGRAL is only sensitive to higher energies (3 keV–10 MeV), and its spectrometer only covers the region 20 keV – 8 MeV which is outside of our window of interest. Because of their designs with grazing incidence mirrors, all telescopes have small collecting areas (0.01 m2, 0.04 m2 and 0.45 m2 for Swift, Chandra and XMM, respectively) (Gilli et al., 2007). With a spectral resolution of between 0.35–2.5 keV (3.5 eV at 1 keV energy), XMM is well equipped for the proposed narrow-band X-ray signals (den Herder et al., 2001).
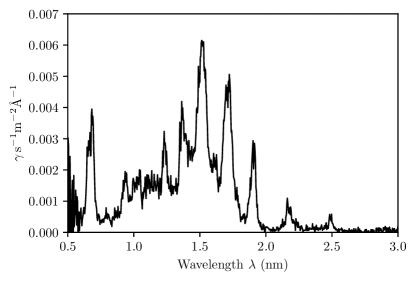
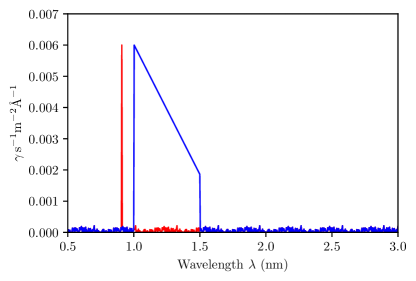
As an example, we show the spectrum of Kepler’s supernova remnant (SN1604) as observed with XMM-Newton by Cassam-Chenaï et al. (2004) in Figure 1 (left panel). For comparison, synthetic monochromatic and narrow-band spectra are shown in the right panel.
2.1 Data
The latest generation of space-based X-ray telescopes offers high sensitivity, spatial resolution and energy range. Results demonstrate the potential of Galactic X-ray surveys to detect a wide variety of source types, such as coronally-active binaries (Hérent et al., 2006), evolved protostars and T Tauri stars (Feigelson & Montmerle, 1999), or isolated neutron stars (Haberl & Pietsch, 2007).
In this paper, we utilize observations drawn from the XMM-Newton public data archive. Specifically, we query the archive for all reduced, calibrated observations taken with the Reflection Grating Spectrometers which operate between nm. This search yields a total of spectra of unique objects with exposure times between one second and 40 hours, and a mean (median) exposure time of 8.3 (5.8) hours. We download all spectra in FITS format using a custom-made script and create figures of each spectrum.
2.2 Feature search
The most prominent X-ray line emitting elements in the XMM-Newton passband are Iron, Oxygen, Magnesium, Sulfur, Silicon, Sodium, Calcium, Argon, Neon and Nickel (den Herder et al., 2001; Gu et al., 2016). Most, but not all emission lines appear spectrally resolved (e.g., Werner et al., 2006; Whewell et al., 2016). Consequently, it is possible that natural emission resembles a single monochromatic signal, in case only one such narrow line emitting element would be detectable above the noise. We search for single peaks using a 1D wavelet (Du et al., 2006) with accepted peak widths of 1–2 bins ( eV at keV), as implemented by SciPy, and requiring SNR for the highest peak, with no other peaks of SNR being present in the same spectra. This criteria is necessary because many spectra show tens to hundreds of emission lines of natural origin, and it is impossible to distinguish these from the artificial case.
For the narrowband feature search, we required the presence of a peak with a minimum width of two bins ( eV at keV) at SNR and at least one sharp edge, i.e. a transition to SNR on one side of the peak. No additional peaks with SNR in the same spectrum were tolerated.
3 Results
After the automatic search and and visual examination, 19 spectra with a “potentially monochromatic” feature were identified (Table 1), and none with a narrowband feature. To verify the correctness of the algorithm, we relaxed the SNR requirements and visually examined the best candidates. No spectra of interest were found.
A literature search for the 19 spectra with a “potentially monochromatic” feature shows that all of them are identical with natural, astrophysical sources, such as galaxies and variable stars. Spatially resolved sources, such as the Cygnus Loop supernova remnant, exhibit different spectral features in different regions (pointings), resulting in single peak detection if SNR is low. The same mechanism appears to be present as well for all other sources. We found no indication for anything artificial.
As an example, rho Oph (the “X-ray lighthouse”) shows strong and time-variable emissions between 0.5-3.5 nm, including FeXXIV, NeX, NeIX, OVIII, and CVI (Pillitteri et al., 2017).
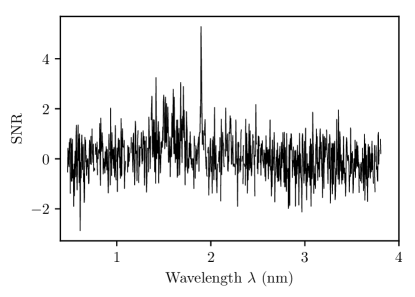
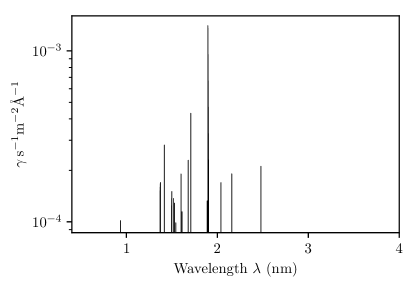
A spectrum for HD189733 is shown in Figure 2, with a prominent peak at 1.89 nm, the oxygen emission line OVIII Lyman- (Walker et al., 1974; Pounds & Vaughan, 2011). This is the most commonly found emission line, detected in 7 of the 19 spectra. A detailed discussion of the natural emission properties of these lines is beyond the scope of this paper.
4 Discussion
We can calculate the expected SNR for a detector such as XMM-Newton for the case of optimal X-ray communication whose photon count scales as (Hippke & Forgan, 2017)
| (1) |
where the distance is in pc, transmitter and receiver apertures and are in m and power is in Watt. As an example, we use a m telescope at Proxima Cen (pc) with W and XMM-Newtons quantum efficiency of 50% at keV energy (Strüder et al., 2001). The monochromatic photon count for XMM is then 0.3 s-1, so that a high SNR detection with 100 photons in one spectral channel is achieved after 6 min.
If a survey spends 10 min on each source, a clear detection in this framework is possible if the transmitter power .
As an example, for m, scales out to 50 W (5 kW, 500 kW) at distances of 10 pc (100 pc, kpc). Equally, for kW power the aperture would need to grow to 0.2 (2, 20 kW) for distances of 10 pc (100 pc, kpc).
These requirements are modest even for current technology, and it makes such communications technologically plausible. A survey with a duty cycle of 50% using XMM-Newton could observe sources per year. If the target list are the nearest stars of stellar types M, K, G, the survey could probe all of these stars out to 40 (100 pc) within one (ten) years.
4.1 Upper limit on X-ray sources targeted at us
The archival sample contains mostly established astrophysical sources, such as supernova remnants and radio-loud stars and galaxies. Targeting obviously natural (and sometimes hostile) sources makes the detection of artificial signals less likely, and upper limits too conservative.
We detect no artificial signals in unique objects, and therefore the ratio of artificial to natural sources must be %. This is not a strict limit, because the data does not come from a contiguous survey. An unbiased future spectral X-ray survey should target unlikely sources of powerful narrowband X-rays, such as nearby and field F, G, K, M stars.
5 Conclusion
Close examination of archival X-ray spectra revealed 19 candidates with single monochromatic emission lines. All of these are found to be likely of natural origin. This first limit can be improved in future X-ray surveys.
| Object | Type | Peak (nm) | ID# | Comment |
|---|---|---|---|---|
| NGC 720 | Galaxy | 0.521 | 0112300101 | Other peaks exist (Jeltema et al., 2003) |
| 4C 29.30 | Seyfert 2 galaxy | 3.851 | 0504120101 | Strong GHz source (Jamrozy et al., 2007) |
| Cygnus Loop | Supernova remnant | 3.426 | 0018140101 | Extended source (Levenson et al., 1997) |
| zet CMa | Cepheid variable | 1.899 | 0600530101 | Pulsating magnetosphere (Shultz et al., 2017) |
| HD 189733 | BY Dra type variable | 1.896 | 0744981701 | Hot Jupiter exoplanet (Bouchy et al., 2005) |
| eps Per | Beta Cep type variable | 1.896 | 0761090801 | Binary (Libich et al., 2006), pulsations (Saio et al., 2000) |
| Kappa Sco | Beta Cep type variable | 2.162 | 0503500201 | Binary, pulsations (Harmanec et al., 2004; Uytterhoeven et al., 2005) |
| 56 Tau | Alpha2 CVn type variable | 1.896 | 0201360201 | Period 1.57 d (North & Adelman, 1995) |
| HD 283572 | T Tau-type variable | 0.524 | 0101441001 | SED peak at keV (Favata et al., 1998) |
| CE 315 (V396 Hya) | Nova, AM CVn binary | 0.557 | 0302160201 | Cataclysmic variable (Ramsay et al., 2006) |
| RBS 1955 (V405 Peg) | Dwarf nova | 0.589 | 0604060101 | Cataclysmic binary (Thorstensen et al., 2009) |
| 61 Cyg A+B | Double star | 1.899 | 0041740301 | Nearby K5V+K7V (Robrade et al., 2012; Boro Saikia et al., 2016) |
| rho Oph | Double star | 0.553 | 0305540601 | “X-ray lighthouse” period 1.4 d (Pillitteri et al., 2017) |
| HD 54662 | Double star | 0.575 | 0780150101 | Spectroscopic binary (Boyajian et al., 2007) |
| IGR J17091-3624 | Low mass X-ray binary | 0.560 | 0406140401 | “Exotic variability” (Court et al., 2017) |
| HD 79555 | High proper-motion star | 1.896 | 0602830401 | Young (35 Myr, Maldonado et al., 2010) binary (Mason et al., 2001) |
| CN Leo (Wolf 359) | Flare star | 1.899 | 0200530701 | 3rd closest star (2.4 pc), dM6e (Wing & Ford, 1969) |
| UV Ceti (GJ 65 B) | Flare star | 0.474 | 0111430201 | Nearby binary M5.5Ve+M6Ve (Kervella et al., 2016) |
| eta Car | Emission-line star | 2.483 | 0560580201 | Colliding-wind binary (Leser et al., 2017) |
References
- Boro Saikia et al. (2016) Boro Saikia, S., Jeffers, S. V., Morin, J., et al. 2016, A&A, 594, A29
- Bouchy et al. (2005) Bouchy, F., Udry, S., Mayor, M., et al. 2005, A&A, 444, L15
- Boyajian et al. (2007) Boyajian, T. S., Gies, D. R., Dunn, J. P., et al. 2007, ApJ, 664, 1121
- Burrows et al. (2005) Burrows, D. N., Hill, J. E., Nousek, J. A., et al. 2005, Space Sci. Rev., 120, 165
- Cappelluti et al. (2007) Cappelluti, N., Hasinger, G., Brusa, M., et al. 2007, ArXiv e-prints, arXiv:0704.2293
- Cassam-Chenaï et al. (2004) Cassam-Chenaï, G., Decourchelle, A., Ballet, J., et al. 2004, A&A, 414, 545
- Court et al. (2017) Court, J. M. C., Altamirano, D., Pereyra, M., et al. 2017, MNRAS, 468, 4748
- den Herder et al. (2001) den Herder, J. W., Brinkman, A. C., Kahn, S. M., et al. 2001, A&A, 365, L7
- Du et al. (2006) Du, P., Kibbe, W. A., & Lin, S. M. 2006, Bioinformatics, 22, 2059
- Favata et al. (1998) Favata, F., Micela, G., & Sciortino, S. 1998, A&A, 337, 413
- Feigelson & Montmerle (1999) Feigelson, E. D., & Montmerle, T. 1999, ARA&A, 37, 363
- Forgan (2014) Forgan, D. H. 2014, Journal of the British Interplanetary Society, 67, 232
- Garmire et al. (2003) Garmire, G. P., Bautz, M. W., Ford, P. G., Nousek, J. A., & Ricker, Jr., G. R. 2003, in Proc. SPIE, Vol. 4851, X-Ray and Gamma-Ray Telescopes and Instruments for Astronomy., ed. J. E. Truemper & H. D. Tananbaum, 28
- Gilli et al. (2007) Gilli, R., Comastri, A., & Hasinger, G. 2007, A&A, 463, 79
- Gu et al. (2016) Gu, L., Mao, J., Costantini, E., & Kaastra, J. 2016, A&A, 594, A78
- Haberl & Pietsch (2007) Haberl, F., & Pietsch, W. 2007, A&A, 476, 317
- Harmanec et al. (2004) Harmanec, P., Uytterhoeven, K., & Aerts, C. 2004, A&A, 422, 1013
- Hérent et al. (2006) Hérent, O., Motch, C., & Guillout, P. 2006, in ESA Special Publication, Vol. 604, The X-ray Universe 2005, ed. A. Wilson, 91
- Hippke (2017) Hippke, M. 2017, ArXiv e-prints, arXiv:1712.05682 [astro-ph.IM]
- Hippke & Forgan (2017) Hippke, M., & Forgan, D. H. 2017, ArXiv e-prints, arXiv:1711.05761 [astro-ph.IM]
- Jamrozy et al. (2007) Jamrozy, M., Konar, C., Saikia, D. J., et al. 2007, MNRAS, 378, 581
- Jansen et al. (2001) Jansen, F., Lumb, D., Altieri, B., et al. 2001, A&A, 365, L1
- Jeltema et al. (2003) Jeltema, T. E., Canizares, C. R., Buote, D. A., & Garmire, G. P. 2003, ApJ, 585, 756
- Kervella et al. (2016) Kervella, P., Mérand, A., Ledoux, C., Demory, B.-O., & Le Bouquin, J.-B. 2016, A&A, 593, A127
- Leser et al. (2017) Leser, E., Ohm, S., Füßling, M., et al. 2017, ArXiv e-prints, arXiv:1708.01033 [astro-ph.HE]
- Levenson et al. (1997) Levenson, N. A., Graham, J. R., Aschenbach, B., et al. 1997, ApJ, 484, 304
- Libich et al. (2006) Libich, J., Harmanec, P., Vondrák, J., et al. 2006, A&A, 446, 583
- Maldonado et al. (2010) Maldonado, J., Martínez-Arnáiz, R. M., Eiroa, C., Montes, D., & Montesinos, B. 2010, A&A, 521, A12
- Mason et al. (2001) Mason, B. D., Wycoff, G. L., Hartkopf, W. I., Douglass, G. G., & Worley, C. E. 2001, AJ, 122, 3466
- North & Adelman (1995) North, P., & Adelman, S. J. 1995, A&AS, 111, 41
- Pillitteri et al. (2017) Pillitteri, I., Wolk, S. J., Reale, F., & Oskinova, L. 2017, A&A, 602, A92
- Pounds & Vaughan (2011) Pounds, K. A., & Vaughan, S. 2011, MNRAS, 413, 1251
- Ramsay et al. (2006) Ramsay, G., Groot, P. J., Marsh, T., et al. 2006, A&A, 457, 623
- Robrade et al. (2012) Robrade, J., Schmitt, J. H. M. M., & Favata, F. 2012, A&A, 543, A84
- Saio et al. (2000) Saio, H., Kambe, E., & Lee, U. 2000, ApJ, 543, 359
- Shultz et al. (2017) Shultz, M., Wade, G. A., Rivinius, T., et al. 2017, MNRAS, 471, 2286
- Strüder et al. (2001) Strüder, L., Briel, U., Dennerl, K., et al. 2001, A&A, 365, L18
- Tellis & Marcy (2017) Tellis, N. K., & Marcy, G. W. 2017, AJ, 153, 251
- Thorstensen et al. (2009) Thorstensen, J. R., Schwarz, R., Schwope, A. D., et al. 2009, PASP, 121, 465
- Uytterhoeven et al. (2005) Uytterhoeven, K., Briquet, M., Aerts, C., et al. 2005, A&A, 432, 955
- Walker et al. (1974) Walker, Jr., A. B. C., Rugge, H. R., & Weiss, K. 1974, ApJ, 192, 169
- Werner et al. (2006) Werner, N., de Plaa, J., Kaastra, J. S., et al. 2006, A&A, 449, 475
- Whewell et al. (2016) Whewell, M., Branduardi-Raymont, G., & Page, M. J. 2016, A&A, 595, A85
- Wing & Ford (1969) Wing, R. F., & Ford, Jr., W. K. 1969, PASP, 81, 527