A New Gamma-Ray Source in the Vicinity of the Galactic Supernova Remnant G306.30.9
Abstract:
A new extended gamma-ray source, which was named as Source A, in the southwest of Galactic supernova remnant (SNR) G306.30.9 was detected with a significance of 13 at the location of R.A. (J2000) = 13h 17m 52.80, Decl. (J2000) = 63∘ 55′ 48.00 using about 9 years of Fermi-LAT data. In order to investigate this unidentified gamma-ray source in multi-wavelengths, we performed Swift observations of Source A. In this presentation we summarize the published gamma-ray results, report about the recent ToO Swift observations of Source A, and show our preliminary results of the gamma-ray analysis that we conducted using the new X-ray data.
1 Introduction
In [3], we reported about the detection of an extended gamma-ray source, Source A, located 0.6 south-west of the supernova remnant (SNR) G306.30.9. Assuming Source A as a point-like gamma-ray source,we detected it with a significance of 9.7 (TS111Test Statistics (TS) values indicate that the null hypothesis (maximum likelihood value for a model without an additional source) is incorrect. The square-root of TS gives the detection significance of a source.94). Its best-fitted location was found to be R.A. (J2000) = 13h 17m 52.80, Decl. (J2000) = 63∘ 55′ 48.00. If the extended gamma-ray emission was fit to a disk-like extension model, the extension radius was measured to be 0.73 0.07. As an extended source the total significance was found to be 13 and assuming a power-law (PL) spectrum, we obtained = 2.1 and the energy flux was found to be (2.07 0.2) 10-5 MeV cm-2 s-1.
In this paper we summarize the results of our Swift ToO observations on Source A in Section 2. Following the ToO observations, we extended the gamma-ray analysis by using 3 months of more Fermi-LAT data than what we used in our previous analysis [3]. In Section 3, we explain the gamma-ray analysis and give its preliminary results. In Section 4, we present the conclusions and give an outlook.
2 Swift ToO Observations & Results
To unravel the nature of the extended unidentified Fermi gamma-ray source, Source A, found near the SNR G306.30.9 [3], two Swift ToOs (IDs: 00010121001, 00010151001, 00010151002) were successfully completed in May and June 2017. We had 5.6 ks effective exposure for the May observations and 5 ks for June observations. Four new X-ray sources were discovered, which we named as SrcA/Src1, SrcB/Src2, SrcC/Src3, and SrcD/Src4 in our initial analyses. The June ToO was centered at SrcB, because this was found to be the brightest X-ray source. Except SrcC, all Swift XRT sources are within the 5 contour level of Source A.
| Name | RA (deg) | Dec. (deg) | Exposure (ks) |
|---|---|---|---|
| SrcA/Src1 | 199.331 | -63.882 | 10.6 |
| SrcB/Src2 | 199.742 | -63.954 | 10.6 |
| SrcC/Src3 | 199.579 | -63.781 | 10.6 |
| SrcD/Src4 | 198.964 | -63.905 | 10.6 |
The locations of these X-ray sources are given in Table 1. The Swift XRT sources are about 10′ away from each other. So, there is no physical connection between them, because the separation between them is too big for any distance that is 0.1 kpc. All Swift XRT sources, are close to or within the 5 contour level of Source A. Here are the details of the initial Swift analysis results and the multi-wavelength aspects of each of these four X-ray sources:
-
•
SrcA (Src1): This is the closest Swift XRT source to Source A. SrcA has an optical counterpart classified as a star in the Guide Star Catalog 2.3222http://gsss.stsci.edu/Catalogs/GSC/GSC2/GSC2.htm, which is 4′′ (S7KT124582) away from SrcA. Another close optical source (S7KT125052) is 6′′ away from SrcA. SrcA might be a binary system, because a separation of 6′′ amounts to 6000 AU at a distance of 1 kpc. SrcA has no radio counterparts.
-
•
SrcB (Src2): Flux of SrcB changed by a factor of 4 within 3 weeks implying that this source is a variable. However, there are no observed optical or radio counterparts for this source.
-
•
SrcC (Src3): This source has a very soft spectrum and since its position is outside the 5 gamma-ray contours of Source A, we assume that this source is not directly related to Source A.
-
•
SrcD (Src4): This source was found to exist in the Swift XRT data, while searching for radio counterparts for SrcA, SrcB, and SrcC in the Sydney University Molonglo Sky Survey (SUMSS) data. We found a SUMSS radio counterpart for SrcD at 843 MHz that also overlaps with PMN J1315-6354 (R.A. (J2000) = 13h 15m 52.9, Decl. (J2000) = 63∘ 54′ 40′′) from the Parkes-MIT-NRAO (PMN) 4.85GHz Surveys catalog [4].
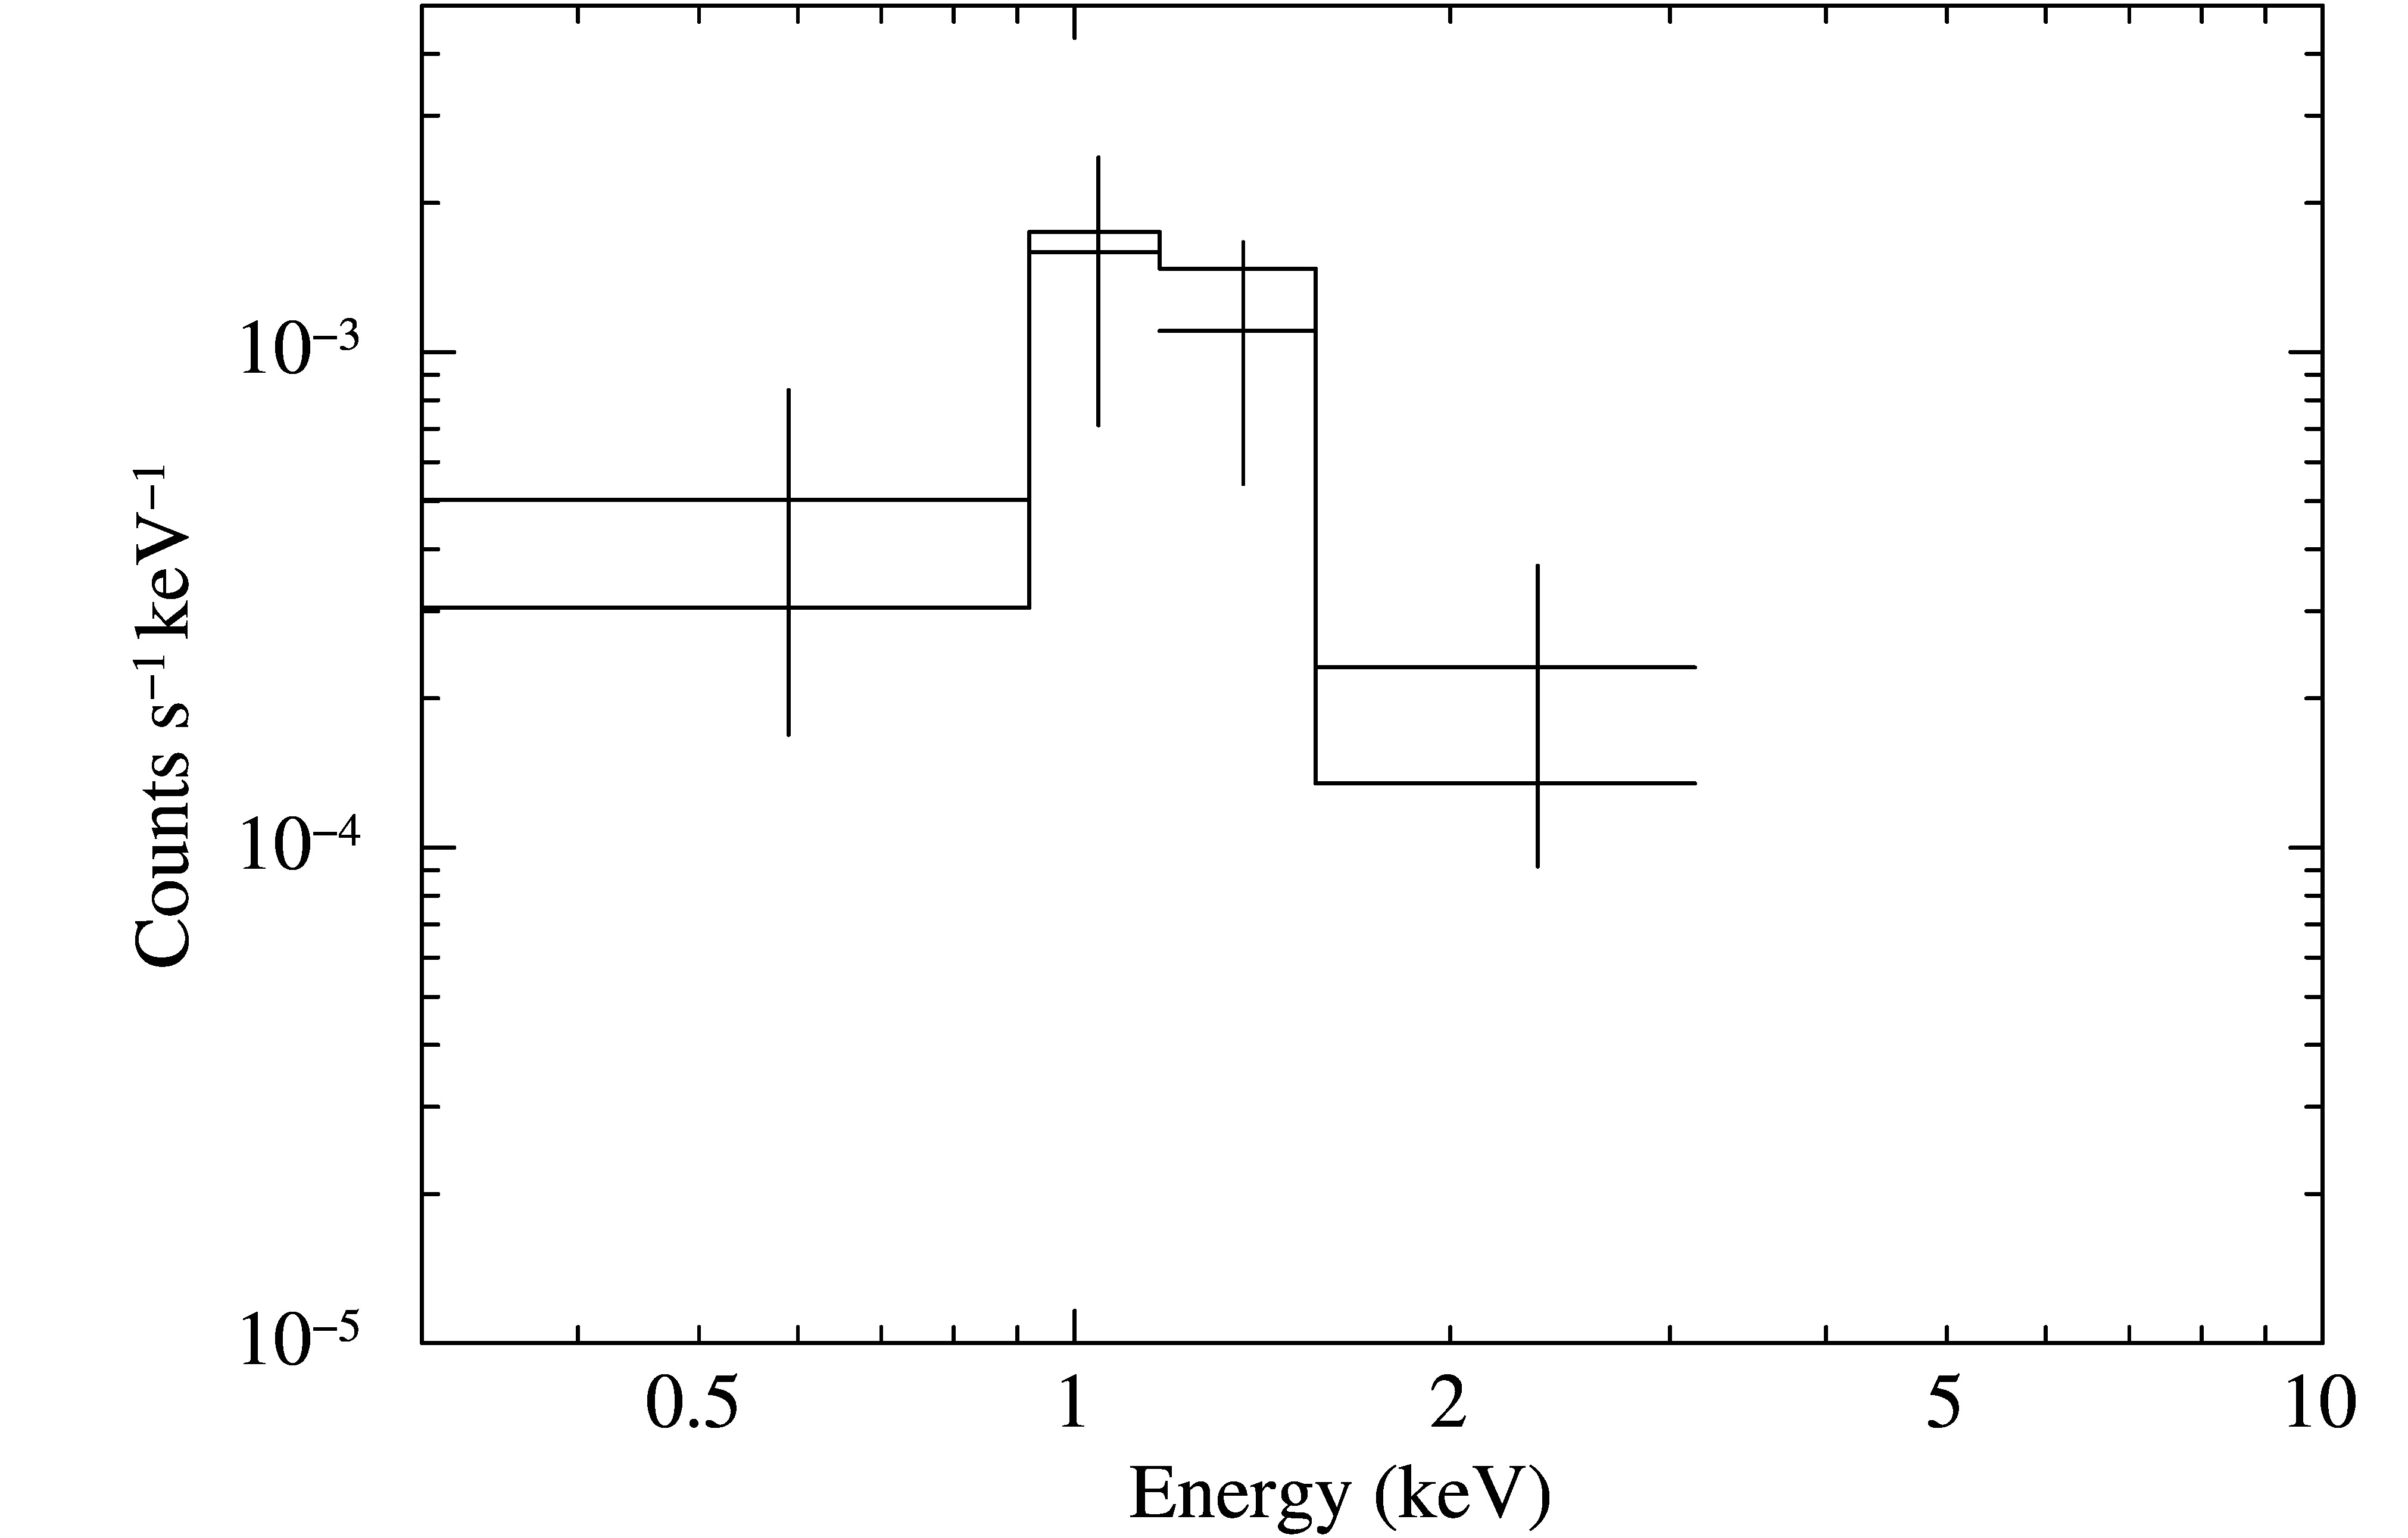
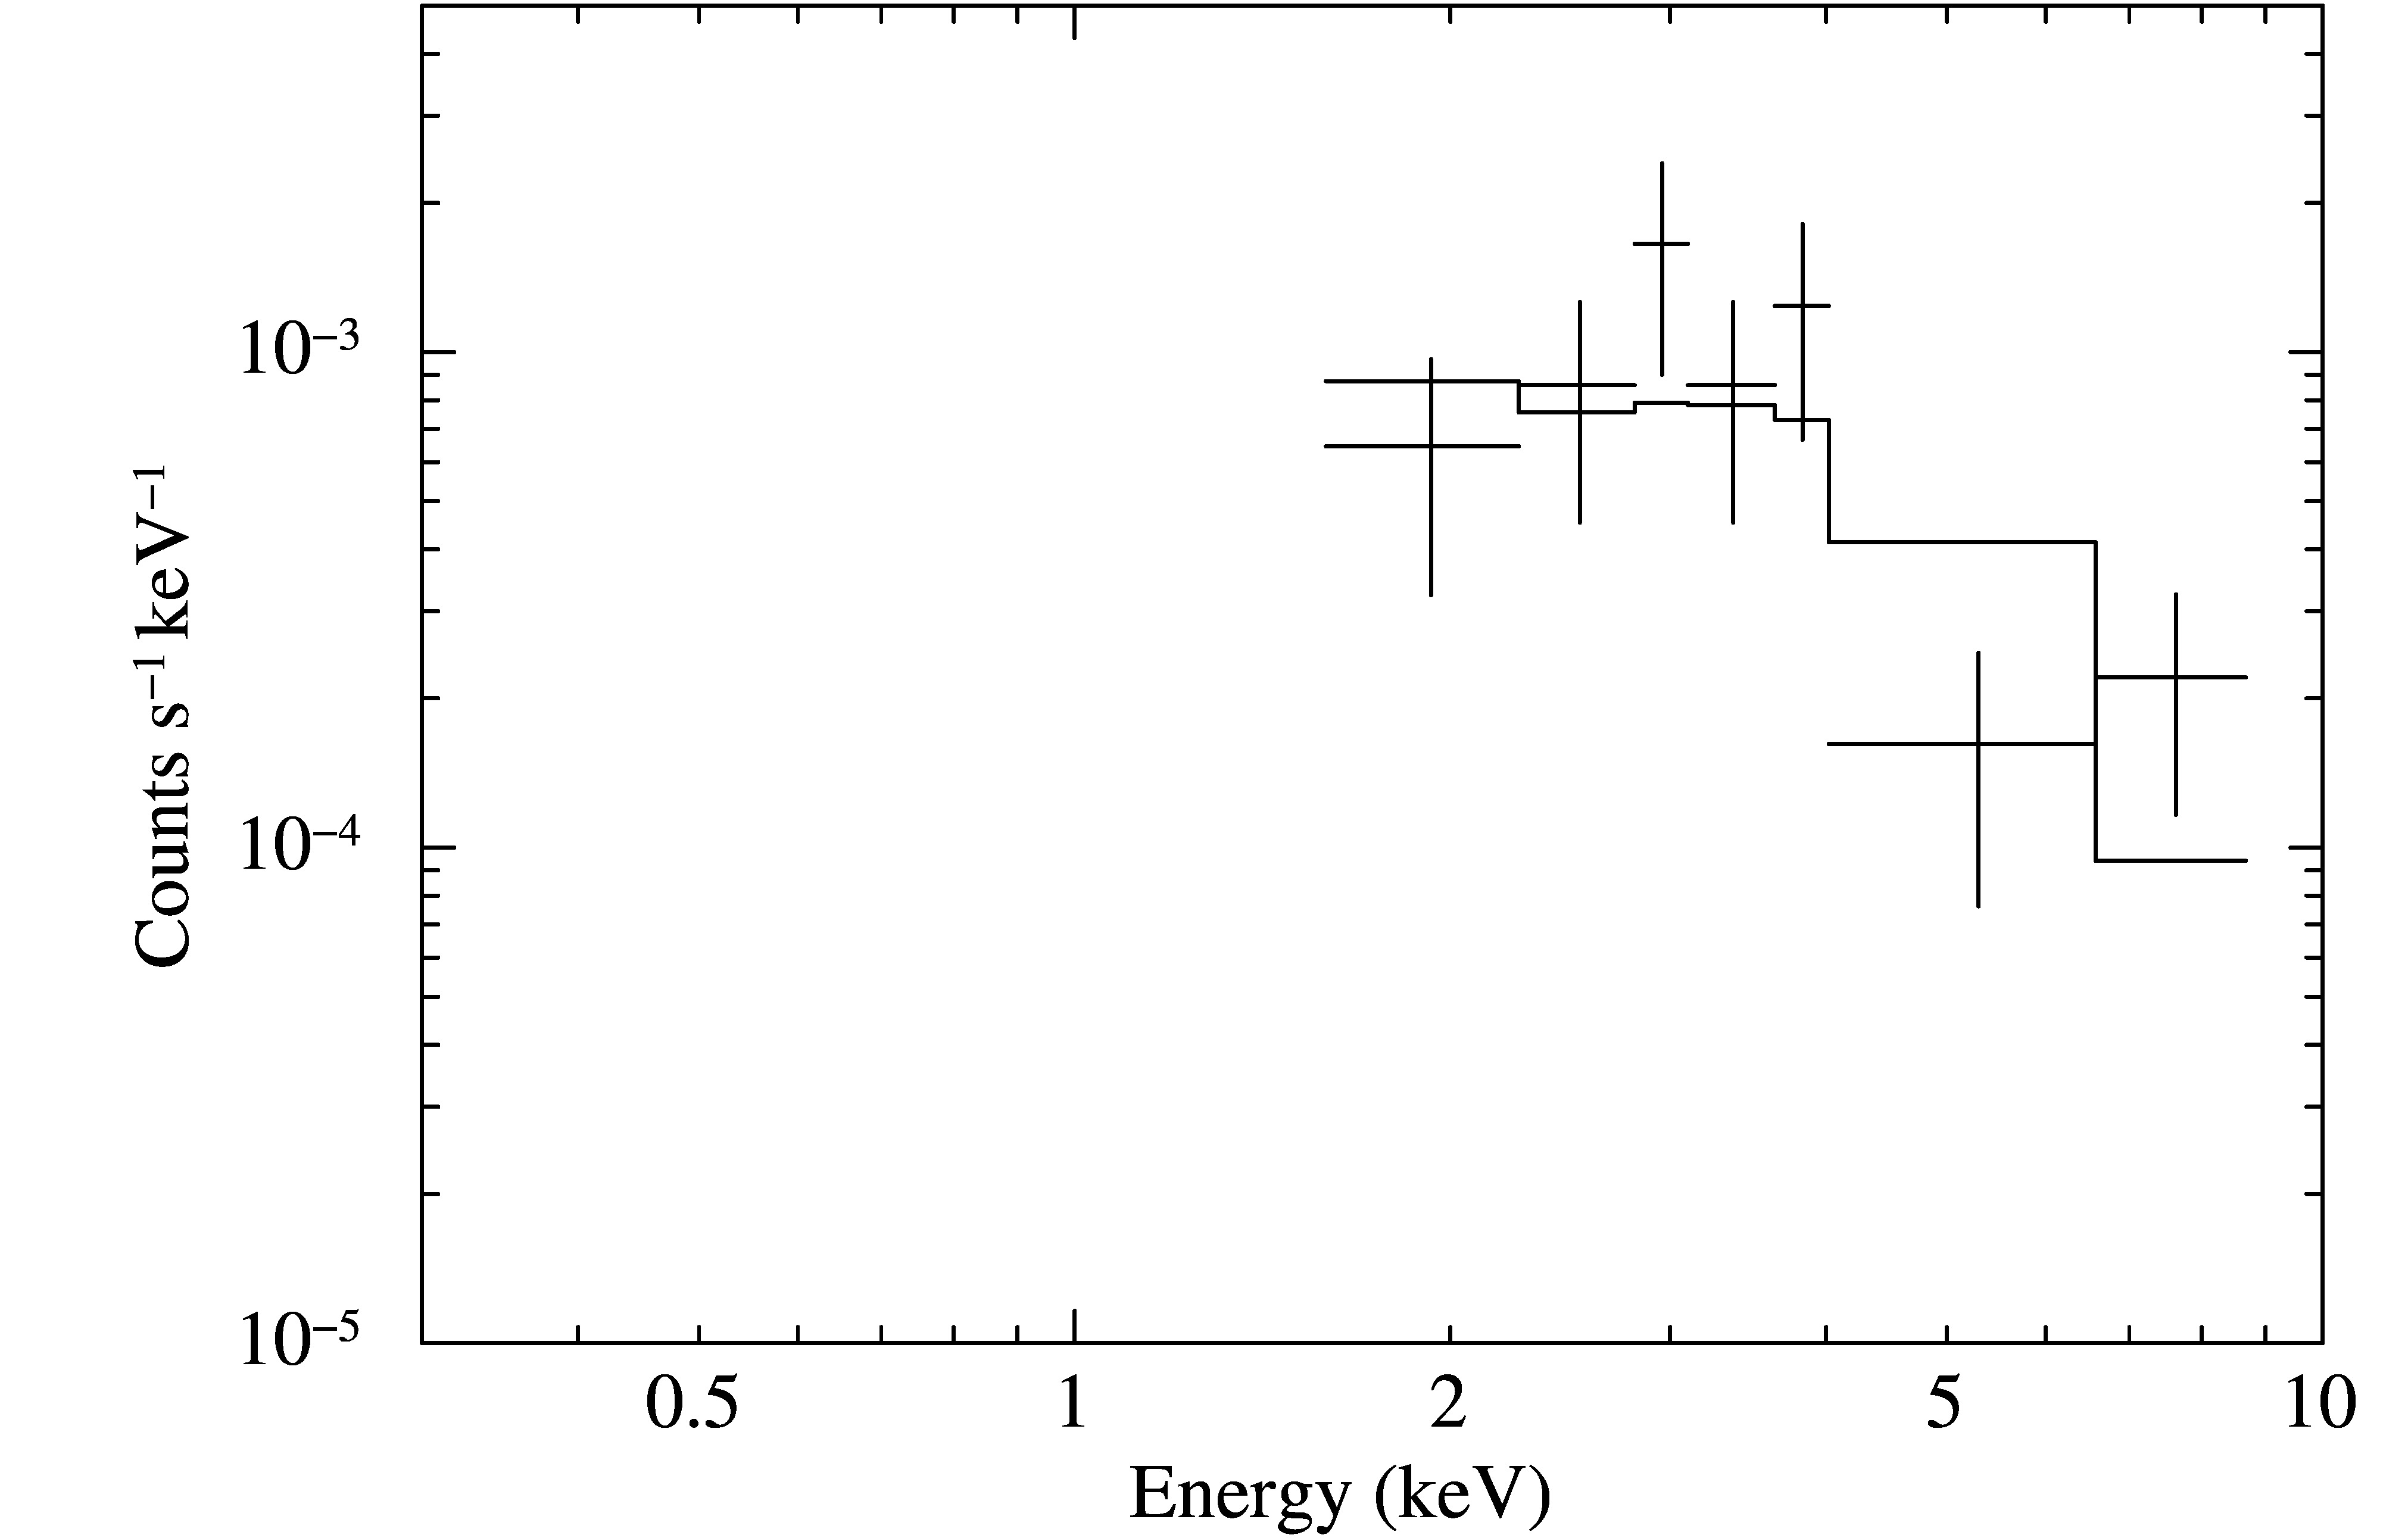
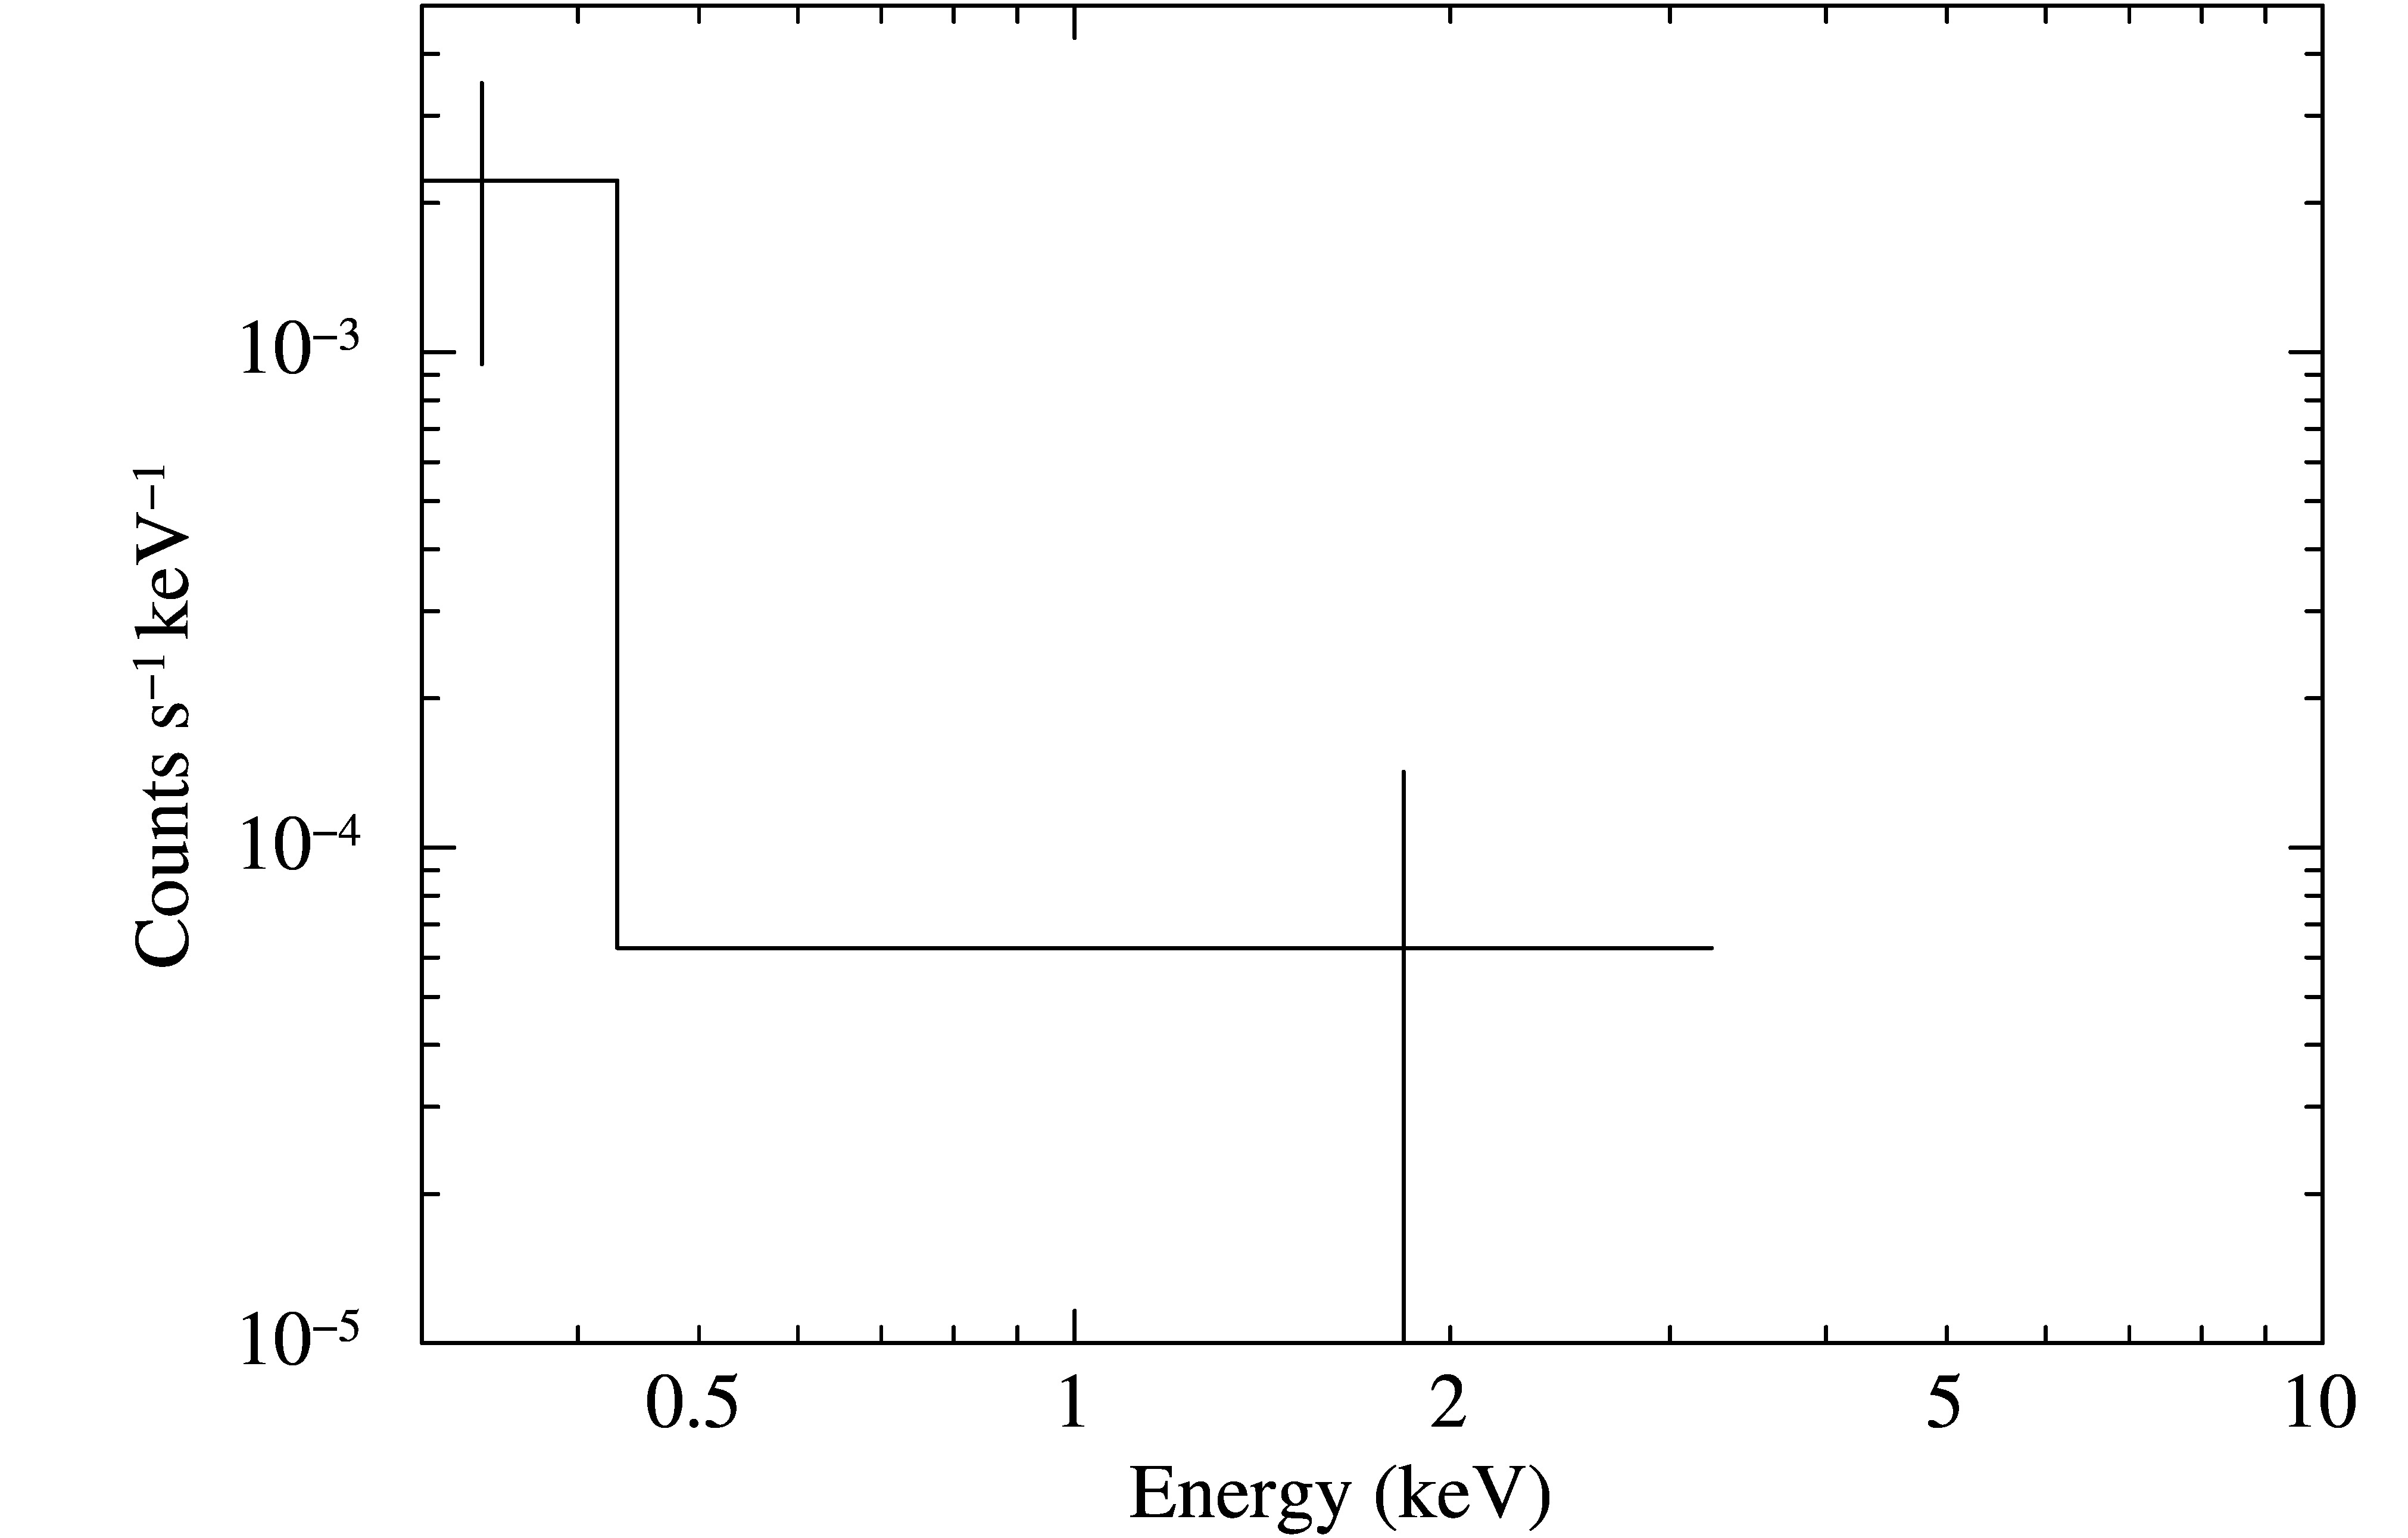
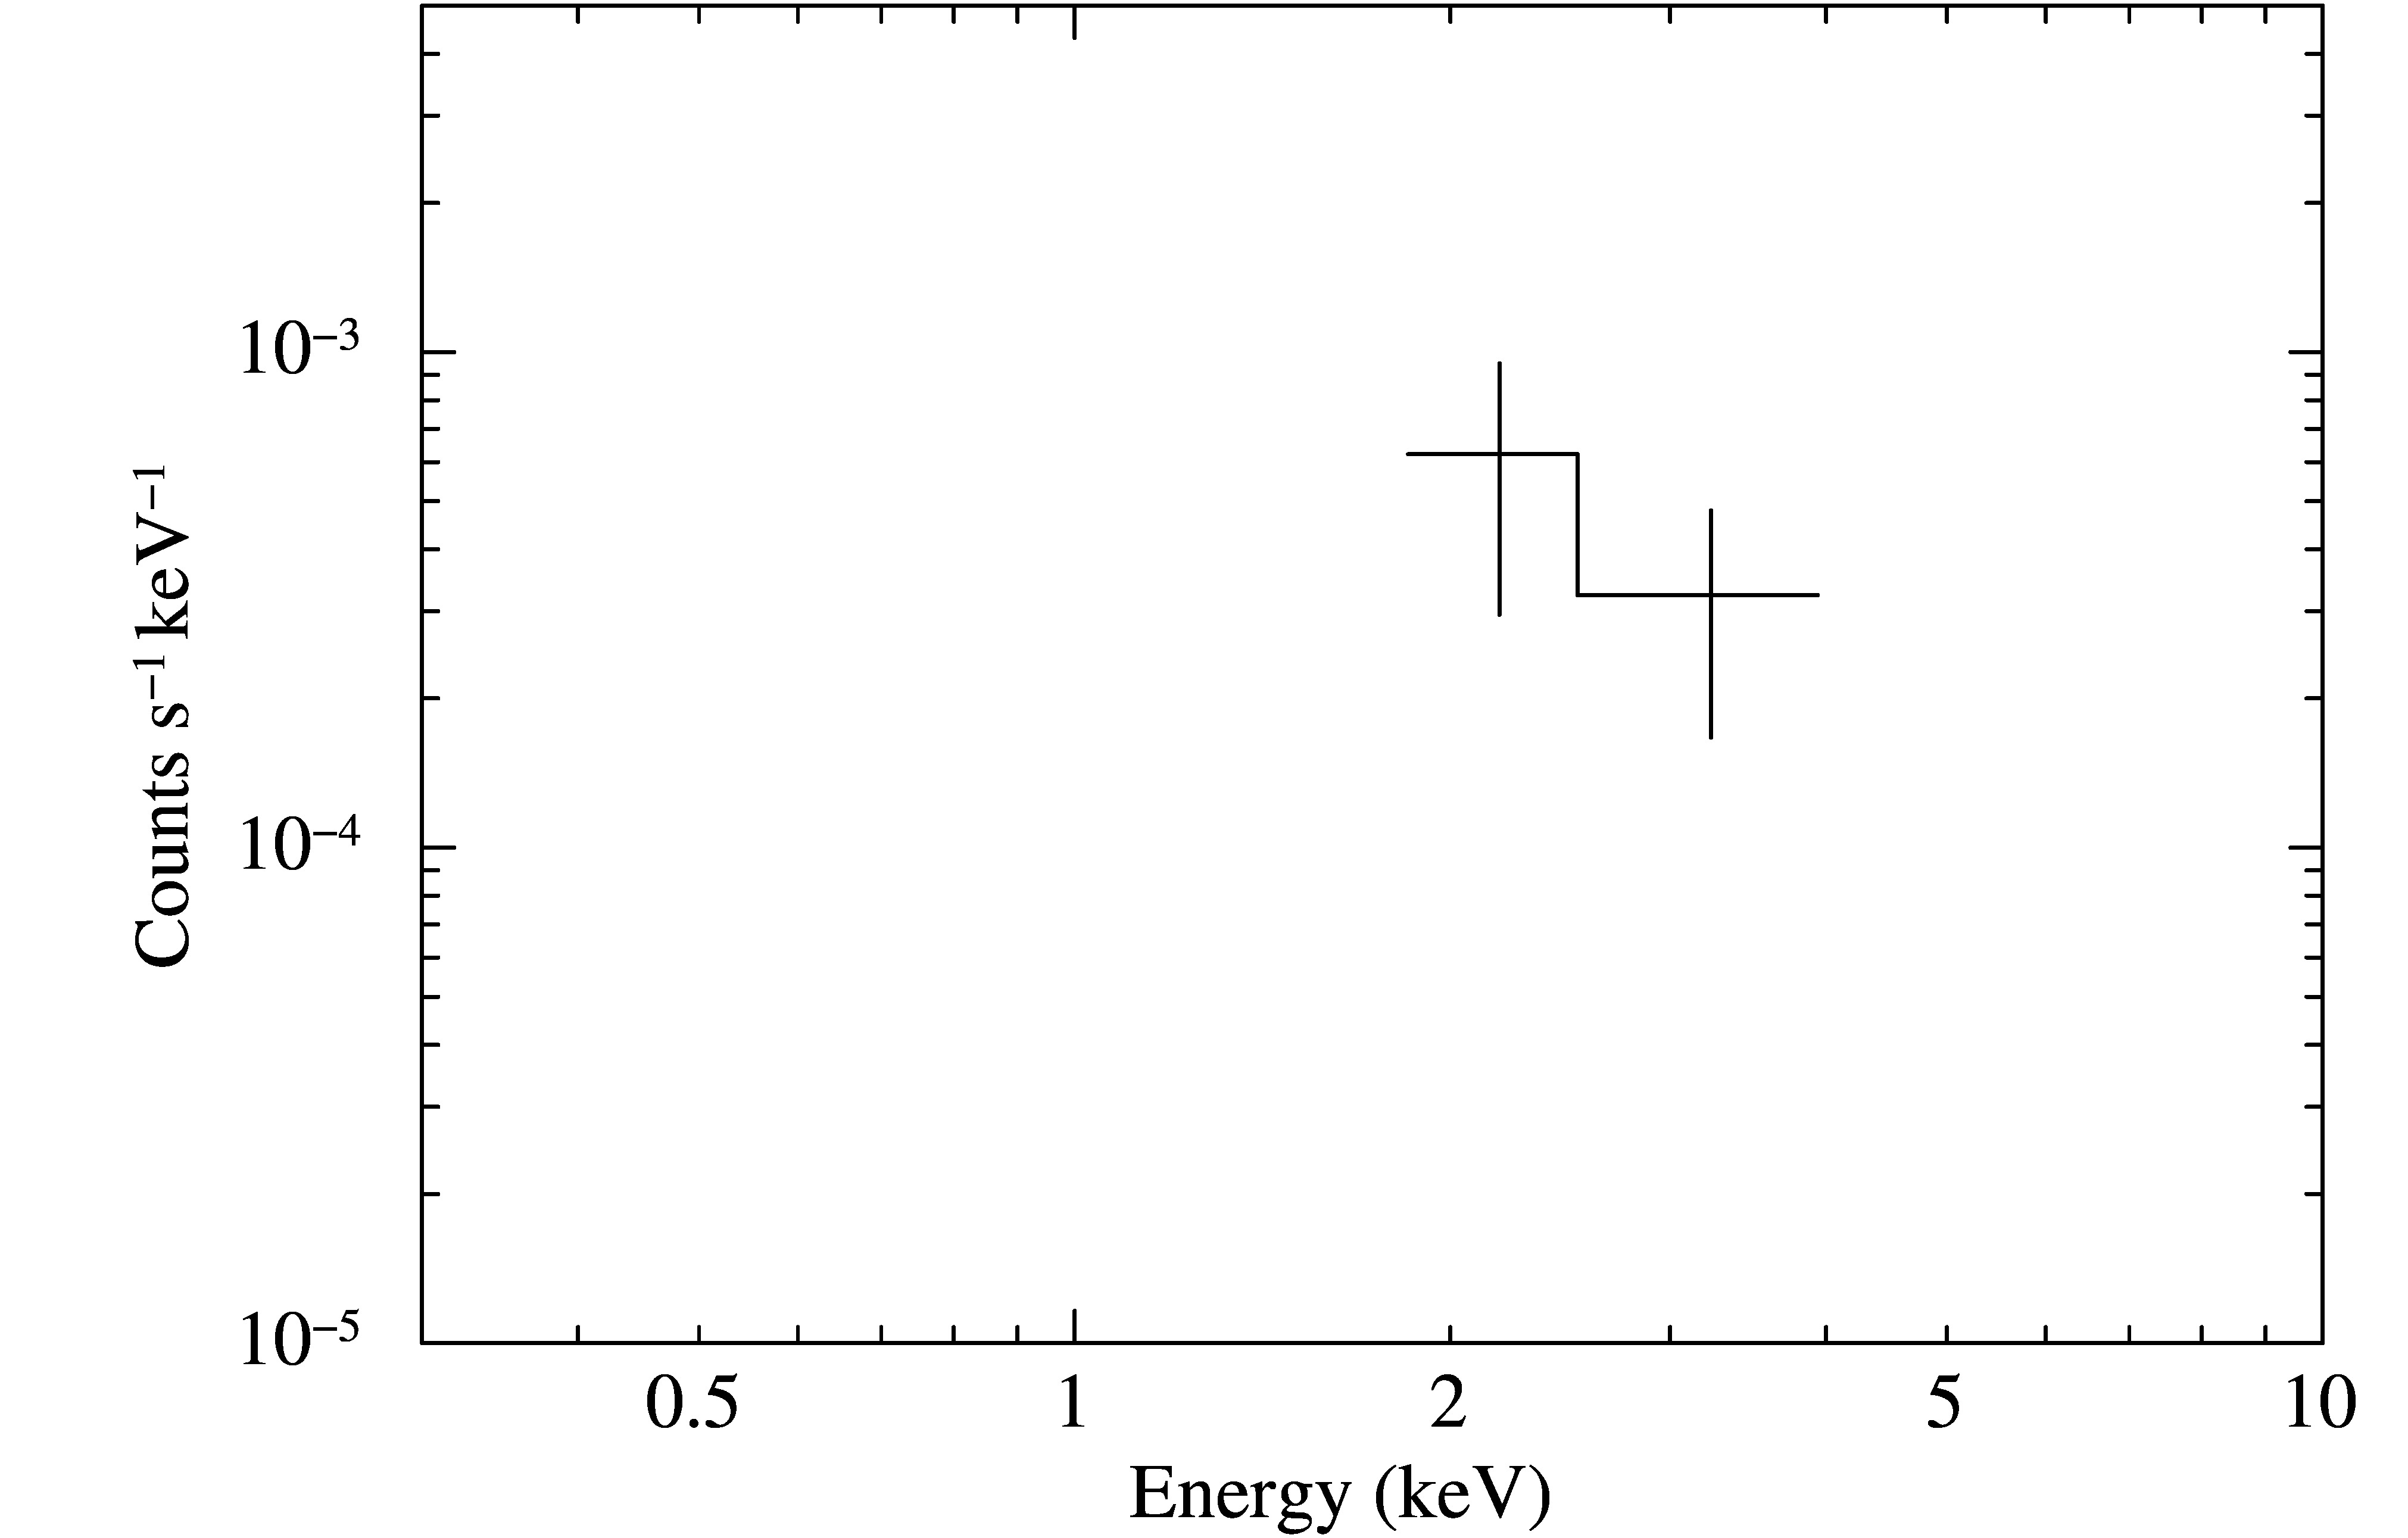
X-ray spectra for all Swift XRT sources are shown in Figure 2. For SrcA, SrcB, and SrcD we assumed the absorbing Hydrogen column density to be 1.7 1022 cm-2, which is the same as that for G306.30.9, to calculate the absorption corrected flux in the 0.5-10 keV energy range. Hydrogen column density for SrcC was assumed to be zero to adequately fit its very soft X-ray spectrum. The absorption corrected flux value for SrcA, SrcB, SrcC, and SrcD is calculated to be 3.2 10-11, 4.5 10-13, 2.5 10-15, 3.3 10-13 ergs cm-2 s-1, respectively. Since SrcB is the brightest X-ray source among all four detected Swift XRT sources, we calculated the luminosity of SrcB to be 6 10 31 erg s-1 at a distance of 1 kpc.
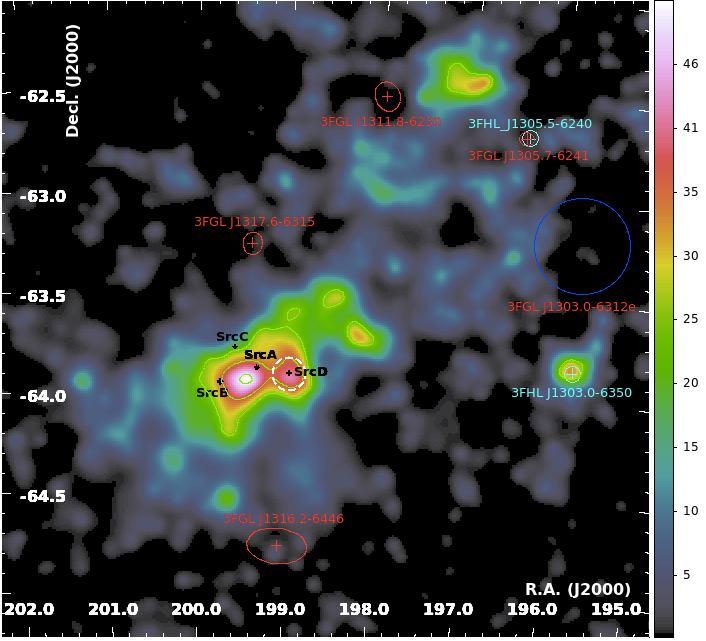
We checked the 3rd Fermi-LAT source catalog (3FGL) [1] and the 3rd catalog of hard Fermi-LAT sources (3FHL) [2] to find possible counterparts for Source A and the associated X-ray sources. In Figure 1 Swift X-ray sources are shown with black markers. Fermi-LAT sources from the 3rd Fermi-LAT source catalog are shown in red markers. Sources from the 3FHL catalog are shown in cyan markers. The extended 3FGL source (3FGL J1303.0-6312e) was also reported in the 3FHL catalog and its extension is shown as a blue circle. The green contours are for the gamma-ray TS values (25, 36, 49). We could not find any counterparts for Source A in 3FGL and 3FHL catalogs. The white dashed circle shows the radio source PMN J1315-6354.
3 Analysis & Results of Gamma-ray Data
After discovering the X-ray sources within Source A, we re-analyzed the gamma-ray data. We used data between 2008-08-04 and 2017-06-30. We analyzed events within the energy range of 200 MeV - 300 GeV using the Fermi analysis toolkit fermipy333http://fermipy.readthedocs.io/en/latest/index.html. We selected Fermi-LAT Pass 8 ‘Source’ class and front+back type events, which come from zenith angles smaller than 90∘ and from within a circular region of interest (ROI) with a radius of 20∘ centered at the best-fit position of Source A. The maximum likelihood fitting method was employed on the spatially and spectrally binned data and used the instrument function P8R2-SOURCEV6. The gamma-ray background model contains Galactic diffuse sources (gll-iemv6.fits) and isotropic sources (iso-P8R2-SOURCEV6v06.txt). It also includes all point-like and extended sources from the 3rd Fermi-LAT Source Catalog located within a 1515∘ region centered at the ROI center. Freed normalization parameters of sources that are within 3∘ of ROI center. Freed all parameters of the diffuse Galactic emission and the isotropic component. All sources with TS 10 are set free and all sources with TS 10 are fixed. The analysis region shown by the 1010∘ TS map covers a very large area in the sky and Source A seems to show some sub-structures, but the X-ray sources concentrated around the best-fitted location of Source A. In order to clarify how much each X-ray source is contributing to Source A’s total gamma-ray emission, we added each of the X-ray sources one by one as a point-like source into the gamma-ray background model. Then we checked for the significances and produced a TS map for every version of the gamma-ray background model. Since SrcC is located out of the 5 contours of Source A, we assumed that it is not a part of Source A. Thus, we excluded SrcC from the gamma-ray analysis.
| Included Source Names | TS (SrcA) | TS (SrcB) | TS (SrcD) | TS (G306.30.9) |
|---|---|---|---|---|
| G306.30.9 | - | - | - | 55.48 |
| SrcA & G306.30.9 | 128.92 | - | - | 14.42 |
| SrcB & G306.30.9 | - | 139.10 | - | 6.14 |
| SrcD & G306.30.9 | - | - | 111.89 | 27.50 |
| SrcA & SrcD & G306.30.9 | 89.29 | - | 24.26 | 6.08 |
| SrcA & SrcB & G306.30.9 | 42.57 | 46.86 | - | 8.15 |
| SrcB & SrcD & G306.30.9 | - | 74.09 | 50.59 | 9.13 |
| SrcA & SrcB & SrcD & G306.30.9 | 2.52 | 90.81 | 43.27 | 3.73 |
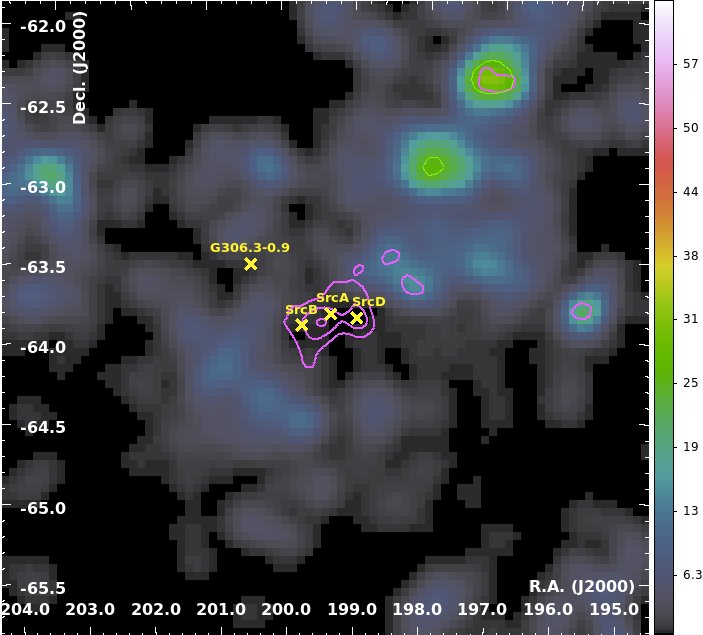
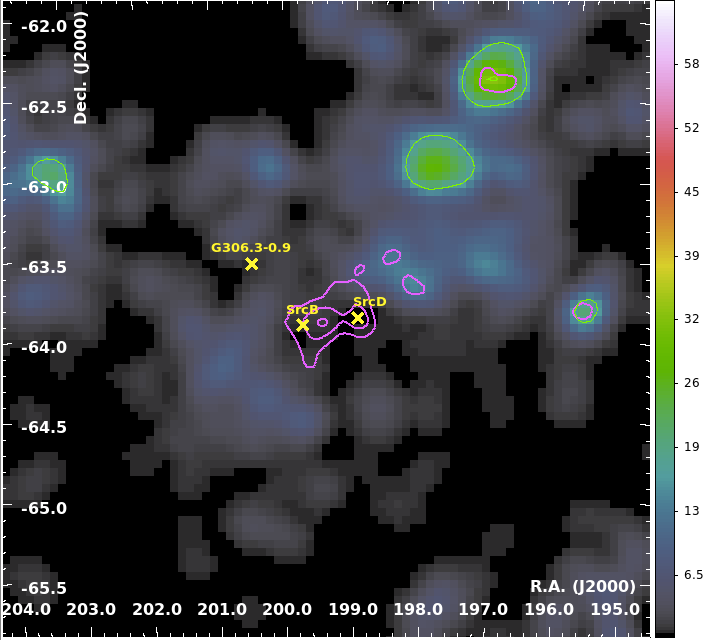
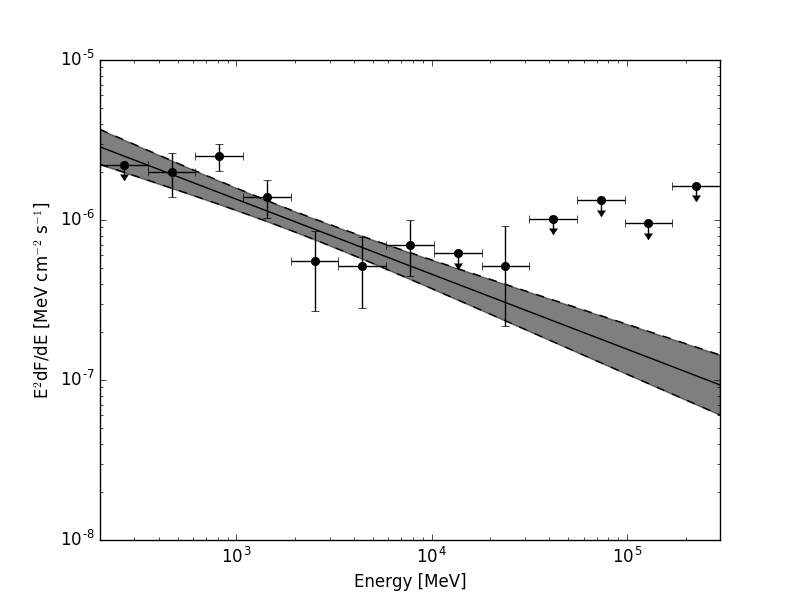
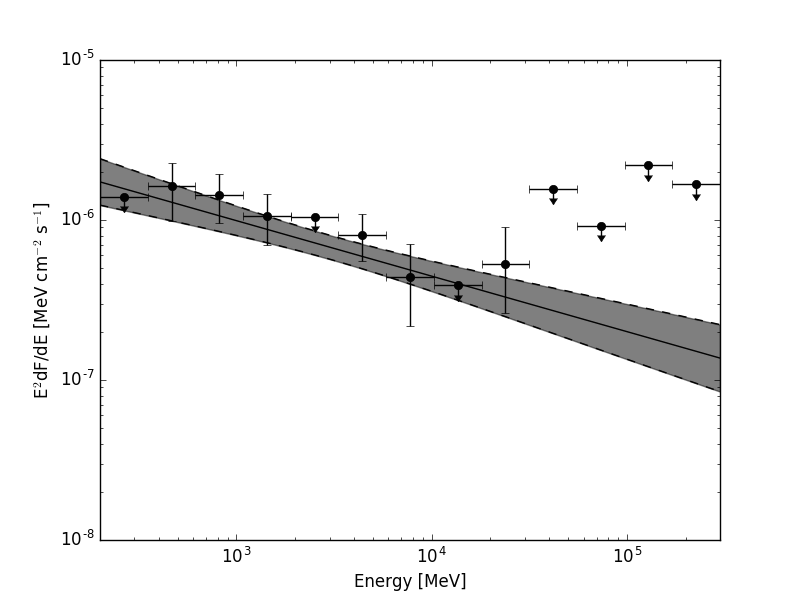
We found out that the included source combination of ’SrcB & SrcD & G306.30.9’ cleans all excess gamma-ray emission from the nearby region of the best-fitted position of Source A. Although including ’SrcA & SrcB & SrcD & G306.30.9’ source combination also gives comparable results to the ’SrcB & SrcD & G306.30.9’ combination, the TS value of SrcA comes out as 2.52 in the former analysis. The TS map with SrcA, SrcB, SrcD, and G306.30.9 included in the gamma-ray background model is shown in Figure 3 left panel and the same figure right panel shows the TS map for only including SrcB, SrcD, and G306.30.9 in the gamma-ray background model. A PL spectral fit to the spectra of SrcB and SrcD gives a spectral index of 2.47 0.12 and 2.35 0.14, respectively, and a total energy flux of (5.9 1.1) 10-6 MeV cm-2 s-1 and (4.6 1.0) 10-6 MeV cm-2 s-1, respectively. The spectra of SrcB and Src D are shown in Figure 4.
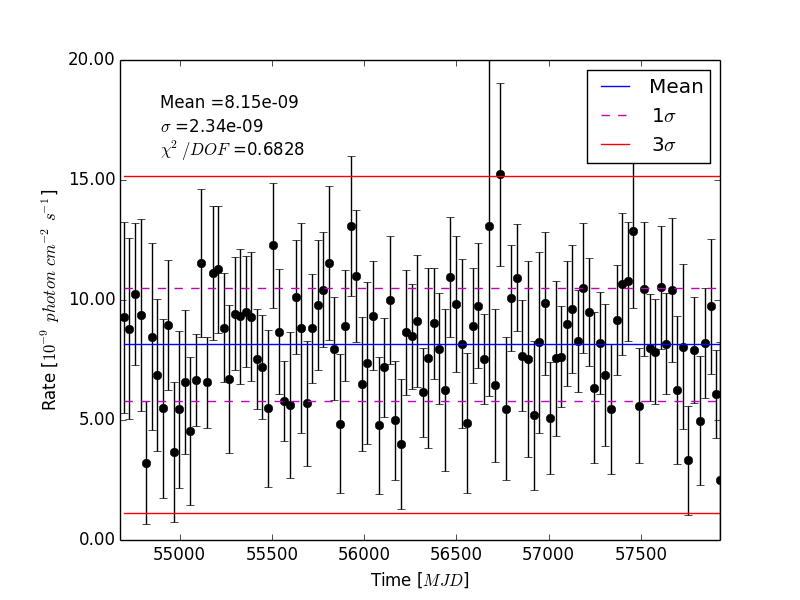
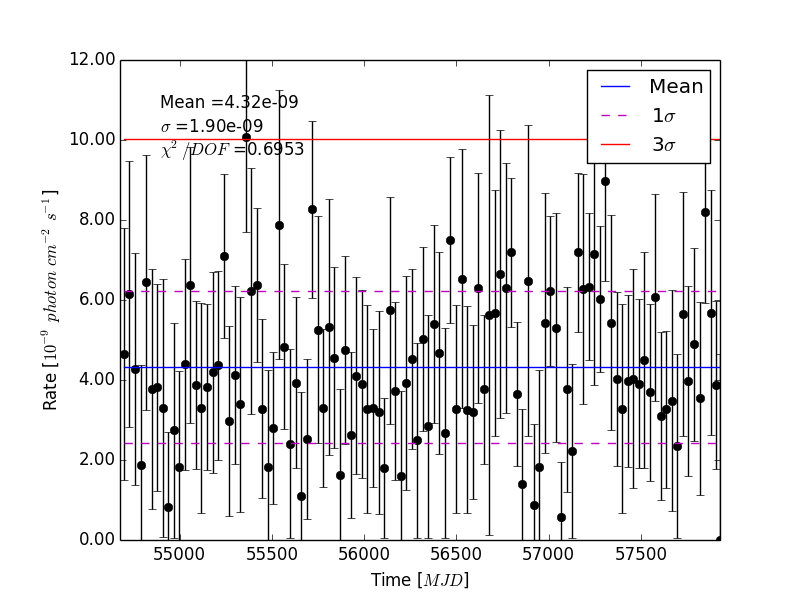
To see the long term variability in the light curve of SrcB and SrcD, we apply Fermi-LAT aperture photometry taking data from the circular region of 1∘ around the best-fitting position of SrcB and SrcD. For each source we applied the barycenter correction to the data. We also applied event weighing to keep only events with a probability of 10% of being from SrcB/SrcD. Higher probability values decreases the number of events abruptly. The 1-month-binned light curves of SrcB and SrcD assuming a PL-type spectrum in the energy range of 0.2 - 300 GeV are shown on the left and right panels of Figure 5.
4 Conclusions & Outlook
We analyzed the GeV gamma-ray data including the recently detected Swift XRT sources and the SNR G306.30.9 in the gamma-ray background as point-source source templates. Comparing the analysis results for the case where ’SrcA & SrcB & SrcD & G306.30.9’ source combination was part of the background model with the ones for ’SrcB & SrcD & G306.30.9’ source combination inside the background model, we found comparable results. However, by looking at the excess in the TA maps, ’SrcB & SrcD & G306.30.9’ source combination is favored. Possible source-type scenarios for SrcA, SrcB, SrcD are listed as follows:
-
•
SrcA has an optical counterpart, which is a star. It could be a gamma-ray binary, and if so, its variability has to be observed in various wavelengths. However, it is not detected in gamma rays (TS=2.52).
-
•
SrcB is the brightest X-ray source among all Swift XRT sources. It has no optical and radio counterpart, but was detected in gamma rays with a significance of 9. This source is possibly a quasar with a very weak radio emission, but probably the SUMSS sensitivity limit is insufficient for the detection of SrcB. Optical and radio observations are needed to confirm this estimate.
-
•
SrcD has a radio counterpart found in SUMSS. It was detected in gamma rays with a significance of 7. It may be a blazar candidate, but more observations are needed to show the variability in different wave-bands.
As a next step, we plan for multi-waveband observations (radio, optical, and X-rays) on SrcB and SrcD. In addition, we will re-analyze the gamma-ray data to do more variability checks and investigate the energy-dependent source morphology.
References
- [1] Acero, F., et al. (Fermi Collaboration), Fermi Large Area Telescope Third Source Catalog, AJSS, 218, 41 (2015)
- [2] Acero F. et al. (Fermi Collaboration), 3FHL: The Third Catalog of Hard Fermi-LAT Sources, AJSS, 232, 23 (2017)
- [3] Sezer, A,. Ergin, T., &Yamzaki, R., Suzaku analysis of the supernova remnant G306.30.9 and the gamma-ray view of its neighbourhood, MNRAS, 466, 3434 (2017)
- [4] Wright A.E., Griffith M.R., Burke B.F., & Ekers R.D., The Parkes-MIT-NRAO (PMN) Surveys: II. Source catalog for the Southern Survey (-87.5 ¡ ¡ -37∘), AJSS, 91, 111 (1994)