The relationship between trading volumes, number of transactions, and stock volatility in GARCH models
Abstract
We examine the relationship between trading volumes, number of transactions, and volatility using daily stock data of the Tokyo Stock Exchange. Following the mixture of distributions hypothesis, we use trading volumes and the number of transactions as proxy for the rate of information arrivals affecting stock volatility. The impact of trading volumes or number of transactions on volatility is measured using the generalized autoregressive conditional heteroscedasticity (GARCH) model. We find that the GARCH effects, that is, persistence of volatility, is not always removed by adding trading volumes or number of transactions, indicating that trading volumes and number of transactions do not adequately represent the rate of information arrivals.
1 Introduction
The empirical properties of asset returns have been intensively studied, and some universal properties are classified as ”stylized facts” [1]. The notable stylized facts include (1) no significant autocorrelation in returns, (2) long autocorrelation in absolute returns, (3) fat-tailed return distributions, and (4) volatility clustering. The return dynamics explaining these stylized facts have been the subject of numerous studies. Assuming that the return dynamics can be described by a Gaussian random walk with time-varying volatility, one possible explanation is that , where is a return, represents volatility, and is a random variable from at time . Several studies have verified this assumption [2]–[8] by examining whether is consistent with the random variable .
Yet another unresolved issue relates to volatility dynamics. Under the mixture of distributions hypothesis (MDH) proposed by Clark [9], volatility dynamics is related to the rate of information arrivals to the market. Since the rate of information arrivals is latent and unobservable, Clark used trading volume as a proxy for the rate of information arrivals. Empirical evidence indicates the existence of a contemporaneous correlation between volatility and trading volume; see, for example, [10].
On the other hand, the dynamic behavior of volatility is well captured by the autoregressive conditional heteroscedasticity (ARCH) model [11] and its extension, the generalized ARCH (GARCH) model [12]. In particular, the GARCH model successfully captures the persistence of volatility variation, referred to as GARCH effects. In the GARCH model, the volatility process is described by a function of past volatilities and returns. The MDH also implies that the volatility process is described by a function of trading volume. Lamourex and Lastraps [13] inserted trading volume into the GARCH process by using individual stocks in the US market and found that the GARCH effects disappear, supporting the MDH. Some subsequent studies, for example, [14, 15, 16, 17], also support their finding, that is, that the inclusion of trading volume in the GARCH model reduces the GARCH effects. On the other hand, some other studies, such as [18, 19, 20, 21, 22], report that the inclusion of trading volume in the GARCH model does not completely remove the GARCH effects; thus, the MDH is not supported.
In order to elaborate the volatility dynamics, we examine the relationship between trading volume and stock volatility by using the daily stock data of the Tokyo Stock Exchange from June 3, 2006, to December 30, 2009. Specifically, by including trading volumes into the GARCH process, we can infer the GARCH parameters and examine whether the GARCH effects can be explained by trading volume. We also use the number of transactions as a proxy for the rate of information arrivals and examine its effect on GARCH volatility.
2 GARCH Test
We focus on the GARCH(1,1) model [12] described by , and
| (1) |
where and are the GARCH parameters to be determined. The magnitude of persistence of volatility, that is, the GARCH effects, is measured by , and for high persistence of volatility, we observe that is close to 1. The effect of trading volume or the number of transactions is examined by adding a term to the GARCH process, as
| (2) |
where stands for either the trading volume or number of transactions at time . We infer the GARCH parameters by the Bayesian inference conducted using the Markov Chain Monte Carlo (MCMC) method [23]–[28].
3 Empirical Study
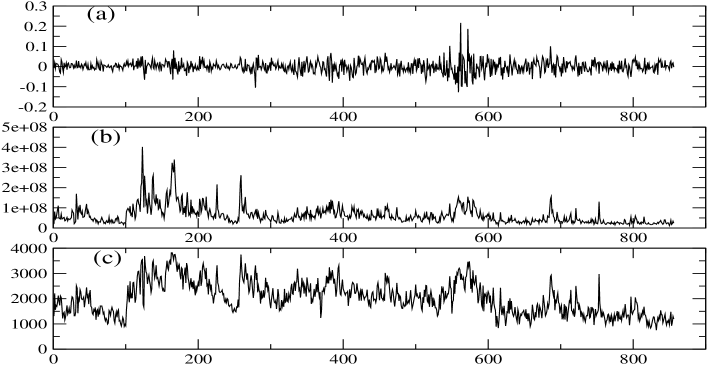
Our analysis is based on four individual stock data, (1) Astellas Pharma Inc., (2) JFE Steel Co., (3) Nippon Steel Co., and (4) Seven & i Holdings Co., on the Tokyo Stock Exchange. The sample period of our data is from June 3, 2006, to December 30, 2009. The stock return is defined by the log-price difference: , where is the closing stock price at day . Figure 1 shows the time series of (a) returns, (b) trading volume, and (c) number of transactions for Nippon Steel Co. as a representative case. We find no strong correlation between the returns and trading volume or number of transactions. The correlation coefficient between the returns and trading volume (number of transactions) is estimated to be 0.14 (0.02). On the other hand, we find a strong correlation between trading volume and number of transactions, .
For parameter estimations, we use the trading volume normalized by its average. Similarly, we use the number of transactions normalized by its average. We perform our GARCH parameter estimation in this study using the MCMC method based on the Bayesian inference. The MCMC method we use is the Metropolis–Hastings algorithm with a multivariate Student’s t-proposal density, which has been shown to be particularly efficient for GARCH parameter estimations [23]-[28]. After the first 5000 Monte Carlo samples are discarded as ”burn-in” or ”thermalization” process, we collect 50000 samples for analysis.
Table 1 shows the GARCH parameter results. For all stocks, we find that is close to 1, implying that a strong persistence of volatility, in other words, the GARCH effect, exists.
| Astellas Pharma Inc. | 0.095 | 0.857 | 0.188 | 0.952 |
| SD | 0.018 | 0.026 | 0.066 | |
| JFE Steel Co. | 0.096 | 0.895 | 0.126 | 0.991 |
| SD | 0.019 | 0.020 | 0.065 | |
| Nippon Steel Co. | 0.159 | 0.825 | 0.202 | 0.984 |
| SD | 0.031 | 0.032 | 0.086 | |
| Seven & i Holdings Co. | 0.117 | 0.873 | 0.0761 | 0.990 |
| SD | 0.027 | 0.028 | 0.0324 |
Table 2(3) shows the GARCH parameter results with trading volume (number of transactions). We find that even after including the trading volume or number of transactions in the GARCH process, the value of does not change much, except for Astellas Pharma Inc. Moreover, we find that is always positive, indicating positive correlations between volatility and the trading volume or number of transactions.
| Astellas Pharma Inc. | 0.232 | 0.251 | 0.043 | 1.97 | 0.483 |
| SD | 0.045 | 0.093 | 0.043 | 0.38 | |
| JFE Steel Co. | 0.108 | 0.851 | 0.046 | 0.373 | 0.959 |
| SD | 0.025 | 0.046 | 0.045 | 0.232 | |
| Nippon Steel Co. | 0.177 | 0.790 | 0.102 | 0.241 | 0.967 |
| SD | 0.037 | 0.043 | 0.081 | 0.131 | |
| Seven & i Holdings Co. | 0.166 | 0.786 | 0.0233 | 0.230 | 0.952 |
| SD | 0.045 | 0.064 | 0.0257 | 0.136 |
| Astellas Pharma Inc. | 0.194 | 0.588 | 0.052 | 0.827 | 0.782 |
| SD | 0.049 | 0.127 | 0.054 | 0.370 | |
| JFE Steel Co. | 0.100 | 0.872 | 0.050 | 0.233 | 0.972 |
| SD | 0.021 | 0.028 | 0.047 | 0.132 | |
| Nippon Steel Co. | 0.168 | 0.797 | 0.088 | 0.249 | 0.965 |
| SD | 0.034 | 0.041 | 0.079 | 0.150 | |
| Seven & i Holdings Co. | 0.132 | 0.846 | 0.0313 | 0.099 | 0.978 |
| SD | 0.033 | 0.037 | 0.0317 | 0.061 |
4 Conclusions
We examined the relationship between stock volatility and trading volumes or number of transactions by using four individual stock data of the Tokyo Stock Exchange from June 3, 2006, to December 30, 2009. We find that including the trading volume or number of transactions in the GARCH process does not always reduce the value of , that is, the magnitude of the GARCH effects. Thus, the mixture of the distributions hypothesis using trading volumes or number of transactions as a proxy for the rate of information arrivals is not completely verified. Since our findings are based on only four individual stock data, it might be interesting to further investigate the robustness of the volatility dynamics using other stock data.
Acknowledgment
Numerical calculations of this work were carried out at the Yukawa Institute Computer Facility and at the facilities of the Institute of Statistical Mathematics. This work was supported by JSPS KAKENHI Grant Number 25330047.
References
References
- [1] Cont R 2001 Quantitative Finance 1 223-236.
- [2] Andersen T G, Bollerslev T, Diebold F X, and Labys P 2000 Multinational Finance Journal 4 159-179.
- [3] Andersen T G, Bollerslev T, Diebold F X, and Labys P 2000 Great Realizations Risk 105-108.
- [4] Andersen T G, Bollerslev T, Diebold F X, and Labys P 2001 Journal of the American Statistical Association 96 42-55.
- [5] Andersen T G, Bollerslev T, Diebold F X, and Ebens H 2001 Journal of Financial Economics 61 43-76.
- [6] Andersen T G, Bollerslev T, Frederiksen F, and Nielsen M O 2010 Journal of Applied Econometrics 25 233-261.
- [7] Takaishi T, Chen T T, and Zheng Z 2012 Progress of Theoretical Physics Supplements 194 43-54.
- [8] Takaishi T 2012 Procedia - Social and Behavioral Sciences 65 968-973.
- [9] Clark P K 1973 Econometrica 41 135-155.
- [10] Karpoff J M 1987 Journal of Financial and Quantitative Analysis 22 109-126.
- [11] Engle R F 1982 Econometrica 50 987-1007.
- [12] Bollerslev T 1986 Journal of Econometrics 31 307-327.
- [13] Lamoureux C G and Lastrapes W D 1990 Journal of Finance 45 221-229.
- [14] Sharma J L, Mougoue M, and Kamath R 1996 Applied Financial Economics 6 337-342.
- [15] Brailsford T 1996 Accounting and Finance 35 89-111.
- [16] Miyakoshi T 2002 Japan and the World Economy 14 215-231.
- [17] Carroll R and Kearney C 2012 Applied Financial Economics 22 1993-2008.
- [18] Najand M and Yung K 1991 Journal of Futures Markets 11 613-621.
- [19] Bessembinder H and Seguin P J 1992 Journal of Finance 47 2015-2034.
- [20] Floros C and Vougas D V 2007 International Research Journal of Finance and Economics 12 98-115.
- [21] Ureche-Rangau L and de Rorthays Q 2009 Journal of Applied Statistics 36 779-799.
- [22] Bose S and Rahman H 2015 Applied Economics 47 1899-1908.
- [23] Takaishi T 2009 Lecture Notes of the Institute for Computer Sciences, Social Informatics and Telecommunications Engineering. Complex Sciences Vol. 5 1424.
- [24] Takaishi T 2009 New Advances in Intelligent Decision Technologies, Studies in Computational Intelligence Vol. 199 635.
- [25] Takaishi T 2009 Proceedings of 8th IEEE/ACIS International Conference on Computer and Information Science 525-529, doi:10.1109/ICIS.2009.173.
- [26] Takaishi T 2010 Journal of Physics: Conference Series 221 012011.
- [27] Takaishi T and Chen T T 2012 International Proceedings of Economics Development and Research 29 303-307.
- [28] Takaishi T 2013 Procedia Computer Science 22 1056-1064.