The Impact of Nuclear Reaction Rate Uncertainties
On The Evolution of Core-Collapse Supernova Progenitors
Abstract
We explore properties of core-collapse supernova progenitors with respect to the composite uncertainties in the thermonuclear reaction rates by coupling the reaction rate probability density functions provided by the STARLIB reaction rate library with MESA stellar models. We evolve 1000 15 M⊙ models from the pre main-sequence to core O-depletion at solar and subsolar metallicities for a total of 2000 Monte Carlo stellar models. For each stellar model, we independently and simultaneously sample 665 thermonuclear reaction rates and use them in a MESA in situ reaction network that follows 127 isotopes from 1H to 64Zn. With this framework we survey the core mass, burning lifetime, composition, and structural properties at five different evolutionary epochs. At each epoch we measure the probability distribution function of the variations of each property and calculate Spearman Rank-Order Correlation coefficients for each sampled reaction rate to identify which reaction rate has the largest impact on the variations on each property. We find that uncertainties in 14NO, triple-, 12CO, 12C(12C,)23Na, 12C(16O,)27Al, 16O(16O,)31S, 16O(16O,)31P, and 16O(16O,)28Si reaction rates dominate the variations of the properties surveyed. We find that variations induced by uncertainties in nuclear reaction rates grow with each passing phase of evolution, and at core H-, He-depletion are of comparable magnitude to the variations induced by choices of mass resolution and network resolution. However, at core C-, Ne-, and O-depletion, the reaction rate uncertainties can dominate the variation causing uncertainty in various properties of the stellar model in the evolution towards iron core-collapse.
1 Introduction
Core-collapse supernova (SN) explosions are one possible fate of a star with a zero age main-sequence mass of M 9 M⊙ (e.g., Woosley et al., 2002; Woosley & Heger, 2007; Farmer et al., 2015). The structure of the progenitor at the time of explosion can lead to a large variety of observed transient phenomena (e.g., Van Dyk et al., 2000; Ofek et al., 2014; Smith et al., 2016).
For progenitors experiencing mass loss, stellar winds may strip the H-rich envelope, and possibly some of the He-rich envelope, prior to core-collapse (e.g., Smith, 2014; Renzo et al., 2017). Explosions of these stars are characterized by an absence of hydrogen absorption features and weak or non-existent absorption lines of silicon in their spectra (Smartt, 2009; Dessart et al., 2011; Smartt, 2015; Reilly et al., 2016; Sukhbold et al., 2016). Progenitors with most of the H-rich envelope present at the end of their life are characterized as Type II supernovae that can be sub-divided into multiple classes based on lightcurve and spectral properties (Filippenko, 1997; Wang & Wheeler, 2008; Jerkstrand et al., 2015).
In some cases, a massive star with sufficient rotational energy at core collapse can produce a rapidly rotating, highly magnetic proto-neutron star capable of leading to a significantly enhanced energetic transient. Such a scenario has been postulated to explain the most energetic supernova observed to date, ASASSN-15lh (Sukhbold & Woosley, 2016; Chatzopoulos et al., 2016b; Chen et al., 2016), although Leloudas et al. (2016) offers on an alternative hypothesis on the nature of ASASSN-15lh.
Alternatively, a massive star may undergo iron core-collapse but the resulting shocks are insufficient to unbind the star, leading to accretion onto the nascent proto-neutron star and pushing it past its maximum mass. These “failed supernovae” (e.g., O’Connor & Ott, 2011) can produce stellar mass black holes at the rate suggested by the detection of GW150914, GW151226, and GW170104 (Abbott et al., 2016a, b, 2017), although a broad consensus on which massive stars produce black holes has not yet been reached (Timmes et al., 1996; Fryer & Kalogera, 2001; Heger et al., 2003; Eldridge & Tout, 2004; Zhang et al., 2008; Ugliano et al., 2012; Clausen et al., 2015; Sukhbold et al., 2016; Müller et al., 2016; Woosley, 2016; Kruckow et al., 2016; Sukhbold et al., 2017; Limongi, 2017).
For more massive progenitors, pair-instability leads to a partial collapse, which in turn causes runaway burning in the carbon-oxygen core (Fowler & Hoyle, 1964; Rakavy & Shaviv, 1967; Barkat et al., 1967; Rakavy et al., 1967; Fraley, 1968). A single energetic burst from nuclear burning can disrupt the entire star without leaving a black hole remnant behind to produce a pair-instability supernova (Ober et al., 1983; Fryer et al., 2001; Kasen et al., 2011; Chatzopoulos et al., 2013). Alternatively, a series of bursts can trigger a cyclic pattern of nuclear burning, expansion and contraction, leading to a pulsational pair-instability supernova that leaves a black hole remnant (Barkat et al., 1967; Woosley & Heger, 2007; Chatzopoulos & Wheeler, 2012; Woosley, 2017; Limongi, 2017). A variety of outcomes is possible depending on the star’s mass and rotation.
At the heart of these evolutionary pathways are nuclear reaction rates. These rates regulate the evolution of the star and can significantly modify the stellar structure of the progenitor star at the end of its life. A direct consequence of uncertainties in the reaction rates can result in differences in the nucleosynthesis and explosion properties (Rauscher et al., 2002; Woosley & Heger, 2007; Sukhbold et al., 2016; Rauscher et al., 2016).
Most reaction rate libraries provide recommended nuclear reaction rates based on experiment (when possible) or theory. Examples include CF88 Caughlan & Fowler (1988), NACRE (Angulo et al., 1999; Xu et al., 2013), JINA REACLIB (Cyburt et al., 2010), and STARLIB (Sallaska et al., 2013). STARLIB takes the additional step of providing the median or recommended thermonuclear reaction rate and the factor uncertainty () as a function of temperature. The factor uncertainty is an estimate of the uncertainty associated with a reaction rate at a given temperature given the available nuclear physics data. Monte Carlo (Longland et al., 2010; Longland, 2012; Iliadis et al., 2015, 2016) or Bayesian (Iliadis et al., 2016; Gómez Iñesta et al., 2017) based reaction rates generate probability density functions (PDFs) to provide a final median rate and a temperature-dependent uncertainty. The availability of formally derived temperature-dependent uncertainties allows statistically rigorous studies on the impact of the composite uncertainty on stellar models.
Reaction rate sensitivity studies have been considered for X-ray burst models (Cyburt et al., 2016) and massive star models through core He-burning (West et al., 2013) and for -process nucleosynthesis (Nishimura et al., 2017). In some of these and similar studies, temperature-independent estimates of the reaction rate uncertainties are applied as constant multiplicative factors on the recommended rate at all temperatures. This method can lead to an under- or over-estimate of the reaction rate for different stellar temperatures. Another common approximation is “post-processing” of thermodynamic trajectories from stellar models (e.g., Magkotsios et al., 2010; Rauscher et al., 2016; Harris et al., 2017), which also usually use a constant multiplicative factor at all temperature points. Post-processing thermodynamic trajectories neglect the feedback of the changes in the reaction rates on the underlying stellar model.
Fields et al. 2016 (Paper F16) addresses some of the shortcomings of these approximations by using a Monte Carlo stellar model framework with temperature-dependent uncertainties on the reaction rates from STARLIB. Specifically, used on 3 M⊙ stellar models evolved from the pre main-sequence to the first thermal pulse. Each of the 1000 models uses one set of reaction rates generated from the reaction rate PDFs. These Monte Carlo stellar models probed the effect of reaction rate uncertainties on the structure and evolution of stars that form carbon-oxygen (CO) white dwarfs. Paper F16 sample 26 reaction rates of the 405 total rates in the chosen reaction network, which can bias identifying the reactions that play role in altering the stellar structure.
In this paper, we apply the same Monte Carlo framework to massive star models. We consider all forward reactions in a suitable reaction network (reverse rates are calculated by detailed balance) to eliminate potential biases from selecting a limited set of reactions. Our workflow couples temperature-dependent reaction rate uncertainties from STARLIB (Sallaska et al., 2013) with Modules for Experiments in Stellar Astrophysics (MESA) stellar models (Paxton et al., 2011, 2013, 2015). We sample the reaction rates independently and simultaneously according to their respective PDFs. These sampled rates form input for 15 M⊙ models evolved from the pre main-sequence to core O-depletion. We focus on 15 M⊙ models as they approximately represent the most numerous SNe by number for a Salpeter initial mass function with slope = , and a lower limit of 9 M⊙ for stars that become SNe (Salpeter, 1955; Scalo, 1986; Sukhbold & Woosley, 2014; Farmer et al., 2015). We consider solar and subsolar metallicities to explore the effect of reaction rate uncertainties on stars in different galactic environments.
This paper is novel in two ways. First, we sample a large number of reaction rates (665 forward reactions) in a Monte Carlo stellar model framework where the rates are sampled before the stellar model is evolved. This accounts for changes in the stellar structure due to reaction rate uncertainties, and is fundamentally different than post-processing schemes. Second, we quantify the variation of key quantities of the stellar models at five key evolutionary epochs. This allows determination of (1) the most important reactions overall, and (2) when these key reactions play a crucial role in the life of a massive star. In short, this paper presents the first Monte Carlo stellar evolution studies of massive stars that use PDFs for the nuclear reaction rate uncertainties and complete stellar models.
In Section 2 we describe the input physics of our models. In Section 3 we discuss our Monte Carlo stellar model framework and quantify the uncertainty of a few key nuclear reactions. Before presenting the results of our survey, we describe the characteristics of baseline 15 M⊙ models evolved using median reaction rates from STARLIB in Section 4. In Section 5 we present our main results. In Section 6 we compare our results to previous efforts and make an assessment of the overall impact of the uncertainties due to nuclear reactions relative to other quantified sources of uncertainty (e.g., Farmer et al., 2016). In Section 7 we summarize our results.
2 Input Physics
We evolve 15 M⊙ models using MESA (version 7624, Paxton et al., 2011, 2013, 2015). All models begin with an initial metallicity of (“solar”, Caffau et al., 2010; Grevesse & Sauval, 1998; Asplund et al., 2009; Vagnozzi et al., 2017) or =210-3=0.0003 (“subsolar”). Solar metallicity models use isotopic distributions from Lodders et al. (2009), while subsolar models use the methods of West & Heger (2013)111Available from http://mesa-web.asu.edu/gce.html. The metallicity-dependent isotopic distributions from West & Heger (2013) reproduce enhancement trends for a large sample of low stars in the Milky Way halo (Frebel et al., 2010) thus motivating our choice for these distributions over solar-scaled compositions.
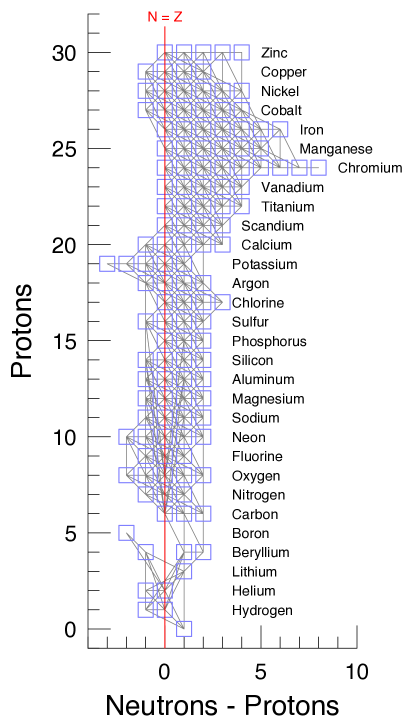
Farmer et al. (2016) show convergence of key quantities in 15 M⊙ MESA models at the 10% level when the reaction network contains 127 isotopes. Following their results, each stellar model utilizes the in-situ nuclear reaction network mesa_127.net, which follows 127 isotopes from 1H to 64Zn coupled by 1201 reactions. Figure 1 shows the 127 isotopes and their linking nuclear reactions. The isotopic abundance distributions we use contains 288 isotopes from 1H to 238U. We add the residual mass fraction () of the 161 isotopes not in the reaction network to the initial 1H mass fraction to maintain baryon number conservation , where is the mass fraction of isotope .
We include mass loss using the Dutch wind loss scheme (Nieuwenhuijzen & de Jager, 1990; Nugis & Lamers, 2000; Vink et al., 2001; Glebbeek et al., 2009) with an efficiency of =0.8. We neglect the effects of rotation, magnetic fields, and rotation induced mass loss in this study.
We use the Ledoux criterion for convection with an efficiency parameter of , and the mlt++ approximation for convection (Paxton et al., 2013). We include convective boundary mixing (overshoot, thermohaline, and semi-convection) with baseline values following Farmer et al. (2016). For convective overshoot we use = 0.004 and , which can reproduce mass entrainment rates found in idealized 3D simulations of explosive O-shell burning in massive stars (Jones et al., 2017). For simplicity, we apply the same overshoot efficiency to all boundaries. For thermohaline mixing, we use = 2.0 (Traxler et al., 2011; Brown et al., 2013; Garaud et al., 2015). Semi-convection uses an efficiency of = 0.01 (Zaussinger & Spruit, 2013; Spruit, 2013).
We use the MESA control mesh_delta_coeff, , to monitor mass resolution, which accounts for the gradients in the structure quantities to decide whether a cell should be split or merged. The default MESA value is unity. In this work, we use =0.5. This results in 2300 cells at the terminal age main-sequence (TAMS), 4700 at core He-depletion, and 2100 cells during core O-burning. Section 4 discusses the sensitivity of our results to mass resolution.
We use several of MESA’s timestep controls. The parameter varcontrol_target, , broadly controls the temporal resolution by restricting the allowed relative variation in the structure between timesteps. The default value is =. In this work, we use =, except during off-center C-burning where we use = to further improve time resolution. We also control the rate of fuel depletion with the delta_lg_X* timestep controls, where the asterisk denotes a major fuel (i.e. H, He, C, Ne, or O). In total, we observe timesteps of yr on the main sequence, yr during core He-burning, and hr during core O-burning. Section 4 discusses the sensitivity of our results to temporal resolution.
For each stellar model, we sample 665 forward reaction rates from STARLIB Archived Version 5 (Sallaska et al., 2013) simultaneously and independently within their temperature-dependent uncertainties. We calculate reverse rates directly from the forward rates using detailed balance. We utilize the work of Alastuey & Jancovici (1978) and Itoh et al. (1979) for reaction rate screening factors. The fitting formula of Itoh et al. (1996) provide the thermal neutrino energy losses. Weak reactions rates, in order of precedence, are from Langanke & Martínez-Pinedo (2000), Oda et al. (1994), and Fuller et al. (1985).
Each stellar model evolves from the pre main-sequence until the central O) 110-3. We use 1000 solar and subsolar stellar models, for a total of 2000 Monte Carlo stellar models. All MESA inlists and many of the stellar models are available at http://mesastar.org.
3 Reaction Rate Sampling
We construct a sampled nuclear reaction rate following Iliadis et al. (2015). We summarize the key characteristics here. The STARLIB rate library provides the median reaction rate, , and the associated , over the temperature range K. A log-normal PDF is assumed for all reaction and decay rates, and these PDFs are described by the location and spread parameters, and , respectively. These parameters are obtained using the median rate and tabulated in STARLIB as and . These two parameters give a complete description of the reaction rate probability density at any temperature point and form the basis of our sampling scheme.
A sampled reaction rate is drawn from a log-normal distribution (e.g., Evans et al., 2000) for an arbitrary quantity, , as
| (1) |
Using the relations for and , we obtain a sampled rate distribution as a function of temperature from
| (2) |
where is a standard Gaussian deviate with mean of zero and standard deviation of unity. The index correspond to the stellar model of grid size and the index corresponds to the number of reactions sampled.
We refer to as the rate variation factor for the -th reaction. From Equation 2, a rate variation factor of corresponds to the median STARLIB reaction rate. For large rate variation factors, the extent of change of the reaction rate at a given temperature point is limited by the factor uncertainty.
For example, for the reaction rate (Kunz et al., 2002), STARLIB shows that the largest value of factor uncertainty is at GK. For typical extrema of a Gaussian distribution such as those used to generate our rate variation factors, one could expect values of . In such a scenario, this would represent a change in the sampled nuclear reaction rate of for and for at . At all other temperature points, the modification of the median rate may be less for the same value of .
In Figure 2 we plot the for the 12C(,)16O, 14N(,)15O, 23Na(,)20Ne, and triple- reaction rates over typical core He-, C-, Ne-, and O-burning temperatures. The 12C(,)16O rate has the largest factor uncertainty across the temperature ranges considered. At higher temperatures such as those expected in more advanced burning stages post core O-burning, the uncertainty in the 12C(,)16O begins to be overtaken by the uncertainty in the triple- reaction.

We simultaneously and independently sample 665 forward thermonuclear reaction rates. For each reaction, we generate =1000 random Gaussian deviates to modifying the reaction rates in the stellar models. Our choice for the sample size is motivated by the scaling of the sampling error for perfectly uncorrelated distributions. For such a distribution we expect a standard error of . Since MESA calculates inverse rates directly from the forward rates using detailed balance, we also implicitly sample the corresponding 665 inverse rates. However, the corresponding inverse sampled rates are not independent of the forward sampled reactions.
Reaction rates derived from Monte Carlo sampling of experimental nuclear data are available for 33 of the 665 reactions considered (Iliadis et al., 2010; Sallaska et al., 2013; Iliadis et al., 2015, 2016). For other reactions, Monte Carlo or Bayesian derived rate distributions are not yet available. In these such cases, median rate values and the corresponding temperature dependent are obtained from estimates of experimental uncertainty where available. In the absence of experimental nuclear physics input, theoretical median reaction rates are obtained from Hauser-Feshbach model calculations with the TALYS software instrument (Goriely et al., 2008). Such theoretical rates are given a constant uncertainty of at all temperature points.
We assume the random Gaussian deviate is independent of temperature, constant (Iliadis et al., 2015). This simplification obtains similar levels of uncertainties as more intricate sampling schemes (Longland, 2012). We stress that despite this simplification, the provided by STARLIB is temperature-dependent. This allows us to follow changes in the uncertainty that may occur due to different resonance contributions.
The sampled reaction rate distributions are then constructed using Equation (2). Each nuclear reaction rate in STARLIB has a total of 60 , and data points. A sampled reaction rate also contains 60 data points and is then passed to MESA in tabular form. MESA interpolates between data points to construct a smoothed sampled nuclear reaction rate defined by 10,000 reaction rate data points as a function of .
4 Properties of the baseline 15 M⊙ stellar models
Before presenting the results of our Monte Carlo stellar models survey, we discuss the properties of the baseline 15 M⊙ solar and subsolar models. These baseline models were evolved using the input physics described in Section 2 and the median STARLIB nuclear reaction rates. A median reaction rate is obtained in our sampling scheme by a Gaussian deviate of zero, .
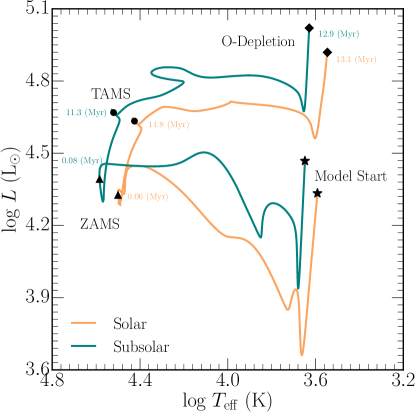
Figure 3 shows a Hertzsprung-Russell diagram of the solar and subsolar baseline 15 M⊙ stellar models. The start of the stellar models, the zero age main sequence (ZAMS), terminal age main sequence, and the ending point of core O-depletion are annotated. The subsolar model is brighter and hotter than the solar model primarily because a smaller metallicity decreases the opacity in the stellar atmosphere. At ZAMS, the subsolar model has a luminosity and effective temperature of (/L⊙) 4.39 and (/K)4.58 while the solar model has (/L⊙) 4.33 and (/K) 4.50. The solar model spends 11.2 Myr on the main sequence while the subsolar model spends 11.7 Myr.
The ZAMS homology relations for CNO burning, constant electron scattering opacity, and radiative transport (Hoyle & Lyttleton, 1942; Faulkner, 1967; Pagel & Portinari, 1998; Bromm et al., 2001; Portinari et al., 2010) are:
| (3) |
The ZAMS positions of the solar and subsolar models in Figure 3 and commensurate with the trends of Eq. 3.
At the TAMS, the nascent He-rich core is surrounded by a thin H-burning shell. The core contracts and its temperature increases, while the outer layers of the star expand and cool. The star becomes a red giant (e.g., Iben, 1966, 1991; Stancliffe et al., 2009; Karakas & Lattanzio, 2014). The solar model spends 1.54 Myr undergoing convective core He-burning and the subsolar model spends 1.27 Myr. At He-depletion, the solar model has a He-core mass of 4.24 M⊙ and a 12C/16O ratio of 0.34. The subsolar model has a more massive, slightly more C-rich core with 4.80 M⊙ and 12C/16O 0.36.
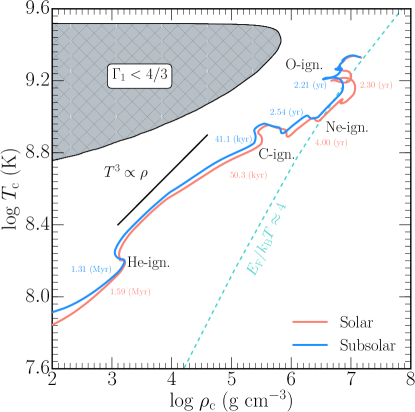
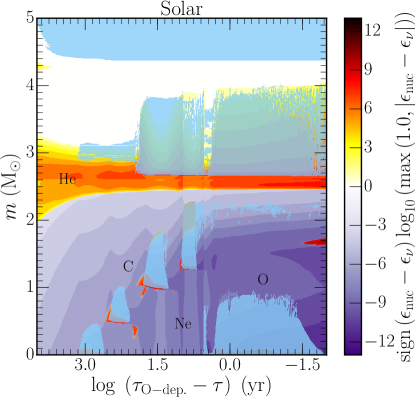
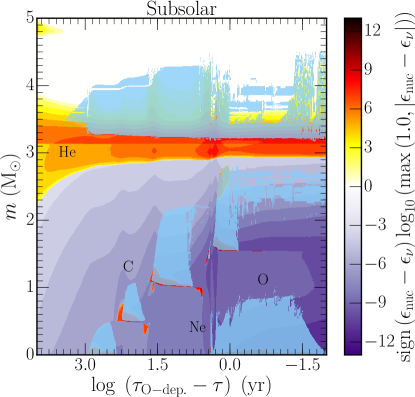
The trajectory of the baseline models in the plane are shown in Figure 4. In general, the tracks are qualitatively similar. The largest difference is the subsolar model undergoes hotter, less dense core burning. This is a result of the decreased stellar envelope opacity and larger luminosity shown in Figure 3. Figure 5 shows Kippenhahn diagrams for the baseline models post core He-burning. The C-burning features of both baseline models are similar; they both ignite carbon convectively at the core and undergo three convective C-burning flashes that recede outward in mass coordinate.
Post C-depletion, the photodisintegration of 20Ne drives convective core Ne-burning. This burning phase lasts 1.7 years for the solar model and 0.33 years for the subsolar model. After Ne-depletion, core O-burning begins at 1.8109 K and 9.1106 g cm-3. The initial core O-burning episode is energetic enough to drive a large convection region that initially extends to 0.9 M⊙. At core O-depletion, we find a composition of 0.524, 0.189, and 0.244 for the solar model. Other isotopes show central mass fractions of 10-2. The subsolar model has an O-depletion composition of 0.522, 0.175, and 0.236 with other burning products having negligible central mass fractions. The central electron fraction at this point is and for the solar and subsolar models, respectively. Our choice of stopping criterion does not signify the end of O-burning.
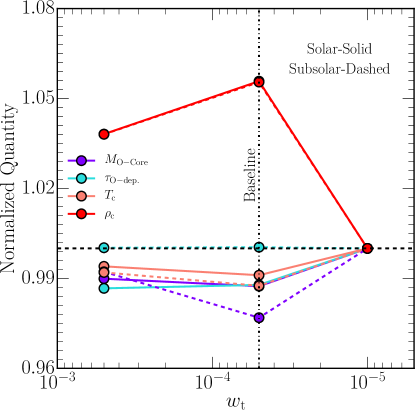
Lastly, we consider the impact of mass and temporal resolution on key physical parameters relevant to this paper by evolving eight additional baseline models. Figure 6 shows the results for = (1.0, 0.25) at our fixed baseline temporal resolution of = 510-5, and = (510-4, 110 at our baseline mass resolution of = 0.5. Otherwise the solar and subsolar models use the same median reaction rates and input physics as the baseline models. For , the largest variation is in the central density for the subsolar models. All other quantities have variations at the highest mass resolution considered. For , the largest variation is 5% in the central density, and all other quantities have variations of 3%.

5 Monte Carlo Stellar Models
We evolve two grids of Monte Carlo stellar models. The first grid consists of 1000 Monte Carlo stellar models at solar metallicity. Each model has a different set of sampled nuclear reactions; otherwise each model has the same input physics as the baseline model. We refer to this set of models as the “solar grid”. The second set consists of 1000 models at a metallicity of =0.0003, henceforth the “subsolar grid”. Each stellar model takes 60 hours on 4 CPUs. The total computational expense is 0.48 M CPU hours and generates 1 TB of data.
Some properties of a stellar model may be more important at different evolutionary phases. For example, the time spent on the main-sequence is a direct consequence of the 14NO reaction which modulates the rate at which the CNO cycle may proceed (Imbriani et al., 2004). At core He-depletion, the central carbon mass fraction, temperature, or density affects whether carbon ignites radiatively or convectively (Lamb et al., 1976; Woosley & Weaver, 1986; Petermann et al., 2017). Such features are directly linked to key nuclear reaction rates. We thus consider different properties of our stellar models at five evolutionary epochs: central H-, He-, C-, Ne-, and O-depletion. The properties considered at each epoch are commonly held to be significant for connecting presupernova stellar models to observed transients, stellar yields for chemical evolution, or predicting SN properties (e.g., Nomoto et al., 2013; Couch et al., 2015; Janka et al., 2016; Côté et al., 2017).
To determine the reaction rates that have the largest impact on different properties of the stellar models at different evolutionary phases, we use a Spearman Rank-Order Correlation (SROC) analysis. A SROC is the Pearson correlation coefficient between the rank values of two variables (Myers & Well, 1995). The raw scores and are converted to ranks rg and rg, sorted in descending order according to magnitude, and the SROC is
| (4) |
where is the covariance matrix of the two variables and , and and are the standard deviations of and , respectively A SROC of = +1 represents a perfectly monotonically increasing relationship, = 0, perfectly uncorrelated, and = 1, monotonically decreasing.
5.1 Hydrogen Depletion
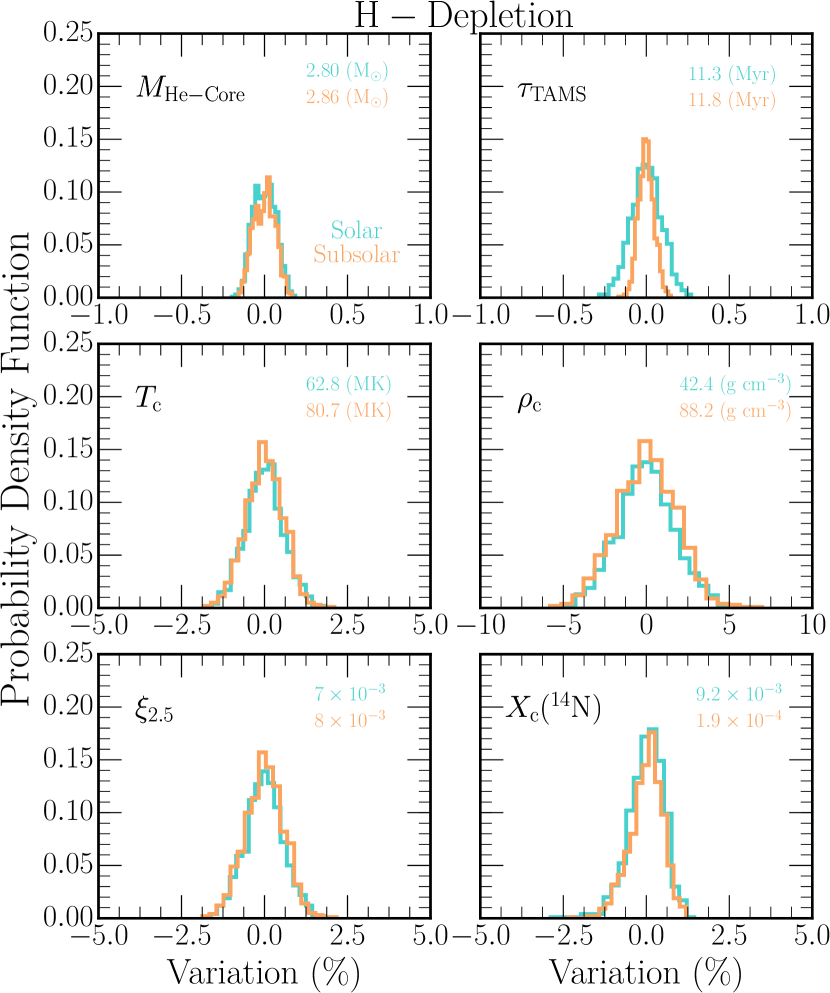

We consider six properties at core H-depletion, which we define as the time point when the central 1H mass fraction drops below 10-6: the mass of the He core , age , central temperature , central density , compactness parameter, effectively the depth of the gravitational potential well at the expected maximum mass of a neutron star, =, and central 14N mass fraction .
5.1.1 Probability Distribution Functions
Figure 7 shows the PDFs of these six properties of the stellar models at this epoch. The x-axis is the variation, where is a value of a property for a single model and is the arithmetic mean of the distribution. The amplitude of the histogram corresponds to the fraction of the 1000 models within a given bin. In this paper, the number of bins is chosen according to the Rice Rule, , where is the number of bins and is the number of samples (Lane, 2013). While different bin widths can reveal different features of the distribution, we find this choice of bins sufficient for the discussion of the histograms presented here.
Throughout this paper we use the 95% Confidence Interval (CI) limits. These are defined, for each PDF, to be the limits corresponding to the unique cumulative distribution function containing 95% of the PDF. This allows reporting the most likely () values of a property without the effects of outliers in the data. This definition is different than a canonical CI derived from an assumed distribution function model of the data.
We define as the mass coordinate where H) 0.01 and He)0.1. The 95% CI widths of the PDFs span a narrow 0.1% across the mean of the distribution for both solar and subsolar models. Both PDFs show well-defined zero variation peaks of 2.80 M⊙ for the solar models and 2.86 M⊙ for the subsolar models.
The 95% CI width of the PDF for the solar models, 0.2%, is larger than the width of the PDF for the subsolar models, 0.1%. We defer an explanation of this difference until we discuss Figure 8. The solar and subsolar PDFs are symmetric about their zero variation values of 11.3 Myr and 11.8 Myr, respectively.
The and PDFs show the solar models are slightly cooler and less dense than the subsolar models, with zero variation values of (62.8 MK, 80.7 MK) and (42.4 g cm-3, 88.2 g cm-3), respectively. After H-depletion, the solar models will proceed to burn He at a cooler core temperature but more dense core. This trend is seen in Figure 4. Note the subsolar models have larger and yet longer lifetimes . In addition, the 95% CI width of the PDFs are 1.2%, and the 95% CI width of the PDFs are 4%.
Traditionally is evaluated at core collapse. Our motivation for measuring starting at H-depletion is to assess the evolution of the variability in ; when do significant variations first seed and how do the variation grow. The 95 % width of the PDF at H-depletion, 1.2%, is dependent upon the narrow PDF and the wider PDF. In addition, depends on the gradient of the density profile. The zero variation values of the solar and subsolar grids show small differences at this epoch with (710-3, 810-3), respectively.
Nitrogen is the dominant metal in the ashes of H-burning in massive stars because the 14N()15O rate is the smallest in the CNO cycles (e.g., Iben, 1966). This is reflected in the PDFs by the zero variation values, 9.210-3 for the solar models and 1.910-4 for the subsolar models, being approximately equal to the sum of the ZAMS CNO mass fractions. The 95% CI width of the PDF, 1%, is consistent with the spreads in the other quantities measured.
5.1.2 Spearman Correlation Coefficients
Figure 8 shows the SROC coefficients for the solar and subsolar grids. The coefficients for the solar grid is shown by circles while the subsolar grid is shown by diamond markers. A positive correlation coefficient is represented by a blue marker, while a negative coefficient is denoted by a red marker. For each property shown, the rate identifier corresponding to the largest magnitude SROC coefficients are marked by a vertical dashed line and label.
The 14N()15O rate has a large impact on all the quantities we measure. For example, the 14N()15O rate has the largest SROC coefficient for , with +0.99 for the solar and subsolar models. Coefficients of the remaining 664 reactions are significantly smaller, . This suggest that is a directly dependent on the 14N()15O rate, with a larger rate increasing the lifetime to core H-depletion (e.g., Imbriani et al., 2004; Weiss et al., 2005; Herwig et al., 2006).
Increasing a reaction rate usually increases the nuclear energy generation rate, which deposits its energy into thermal energy. The core temperature rises. Via the equation of state, the pressure increases, which causes the stellar core to expand. This expansion decreases and , and thus causes nuclear burning to proceed at a slower rate. The net result of increasing an energetically important reaction rate is a longer burning lifetime and a decreased and . This is the well-known thermostat mechanism (e.g., Hansen et al., 2004; Iliadis, 2007).
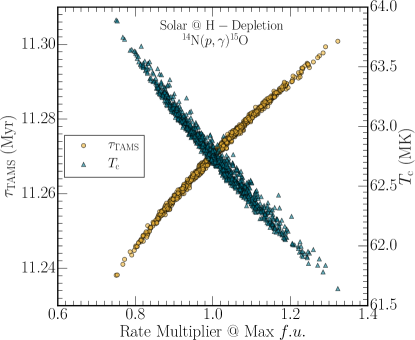
Figure 9 shows the age and at H-depletion for the solar models as a function of the rate multiplier applied at max for the 14N()15O reaction. Least-square fits to the linear trends yield the slope of the thermostat mechanism: , Myr/MK. This correlation is confirmed by the large and negative SROC coefficients between the 14N()15O rate and , , and . The thermostat mechanism also causes the slightly larger zero variation of for the subsolar models relative to the solar models in Figure 7.
5.1.3 Impact of the Measurement Point
To assess the impact of the choice of the measurement point, we repeat our SROC analysis during core H-burning at the point . We compare the magnitude of the SROC values for , , , and for both the solar and subsolar models.
Qualitatively, 14N()15O still drives the variation in the age with a positive correlation, and the variations in , , and with negative correlations. The difference of the SROC values between the two epochs agree to for , , and and for . This re-evaluation suggests the PDFs vary slightly based on the chosen measurement point and identifying the key reactions from the SROC analysis is an invariant.
5.2 Helium Depletion
We measure the integrated impact of the uncertainties in the reaction rates at the point when the central helium mass fraction X(4He) .
5.2.1 Probability Distribution Functions
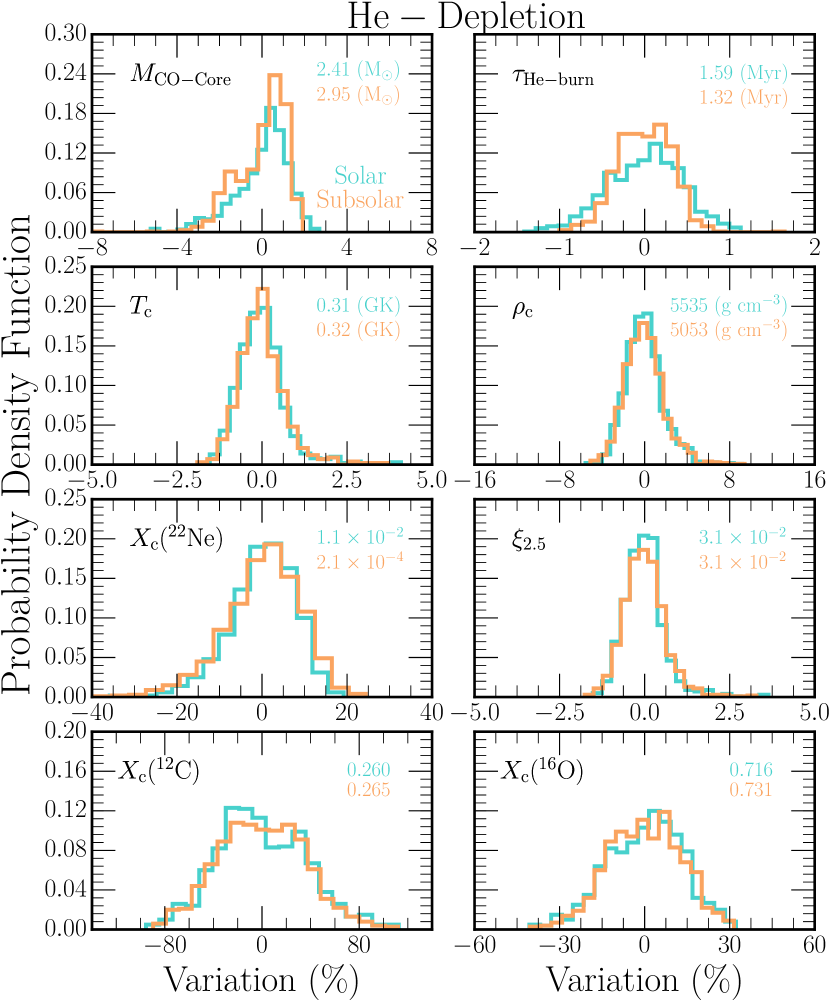
Figure 10 shows the PDFs of eight properties from the stellar models at this epoch: mass of the CO core , the elapsed time between H-depletion and He-depletion , central temperature , central density , central 22Ne mass fraction Ne), compactness parameter , central 12C mass fraction C), and central 16O mass fraction O).
The 95% CI width of the PDF spans 2% for the solar and subsolar grids. Both PDFs show a well-defined peak of 2.41 M⊙ for the solar models and 2.95 M⊙ for the subsolar models and an extended tail for negative variations. That is, changes in the reaction rates are more likely to produce smaller C cores than more massive C cores. This asymmetry accounts for the PDFs not being centered at zero variation.
The solar and subsolar grid PDFs for have a 95% CI spread of , suggesting rate uncertainties have a smaller impact on . The solar PDF is slightly wider the subsolar PDF, and both PDFs are symmetric about their respective arithmetic means.
The and PDFs show 95% CI widths of and , respectively, for both solar and subsolar models. Both PDFs are centrally peaked with 1% differences between the arithmetic means of the solar and subsolar models. Both PDFs exhibit long tails in the positive variation direction, indicating some combinations of the reaction rates produce cores that are 5% hotter than the mean and 10% denser than the mean.
The solar and subsolar grid PDFs for (22Ne) PDF are nearly the same. However, the arithmetic mean of the two PDFs differ by a factor of 50. The reason for this difference is that most of a ZAMS star’s initial metallicity comes from the CNO and 56Fe nuclei inherited from its ambient interstellar medium. The slowest step in the hydrogen burning CNO cycle is 14N()15O, which causes all the CNO catalysts to pile up at 14N at core H-depletion. During He-burning the sequence 14N(,)18F()18O(,)22Ne converts all of the 14N into the neutron-rich isotope 22Ne. Thus, (22Ne) at core He-depletion is linearly dependent on the initial CNO abundances. The subsolar models have 50 times less initial CNO than the solar models, accounting for the difference in the arithmetic means.
The solar and subsolar PDFs for are similar in peak amplitude, 95% CI width ( 1.2%), symmetry about zero variation, and mean arithmetic value. That is, rate uncertainties have little impact on differentiating between solar and subsolar metallicities. Similar to the and PDFs, there are outlier models whose reaction rate combinations produce larger .
The largest variations occur in the C) and O) PDFs with 95% CI widths of 70% and 25%, respectively. The common driver for these variations are the triple-, 12C()16O, and 16O()20Ne rates, whose roles we discuss below.
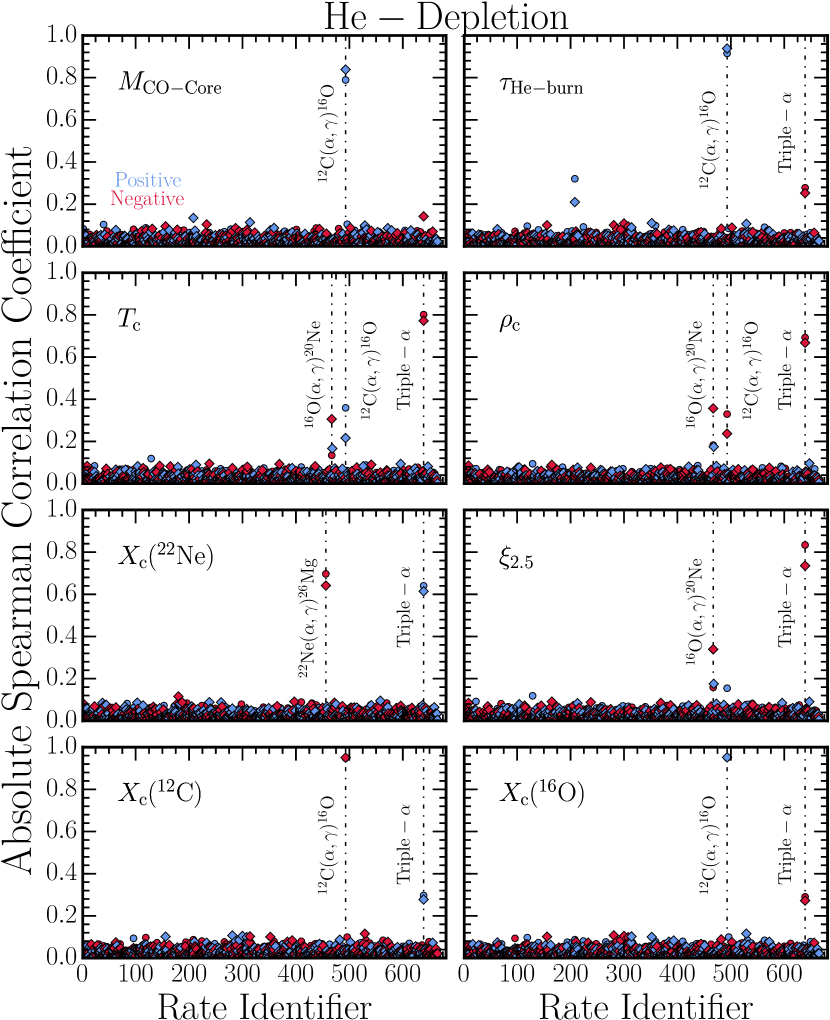
5.2.2 Spearman Correlation Coefficients
Figure 11 shows the SROCs for the 665 independently sampled thermonuclear reaction rates against the eight quantities considered in Figure 10. The is chiefly set by the 12C()16O rate with +0.8 for both metallicity grids. Larger 12C()16O rates build larger CO core masses. The triple- rate plays a smaller role with for both metallicity grids. Similarly, is primarily set by the 12C()16O rate with coefficients of , respectively. The triple- rate plays a less significant role with .
In contrast, and are chiefly affected by the uncertainties in the triple- rate with and , respectively. These large negative SROCs mean the thermostat mechanism,discussed for H-burning, namely larger energy producing reaction rates yield cooler and less dense cores, operates during He burning. The 12C()16O and 16O()20Ne rates play smaller roles with +0.4. Note that the positive correlation means larger 12C()16O rates produce hotter cores, in juxtaposition to the triple- rate. This is because a larger 12C()16O converts more carbon into oxygen, so the core burns hotter at any given triple- rate (which dominates the energy generation) to satisfy the luminosity demanded by the surface of the stellar model. Outliers with positive variations in the and PDFs of Figure 10 are caused by combinations of the 12C()16O and triple- reactions. For a small triple- rate, the model will be hotter and more dense. When this is coupled with a large 12C()16O rate, the stellar models at He-depletion have a hotter and denser core with increased by +5% and and increased by +10%.
The mass fraction of the neutron-rich 22Ne isotope, is set by the competition between the triple- and 22Ne(,)26Mg rates. The triple- rate sets and , with a larger rate giving cooler and denser cores that favor the production of 22Ne by the sequence 14N(,)18F()18O(,)22Ne. This is the origin of the positive SROC coefficient for the triple- rate in the solar and subsolar grids. On the other hand, 22Ne(,)26Mg destroys 22Ne, storing the neutron excess in 26Mg. This accounts for the negative SROC coefficient of 22Ne(,)26Mg for both metallicity grids.
is chiefly set by the triple- rate with = 0.83 and = 0.74 for the solar and subsolar models respectively. A larger triple- rate produces a smaller , due to the decrease in overall density of the stellar core. For the subsolar models the 16O()20Ne rate plays a smaller role ( = ), but also decreases as the rate becomes larger. The solar and subsolar PDFs for shows outliers with variations up to 5%. These outliers form from same combination of reaction rates that produce denser stellar models. Namely, models with high have either a depressed triple- rate, an enhanced 12C()16O, or both.
During quiescent He-burning the 3-process and the 12C()16O reaction burn with high efficiency through pronounced resonance mechanisms (e.g., deBoer et al., 2017). In contrast, the 16O()20Ne reaction lacks any such resonance enhancement in the stellar energy range making its rate comparatively much lower. This essentially prohibits significant He-burning beyond 16O and maintains the 12C/16O balance we observe today.
The 12C()16O rate sets C) and O) for both solar and subsolar models with and +0.95, respectively. A larger 12C()16O rate destroys more C and produces more O. The triple- rate plays a smaller role in setting C) and O) with +0.29 and , respectively. A larger triple- rate produces more C and less O. These results suggest C) and O) are determined primarily by the uncertainties in these two reaction rates.
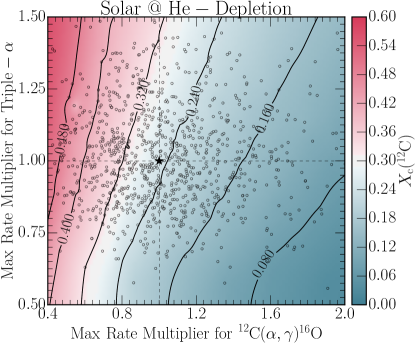
5.2.3 Triple- and 12C()16O
Figure 12 shows (12C) at He-depletion for the solar models as a function of the rate multiplier at max (over core He-burning temperatures) applied to the 12C()16O and triple- rates (see Figure 2). A 12C()16O rate that is small relative to median value and a triple- rate that is large relative to its median value produces a large (12C). Conversely, a high 12C()16O rate and a small triple- rate produces a small (12C). When both rates are at the median value of their respective PDFs, unity rate multipliers in Figure 12, (12C) 0.26 (see Figure 10). The trend is commensurate with West et al. (2013, their Figure 20).
5.2.4 Impact of the Measurement Point
Core He-burning is initiated by the triple- reaction releasing 7.27 MeV of energy. At early times, nuclear energy generation in the core is governed by this reaction rate. The emergence of fresh 12C as a product of the triple- reaction allows 12C()16O to convert the 12C ashes into 16O in a race between the two reactions to consume the He fuel (e.g., deBoer et al., 2017). The 12C/16O ratio is determined by these two reaction rates.
Due to this evolution, we re-evaluate our SROC coefficients midway through the core He-burning process, when 0.5. The structural properties , and agree qualitatively when comparing the midway and depletion points of the solar models. A midway measurement point yields 15% stronger correlations. The triple- rate still drives the variations with a negative SROC. For C) and O) the midway and He-depletion measurement points for the solar models differ by in the SROC values.
When measuring midway through the core He-burning process, variations in for the solar models become mainly driven by the 14N()15O rate with a positive SROC coefficient. An increase in this rate causes the stellar core to proceed through core H-burning at lower . When measuring midway through He-burning, we find the 14N()15O rate also yields a negative SROC coefficient for . Models with lower proceed through He-burning at a slower rate, hence increasing the helium burning lifetime .

5.3 Carbon Depletion
Next, we measure the integrated impact of the reaction rate uncertainties at the point when the central carbon mass fraction .
5.3.1 Probability Distribution Functions
Figure 13 shows the PDFs of eight properties of the 15 M⊙ models at C-depletion: mass of the ONe core , the elapsed time between He-depletion and C-depletion , central temperature , central density , central electron fraction , compactness parameter , central 16O mass fraction O), and central 20Ne mass fraction Ne).
The distribution has 95% CI variation limits of +23% and 50% for the solar and subsolar models. This is wider than the spread in the He core mass at H-depletion () or the CO core mass at He-depletion (). We defer explanation to Section 5.3.3 In addition, the solar model PDF has a larger peak amplitude compared to the subsolar model PDF.
In contrast, the 95% CI spread of the distribution shows about the same narrow width of 1% as and . This is chiefly due to the CO core mass to be burned laying within a relative narrow range ( 3%, see Figure 10). The solar model PDF has a zero variance of 30.7 kyr, while the subsolar model PDF has a zero variance of 23.8 kyr. This reflects the subsolar models undergoing hotter, less dense core C-burning (see Figure 4).
Carbon burning and the later stages of evolution in massive stars have large core luminosities whose energy is carried away predominantly by free-steaming neutrinos. These burning stages are thus characterized by short evolutionary time scales. When thermal neutrinos instead of photons dominate the energy loss budget, carbon and heavier fuels burn at a temperature chiefly set by the balanced power condition . For core C-burning this gives 0.9 GK and, assuming a scaling, 6106 g cm-3. This is commensurate with the zero variation values annotated in Figure 13. The and distributions show 95% CI widths of 15% and 60% for the solar and subsolar models, respectively. This is wider than the 95% CI spreads of the and distributions at H-depletion and He-depletion.
The distributions show strong peaks at 0.499 and 95% CI spreads of for the solar and subsolar models. This is commensurate with significant neutronization not occurring during quiescent core C-burning, and shows is not strongly affected by the uncertainties in the reaction rates.
C-depletion marks the first occurrence of significant variation in . The solar and subsolar distributions show 95% CI widths of 16%. The mean value of 6.910-2 for the solar models is smaller than the mean value of 8.610-2 for the subsolar models. This is due to the smaller and shallower density gradient in the subsolar models relative to the solar models.
The dominant isotopes at C-depletion are 16O and 20Ne. These two isotopes follows nearly Gaussian profiles with 95% CI spreads of and for O) and Ne), respectively. Despite this spread, the zero variation values of 16O and 20Ne for the solar and subsolar models are within 1%.
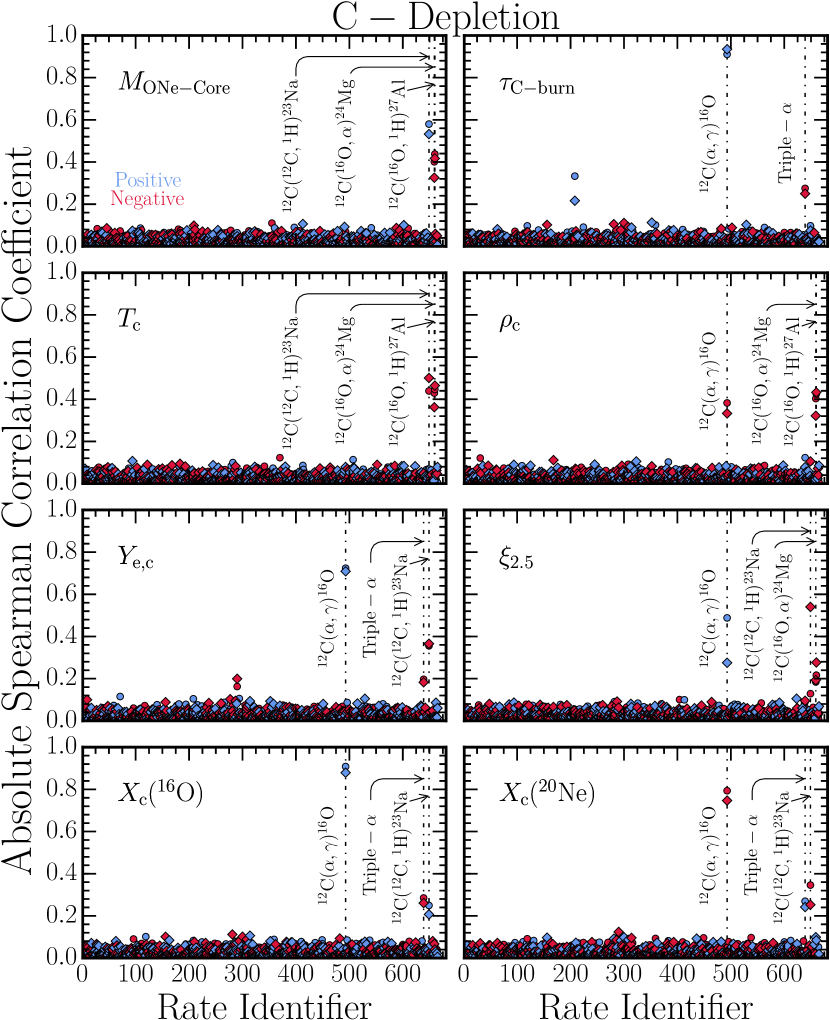
5.3.2 Spearman Correlation Coefficients
Figure 14 shows the absolute SROCs for the 665 sampled reaction rates for the eight quantities considered in Figure 13 for the solar and subsolar grid of models.
Competition between the 12C +12C and 12C +16O reaction rates largely determines the mass of the ONe core at C-depletion. The 12C(12C,)23Na rate have significant positive SROC values of for the solar and subsolar models, respectively. Protons produced by 12C(12C,)23Na are usually captured by 23Na(p,)20Ne, which increases . Uncertainties in the 12C(16O,)27Al and 12C(16O,)27Mg rates have significant negative SROC values, , because the main products from these reactions ultimately produce 28Si, which decreases by effectively transferring 16O to 28Si (Woosley et al., 1971; Martínez-Rodríguez et al., 2017; Fang et al., 2017).
The 12C()16O rate impacts the time between He-depletion and C-depletion with SROC values of +0.91 and +0.94 for the solar and subsolar models, respectively. This occurs because this rate sets the mass of the CO core, which has a relatively narrow 95% CI range of (see Figure 10). Smaller uncertainties in the triple- rate (negative correlation) and the 14N()15O rate (positive correlation) occur because these two reactions play a diminished role in setting the mass of the CO core.
The SROC analysis for and shows dependencies on the 12C()16O, 12C +12C, and 12C +16O rates for the solar and subsolar models. All these rates have negative SROCs of . These magnitude and sign are partially due to thermal neutrino losses playing a key role in the evolution, and partially due to the thermostat mechanism, namely larger energy producing reaction rates yield cooler and less dense cores.
The quantities and inherit a dependence on the 12C()16O rate from He-burning, with SROCs of (+0.7, +0.5), respectively. Uncertainties in the 12C(12C,)23Na and 12C(16O,)27Al rates also contribute with negative coefficients.
Likewise, O) and Ne) also inherit a strong dependence on the 12C()16O rate from He-burning, with SROCs of (+0.9, 0.8), respectively. The O) has a positive correlation coefficient because during He-burning a larger 12C()16O rate produces more 16O. The Ne) has a negative SROC because a larger 12C()16O rate produces less 12C, the principal fuel of C-burning, which produces less 20Ne. Both isotopes also share a smaller dependency on the triple- rate uncertainty, inherited from He-burning, and a small dependence on C-burning rates. These smaller dependencies are also anti-correlated increases in rates that increase O) also decrease Ne), and vice versa.
5.3.3 Impact of the Measurement Point
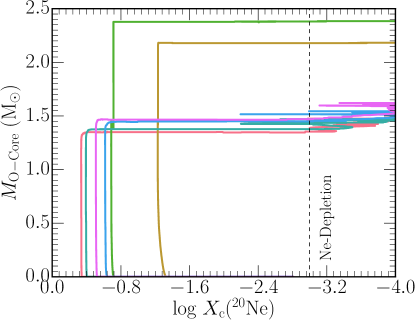
The 95% CI width of the PDF in Figure 13 is partly due to the measurement point. The is still growing in mass due to the off-center convective C-burning episodes (See Figure 5). This contrasts with H and He where convective core burning accounted for complete mixing of the ash of the nuclear burning.
In more detail, carbon ignites centrally and convectively in these 15 M⊙ models. The extent of the convective core burning reaches 0.6 M⊙. Convection retreats as carbon is depleted, and by 10-2 the entire core is radiative. Subsequently, the first off-center convective C-burning episode occurs when 10-4 and extends from 0.6 M⊙ to 1.22.0 M⊙ depending on the amount of C fuel available from core He-burning. It is the variability of the location and extent of the off-center convective C-burning episodes, which occurs before the measurement point of , that drives the 95% CI spread in the PDF.

Figure 15 shows the impact of the measurement point on as a function of for six solar grid models. The dashed vertical line shows our measurement point for C-depletion, . Given different compositions and thermodynamic trajectories inherited from core He-burning, some models are further along in transforming the CO core to a ONe core. Despite the 95% CI range in the PDF, our SROC analysis yields qualitatively similar results. Moreover, two models - the green and gold lines, grow larger ONe cores due to the extent of convective zone of the final off-center C burning episode mixing the fuel and ash of C-burning outward to a larger mass coordinate than the remaining three models.
5.4 Neon Depletion

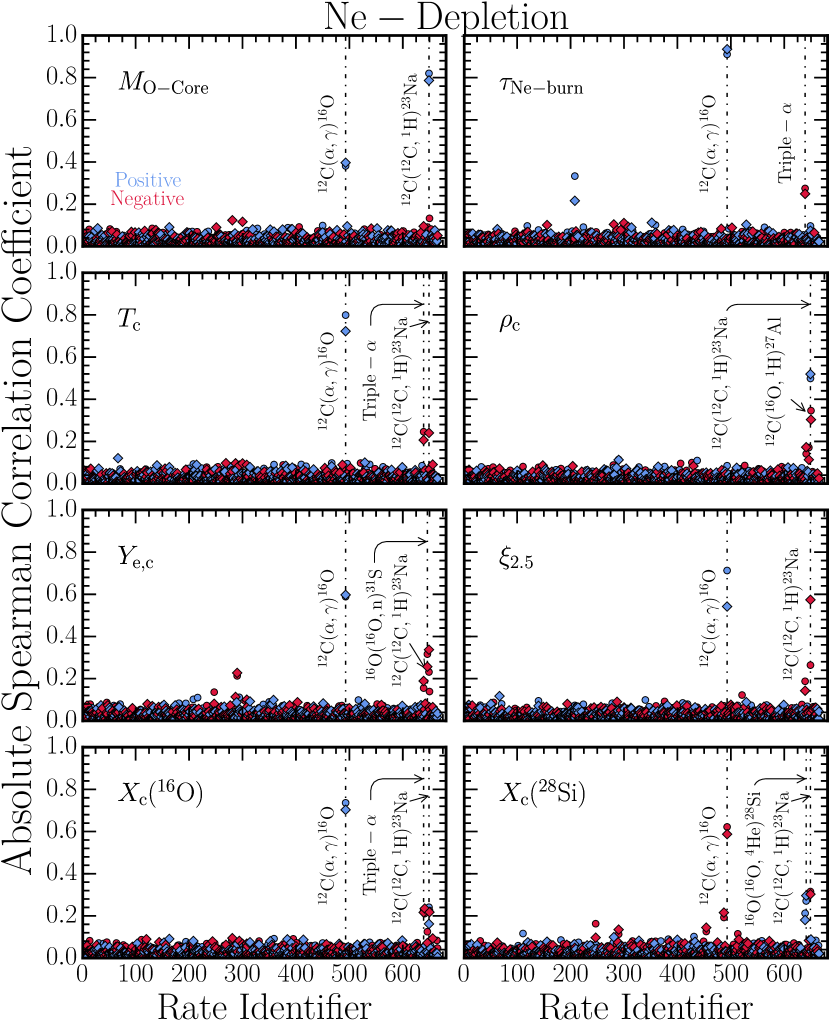
Core Ne-depletion is the next evolutionary stage considered. We measure the integrated impact of the rate uncertainties at the point when the central neon mass fraction . This is a larger mass fraction than the used for H, He and C-depletion. We use a larger depletion value because a growing convective core feeds unburned neon into the core. Ne does not deplete to until well into core O-burning.
5.4.1 Probability Distribution Functions
Figure 16, shows the PDFs of eight properties of the stellar models at Ne-depletion. We consider the mass of the O core , elapsed time between C-depletion and Ne-depletion , central temperature , central density , central electron fraction , compactness parameter , central oxygen-16 mass fraction O), and central silicon-28 mass fraction and Si).
The PDF shows a strong peak for the solar and subsolar models with zero variation values of 1.44 M⊙ and 1.49 M⊙, respectively. The 95% CI spread is for both sets of models. The peaks are offset from zero due to the long tail of positive variations. The PDFs show 95% CIs of , commensurate with the in Figure 13. The 95% CI spread of the solar grid is slightly larger than the spread for the subsolar grid. Both PDFs are symmetric about zero variations of 10.1 yr and 8.10 yr, respectively.
The distribution has zero variation values of 1.60 GK and 1.63 GK for the solar and subsolar grids, respectively. Both PDFs are symmetric about their zero variation values, and have 95% CI widths of 6%. The PDF has zero variation values of 5.12 g cm-3 and 4.42 g cm-3 for the solar and subsolar gridss, respectively. Both PDFs have 95% CI widths of 50%. The subsolar model PDF has a slight bimodality with equal peaks of 18%. The and PDFs have 95% spreads that are smaller than the corresponding 95% CI widths for C-depletion.
The PDFs for both metallicity grids strongly peak about their means, 0.498 and 0.499 respectively, with a 95% spread of 0.25%. This is about the same 95% CI spread as at C-depletion, reflecting that significant neutronization does not occur during Ne-burning. The PDF shows a 95% CI spread of 20% without a strong central peak for both metallicity grids.
O) follows a broad distribution about the mean with variations of (+20%,-30%). In contrast, Si), the other dominant isotope at Ne-depletion, follows a more centrally peaked distribution but with a larger width of and a slight, long tail showing variations out to of the mean.
5.4.2 Spearman Correlation Coefficients
Figure 17 shows the SROC correlations for the eight quantities considered in Figure 16. Markers and colors are the same as in Figure 14.
Ne-depletion inherits most of the reaction rate dependencies from He-depletion and C-depletion. This is consistent with Ne-burning being a photodisintegration rearrangement, whose net reaction is 2(20Ne) 16O + 24Mg + 4.6 Mev. The nucleosynthesis products also resemble those at C-depletion but lack 23Na and has more of the heavier nuclei 26,27Al, 29,30Si, and 31P.
The 95% CI spread of is mainly driven by rate uncertainties in 12C(12C,)23Na, with for both metallicity grids. The 12C()16O rate also affects the O core mass but to a lesser extent, with . The 95% CI variation of follows that of the spread of . It is affected primarily by uncertainties in the 12C()16O rate with smaller dependencies on rate uncertainties in 14N()15O (positive SROC) and triple- (negative SROC). In general, the SROC values are larger for the solar grid.
The PDF depends mostly on the uncertainties in the 12C()16O rate for both solar and subsolar grids. The positive SROC implies that a larger 12C()16O rate yields a hotter stellar core. This is the first occurrence of an inversion of the thermostat mechanism. A small dependency is also found for triple- and the 12C(12C,)23Na rates.
The central density has an SROC value of +0.5 for the 12C(12C,)23Na rate. However, is also affected by uncertainties in the 16O(16O,)31P rate with . This indicates O-burning is beginning to take place at Ne-depletion. There is also a weaker dependence on the 16O(16O,4He)28Si rate with a negative SROC.
Uncertainties in the 12C()16O rate drive the variations in and with SROC values of +0.6. Smaller SROCs are also found for and the 95% CI 27Al()30Si, triple-, 16O(16O,)31P, 16O(16O,)31S, and 12C(12C,)23Na rates. Similar to , the compactness of the stellar core is weakly affected by the inherited uncertainties from the 12C(12C,)23Na rate.
O) inherits a dependence on the 12C()16O rate with +0.7 for both metallicity grids. The 12C +12C and 16O +16O rates have smaller, competing affects on O) with . Si) is slightly anti-correlated with O), with the 12C()16O rate having the largest (negative) SROC. Smaller effects from the uncertainties in the heavy ion, carbon and oxygen channels also play a role in its variation.
5.4.3 Impact of the Measurement Point
Some of the quantities measured at Ne-depletion partly inherit their 95% CI spread from the spread at C-depletion. However, the spread of most quantities at Ne-depletion is larger than the 95% CI spreads at C-depletion because of the thermodynamic conditions imposed by the depletion of carbon.
Figure 15 shows the extent of the ONe core, measured at C-depletion is sensitive to the extent of the final off-center convective carbon episode. Figure 18 shows as a function of the central 20Ne mass fraction for the same six solar grid models as in Figure 15. The same two stellar models which yield larger ONe core masses in Figure 15, introduce larger 95% CI variations in the O core mass measured at Ne-depletion. The variation in the ONe core mass inherited from C-depletion can cause variations in the other measured quantities. We stress that our analysis measures the integrated impact of the reaction rate uncertainties on the evolution of the stellar model up to the measurement point.
5.5 Oxygen Depletion

The last evolutionary point we consider is core O-depletion, defined when . We consider eight properties of the stellar model at this epoch: mass of the Si core , time between Ne-depletion and O-depletion , central temperature , central density , central electron fraction , compactness parameter , central silicon-28 mass fraction Si) , and central sulfur-32 mass fraction S).
5.5.1 Probability Distribution Functions
Figure 19 shows the variation of these quantities in the same format as for previous depletion epochs. The PDF for the solar models span 120 to 400. Only the range 120 is shown in Figure 19. The full range, which is taken into account in the analysis, causes the peak to center at 30%. Despite the wide range, the zero variation values of 0.27 M⊙ for the solar grid and 0.22 M⊙ for the subsolar grid are similar. The 95% CI spreads are 4 times larger for O-depletion than for Ne-depletion for both the solar and subsolar grids.
The solar and subsolar PDFs have zero variation values of 3.79 yr and 2.35 yr, respectively. The 95% CI spreads of 1% are consistent with the 95% CI lifetimes of previous epochs. The subsolar model PDF has a slightly larger peak amplitude and smaller range.
The solar and subsolar PDFs have a 95% CI width of 10%. The negative variation tail causes a 20% shift away from the zero variation values of 2.07 GK for the solar models and 2.14 GK for the subsolar models. The PDFs have 95% CI spreads of 60% with tails out to +160% for both metallicities. These tails cause the peak in the PDF to shift away from the arithmetic means of 23.3106 g cm-3 for the solar models and 15.1106 g cm-3 for the subsolar models. Commensurate with Figure 4, the solar models remain cooler and denser than the subsolar models at O-depletion.
At the elevated and that occurs during O-depletion, the reactions 16O(16O,)31S, 33S(e-,)33P, 37Ar(e-,)33Cl, and 35Cl(e-,)35S decrease . This is reflected in the PDF having zero variation values of 0.492 and 0.493 for the solar and subsolar grids, respectively. Peaks in the PDF are shifted from these zero variation because both the solar and subsolar grids have tails of negative variations extending to 2%.
The PDFs show 95% CI spreads of 20% for the solar and subsolar grids. The arithmetic means of 0.102 for the solar grid and 0.139 for the subsolar grid are larger than the arithmetic means at Ne-depletion, but the difference in between the two metallicities are similar. The Si) PDF is log-normal with a peak at -45% with extrema extending to variations of % and +180%. The S) PDF is broad with tails extending to 80%.
The 95% CI widths of the PDFs for is driven by the fact that the Si-core is still forming at the measurement point of . Additional dynamic range is introduced by some models forming heavier isotopes of Si and S, and MESA only considering 28Si in the definition of the Si-core mass boundary. For example, the central composition at O-depletion for one of the models in Figure 15 and 18 is , , , and . This model reports a very small because Si is primarily in the neutron rich . This also accounts for the negative tail in the PDF and the dynamic range in .
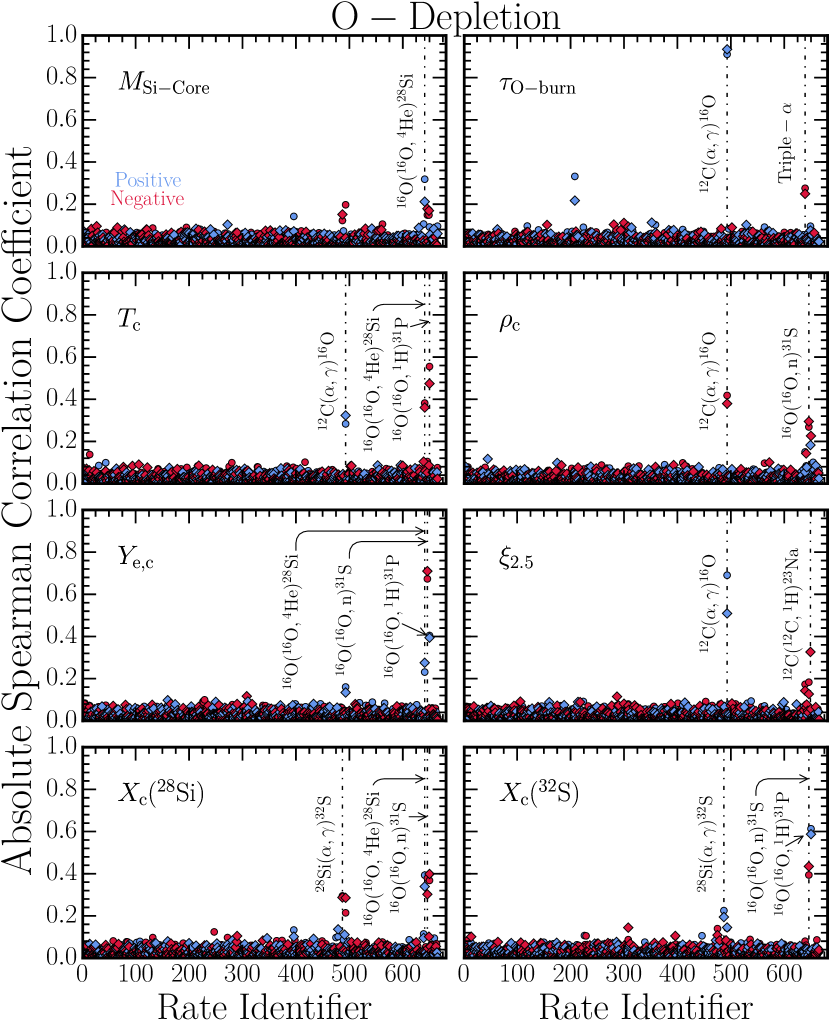
5.5.2 Spearman Correlation Coefficients
Figure 20 shows the SROC coefficients for the solar and subsolar grid against the eight quantities in Figure 19. The format is the same as in previous figures.
The has a negative correlation of with the 16O(16O,)28Si rate and a smaller dependence on the 12C()16O rate. Reaction rates whose uncertainty most impacts are inherited from previous stages, namely 12C()16O, 14N()15O, and triple-.
has a negative correlation with the 16O(16O,)31S rate for the solar and subsolar grid. inherits its dependence on the 12C()16O rate with . The other 16O + 16O exit channels have smaller effects on and . The 16O(16O,)31S rate dominate the SROCs for with for both grids. inherits dependencies on the 12C()16O and 12C(12C,)23Na rates. The mass fractions Si) and S) are chiefly the result of the competition between the 16O(16O,)28Si and 28Si()32S rates.
Table 1 summarizes the properties of the PDFs and the SROC analysis at O-depletion, along with the results for previous depletion points of the major fuels.
| Solar | Subsolar | ||||||
|---|---|---|---|---|---|---|---|
| Property | Values | Key Reaction | Values | Key Reaction | 95% CI Limits of Variation (%) | ||
| H-Depletion | |||||||
| 2.802 | 14N()15O | +0.35 | 2.86 | +0.33 | (+0.13, -0.12) (+0.12,-0.12) | ||
| 11.27 | 14N()15O | +1.0 | 11.769 | +1.0 | (+0.18,-0.19) (+0.09,-0.09) | ||
| 0.628 | 14N()15O | -0.99 | 0.807 | -0.99 | (+1.19,-1.12) (+1.07,-1.11) | ||
| 42.402 | 14N()15O | -0.97 | 88.198 | -0.98 | (+3.57,-3.36) (+3.45,-3.49) | ||
| 0.007 | 14N()15O | -0.99 | 0.008 | -0.99 | (+1.19,-1.14) (+1.09,-1.13) | ||
| 9.234 | 15N()16O | -0.56 | 0.194 | 14N()15O | -0.66 | (+0.89,-1.15) (+0.83,-1.08) | |
| He-Depletion | |||||||
| 2.414 | 12C()16O | +0.79 | 2.952 | +0.84 | (+1.94,-3.10) (+1.53,-2.44) | ||
| 1.594 | 12C()16O | +0.92 | 1.315 | +0.94 | (+0.81,-0.90) (+0.58,-0.63) | ||
| 3.126 | Triple- | -0.80 | 3.207 | -0.77 | (+1.89,-1.07) (+1.67,-1.11) | ||
| 5.535 | Triple- | -0.69 | 5.053 | -0.67 | (+3.99,-3.08) (+4.19,-3.20) | ||
| 1.081 | 22Ne()26Mg | -0.70 | 0.021 | -0.64 | (+12.6,-17.9) (+15.5,-21.5) | ||
| 0.031 | Triple- | -0.83 | 0.031 | -0.74 | (+1.56,-0.97) (+1.41,-1.06) | ||
| 0.260 | 12C()16O | -0.95 | 0.265 | -0.95 | (+79.9,-70.2) (+73.1,-69.1) | ||
| 0.716 | 12C()16O | +0.95 | 0.731 | +0.95 | (+25.1,-28.5) (+24.5,-26.3) | ||
| C-Depletion | |||||||
| 1.110 | 12C(12C,)23Na | +0.58 | 1.175 | +0.53 | (+22.9,-50.5) (+22.9,-51.1) | ||
| 30.74 | 12C()16O | +0.91 | 23.75 | +0.94 | (+0.78,-0.86) (+0.56,-0.62) | ||
| 1.158 | 12C(16O,)27Al | -0.45 | 1.196 | 12C(12C,)23Na | -0.50 | (+21.9,-11.5) (+33.6,-13.6) | |
| 5.317 | 12C(16O,)27Al | -0.43 | 4.371 | -0.43 | (+65.8,-49.0) (+66.7,-54.8) | ||
| 0.498 | 12C()16O | +0.72 | 0.498 | +0.71 | (+0.15,-0.35) (+0.15,-0.37) | ||
| 0.083 | 12C()16O | +0.49 | 0.109 | 12C(12C,)23Na | -0.54 | (+14.28,-16.6) (+17.9,-19.4) | |
| 0.622 | 12C()16O | +0.91 | 0.625 | +0.88 | (+38.4,-40.0) (+38.9,-41.0) | ||
| 0.266 | 12C()16O | -0.79 | 0.280 | -0.75 | (+72.4,-73.0) (+69.1,-84.5) | ||
| Ne-Depletion | |||||||
| 1.439 | 12C(12C,)23Na | +0.82 | 1.493 | +0.79 | (+64.5,-22.7) (+31.6,-22.5) | ||
| 10.114 | 12C()16O | +0.91 | 8.103 | +0.94 | (+0.78,-0.86) (+0.56,-0.62) | ||
| 1.603 | 12C()16O | +0.80 | 1.626 | +0.72 | (+6.15,-6.40) (+6.21,-6.52) | ||
| 5.119 | 12C(12C,)23Na | +0.50 | 4.422 | +0.52 | (+36.5,-31.9) (+43.0,-37.4) | ||
| 0.498 | 12C()16O | +0.59 | 0.499 | +0.60 | (+0.19,-0.41) (+0.19,-0.41) | ||
| 0.084 | 12C()16O | +0.71 | 0.111 | 12C(12C,)23Na | -0.57 | (+20.2,-19.3) (+22.5,-24.4) | |
| 0.731 | 12C()16O | +0.74 | 0.735 | +0.70 | (+21.4,-31.2) (+21.4,-31.8) | ||
| 0.086 | 12C()16O | -0.62 | 0.094 | -0.59 | (+179,-75.2) (+216,-81.1) | ||
| O-Depletion | |||||||
| 0.270 | 16O(16O,)28Si | +0.32 | 0.219 | +0.21 | (+262,-95.7) (+341,-94.2) | ||
| 3.786 | 12C()16O | +0.91 | 2.348 | +0.93 | (+0.76,-0.88) (+0.52,-0.61) | ||
| 2.073 | 16O(16O,)31P | -0.56 | 2.141 | -0.47 | (+9.92,-13.5) (+9.77,-13.2) | ||
| 23.34 | 12C()16O | -0.42 | 15.10 | -0.38 | (+132,-55.8) (+185,-52.7) | ||
| 0.492 | 16O(16O,)31S | -0.67 | 0.493 | -0.71 | (+1.18,-2.74) (+1.18,-2.88) | ||
| 0.102 | 12C()16O | +0.69 | 0.139 | +0.51 | (+19.9,-27.0) (+24.98,-23.6) | ||
| 0.263 | 16O(16O,)28Si | +0.39 | 0.268 | 16O(16O,)31P | -0.40 | (+99.7,-59.8) (+103,-58.6) | |
| 0.433 | 16O(16O,)31P | +0.61 | 0.449 | +0.59 | (+70.1,-86.7) (+73.1,-85.1) | ||
Note. — Properties of the 15 solar and subsolar stellar models at five different epochs. The values given are arithmetic means, with upper and lower limits from the 95% CI. Also listed are the min. or max. SROC coefficient values and the corresponding key nuclear reaction. The last column are the limits of the 95% CI for the variations for the solar (left) and subsolar (right) stellar models. Ellipses indicate the variation of a given quantity for the subsolar models is dominated by the same key reaction as the solar models.
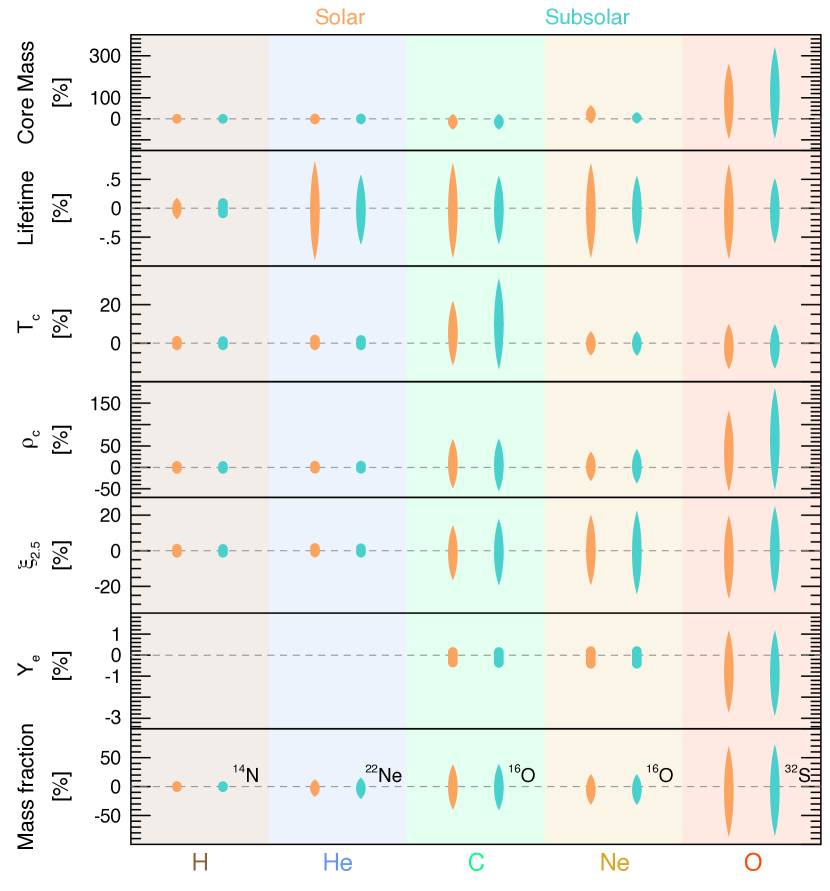
6 Discussion
Figure 21 shows the 95% CI variations listed in Table 1 for seven properties across five evolutionary epochs for the solar and subsolar grids. Across these properties, the magnitude of the 95% CI spreads generally grow with each successive stage of evolution. The variations grow for two reasons. One, each evolutionary stage inherits variations from the previous evolutionary stage because we measure the integrated impact of the uncertainties in the reaction rates. Two, each stage imprints its own contributions to the variations due to the uncertainties in the specific reaction rates that impact that stage. Finally, there is a trend for the 95% CI variations of the subsolar models to be smaller than the variations of the solar models, particularly for measurements at H-, He- and C-depletion.
We next discuss the reaction rates identified in Table 1 which have the largest impact on the variations of the core mass, burning lifetime, composition, and structural properties.
6.1 Key Reaction Rates
At H-depletion, Table 1 shows the uncertainties from the 14N()15O reaction rate cause 95% CI variations of 0.1% in , 0.2% in , 1% in , 3% in , 1% in , and 1% in for both solar and subsolar models. The 14N()15O reaction rate is the slowest step in the CNO cycle and thus determines the rate at which H is depleted in the core (e.g., Iliadis, 2007). STARLIB currently adopts the reaction rate of Imbriani et al. (2005).
The lowest positive-energy resonance of 14N()15O is located at a center-of-mass energy of 259 keV, too high in energy to strongly influence quiescent stellar burning (e.g., LUNA Collaboration et al., 2006). However, the strength of this resonance is often used as a cross-section normalization for lower-energy measurements. Daigle et al. (2016) report measurements of the energy, strength, and -ray branching ratios for the 259 keV resonance. Their recommended strength of = 12.6 MeV is in agreement with the previous value but more precise, and offers a more reliable normalization. Using this result, they suggest the -factor data of Imbriani et al. (2005) should be reduced by 2.3%. For this reduction of the -factor, in our stellar models at H-depletion the largest variation is +0.2% with respect to the mean for . Other properties have variations .
STARLIB currently adopts the triple- reaction rate of Angulo et al. (1999). Uncertainties in this reaction rate dominate the 95% CI variations of 1.5% in , 3.5% in , and 3.5% in , during core He-burning. Nguyen et al. (2012) combine Faddeev hyperspherical harmonics and the -matrix method to suggest the triple- reaction rate is significantly enhanced at temperatures below 0.06 GK. For an increased reaction rate in this temperature range, our analysis suggest and will decrease by 2% in our MESA models.
STARLIB currently adopts the Kunz et al. (2002) reaction rate for 12C()16O. Experimental uncertainties in this reaction rate dominate the 95% CI variations of 2.5% in , 1% in , +80/-70% in C), and +25/-27% in O) during core He-burning. Core C-, Ne-, and even O-burning inherit some of these dependencies. deBoer et al. (2017) use the -matrix method to derive a new 12C()16O rate. The uncertainties in the deBoer et al. (2017) rate are smaller than the uncertainties in the Kunz et al. (2002) rate near temperatures of GK and slightly larger near GK. deBoer et al. (2017) show their rate can lead to changes of 1.5% for in their 15 M⊙ solar metallicity MESA models. This is slightly smaller than our 95% CI spread.
STARLIB adopts the 12C +12C, 12C +16O, and 16O +16O rates and branching ratios of Caughlan & Fowler (1988). Uncertainties in these reaction rates and branching ration dominate the 95% CI variations of +23/-50% in at C-depletion and +40/-35% in at Ne-depletion.
The 12C +12C is one of the most studied heavy ion reactions. Despite several decades of dedicated experimental efforts, the low-energy reaction rate still carries considerable uncertainties due to pronounced resonance structures that are thought to be associated with molecular configurations of carbon in the 24Mg excited state (e.g., Mişicu & Esbensen, 2007) However, it has been argued that low-energy cross section of fusion reactions declines faster with decreasing energy than projected by common potential models (Jiang et al., 2007a; Gasques et al., 2007; Carnelli et al., 2014).
The impact of changes in the 12C +12C in 1D Geneva stellar evolution (GENEC) models are investigated in Bennett et al. (2012) and Pignatari et al. (2013). They find that an increase in the 12C +12C reaction rate causes core C-burning ignition at lower temperature. This reduces the thermal neutrino losses, which in turn increases the core C-burning lifetime. They also find an increased 12C +12C rate increases the upper initial mass limit for when a star undergoes convective C-burning rather than radiative C-burning (Lamb et al., 1976; Woosley & Weaver, 1986; Petermann et al., 2017). The subsequent evolution of these more massive stars may yield a bimodal distribution of compact objects (Timmes et al., 1996; Zhang et al., 2008; Petermann et al., 2017).
Fang et al. (2017) use a high-intensity oxygen beam impinging upon an ultrapure graphite target to make new measurements of the total cross section and branching ratios for the 12C +16O reaction. They find a new broad resonance-like structure and a decreasing trend in the -factor data towards lower energies, in contrast to previous measurements. For massive stars, they conclude the impact of the new rate 12C +16O rate might be small for core and shell burning (also see Jiang et al., 2007b), although the impact might be enhanced by multidimensional turbulence (Cristini et al., 2017) or rotation (Chatzopoulos et al., 2016a) of the pre-supernova star during the last phases of its stellar life.
Of the key nuclear reaction rates identified in this study, those with the largest uncertainty over the temperature ranges consider here are heavy ion 12C +12C, 12C +16O, and 16O +16O reactions. Due to the larger Coulomb barrier for the 12C +16O reaction it is expected to be less efficient during carbon burning. Our results suggest that variation in this rate, especially the exit channel, can lead to non-negligible variations in core temperature and density during carbon burning. Our results suggest that for a decrease in the uncertainty in these heavy ion reactions rates over stellar temperatures, along with the 12C()16O reaction, we can expect a decrease in variation of stellar model properties of below the level of variations induced by uncertainties due to stellar winds, convective boundary mixing, and mass/network resolution.
6.2 Assessing The Overall Impact
Paper F16 applies the Monte Carlo framework to stellar models that form CO white dwarfs. They evolve 3 M⊙ solar metallicity models from the pre-MS to the first thermal pulse. They sample 26 out of 405 nuclear reactions and consider one evolutionary epoch the first thermal pulse, a time shortly after core He-depletion. Comparing our Figure 11 with their Figure 11, we find similar results despite the different masses. The 12C()16O dominates the mass of the CO core, The 12C, and 16O mass fractions at He-depletion (their first thermal pulse) have similar sign and magnitude SROC coefficients. In agreement with their CO white dwarf models, variations in the central temperature are driven by uncertainties in the triple- reaction rate. They report that the central density is primarily correlated with uncertainties in the 12C()16O rate, while we find the variations in the central density are chiefly correlated with uncertainties in the triple- rate. This difference is due to the masses considered. The hotter, less dense, cores of our 15 M⊙ models favor the triple- rate as the primarily source of the central density variations, whereas the cooler, more dense 3 M⊙ models favor 12C()16O.
Farmer et al. (2016) explore uncertainties in the structure of massive star stellar models with respect to mass resolution, mass loss, and the number of isotopes in the nuclear reaction network. Farmer et al. (2016) and this paper both report results for 15 M⊙, 0, 127 isotope, solar metallicity, MESA r7624 models. The primary difference between this paper and Farmer et al. (2016) is the use of STARLIB reaction rates.
Our results at H-depletion can be compared with their results at He-ignition. For example, Table 1 shows our mean He core mass is = 2.80 M⊙ while their median He core mass is Hecore = 2.77 M⊙, a difference of 1%. Our 95% CI for is within 1% of their Hecore upper and lower limits. As another example, our mean H burning lifetime is = 11.27 Myr and their median H burning lifetime is = 10.99 Myr, a difference of 3%. In addition, our 95% CI for is 2% larger than their upper and lower bounds for .
Our He-depletion results can also be compared to their results at C-ignition. We find a mean = 2.41 M⊙ while their median Ccore = 2.44 M⊙, a difference of 1%. Our 95% CI spread due to uncertainties in the nuclear reaction rates is (+1.9%, 3.1%) while their upper and lower bounds suggest variations of (+3.7%, 0.4%) due to changes in mass and network resolution. In addition, our mean = 1.594 Myr and their median = 1.74 Myr, a difference of 8%. Our 95% CI for is (+1.9%, 3.1%) while their upper and lower bounds are (+1.2%, 12.1%).
Comparing our Ne-depletion results with their O-ignition results, we find a mean = 1.44 M⊙ while their median Ocore = 1.40 M⊙, a difference of 1%. Our 95% CI spread due to uncertainties in the nuclear reaction rates is (+65%, 23%) while their upper and lower bounds suggest variations of (+0.1%, 5.6%) due to changes in mass and network resolution. In addition, our mean = 30.74 kyr and their median = 85.55 yr differs by approximately three orders of magnitude. This large difference is due to the exact measurement points. In this work, we assumed the time to be the difference between the age of the star at C-depletion and He-depletion. This does not necessarily correspond to the exact burning lifetime for C as the star undergoes reconfiguration after He-depletion for a few thousand years before conditions for C-burning are met. In Farmer et al. (2016) they measure the time to transition to the next major fuel source. Our 95%CI for is (+1.9%, 3.1%) while their upper and lower bounds are (+1.2%, 12.1%).
Variations in properties of stellar evolution models can be found to be caused by other sources of uncertainty beyond those discussed above. Renzo et al. (2017) considered uncertainties in the mass loss prescriptions and efficiencies used in solar-metallicity, non-rotating, single stars. They find that changes in these parameters can lead to a spread of in CO core masses measured at O-depletion, though defined differently in their work as the moment when . This spread represents a variation of about variation about the arithmetic mean. The treatment of mixing at the convective boundaries can also have a significant effect on the evolution of massive stellar models. Davis et al. (2017) show that for their 25 model at Ne-ignition, they find a variation of in the ONe core mass due to changes in the efficiency of convective boundary mixing at metal burning interfaces.
Farmer et al. (2016) find that mass resolution has a larger impact on the variations than the number of isotopes up to and including C burning, while the number of isotopes plays a more significant role in determining the span of the variations for Ne-, O-, and Si-burning. Comparisons of the core masses and burning lifetimes suggests that at H- and He-depletion, the variations induced by uncertainties in nuclear reaction rates are of comparable magnitude to the variations induced by the modeling choices of mass resolution and network resolution. At Ne-depletion the integrated impact of the uncertainties in the reaction rates appear to be larger than the variations caused by mass and network resolution.
The scale of variations due to different mass loss prescriptions and efficiencies were found to be of comparable scale to those due to reaction rate uncertainties at early epochs such as H- and He-depletion for the stellar properties considered. At early epochs, convective boundary mixing is likely to cause significant variations in core masses and lifetimes that are of larger scale than those due to nuclear reaction rate uncertainties. However, uncertainties in convective boundary mixing are likely to be smaller than the integrated impact of rate uncertainties at advanced burning stages.
7 Summary
We investigated properties of pre-supernova massive stars with respect to the composite uncertainties in the thermonuclear reaction rates by coupling the reaction rate PDFs provided by the STARLIB reaction rate library with MESA stellar models. We evolved 1000 15 M⊙ models with solar and subsolar initial compositions from the pre main-sequence to core oxygen depletion for a total of 2000 Monte Carlo stellar models. For each stellar model we sampled 665 forward thermonuclear reaction rates concurrently, and used them in an in-situ 127 isotope MESA reaction network. With this infrastructure we surveyed the core mass, burning lifetime, central temperature, central density, compactness parameter, and key abundances at H-, He-, C-, Ne-, and O-depletion.
At each stage, we measured the PDFs of the variations of each property and calculated SROC coefficients for each sampled reaction rate. This allowed identification of the reaction rates that have the largest impact on the variations of the properties surveyed. Table 1 summarizes the stellar properties, the reaction rates causing their variation, and the largest correlation coefficient (positive or negative) for that reaction rate.
In general, variations induced by nuclear reaction rates grow with each passing phase of evolution. Relative to variations induced by mass resolution and the number of isotopes in the nuclear reaction network, we found that variations induced by uncertainties in nuclear reaction rates at core H- and He-depletion are of comparable magnitude to the variations induced by the modeling choices of mass resolution and network resolution. Beyond these evolutionary epochs, our models suggest that the reaction rate uncertainties can dominate the variation in properties of the stellar model significantly altering the evolution towards iron core-collapse.
References
- Abbott et al. (2016a) Abbott, B. P., Abbott, R., Abbott, T. D., et al. 2016a, Physical Review Letters, 116, 061102
- Abbott et al. (2016b) —. 2016b, Physical Review Letters, 116, 241103
- Abbott et al. (2017) —. 2017, Physical Review Letters, 118, 221101
- Alastuey & Jancovici (1978) Alastuey, A., & Jancovici, B. 1978, ApJ, 226, 1034
- Angulo et al. (1999) Angulo, C., Arnould, M., Rayet, M., et al. 1999, Nuclear Physics A, 656, 3
- Asplund et al. (2009) Asplund, M., Grevesse, N., Sauval, A. J., & Scott, P. 2009, ARA&A, 47, 481
- Barkat et al. (1967) Barkat, Z., Rakavy, G., & Sack, N. 1967, Physical Review Letters, 18, 379
- Bennett et al. (2012) Bennett, M. E., Hirschi, R., Pignatari, M., et al. 2012, MNRAS, 420, 3047
- Bromm et al. (2001) Bromm, V., Kudritzki, R. P., & Loeb, A. 2001, ApJ, 552, 464
- Brown et al. (2013) Brown, J. M., Garaud, P., & Stellmach, S. 2013, ApJ, 768, 34
- Caffau et al. (2010) Caffau, E., Ludwig, H.-G., Bonifacio, P., et al. 2010, A&A, 514, A92
- Carnelli et al. (2014) Carnelli, P. F. F., Almaraz-Calderon, S., Rehm, K. E., et al. 2014, Physical Review Letters, 112, 192701
- Caughlan & Fowler (1988) Caughlan, G. R., & Fowler, W. A. 1988, Atomic Data and Nuclear Data Tables, 40, 283
- Chatzopoulos et al. (2016a) Chatzopoulos, E., Couch, S. M., Arnett, W. D., & Timmes, F. X. 2016a, ApJ, 822, 61
- Chatzopoulos & Wheeler (2012) Chatzopoulos, E., & Wheeler, J. C. 2012, ApJ, 748, 42
- Chatzopoulos et al. (2013) Chatzopoulos, E., Wheeler, J. C., & Couch, S. M. 2013, ApJ, 776, 129
- Chatzopoulos et al. (2016b) Chatzopoulos, E., Wheeler, J. C., Vinko, J., et al. 2016b, ApJ, 828, 94
- Chen et al. (2016) Chen, K.-J., Woosley, S. E., & Sukhbold, T. 2016, ApJ, 832, 73
- Clausen et al. (2015) Clausen, D., Piro, A. L., & Ott, C. D. 2015, ApJ, 799, 190
- Côté et al. (2017) Côté, B., O’Shea, B. W., Ritter, C., Herwig, F., & Venn, K. A. 2017, ApJ, 835, 128
- Couch et al. (2015) Couch, S. M., Chatzopoulos, E., Arnett, W. D., & Timmes, F. X. 2015, ApJ, 808, L21
- Cristini et al. (2017) Cristini, A., Meakin, C., Hirschi, R., et al. 2017, MNRAS, 471, 279
- Cyburt et al. (2016) Cyburt, R. H., Amthor, A. M., Heger, A., et al. 2016, ApJ, 830, 55
- Cyburt et al. (2010) Cyburt, R. H., Amthor, A. M., Ferguson, R., et al. 2010, ApJS, 189, 240
- Daigle et al. (2016) Daigle, S., Kelly, K. J., Champagne, A. E., et al. 2016, Phys. Rev. C, 94, 025803
- Davis et al. (2017) Davis, A., Jones, S., & Herwig, F. 2017, ArXiv e-prints, arXiv:1712.00114
- deBoer et al. (2017) deBoer, R. J., Görres, J., Wiescher, M., et al. 2017, Reviews of Modern Physics, 89, 035007
- Dessart et al. (2011) Dessart, L., Hillier, D. J., Livne, E., et al. 2011, MNRAS, 414, 2985
- Eldridge & Tout (2004) Eldridge, J. J., & Tout, C. A. 2004, MNRAS, 353, 87
- Evans et al. (2000) Evans, M., Hastings, N., & Peacock, B. 2000, Statistical Distributions, 3rd edn. (New York, NY: Wiley)
- Fang et al. (2017) Fang, X., Tan, W. P., Beard, M., et al. 2017, Phys. Rev. C, 96, 045804
- Farmer et al. (2016) Farmer, R., Fields, C. E., Petermann, I., et al. 2016, ApJS, 227, 22
- Farmer et al. (2015) Farmer, R., Fields, C. E., & Timmes, F. X. 2015, ApJ, 807, 184
- Faulkner (1967) Faulkner, J. 1967, ApJ, 147, 617
- Fields et al. (2016) Fields, C. E., Farmer, R., Petermann, I., Iliadis, C., & Timmes, F. X. 2016, ApJ, 823, 46
- Filippenko (1997) Filippenko, A. V. 1997, ARA&A, 35, 309
- Fowler & Hoyle (1964) Fowler, W. A., & Hoyle, F. 1964, ApJS, 9, 201
- Fraley (1968) Fraley, G. S. 1968, Ap&SS, 2, 96
- Frebel et al. (2010) Frebel, A., Simon, J. D., Geha, M., & Willman, B. 2010, ApJ, 708, 560
- Fryer & Kalogera (2001) Fryer, C. L., & Kalogera, V. 2001, ApJ, 554, 548
- Fryer et al. (2001) Fryer, C. L., Woosley, S. E., & Heger, A. 2001, ApJ, 550, 372
- Fuller et al. (1985) Fuller, G. M., Fowler, W. A., & Newman, M. J. 1985, ApJ, 293, 1
- Garaud et al. (2015) Garaud, P., Medrano, M., Brown, J. M., Mankovich, C., & Moore, K. 2015, ApJ, 808, 89
- Gasques et al. (2007) Gasques, L. R., Brown, E. F., Chieffi, A., et al. 2007, Phys. Rev. C, 76, 035802
- Glebbeek et al. (2009) Glebbeek, E., Gaburov, E., de Mink, S. E., Pols, O. R., & Portegies Zwart, S. F. 2009, A&A, 497, 255
- Gómez Iñesta et al. (2017) Gómez Iñesta, Á., Iliadis, C., & Coc, A. 2017, ArXiv e-prints, arXiv:1710.01647
- Goriely et al. (2008) Goriely, S., Hilaire, S., & Koning, A. J. 2008, A&A, 487, 767
- Grevesse & Sauval (1998) Grevesse, N., & Sauval, A. J. 1998, Space Sci. Rev., 85, 161
- Hansen et al. (2004) Hansen, C. J., Kawaler, S. D., & Trimble, V. 2004, Stellar interiors : physical principles, structure, and evolution (New York: Springer-Verlag)
- Harris et al. (2017) Harris, J. A., Hix, W. R., Chertkow, M. A., et al. 2017, ApJ, 843, 2
- Heger et al. (2003) Heger, A., Fryer, C. L., Woosley, S. E., Langer, N., & Hartmann, D. H. 2003, ApJ, 591, 288
- Herwig et al. (2006) Herwig, F., Austin, S. M., & Lattanzio, J. C. 2006, Phys. Rev. C, 73, 025802
- Hoyle & Lyttleton (1942) Hoyle, F., & Lyttleton, R. A. 1942, MNRAS, 102, 177
- Hunter (2007) Hunter, J. D. 2007, Computing In Science & Engineering, 9, 90
- Iben (1966) Iben, Jr., I. 1966, The Astrophysical Journal, 143, 516
- Iben (1991) —. 1991, ApJS, 76, 55
- Iliadis (2007) Iliadis, C. 2007, Nuclear Physics of Stars (Wiley-VCH Verlag)
- Iliadis et al. (2016) Iliadis, C., Anderson, K. S., Coc, A., Timmes, F. X., & Starrfield, S. 2016, ApJ, 831, 107
- Iliadis et al. (2010) Iliadis, C., Longland, R., Champagne, A. E., & Coc, A. 2010, Nuclear Physics A, 841, 251
- Iliadis et al. (2015) Iliadis, C., Longland, R., Coc, A., Timmes, F. X., & Champagne, A. E. 2015, Journal of Physics G Nuclear Physics, 42, 034007
- Imbriani et al. (2004) Imbriani, G., Costantini, H., Formicola, A., et al. 2004, A&A, 420, 625
- Imbriani et al. (2005) —. 2005, European Physical Journal A, 25, 455
- Itoh et al. (1996) Itoh, N., Hayashi, H., Nishikawa, A., & Kohyama, Y. 1996, ApJS, 102, 411
- Itoh et al. (1979) Itoh, N., Totsuji, H., Ichimaru, S., & Dewitt, H. E. 1979, ApJ, 234, 1079
- Janka et al. (2016) Janka, H.-T., Melson, T., & Summa, A. 2016, ArXiv e-prints, arXiv:1602.05576
- Jerkstrand et al. (2015) Jerkstrand, A., Timmes, F. X., Magkotsios, G., et al. 2015, ApJ, 807, 110
- Jiang et al. (2007a) Jiang, C. L., Back, B. B., Janssens, R. V. F., & Rehm, K. E. 2007a, Phys. Rev. C, 75, 057604
- Jiang et al. (2007b) Jiang, C. L., Rehm, K. E., Back, B. B., & Janssens, R. V. F. 2007b, Phys. Rev. C, 75, 015803
- Jones et al. (2001) Jones, E., Oliphant, T., Peterson, P., & others. 2001, SciPy : Open source scientific tools for Python, Online, SciPy. http://www.scipy.org/
- Jones et al. (2017) Jones, S., Andrassy, R., Sandalski, S., et al. 2017, MNRAS, 465, 2991
- Karakas & Lattanzio (2014) Karakas, A. I., & Lattanzio, J. C. 2014, ArXiv e-prints, arXiv:1405.0062
- Kasen et al. (2011) Kasen, D., Woosley, S. E., & Heger, A. 2011, ApJ, 734, 102
- Kruckow et al. (2016) Kruckow, M. U., Tauris, T. M., Langer, N., et al. 2016, A&A, 596, A58
- Kunz et al. (2002) Kunz, R., Fey, M., Jaeger, M., et al. 2002, ApJ, 567, 643
- Lamb et al. (1976) Lamb, S. A., Iben, Jr., I., & Howard, W. M. 1976, ApJ, 207, 209
- Lane (2013) Lane, D. 2013, Online Statistics Education: A Multimedia Course of Study, Rice University. http://onlinestatbook.com
- Langanke & Martínez-Pinedo (2000) Langanke, K., & Martínez-Pinedo, G. 2000, Nuclear Physics A, 673, 481
- Leloudas et al. (2016) Leloudas, G., Fraser, M., Stone, N. C., et al. 2016, Nature Astronomy, 1, 0002
- Limongi (2017) Limongi, M. 2017, ArXiv e-prints, arXiv:1706.01913
- Lodders et al. (2009) Lodders, K., Palme, H., & Gail, H.-P. 2009, Landolt Börnstein, arXiv:0901.1149
- Longland (2012) Longland, R. 2012, A&A, 548, A30
- Longland et al. (2010) Longland, R., Iliadis, C., Champagne, A. E., et al. 2010, Nuclear Physics A, 841, 1
- LUNA Collaboration et al. (2006) LUNA Collaboration, Lemut, A., Bemmerer, D., et al. 2006, Physics Letters B, 634, 483
- Magkotsios et al. (2010) Magkotsios, G., Timmes, F. X., Hungerford, A. L., et al. 2010, ApJS, 191, 66
- Martínez-Rodríguez et al. (2017) Martínez-Rodríguez, H., Badenes, C., Yamaguchi, H., et al. 2017, ApJ, 843, 35
- Mişicu & Esbensen (2007) Mişicu, Ş., & Esbensen, H. 2007, Phys. Rev. C, 75, 034606
- Müller et al. (2016) Müller, B., Heger, A., Liptai, D., & Cameron, J. B. 2016, MNRAS, 460, 742
- Myers & Well (1995) Myers, J. L., & Well, A. D. 1995, Research Design & Statistical Analysis, 1st edn. (Routledge)
- Nguyen et al. (2012) Nguyen, N. B., Nunes, F. M., Thompson, I. J., & Brown, E. F. 2012, Physical Review Letters, 109, 141101
- Nieuwenhuijzen & de Jager (1990) Nieuwenhuijzen, H., & de Jager, C. 1990, A&A, 231, 134
- Nishimura et al. (2017) Nishimura, N., Hirschi, R., Rauscher, T., Murphy, A. S. J., & Cescutti, G. 2017, MNRAS, 469, 1752
- Nomoto et al. (2013) Nomoto, K., Kobayashi, C., & Tominaga, N. 2013, ARA&A, 51, 457
- Nugis & Lamers (2000) Nugis, T., & Lamers, H. J. G. L. M. 2000, A&A, 360, 227
- Ober et al. (1983) Ober, W. W., El Eid, M. F., & Fricke, K. J. 1983, A&A, 119, 61
- O’Connor & Ott (2011) O’Connor, E., & Ott, C. D. 2011, ApJ, 730, 70
- Oda et al. (1994) Oda, T., Hino, M., Muto, K., Takahara, M., & Sato, K. 1994, Atomic Data and Nuclear Data Tables, 56, 231
- Ofek et al. (2014) Ofek, E. O., Sullivan, M., Shaviv, N. J., et al. 2014, ApJ, 789, 104
- Pagel & Portinari (1998) Pagel, B. E. J., & Portinari, L. 1998, MNRAS, 298, 747
- Paxton et al. (2011) Paxton, B., Bildsten, L., Dotter, A., et al. 2011, ApJS, 192
- Paxton et al. (2013) Paxton, B., Cantiello, M., Arras, P., et al. 2013, ApJS, 208
- Paxton et al. (2015) Paxton, B., Marchant, P., Schwab, J., et al. 2015, ApJS, 220, 15
- Petermann et al. (2017) Petermann, I., Timmes, F. X., Fields, C. E., & Farmer, R. J. 2017, In preparation
- Pignatari et al. (2013) Pignatari, M., Hirschi, R., Wiescher, M., et al. 2013, ApJ, 762, 31
- Portinari et al. (2010) Portinari, L., Casagrande, L., & Flynn, C. 2010, MNRAS, 406, 1570
- Rakavy & Shaviv (1967) Rakavy, G., & Shaviv, G. 1967, ApJ, 148, 803
- Rakavy et al. (1967) Rakavy, G., Shaviv, G., & Zinamon, Z. 1967, ApJ, 150, 131
- Rauscher et al. (2002) Rauscher, T., Heger, A., Hoffman, R. D., & Woosley, S. E. 2002, ApJ, 576, 323
- Rauscher et al. (2016) Rauscher, T., Nishimura, N., Hirschi, R., et al. 2016, MNRAS, 463, 4153
- Reilly et al. (2016) Reilly, E., Maund, J. R., Baade, D., et al. 2016, MNRAS, 457, 288
- Renzo et al. (2017) Renzo, M., Ott, C. D., Shore, S. N., & de Mink, S. E. 2017, A&A, 603, A118
- Sallaska et al. (2013) Sallaska, A. L., Iliadis, C., Champange, A. E., et al. 2013, ApJS, 207, 18
- Salpeter (1955) Salpeter, E. E. 1955, The Astrophysical Journal, 121, 161
- Scalo (1986) Scalo, J. M. 1986, Fundam. Cosm. Phys., 11, 1
- Smartt (2009) Smartt, S. J. 2009, ARA&A, 47, 63
- Smartt (2015) —. 2015, PASA, 32, 16
- Smith (2014) Smith, N. 2014, Annual Review of Astronomy and Astrophysics, 52, 487
- Smith et al. (2016) Smith, N., Andrews, J. E., Van Dyk, S. D., et al. 2016, MNRAS, 458, 950
- Spruit (2013) Spruit, H. C. 2013, A&A, 552, A76
- Stancliffe et al. (2009) Stancliffe, R. J., Chieffi, A., Lattanzio, J. C., & Church, R. P. 2009, Publications of the Astronomical Society of Australia, 26, 203
- Sukhbold et al. (2016) Sukhbold, T., Ertl, T., Woosley, S. E., Brown, J. M., & Janka, H.-T. 2016, ApJ, 821, 38
- Sukhbold et al. (2017) Sukhbold, T., Woosley, S., & Heger, A. 2017, ArXiv e-prints, arXiv:1710.03243
- Sukhbold & Woosley (2014) Sukhbold, T., & Woosley, S. E. 2014, ApJ, 783, 10
- Sukhbold & Woosley (2016) —. 2016, ApJ, 820, L38
- Timmes et al. (1996) Timmes, F. X., Woosley, S. E., & Weaver, T. A. 1996, ApJ, 457, 834
- Traxler et al. (2011) Traxler, A., Garaud, P., & Stellmach, S. 2011, ApJ, 728, L29
- Ugliano et al. (2012) Ugliano, M., Janka, H.-T., Marek, A., & Arcones, A. 2012, ApJ, 757, 69
- Vagnozzi et al. (2017) Vagnozzi, S., Freese, K., & Zurbuchen, T. H. 2017, ApJ, 839, 55
- van der Walt et al. (2011) van der Walt, S., Colbert, S. C., & Varoquaux, G. 2011, Computing in Science Engineering, 13, 22
- Van Dyk et al. (2000) Van Dyk, S. D., Peng, C. Y., King, J. Y., et al. 2000, PASP, 112, 1532
- Vink et al. (2001) Vink, J. S., de Koter, A., & Lamers, H. J. G. L. M. 2001, A&A, 369, 574
- Wang & Wheeler (2008) Wang, L., & Wheeler, J. C. 2008, ARA&A, 46, 433
- Weiss et al. (2005) Weiss, A., Serenelli, A., Kitsikis, A., Schlattl, H., & Christensen-Dalsgaard, J. 2005, A&A, 441, 1129
- West & Heger (2013) West, C., & Heger, A. 2013, ApJ, 774, 75
- West et al. (2013) West, C., Heger, A., & Austin, S. M. 2013, ApJ, 769, 2
- Woosley (2016) Woosley, S. E. 2016, ApJ, 824, L10
- Woosley (2017) —. 2017, ApJ, 836, 244
- Woosley et al. (1971) Woosley, S. E., Arnett, W. D., & Clayton, D. D. 1971, Physical Review Letters, 27, 700
- Woosley & Heger (2007) Woosley, S. E., & Heger, A. 2007, Phys. Rep., 442, 269
- Woosley et al. (2002) Woosley, S. E., Heger, A., & Weaver, T. A. 2002, Rev. Mod. Phys., 74, 1015
- Woosley & Weaver (1986) Woosley, S. E., & Weaver, T. A. 1986, ARA&A, 24, 205
- Xu et al. (2013) Xu, Y., Takahashi, K., Goriely, S., et al. 2013, Nuclear Physics A, 918, 61
- Zaussinger & Spruit (2013) Zaussinger, F., & Spruit, H. C. 2013, A&A, 554, A119
- Zhang et al. (2008) Zhang, W., Woosley, S. E., & Heger, A. 2008, ApJ, 679, 639