The extended Planetary Nebula Spectrograph (ePN.S) early-type galaxy survey: the kinematic diversity of stellar halos and the relation between halo transition scale and stellar mass
Abstract
Context. In the hierarchical two-phase formation scenario, the halos of early type galaxies (ETGs) are expected to have different physical properties from the galaxies’ central regions.
Aims. The ePN.S survey characterizes the kinematic properties of ETG halos using planetary nebulae (PNe) as tracers, overcoming the limitations of absorption line spectroscopy at low surface brightness.
Methods. The survey is based on data from the custom built Planetary Nebula Spectrograph (PN.S), supplemented with PN kinematics from counter-dispersed imaging and from high-resolution PN spectroscopy. We present two-dimensional velocity and velocity dispersion fields for 33 ETGs, including both fast (FRs) and slow rotators (SRs), making this the largest kinematic survey to-date of extragalactic PNe. The velocity fields are reconstructed from the measured PN velocities using an adaptive kernel procedure validated with simulations, and extend to a median of 5.6 effective radii (), with a range . We complemented the PN kinematics with absorption line data from the literature, for a complete description of the kinematics from the center to the outskirts.
Results. We find that ETGs typically show a kinematic transition between inner regions and halo. Estimated transition radii in units of anti-correlate with stellar mass. SRs have increased but still modest rotational support at large radii, while most of the FRs show a decrease in rotation, due to the fading of the inner disk in the outer, more slowly rotating spheroid. of the FRs are dominated by rotation also at large radii. Most ETGs have flat or slightly falling halo velocity dispersion profiles, but of the sample have steeply falling profiles. All of the SRs and 40% of the FRs show signatures of triaxial halos such as kinematic twists, misalignments, or rotation along two axes. We show with illustrative photometric models that this is consistent with the distribution of isophote twists from extended photometry.
Conclusions. ETGs have more diverse kinematic properties in their halos than in the central regions. FRs do contain inner disk components but these frequently fade in outer spheroids which are often triaxial. The observed kinematic transition to the halo and its dependence on stellar mass is consistent with CDM simulations and supports a two-phase formation scenario.
Key Words.:
Galaxies: elliptical and lenticular, cD - Galaxies: general - Galaxies: halos - Galaxies: kinematics and dynamics - Galaxies: structure1 Introduction
Observations (e.g. Trujillo et al. 2006; van Dokkum et al. 2010) as well as simulations (e.g. Oser et al. 2010; Rodriguez-Gomez et al. 2016; Qu et al. 2017) suggest a two phase scenario for the formation of early type galaxies (ETGs). An initial fast assembly stage, in which the ETGs grow through rapid star formation fueled by the infall of cold gas () or through major merger events (Wuyts et al. 2010; Sommer-Larsen & Toft 2010; Bournaud et al. 2011; Wellons et al. 2016), is followed by a series of merger episodes which enrich the galaxy halos of stars and make them grow efficiently in size (Oser et al. 2010; Gabor & Davé 2012; Lackner et al. 2012; Buitrago et al. 2017). The hierarchical accretion scenario finds its best evidence in the observations of a rapid growth of stellar halos at redshift with little or no star formation (e.g. Daddi et al. 2005; Trujillo et al. 2007; van Dokkum et al. 2010; Damjanov et al. 2011). In this context ETGs are layered structures in which the central regions are the remnant of the primordial stars formed in-situ, while the external halos are principally made of accreted material. The consequence is that the halos are expected to show significant variation with radius of properties such as light profiles (Huang et al. 2013; D’Souza et al. 2014; Iodice et al. 2016; Spavone et al. 2017), and kinematics (Coccato et al. 2009; Romanowsky & Fall 2012; Arnold et al. 2014; Foster et al. 2016).
Long slit spectroscopic observations of ETGs (e.g. Davies et al. 1983; Franx et al. 1989; Bender et al. 1994) revealed that this apparently homogeneous class of objects actually displays a kinematic diversity which also correlates with the isophote shape (Bender 1988b; Kormendy & Bender 1996). Disky ellipticals generally rotate fast, while slowly rotating ellipticals have a rather boxy shape. A remarkable step forward in the comprehension of the nature of ETGs was attained by the project (Cappellari et al. 2011), which for the first time applied integral-field spectroscopy (IFS) over a statistically-significant sample, mapping kinematics, dynamics, and stellar population properties within one effective radius (). A new paradigm for ETGs was proposed, which distinguishes between FRs and SRs according to the central projected specific angular momentum, (Emsellem et al. 2007). FRs include also S0 galaxies and represent the great majority () of ETGs. These are apparently oblate systems with regular disk-like kinematics along the photometric major axis. SRs, on the other hand, often display kinematic features such as counter-rotating cores or twist of the kinematic position angle. They are relatively rounder systems, mildly triaxial, and tend to be massive (Cappellari et al. 2013a).
The two classes have been interpreted as the result of the variety of processes shaping galaxies, leading to a sequence of baryonic angular momentum (Emsellem et al. 2011; Naab et al. 2014; Wu et al. 2014). On-going surveys like MANGA (Bundy et al. 2015), CALIFA (Sánchez et al. 2012), SAMI (Croom et al. 2012; Bryant et al. 2015), and MASSIVE (Ma et al. 2014) are currently working on increasing the size of the sample of IFS mapped objects, and extending the study to a wider range of environment and mass.
However, a classification scheme based on the characteristics of the galaxies in the central regions (inside ) may not be fully representative of the nature of these objects (e.g. Bellstedt et al. 2017b), raising the question of how complete our understanding is without a full knowledge of their properties on larger scales. The outer regions beyond in fact contain half of the galaxies’ stars and most of their dynamical mass. Dark matter is known to dominate there (e.g Mandelbaum et al. 2006; Humphrey et al. 2006; Koopmans et al. 2009; Churazov et al. 2010) and dynamical modeling of the outskirts is essential to constrain its distribution at intermediate radii (e.g. Gerhard et al. 2001; Romanowsky et al. 2003; Thomas et al. 2009; Napolitano et al. 2011; Morganti et al. 2013). Stellar halos are predicted to host mostly accreted star material as shown by particle tagging simulations (Cooper et al. 2013) and hydro-dynamical simulations (Rodriguez-Gomez et al. 2016). In addition, these regions provide insight into the most recent dynamical phase of the galaxy. In the halos the settling times are of order 1 Gyr and so signatures of the most recent assembly events may still be apparent, providing a mine of information about their formation and evolution mechanisms (e.g. Bullock & Johnston 2005; Tal et al. 2009; Romanowsky et al. 2012; Coccato et al. 2013; Duc et al. 2015; Longobardi et al. 2015). Thus extending investigations to the outer halos is crucial for having a complete picture of ETGs.
However kinematic measurements are not easily obtained for ETG halos, which generally lack cold gas (and so the 21 cm HI emission) used to probe the outer parts of spiral galaxies. Since the continuum light from the stars quickly drops with radius, absorption line spectroscopy is challenging beyond . This limits the assessment of the complicated dynamics of ETGs which, because dominated by dispersion, necessitates a good knowledge of the higher moments of the line of sight velocity distribution (LOSVD) in order to alleviate the anisotropy-potential-degeneracy (e.g. Gerhard 1993; Rix et al. 1997; Thomas et al. 2009; de Lorenzi et al. 2009; Napolitano et al. 2009).
Kinematic studies of ETGs from integrated-light spectra out to large radii have been performed by Kelson et al. (2002); Weijmans et al. (2009); Coccato et al. (2010); Murphy et al. (2011); Barbosa et al. (2018) using long slit spectroscopy or IFS on individual objects. More recently the SLUGGS survey (Arnold et al. 2014; Foster et al. 2016; Bellstedt et al. 2017a), the MASSIVE survey (Raskutti et al. 2014; Veale et al. 2017), and Boardman et al. (2017) generated kinematic data from integral field spectrographs (IFSs) for larger samples of ETGs, but never reaching beyond 111The values of used by most kinematic studies are measured in the bright central regions of galaxies, and may underestimate the half light radii (see discussion in section 8.6)..
The only possibility to probe the kinematics of a large sample of galaxies out to the very outskirts is through kinematic tracers that overcome the limit of the decreasing surface brightness, like globular clusters (e.g. Schuberth et al. 2010; Strader et al. 2011) or planetary nebulae.
Planetary nebulae (PNe) are established probes of the stellar population in ETG halos (e.g. Longobardi et al. 2013; Hartke et al. 2017). Their bright [OIII] line stands out against the faint galaxy background, making them relatively easy to detect. Since they are drawn from the main stellar population, their kinematics traces the bulk of the host-galaxy stars, and are directly comparable to integrated light measurements (Hui et al. 1995; Arnaboldi et al. 1996; Méndez et al. 2001; Coccato et al. 2009; Cortesi et al. 2013a). This makes PNe the ideal kinematic probes for the halos of ETGs. Globular clusters do not generally follow the surface brightness distribution of the stars and do not trace the stellar kinematics (e.g. Brodie & Strader 2006; Coccato et al. 2013; Veljanoski et al. 2014), and their color bimodality, suggesting two distinct formation mechanisms (Renaud et al. 2017, and references therein), complicates the interpretation of their use as kinematic tracers. The pioneering work of Coccato et al. (2009) studied the kinematics of 16 ETGs traced with PNe out to , finding evidence for kinematic transitions at large radii from the trends observed in the central regions (see also Arnold et al. 2014).
The extended Planetary Nebula Spectrograph (ePN.S) survey in based on observation mostly done with the PN.S, and consists of catalogs of PNe for 33 ETGs. This dataset is the largest survey to-date of extragalactic PNe identified in the halos of ETGs, complementing the absorption line kinematics of the central regions available in the literature. The rationale of the survey, the sample definition, and the construction of the catalogs are described in detail in Arnaboldi et al. (in preparation). Section 2 is a brief description of the ePN.S sample. Section 3 describes the general procedure adopted for extracting the mean velocity fields from the measured radial velocities of PNe, and reviews the adaptive kernel smoothing technique introduced by Coccato et al. (2009). In section 4 we evaluate the systemic velocity of the galaxies. The point-symmetry of the smoothed velocity fields is studied in section 5, while the trends of the kinematic parameters, such as rotational velocity, kinematic position angle, and velocity dispersion, are derived in section 6. The results are described in section 7 with a detailed analysis of SRs and FRs. A discussion of the results is presented in section 8. In section 9 we give a summary of the work and draw our conclusions.
2 Description of the Sample - Observations - Data reduction
This work is based mostly on data collected with the Planetary Nebula Spectrograph (PN.S) at the William Herschel Telescope in La Palma. The PN.S is a custom-built instrument designed for counter-dispersed imaging (Douglas et al. 2002). Arnaboldi et al. (in prep.) collected catalogs of PNe for 25 galaxies from PN.S, 11 of which new, to which they added 6 further catalogs from the literature and 2 additional new catalogs, for a total of 33 ETGs. This ePN.S sample is magnitude limited and covers a wide range of internal parameters, such as luminosity, central velocity dispersion, ellipticity, boxy/diskyness (table 2 summarizes the properties of the sample and the origin of the catalogs). Our catalogs contain a total of 8636 PNe, with data covering 4, 6, and 8 effective radii () for, respectively, 85%, 41%, and 17% of the sample, with median extension of 5.6 (see values of the last radial bins in table 2). This makes the ePN.S the largest kinematic survey to-date of extragalactic PNe in the outer halos of ETGs.
Arnaboldi et al. (in prep.) give a full discussion of the extraction and validation of the catalogs; here we provide a brief description of the adopted procedures. All the datasets (the new catalogs, as well as the PN catalogs from the literature) are uniformly (re)analyzed, in order to obtain a homogeneous sample of ETG kinematics whose properties can be consistently compared. The new PN.S observations, the 2 additional new catalogs, and the reanalyzed catalogs will be described in Arnaboldi et al. (in prep.).
For each galaxy, after the raw catalog has been obtained, it is uniformly cleaned from possible spurious sources and from so-called velocity ”outliers”. The first step for the removal of outliers among the PN candidates is the exclusion of all the detections with signal-to-noise ratio below a given threshold. We adopted as good compromise value between a reasonable signal-to-noise and the number of detections that satisfy this requirement.
Next we separate PNe belonging to any satellites from those in the hosts. For this we use the probability membership method from McNeil-Moylan et al. (2012), which uses both kinematic and photometric information to assign to each star a probability of belonging to the satellite or host. Membership to the host galaxy is assigned only if the probability is greater than 90%.
The last step is the removal of outliers in the remaining host PN velocity distribution. Such outliers could, e.g., arise because of contamination from other narrow emission-line sources (i.e. background star-forming galaxies) that are not resolved and appear point-like in the counter-dispersed images, similar to the monochromatic [OIII] emission from a PN. We identify outliers using a robust mean/sigma clipping procedure. The algorithm derives a robust mean velocity () and velocity dispersion , using a running average in a 2D phase space (coordinate, ) with a window of data points (, according to the number of tracers in each galaxy) and a 3 data points step. An iterative procedure clips the PN candidates whose , and evaluates and until the number of clipped objects stabilizes. In each iteration is corrected by a factor 1.14 to account for the cut of the LOSVD tails. Finally, to the 95% of a galaxy’s PNe thus validated, the remaining 5% of the PNe are added back to the sample, using those clipped objects which are closest in to the contours, so that the final PN sample also includes the objects expected in the approximately Gaussian tails of the LOSVD.
In the case of disk galaxies, dominated by rotation, a disk/spheroid decomposition was performed following Cortesi et al. (2011): using both photometric data and kinematic information we assigned to each PN the probability of being associated with each photometric component. The tagging of the outliers from the disk and the spheroid separately allows us to account for their different kinematics when using the robust mean/sigma clipping procedure. The disk is processed first, and its flagged PNe are added to the PNe of the bulge. Eventually the flagged bulge PNe are considered as outliers of the entire galaxy.
Finally, we estimated the number of background emitting galaxies, whose emission line might fall in the range of velocities determined in the procedure above. We employed the approach adopted in Longobardi et al. (2013), which uses the Lyman alpha (Ly) luminosity function by Gronwall et al. (2007), and adapted it to the ePN.S survey. Given the limiting magnitude, the area coverage, and the filter band-passes of the PN.S, the number of expected background galaxies is 2. This is an upper limit, as the Gronwall et al. (2007) sample also includes [OII] emitters at . These [OII] emitters are characterized by the oxygen doublet at that is resolved in wavelength at the resolution of the PN.S, so the [OII] emitters have already been removed from the PN candidate sample because they are not monochromatic emission. We discuss the effect of the Ly background contaminants on the kinematics in section 3.2.2.
The datasets processed in this way are the Bona Fide PNe catalogs used in the following analysis.
3 Kernel smoothing method
The measured line-of-sight (LOS) velocities of the PNe are random samplings of the galaxy LOSVD function at the position of the source. Therefore each velocity measurement randomly deviates from the local mean velocity by an amount that depends on the local LOS velocity dispersion.
In order to extract the mean LOS velocity and the LOS velocity dispersion fields from this discrete velocity field, we use an adaptive kernel smoothing technique, as described in Coccato et al. (2009), that performs a local average of the measured discrete LOS velocities. In the following section we briefly review the smoothing technique, while we refer to Coccato et al. (2009) for a more detailed discussion. In appendix A we validated the adopted procedure on simulated data, in order to test the effects of different statistical realizations of a given sample of tracers, the dependency on the number of tracers, and different ratios on the estimated kinematic parameters.
3.1 Averaging the discrete velocity field with the adaptive kernel smoothing technique
The smoothing of the discrete velocity field is carried out by computing the velocity at each position in the sky as a weighted mean of all the PN LOS velocities
| (1) |
while the velocity dispersion is given by the square root of the variance of with respect to
| (2) |
The weight of each PN is defined using a Gaussian Kernel that depends on the distance of the PN from the position , normalized by a kernel width
| (3) |
The latter controls the spatial scale of the region over which the smoothing is performed, and hence the spatial resolution of the kinematic study. Large values of , in fact, lead to smoother profiles in the mean LOS velocity fields, highlighting the general trends, but also suppressing the small scale structures, while smaller values of allow a better spatial resolution but may amplify any noise pattern. Hence the optimal should be a compromise between spatial resolution and statistical noise smoothing.
The width is therefore defined to be linearly dependent on the distance between the position and the Mth closest PN, so that is a function of the local density of tracers . This allows to be smaller in the innermost, dense regions of galaxies, and larger in the outskirts, where their density is usually lower. The optimal kernel parameters and are derived as described in section 3.1.1. We chose , but Coccato et al. (2009) tested the procedure with finding no significant differences in the results.
| Galaxy | (a)𝑎(a)(a)𝑎(a)footnotemark: | D (b)𝑏(b)(b)𝑏(b)footnotemark: | class (c)𝑐(c)(c)𝑐(c)footnotemark: | (d)𝑑(d)(d)𝑑(d)footnotemark: | (e)𝑒(e)(e)𝑒(e)footnotemark: | (f)𝑓(f)(f)𝑓(f)footnotemark: | (g)𝑔(g)(g)𝑔(g)footnotemark: | (h)ℎ(h)(h)ℎ(h)footnotemark: | References (i)𝑖(i)(i)𝑖(i)footnotemark: | References (l)𝑙(l)(l)𝑙(l)footnotemark: |
|---|---|---|---|---|---|---|---|---|---|---|
| NGC | [mag] | [Mpc] | [arcsec] | [degrees] | PN data | abs.line data | ||||
| 0584 | 20.2 | F | 33 (1) | 7.4 | 63 | 25 | (7) | (21) | ||
| 0821 | 23.4 | F | 40 (2) | 4.8 | 31.2 | 122 | (8) | (18);(40);(41) | ||
| 1023 | 10.5 | F | 48 (2) | 6.8 | 83.3 | 181 | (8);(9) | (18);(30) | ||
| 1316 | 21.0 | F | 109 (3) | 4.7 | 50 | ∗*∗*Objects for which we used circular radial bins () | 737 | (10) | (22) | |
| 1344 | 20.9 | F | 30 (4) | 7.8 | 167 | 192 | (12) | (23) | ||
| 1399 | 20.9 | S | 127 (3) | 4. | 110 | ∗*∗*Objects for which we used circular radial bins () | 145 | (11) | (24) | |
| 2768 | 22.4 | F | 63 (2) | 6.2 | 91.6 | 312 | (9) | (18);(31) | ||
| 2974 | 22.3 | F | 38 (2) | 5.8 | 44.2 | 22 | (7) | (18) | ||
| 3115 | 9.5 | F | 93 (6) | 4.7 | 43.5 | 183 | (9) | (18);(25) | ||
| 3377 | 11.0 | F | 35.5 (2) | 7.7 | 46.3 | 136 | (8) | (18); (33) | ||
| 3379 | 10.3 | F | 40 (2) | 5.3 | 68.2 | ∗*∗*Objects for which we used circular radial bins () | 189 | (8) | (19);(32);(40) | |
| 3384 | 11.3 | F | 32.5 (2) | 6.8 | 50 | 85 | (9) | (19) | ||
| 3489 | 12.0 | F | 22.5 (2) | 4.8 | 70.5 | 57 | (9) | (19) | ||
| 3608 | 22.8 | S | 29.5 (2) | 8.2 | 82 | ∗*∗*Objects for which we used circular radial bins () | 92 | (8) | (18) | |
| 3923 | 23.1 | S | 86.4 (1) | 4.9 | 48 | 99 | (15) | (26) | ||
| 4278 | 15.6 | F | 31.5 (2) | 7.6 | 39.5 | ∗*∗*Objects for which we used circular radial bins () | 69 | (7) | (18) | |
| 4339 | 17.0 | F | 30 (2) | 3. | 15.7 | ∗*∗*Objects for which we used circular radial bins () | 44 | (7) | (20);(38) | |
| 4365 | 23.1 | S | 52.5 (2) | 5.6 | 40.9 | ∗*∗*Objects for which we used circular radial bins () | 227 | (7) | (18) | |
| 4374 | 18.5 | S | 52.5 (2) | 5.9 | 128.8 | ∗*∗*Objects for which we used circular radial bins () | 445 | (8) | (18) | |
| 4472 | 16.7 | S | 95.5 (2) | 8.4 | 154.7 | ∗*∗*Objects for which we used circular radial bins () | 431 | (7) | (20);(37) | |
| 4473 | 15.2 | F | 27. (2) | 5.6 | 92.2 | 153 | (7) | (18) | ||
| 4494 | 17.1 | F | 49 (2) | 4.8 | 176.3 | ∗*∗*Objects for which we used circular radial bins () | 255 | (8) | (18);(36) | |
| 4552 | 16.0 | S | 34. (2) | 9.2 | 132 | ∗*∗*Objects for which we used circular radial bins () | 227 | (7) | (19);(38) | |
| 4564 | 15.9 | F | 20.5 (2) | 6.5 | 47 | 47 | (8) | (18) | ||
| 4594 | 9.5 | F | 102 (5) | 4. | 88 | 258 | (16) | (27) | ||
| 4636 | 14.3 | S | 89. (2) | 3. | 144.2 | ∗*∗*Objects for which we used circular radial bins () | 189 | (7) | (20);(39) | |
| 4649 | 16.5 | F | 66 (2) | 4.5 | 91.3 | ∗*∗*Objects for which we used circular radial bins () | 281 | (13) | (18);(34) | |
| 4697 | 12.5 | F | 61.5 (1) | 4.5 | 67.2 | 525 | (14) | (18);(35) | ||
| 4742 | 15.8 | F | 14.4 (4) | 13.1 | 80 | 64 | (7) | (28) | ||
| 5128 | 4.1 | F | 162.6 (1) | 11.9 | 30 | ∗*∗*Objects for which we used circular radial bins () | 1222 | (17) | (29) | |
| 5846 | 24.6 | S | 59 (2) | 4.3 | 53.3 | ∗*∗*Objects for which we used circular radial bins () | 118 | (8) | (18) | |
| 5866 | 14.8 | F | 36 (2) | 9.4 | 125 | 150 | (7) | (18) | ||
| 7457 | 12.9 | F | 36 (2) | 3.2 | 124.8 | 108 | (9) | (18) |
$a$$a$footnotetext: is the total absolute luminosity in the K band. These values are obtained from the total apparent total magnitudes of the 2MASS atlas (Skrutskie et al. 2006) using the distance D, and correcting for foreground galactic extinction (Schlegel et al. 1998): . We assume , consistently with Cappellari et al. (2011). The magnitudes are from integrating the surface brightness profiles (), extrapolated from the 20 mag/arcsec2 isophote to (Jarrett et al. 2003)
$b$$b$footnotetext: Distances of galaxies derived from the surface brightness fluctuation method. Whenever possible we adopt the distance moduli measured by Blakeslee et al. (2009, B09), otherwise we used the values from Jensen et al. (2003, J03) or from Tonry et al. (2001, T01). The distance moduli from J03 were rescaled to the zero-point calibration of B09 by applying a shift of +0.1 mag, while the distance moduli from T01 were zero-point- and bias-corrected using the formula from Blakeslee et al. (2010) and the data quality factor Q given by T01.
$c$$c$footnotetext: The sample is divided into SRs (S) and FRs (F), according to the definition of Emsellem et al. (2011), from the kinematics within .
$d$$d$footnotetext: Adopted effective radius. The index in parenthesis corresponds to the reference: (1) Ho et al. (2012), (2) Cappellari et al. (2011), (3) Caon et al. (1994), (4) Blakeslee et al. (2001), (5) Kormendy & Westpfahl (1989), (6) Capaccioli et al. (1987).
$e$$e$footnotetext: Mean radius of the last radial bin in units of effective radii.
$f$$f$footnotetext: Average value of the photometric position angle and
$g$$g$footnotetext: ellipticity (), from Krajnović et al. (2011) (within ) and Ho et al. (2011) (in the outer regions, where they converge to a constant value) For NGC 3384 and NGC 4564 we used the from Meusinger & Ismail (2007) and Goudfrooij et al. (1994), respectively. , see section 3.2.
$h$$h$footnotetext: Number of detected PNe.
$i$$i$footnotetext: References for the PNe datasets: (7) are new PN.S catalogs presented in Arnaboldi et al. (in prep.), (8) Coccato et al. (2009), (9) Cortesi et al. (2013a), (10) McNeil-Moylan et al. (2012), (11) McNeil et al. (2010), (12) Teodorescu et al. (2005), (13) Teodorescu et al. (2011), (14) Méndez et al. (2009), (15) unpublished data from counter dispersed imaging (Arnaboldi et al. in prep.), (16) unpublished data from narrow band imaging and spectroscopic follow up (Arnaboldi et al. in prep.), (17) Peng et al. (2004) and Walsh et al. (2015)
$l$$l$footnotetext: References for absorption line data: kinemetry from (18) Foster et al. (2016) on SLUGGS+ data, from (19) Krajnović et al. (2008) and from (20) Krajnović et al. (2011), major axis long slit spectroscopy from (21) Davies & Illingworth (1983), (22) Bedregal et al. (2006), (23) Teodorescu et al. (2005), (24) Saglia et al. (2000) and Scott et al. (2014), (25) Norris et al. (2006), (26) Carter et al. (1998), (27) Kormendy & Illingworth (1982), (28) Davies et al. (1983), (29) Marcelin (1983)), (30) Simien & Prugniel (1997c), (31) Simien & Prugniel (1997a), (32) Statler & Smecker-Hane (1999), (33) Coccato et al. (2009), (34) De Bruyne et al. (2001), (35) de Lorenzi et al. (2008), (36) Napolitano et al. (2009), (37) Veale et al. (2017), (38) Simien & Prugniel (1997b), (39) Pu & Han (2011), (40) Weijmans et al. (2009), (41) Forestell & Gebhardt (2010).
3.1.1 Deriving the optimal A and B kernel parameters
The parameters and in equation (3) are chosen so that the best compromise between spatial resolution and noise smoothing is achieved. We developed an iterative procedure in order to derive the optimal kernel parameters that realize this condition.
We first estimated the velocity gradient to be resolved by the smoothing procedure by performing a preliminary averaging with a fully adaptive kernel ( and ). The derived mean velocity field, , is fitted with a cosine function, which, in general, approximately describes the velocity profiles of early type galaxies (see Cohen & Ryzhov 1997):
| (4) |
This interpolation function provides a measure of the position angle of the kinematic major axis (), along which the steepest velocity gradient is expected to lie. The gradient is obtained by fitting a straight line to the velocities of the PNe lying in a section along the direction, as a function of the radius.
The best kernel parameters that allow to resolve spatial substructures with typical velocity gradient are derived by building simulated sets of PNe (see Coccato et al. 2009). The stars are spatially distributed according to a given density , while their velocities are assigned using the derived velocity gradient and adding a dispersion equal to the standard deviation of the observed radial velocities. The artificial sets are processed using different values of the kernel until the simulated input velocity field is recovered: this provides the best for this . The procedure is repeated for different values of , and the optimal A and B are the best fit values of equation (3) based on on the derived best as a function of .
3.1.2 Errors in the derived velocity fields
Errors on and are obtained using Monte Carlo simulations, as also discussed in Coccato et al. (2009). For each galaxy, 100 PN datasets are built with simulated radial velocities at the same positions as the observed PNe. The radial velocity for each simulated object is obtained from the two-dimensional smoothed velocity field, adding a random value from a Gaussian distribution centered at 0 and with dispersion where is the velocity error. These simulated datasets are smoothed with the same kernel as the real sample, and the standard deviations of the simulated velocity and velocity dispersion fields give the errors on and . This procedure is validated in appendix A.2 with PN velocity distributions generated from a simulated merger remnant galaxy, which are analyzed in an identical manner as the real galaxy PN samples. As an additional test, we have also extracted and analyzed kinematic information from 1000 subsamples of the original PN sample for all our galaxies and found kinematic parameters consistent with our full-sample results, as described in section 3.2.2.
3.2 Fitting a rotation model
The mean velocity fields, derived from smoothing the discrete velocities, are divided into radial bins with equal numbers of PNe such that they contain at least 30 stars. If a galaxy contains less than tracers, we divide the sample in two bins in order to study possible radial trends.
The bins are circular for galaxies either with small flattening, i.e. , or whose PN spatial distribution has a rather square shape. For all the other galaxies we use elliptical bins oriented along the photometric major axis, with a flattening equal to a characteristic ellipticity of the isophotes of the galaxy (the adopted ellipticity, , and photometric position angle are given in table 2).
We found that the results of our analysis do not depend on the chosen flattening but, since the spatial distribution of the PNe follows the light, and so it may be rather flattened, elliptical bins help to sample the field homogeneously in an azimuthally-unbiased way.
In each radial bin, we fitted the PN velocities of position (, ) with a rotation model (see section 3.2.1). Here is the eccentric anomaly of the PN in the bin of coordinates , , and is the ellipticity. is the major axis distance of each PN and is the mean of the PNe in each bin.
3.2.1 Point-symmetric rotation model
A velocity map is a periodic function in , so it can be expanded in a Fourier series and approximated by a finite number of harmonics:
| (5) |
Elliptical galaxies in dynamical equilibrium are triaxial systems (e.g. Statler 1994, and references therein), so the projection on the sky of the mean velocity field should be point-symmetric with respect to the systemic velocity (see Krajnović et al. 2006; Coccato et al. 2013), i.e. symmetric positions have equal velocities with opposite sign (). Deviations from this behavior arise from perturbations from equilibrium that may be due to interaction or merger episodes. If one of these processes, which plays a role in the formation and evolution of early type galaxies, occurred relatively recently (a few Gyrs ago), it is likely that some signatures in the kinematics and orbital structure of the galaxy are still observable, especially in the halo where the dynamic time-scales are longer.
The requirement of point-symmetry on , namely , allows only odd values for in equation (5).
The expansion in equation (5) can be rewritten in a more direct way, as a rotation around the kinematic axis plus higher order modes. This is achieved through a rotation such that
| (6) |
with
| (7) |
The phase can be chosen so that the amplitude of the first order sine term is 0: if . This implies that
| (8) |
and
| (9) |
In this notation coincides with the position angle of the kinematic major axis, , is the mean velocity of the PNe in the bin, and is the amplitude of the projected rotation, . The amplitudes of the higher order harmonics, and , are corrections that account for deviations of the galaxy motion from the simple cosine rotation.
In practice the series in equation (9) can be truncated to the third order as the higher order harmonics are generally zero within the errors. The resulting function is fitted to the mean velocity estimates at all PN positions in each radial bin, with the position angle , the constant , and the amplitudes , , and , as free parameters. The fit of the parameter gives an estimate of the systemic velocity in the halo (see section 4). Once is subtracted from the velocity fields, their point-symmetry can be studied (section 5) and used to produce the final mean velocity fields for the point symmetric galaxies (see section 6.1). The final mean velocity fields, after subtracting , are eventually fitted with the function
| (10) |
where the only free parameters are , , , and (see section 6.2).
The kinematic quantities and obtained fitting the model in equation (10) on the smoothed velocity fields are comparable to the results from a kinemetry fit to IFS data (Krajnović et al. 2006, 2011; Foster et al. 2016). However, we do not apply kinemetry, because this would mean fitting ellipses to the PN smoothed velocity fields. Since these have been derived from small samples of discrete tracers which, by nature, have lower spatial resolution and signal-to-noise ratio, a more straightforward approach, with fewer free parameters, is preferable.
3.2.2 Errors on the fitted parameters
The errors on the fitted parameters, , , , , and , are evaluated via Monte Carlo simulations: the 100 simulated datasets produced for deriving the errors on and (see section 3.1) are divided into radial bins and modeled with equation (9). The errors are the standard deviations on the fitted parameters.
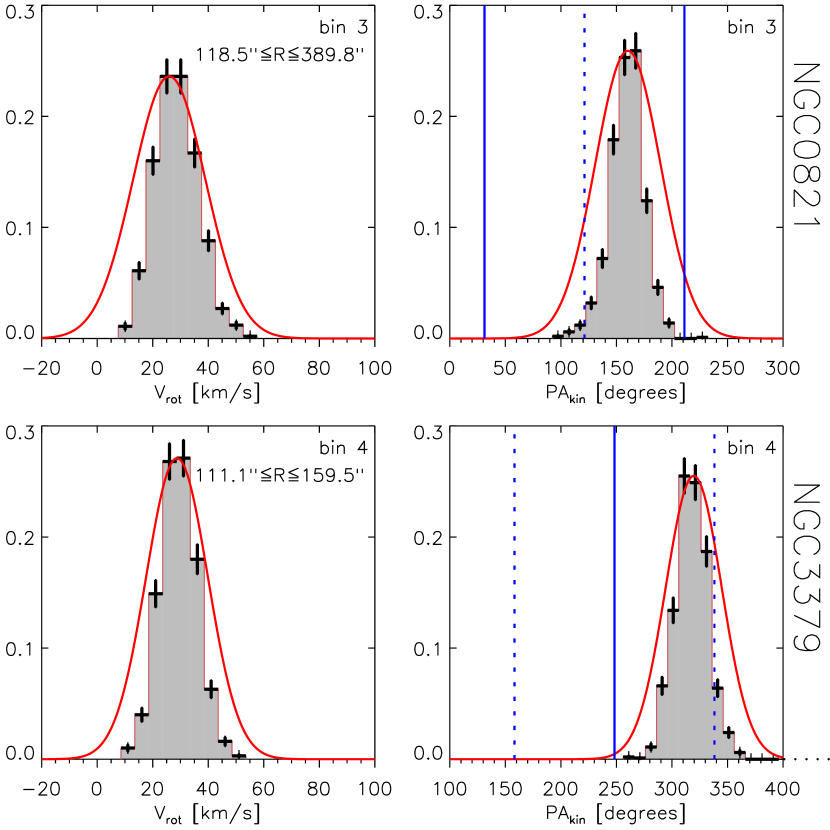
We tested whether the mean velocity field extracted through the smoothing procedure is sensitive to the relatively large velocities of objects belonging to the tails of the LOSVD. For this we selected subsamples of the observed dataset, re-extracted the kinematics, and studied the distribution of the fitted kinematic parameters. For each galaxy we used 1000 subsamples built with 80% of the observed PNe each. (We do not use bootstrap with replacement as it would not be consistent with the constraint for the PNe to follow light.) Figure 1 shows the distributions of the fitted and in one radial bin for the PN subsamples extracted for NGC 0821 and NGC 3379. For all the ePN.S galaxies these distributions fall well within the statistical uncertainties of the fitted parameters from the full datasets. This shows that the values of and measured are not driven by a few high velocity objects, but are properties of the whole PN sample.
In addition, we simulated the effect of the contamination by background Ly emitters by adding two random velocity measurements (see section 2), uniformly drawn in velocity from the filter band-pass used for each individual galaxy in our sample. We then re-extracted all the kinematic observables, and found that they are well within the 1 sigma errors of the measurements without contaminants.
4 Systemic velocity subtraction
A measure of the systemic velocity of the galaxies is provided by the fit of the PN smoothed velocity field in radial bins with the harmonic expansion in equation (9). The bins are built as described in section 3.2 and the adopted geometry for each galaxy (i.e. ellipticity, , and photometric position angle, ) is listed in table 2. The parameter, in fact, represents the mean velocity of the tracers in the radial bin with radius . When the galaxy does not display kinematic substructures (bulk motions), this mean velocity is an estimate of the systemic velocity of the galaxy which is constant with radius for a gravitationally bound system.
Since the PNe are not distributed uniformly on the sky, gives actually a more precise evaluation of the systemic velocity than a straight average of the measured LOS velocities. The fit of equation (9) removes any contribution to the mean from rotation and is not sensitive to azimuthal completeness. Hence we can perform the fit leaving the parameter free to vary in each bin. We find that is generally constant with radius within the errors. Therefore we adopt, for each galaxy, a mean systemic velocity, , defined as a mean of the values, weighted with the errors on the fit:
| (11) |
We conservatively consider as error on , , the mean of the errors , since the single measures of , coming from a smoothed velocity field, are not independent quantities.
We find that does sometimes display a trend with radius within the errors. This is due to the interplay between spatial inhomogeneities and smoothing, which may result in a slight asymmetry of one side of the galaxy with respect to the other. This effect naturally disappears as soon as the catalogs are folded by point-symmetry transformation (see section 5), but we keep track of it in the uncertainties, by adding in quadrature the scatter of the values to the error .
NGC 1316 and NGC 5128 are treated separately with respect to the other galaxies. Their fitted are constant in most radial bins, but they deviate in localized bins from this constant by more than twice the errors. At these radii the galaxies display important features in their velocity fields which cause an offset of the average velocity from the systemic value. We masked the most irregulars bins and use the fitted on the others to compute the mean .
The measured values of for all the galaxies are reported in table 7. We do not observe any systematic bias in the measured values, and they all agree within twice the error on with the literature. Hereafter we will refer to the barycentric velocities using , and to the smoothed barycentric velocities using .
5 Point symmetry analysis of the sample
In this section we investigate whether the galaxies in the ePN.S sample show any deviation from point-symmetry.
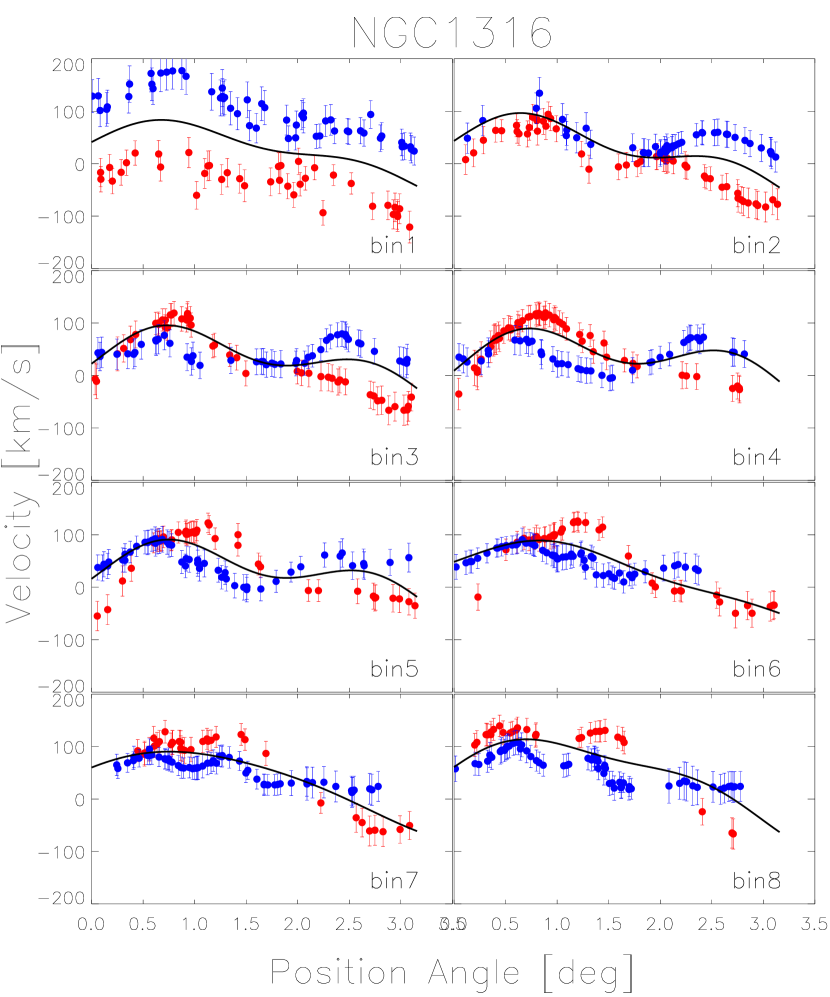
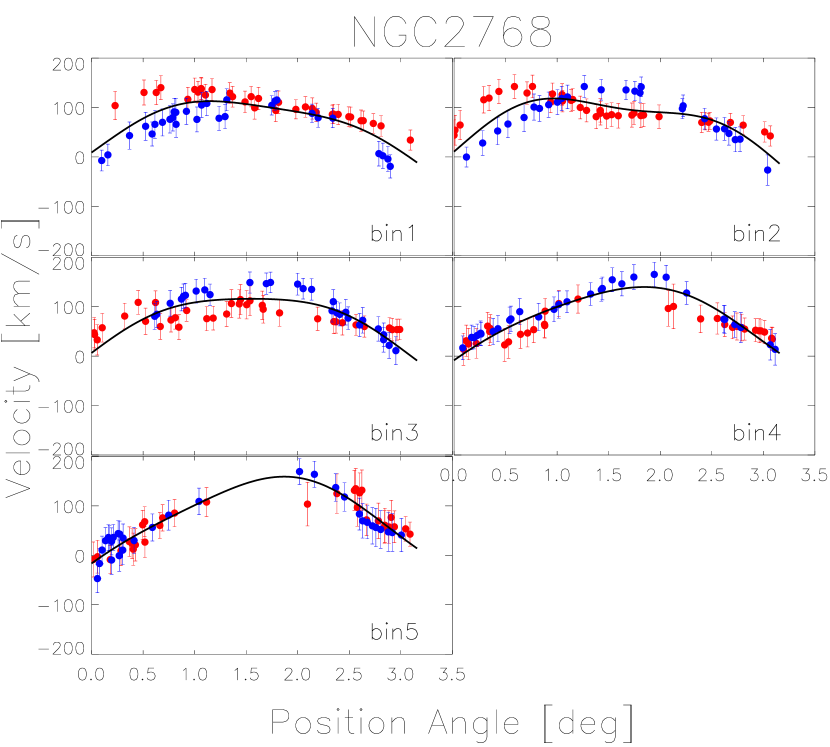
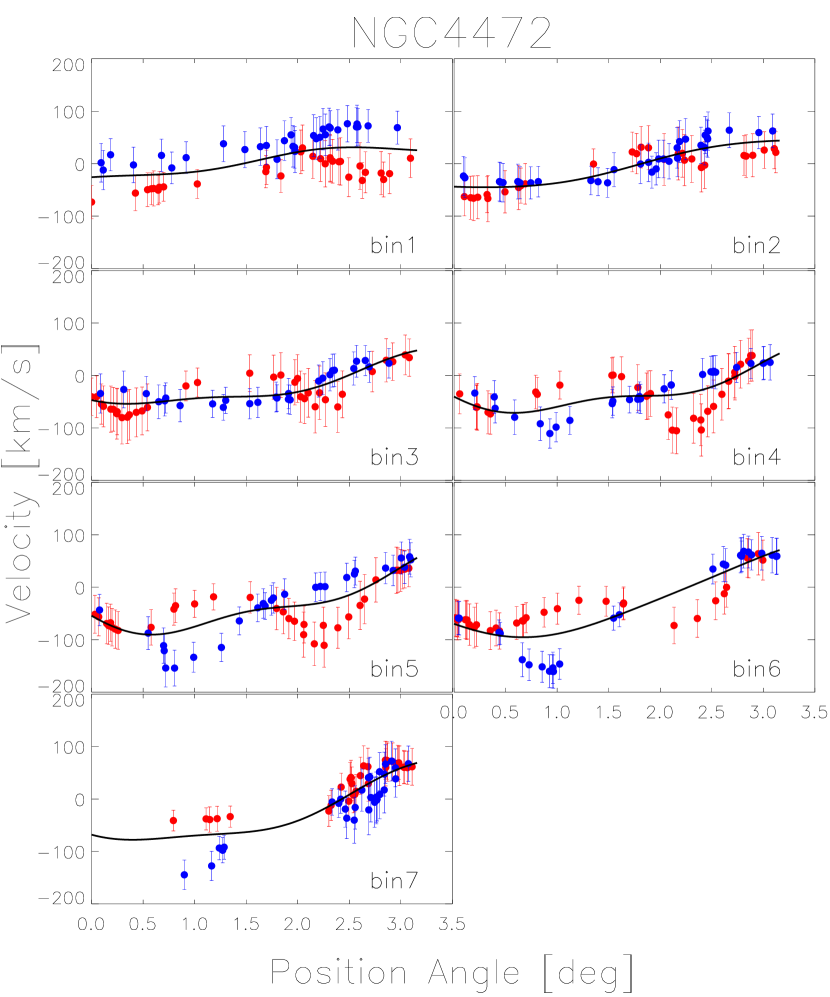
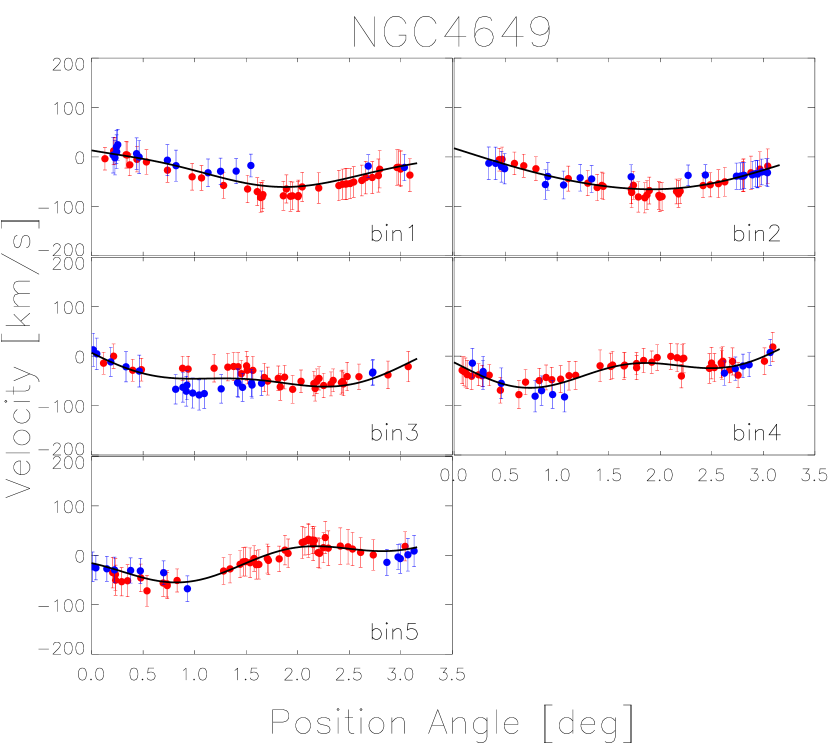
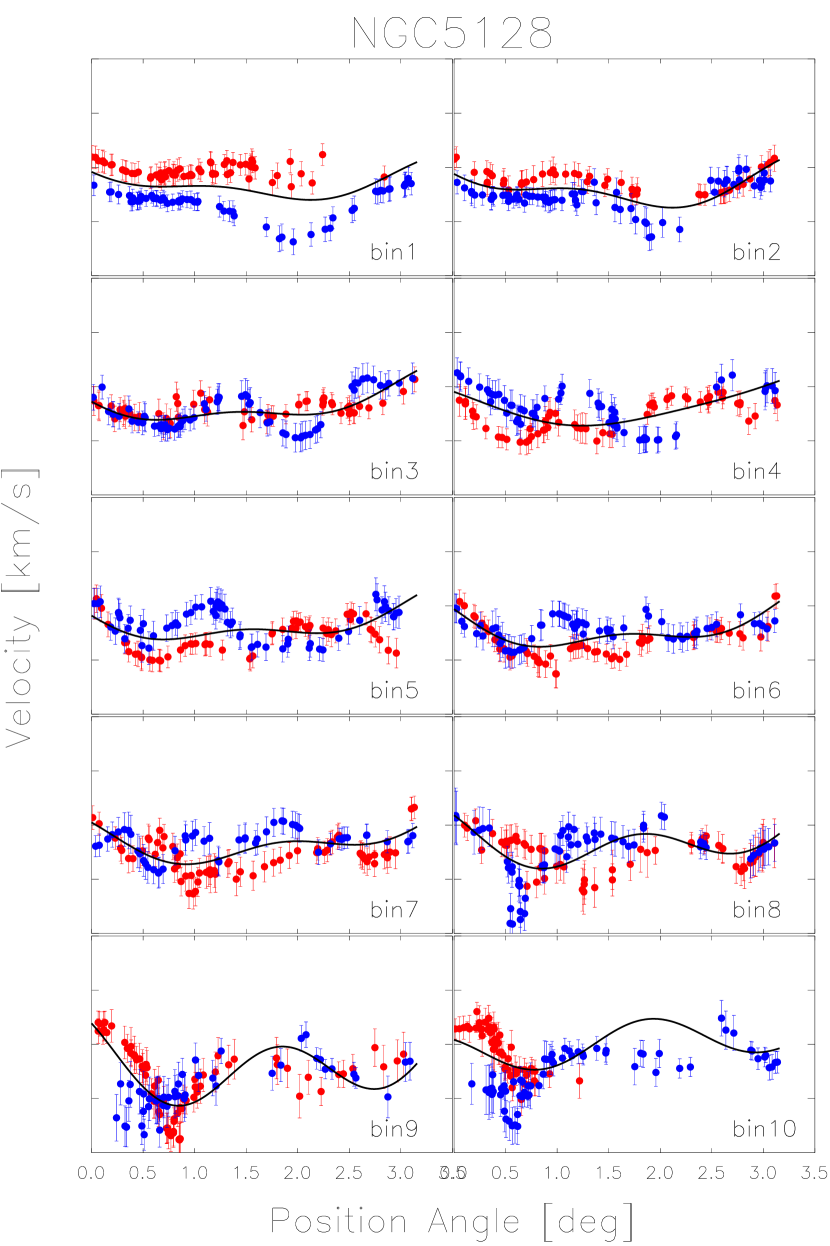
We studied the point-symmetry of the velocity fields of the galaxies by comparing the velocities with with those with , changed in sign, in each radial bin. Asymmetries in the velocity fields are visible where these quantities significantly differ from each other. Figure 2 shows a few examples of this analysis. NGC 4649 is point-symmetric, while the others show significant deviations. In the sample of 33 galaxies, 5 are found to be non-point-symmetric: NGC 1316, NGC 2768, NGC 4472, NGC 4594 and NGC 5128. The galaxies for which we find evidence for asymmetries are those with the richest PN catalogs. For these objects the kinematic details are best recovered.
The others galaxies are consistent with point-symmetry, so for these systems we used the folded catalogs to reconstruct the final velocity and velocity dispersion fields, as described in section 6.1. Since the mean velocity fields are the result of a smoothing procedure, their point symmetry does not rule out kinematic asymmetries on smaller scales.
5.1 Testing the significance of the deviations from point-symmetry
As first step, the PN smoothed velocities are modeled with the harmonic expansion in equation (9), which also provides a good description of the galaxy velocity field where the spatial distribution of the tracers is not azimuthally complete. We consider as possible deviations from point-symmetry any groups of at least three tracers whose velocity deviates more than twice the errors from the fitted point symmetric model.
We evaluate the significance of the observed deviations from point symmetry by using 100 models of the galaxies, constructed as described in appendix A.3. These are built using the positions of the PNe from the real dataset, and, by construction, have a point symmetric mean velocity field. If similar local deviations from point symmetry that we observe in the velocity field of the galaxy appear also in the smoothed velocity fields of the models, then we know that they are artifacts of the smoothing over that particular spatial distribution, and not properties of the intrinsic galaxy velocity field. Hence, for each feature in the galaxy, we select in the models the groups of PNe having the same coordinates as the feature, and compute the distribution of deviations of their velocities from the harmonic expansion fitted to each model. This distribution will give the probability of occurrence of the feature due to statistical fluctuations.
We found that the features in NGC 2768 and NGC 4594 have a probability to happen in the symmetric models so they are likely real. Those in NGC 2768 might be related to asymmetries in light distribution clearly visible in deep optical images (e.g. the g and r maps of Duc et al. 2015)333http://www-astro.physics.ox.ac.uk/atlas3d/. The features in NGC 4594 are more likely due to extinction effects from its dusty disk, which hampers the detection of a complete sample of PNe in that area. In both cases the deviations of the velocity fields from point symmetry are localized and do not influence the kinematic analysis.
For NGC 1316, NGC 4472, and NGC 5128 the velocity offsets and the phase-angle shifts of the in (, red in figure 2) with respect to (, blue in figure 2) cannot be reproduced by the point symmetric models. These galaxies are well known recent mergers. Their halos are dominated by the recently accreted component which is not yet in a phase-mixed equilibrium with the surroundings and hence it still maintains peculiar kinematics (see also appendix C).
One may be tempted to identify the groups of PNe whose velocity significantly deviate from the model as those associated to the structure, but we need to keep in mind that their velocities are the result of an averaging procedure, and that the different kinematic components can only be separated by analyzing the full phase space (see e.g. the GMM modeling of Longobardi et al. 2015); such a study is beyond the scope of this paper.
6 The halo kinematics of ETGs
6.1 Velocity fields
A point symmetric system is, by definition, such that each point of the phase space has a point-reflected counterpart . For the galaxies that do not show any significant deviation from point symmetry (section 5), we assume that point symmetry holds. In these cases we can double the number of data-points by adding to the observed dataset its mirror dataset, and creating in this way a folded catalog (e.g Arnaboldi et al. 1998; Napolitano et al. 2001; Peng et al. 2004; Coccato et al. 2009). This helps in reducing the fluctuations in the recovered velocity fields. The results obtained using the folded catalogs are consistent with those from the unfolded datasets within the errors. Therefore for the galaxies consistent with point symmetry we will use the folded catalogs to produce the final mean velocity fields; for the others (i.e. NGC 1316, NGC 2768, NGC 4472, NGC 4594 and NGC 5128) the original catalogs are used.
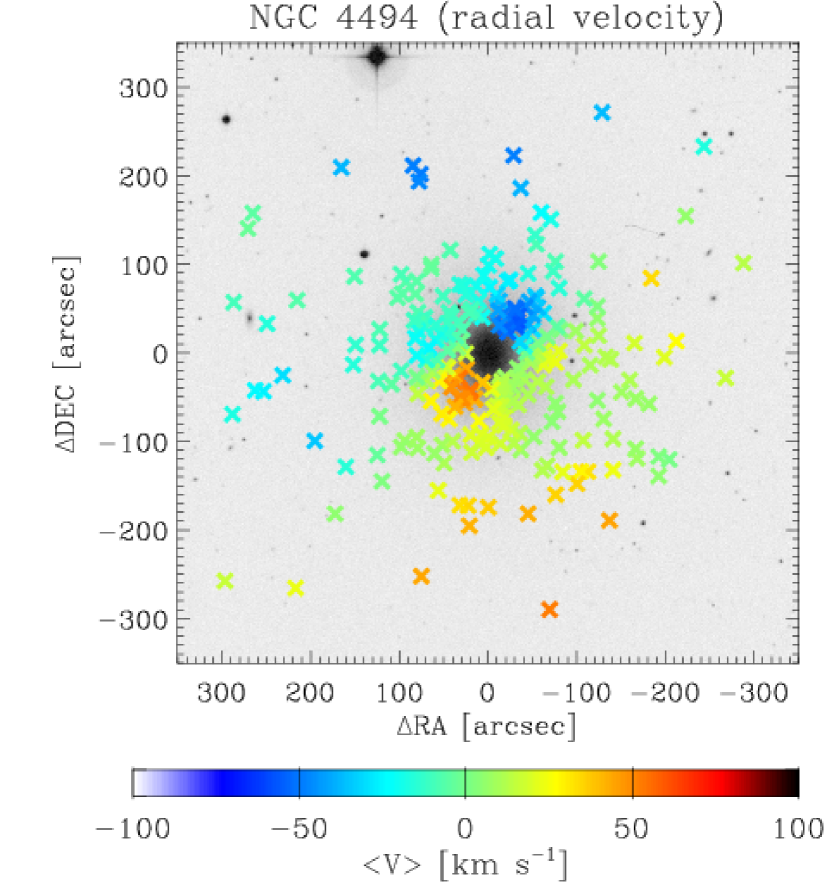
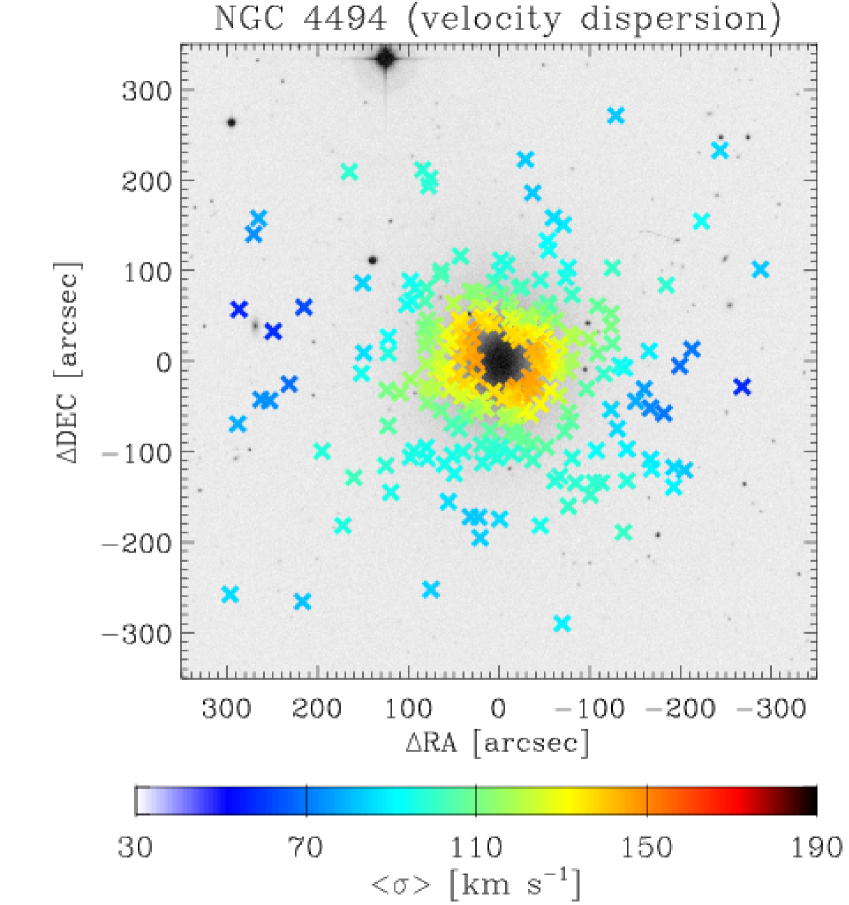
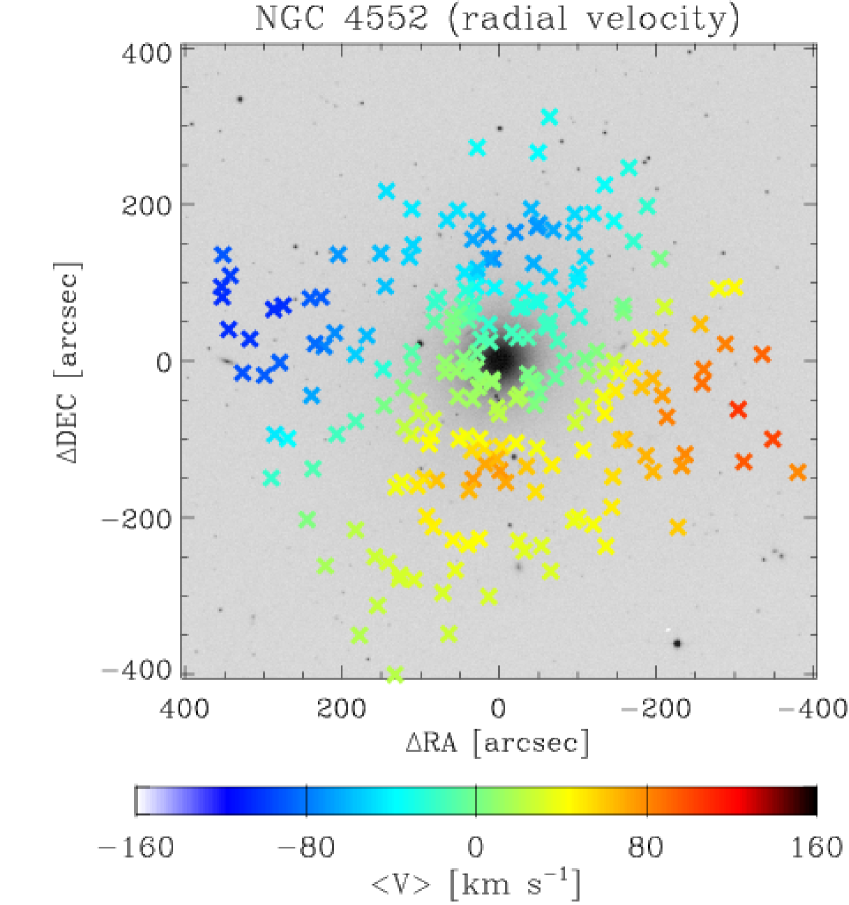
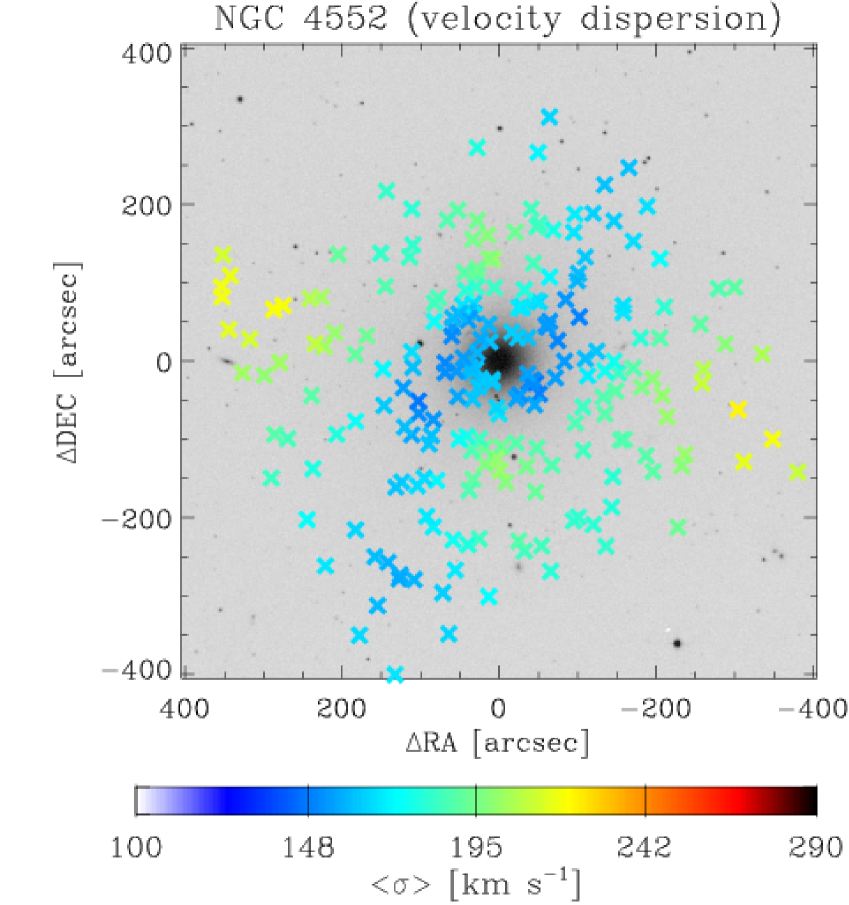
Figure 3 shows the result for two galaxies with a similar number of tracers, NGC 4494 and NGC 4552. Both are point symmetric, so the velocity fields in figure 3 are built using the folded catalogs. NGC 4494 is a FR showing some rotation also in the halo. Its velocity dispersion field reveals that decreases with radius. The SR NGC 4552, by contrast, displays increasing rotation velocity about two perpendicular axes, and increasing velocity dispersion with radius.
The smoothed velocity fields for all the galaxies of the ePN.S sample are shown in appendix D. For a more immediate visualization we present interpolations of the velocity fields, based on computing and on a regular grid. The kinematics typically extends a median of 5.6 , covering a minimum of to a maximum of . The adopted values are listed in table 2. Table 2 also shows the mean radius of the last radial bins, in which we can statistically determine and .
The typical errors on the mean velocities and on the velocity dispersions, evaluated with Monte Carlo simulations, range from 10 to 40 km s-1, being smaller for galaxies with a larger number of tracers and higher .
These errors on the mean velocity fields, the mean errors on the radial velocity measurement, the kernel parameters and used in the smoothing procedure, and the systemic velocities subtracted are reported in table 7.
A visual comparison with the kinematic maps published by the (Krajnović et al. 2011) and SLUGGS (Arnold et al. 2014; Foster et al. 2016) surveys shows a general good agreement for all the galaxies in the regions of overlap. By consistency/good agreement we mean that the values and trends in from either kinemetry (by Krajnović et al. 2008; Foster et al. 2016) or slit absorption line kinematics agree within the errors with the kinematics from the PNe in the regions of overlap, or the latter extend such radial trends to the outer regions. See the appendix C for a detailed description of the individual objects.
6.2 Kinematic parameters
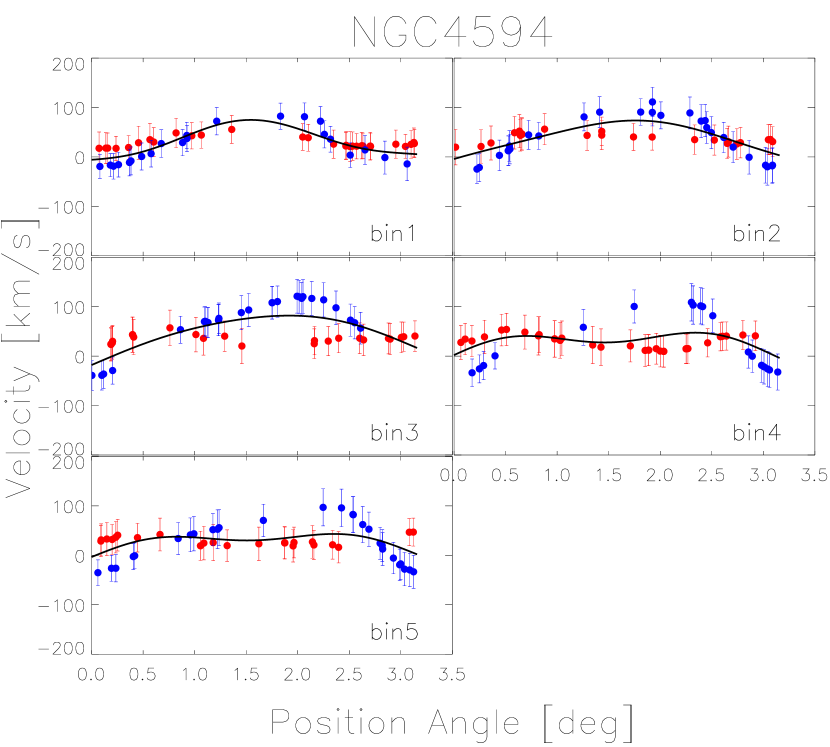
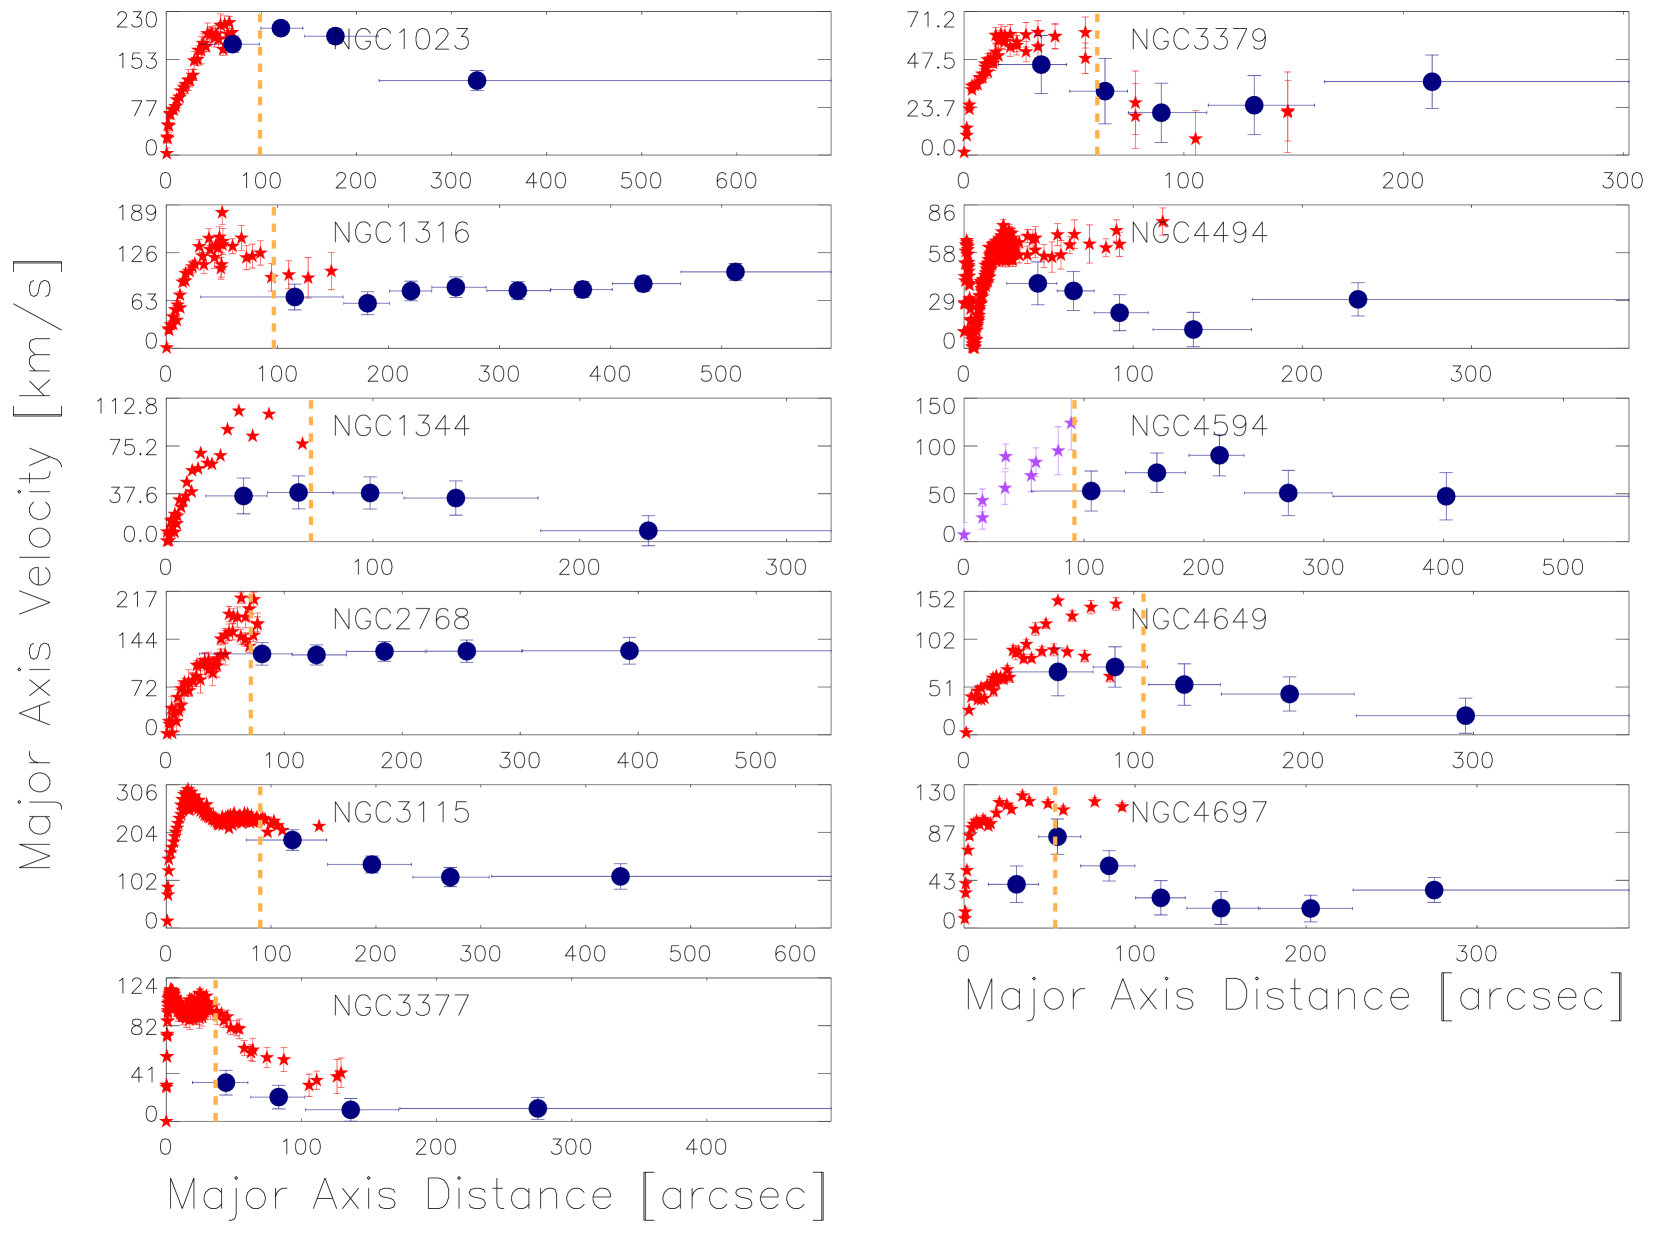
We quantify the properties of the reconstructed mean velocity fields by evaluating the amplitude of rotation , the variation of the with radius, and the possible misalignments with . Therefore we model the velocities in each elliptical bin as a function of the angle (positive angles are from North to East, with the zero at North) with the rotation model in equation (10), as described in section 3.2.
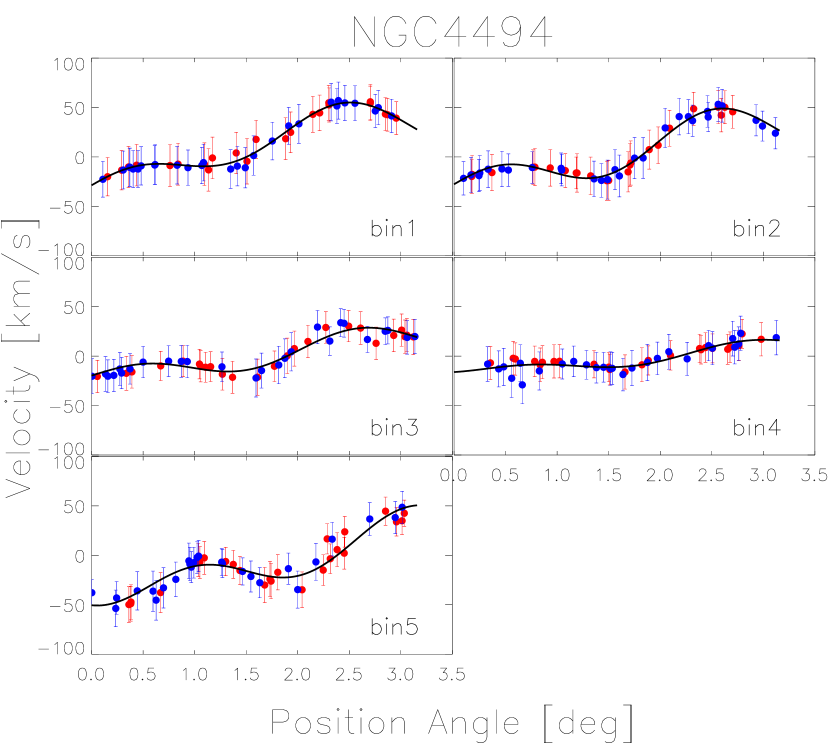
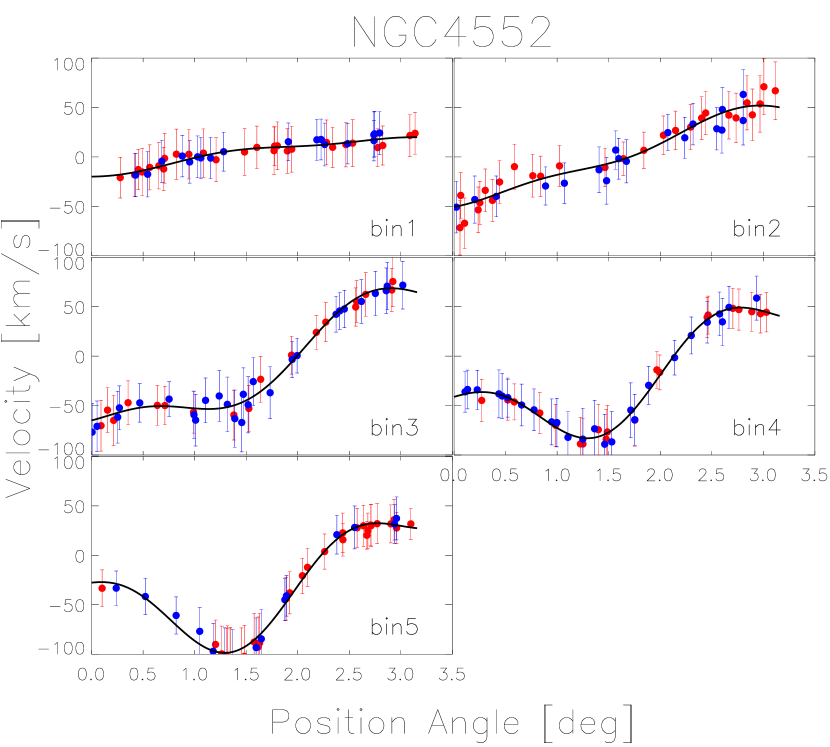
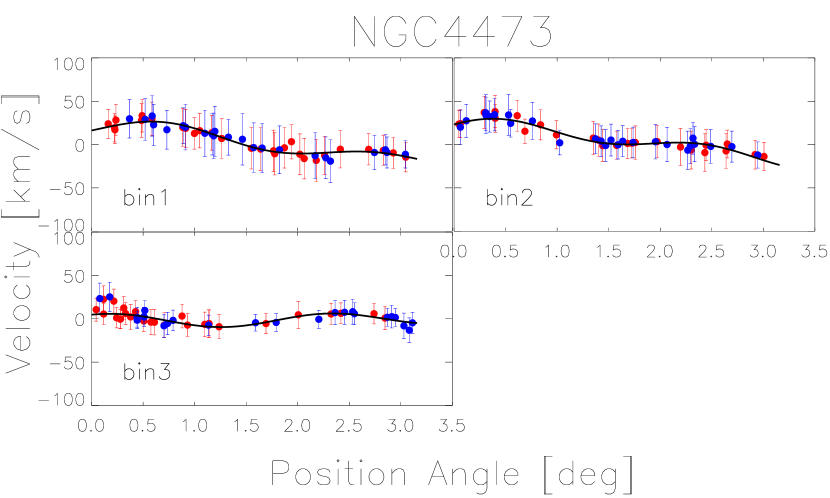
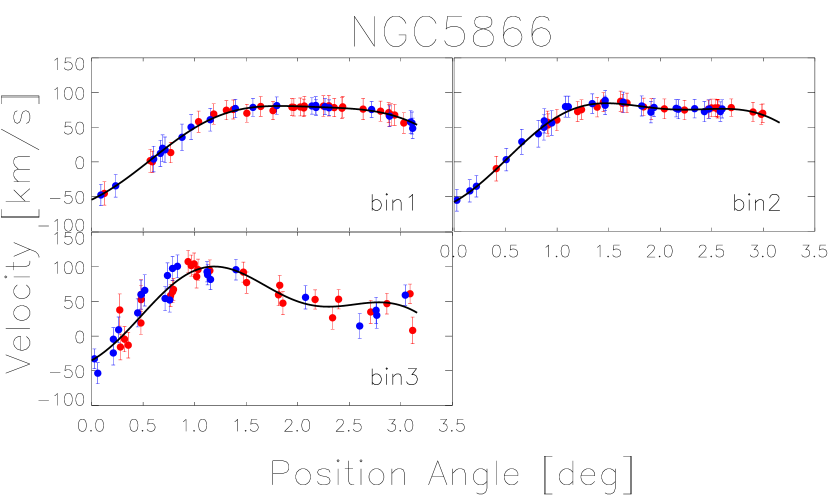
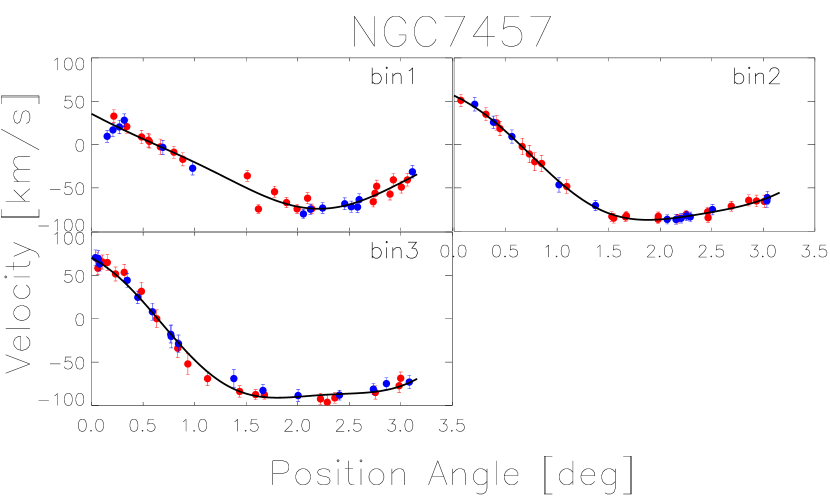
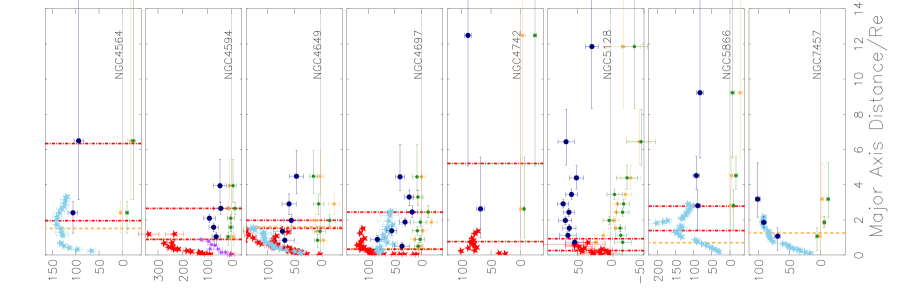
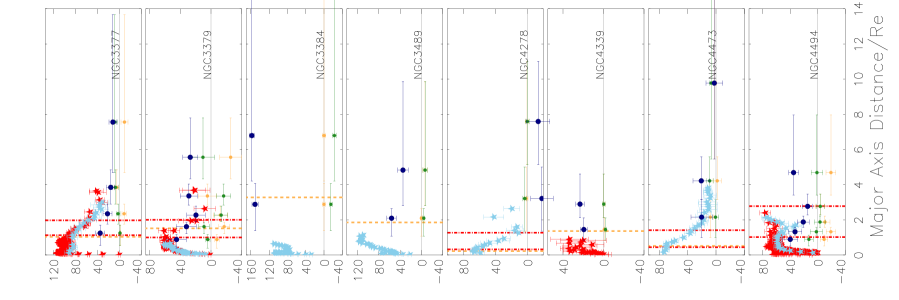
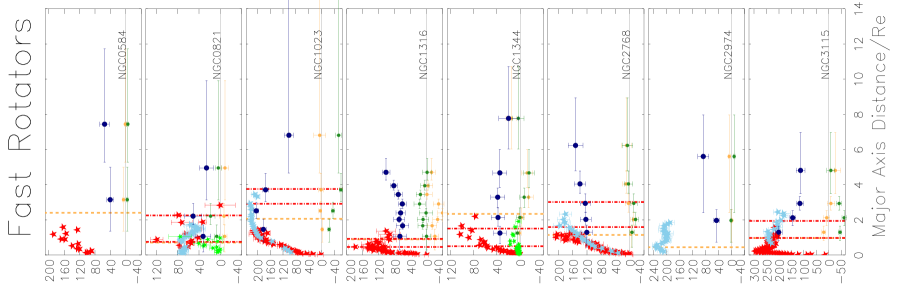
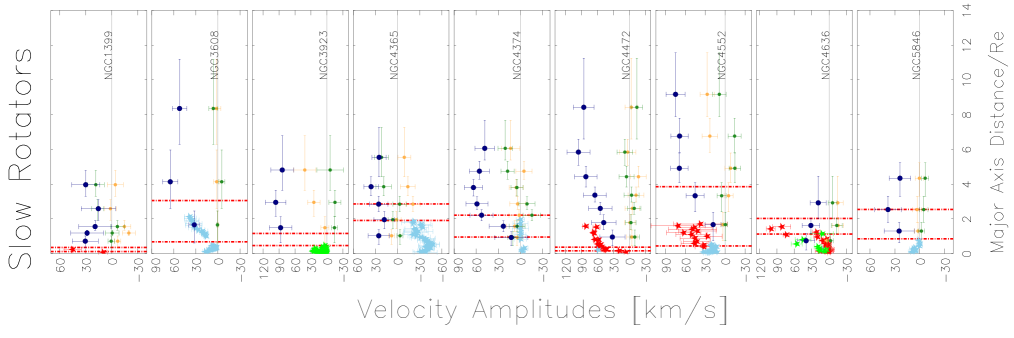
Figure 4 shows the smoothed velocity field in each elliptical radial bin for a subsample of galaxies: a SR, NGC 4552, and four FRs, NGC 4473, NGC 4494, NGC 5866 and NGC 7457. The solid lines are the rotation models that give the best fit to the data, and from which we derive the kinematic parameters. The errors on the fitted parameters are derived from Monte Carlo simulations as described in section 3.2.2, and depend on the number of tracers and the ratio . In the case of the galaxies show in figure 4, they are largest for NGC 4473, which has very low rotation in the halo, and smallest for the lenticular galaxy NGC 7457, which is dominated by rotation up to large radii.
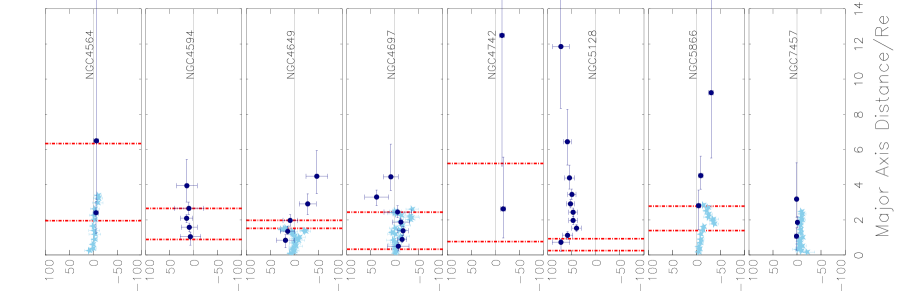
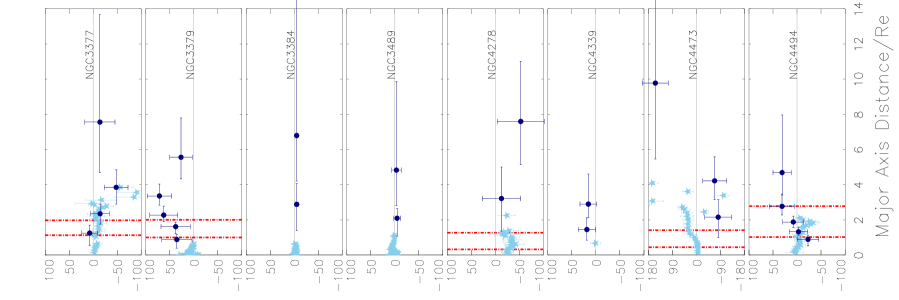
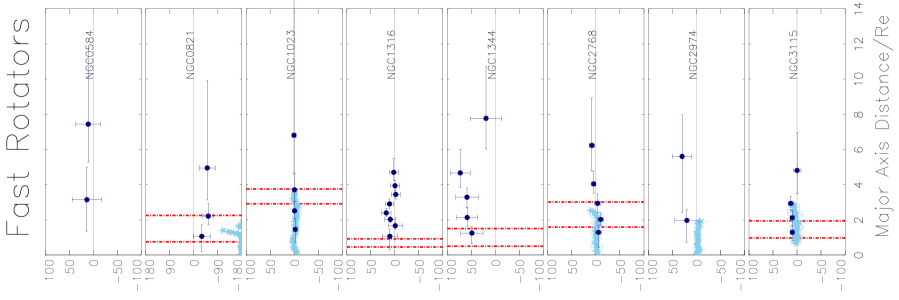
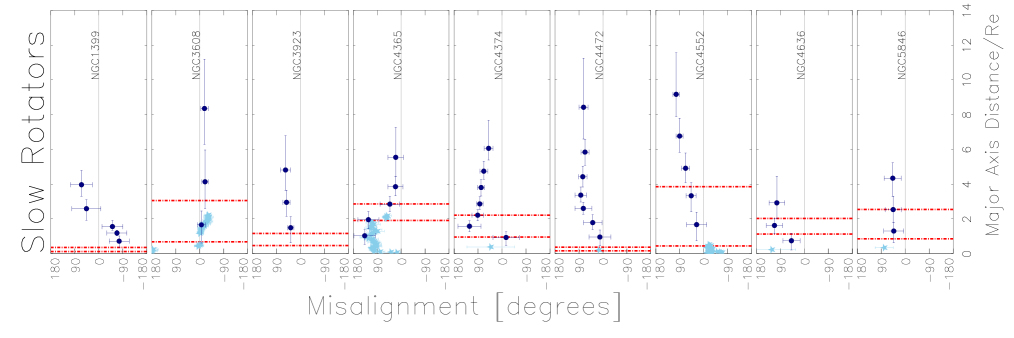
We divided the sample of ETGs into FRs and SRs according to the definition of Emsellem et al. (2011), see table 2. In figure 5 we show separately for both families the fitted parameters , and , as functions of the major axis distance in units of . This is a reasonable choice in case of flattened systems rotating along the photometric major axis. In case of misalignment or twist of the , does not correspond to the position of the peak in but to the major axis of the elliptical bin in which the amplitude is calculated. Figure 6 shows the misalignment of with respect to , . If the difference (where is the value measured in the first radial bin), is greater than 90 degrees, we define as . Since is a constant value for each galaxy, a variation of with radius corresponds to a variation of . We do not use the definition of Franx et al. (1991), , as it does not allow the description of large position angle twists. The values and the references for the used are in table 2.
Both and are compared with literature values in figures 5 and 6. When available, we show the profiles from the kinemetric analysis of Foster et al. (2016) on the SLUGGS+ data, or the kinemetric profiles from Krajnović et al. (2008). In these cases we rescale the radii of the profiles to major axis distances using the flattening given by Foster et al. (2016), or given by Krajnović et al. (2008). For the other galaxies we plot the corresponding quantities from the kinemetry of Krajnović et al. (2011, namely and from their table D1), or the kinematic profiles from long slit spectroscopy similarly rescaled (references in table 2). While comparing with the literature, it is important to note the following effect. A kinematic measurement from a slit along the major axis of an edge-on fast rotating galaxy will give high velocities and low dispersions. On the other hand, the PN velocity fields are the results of a smoothing procedure, which averages together PNe belonging to the very flat disk with PN belonging to the spheroid. This might result in a systematically lower rotation and higher velocity dispersion (see equation 2) in the PN velocity fields. A disk/spheroid decomposition of the PNe in some ETGs has already been performed by Cortesi et al. (2013b), and it is beyond the scope of this paper to extend this to all FRs. In addition, if the number of tracers or the ratio is low, our kinematic analysis provides a lower limit for the rotation velocity and an upper limit for the velocity dispersion. This issue is addressed in appendix A. In such cases, the kinematics traced by the PNe may show systematic differences from that in the integrated light as consequence of the discrete spatial sampling of the velocity field by the adopted tracers.
The higher order harmonics amplitudes and differ from zero whenever the smoothed velocity field deviates from simple disk-like rotation, i.e. if it is cylindrical (see for example the case of NGC 3115), or in correspondence to components rotating at different position angles (e.g. NGC 4649).
Misalignments and twists of the are typically displayed by triaxial galaxies, see section 6.4. Figure 6 shows that both FRs and SRs can have radial variations of the or a constant non-negligible . These galaxies may have a triaxial halo. A few galaxies instead have kinematically decoupled halos with respect to the regions . Section 6.4 validates these results for each galaxy using models.
The asymmetric galaxies (i.e. NGC 1316, NGC 2768, NGC 4472, NGC 4594, and NGC 5128) are, by construction, not well represented by the point symmetric model and increasing the number of harmonics does not improve the quality of the fit. We can however still use the fitted parameters to obtain an approximate description of the shape of their velocity field.
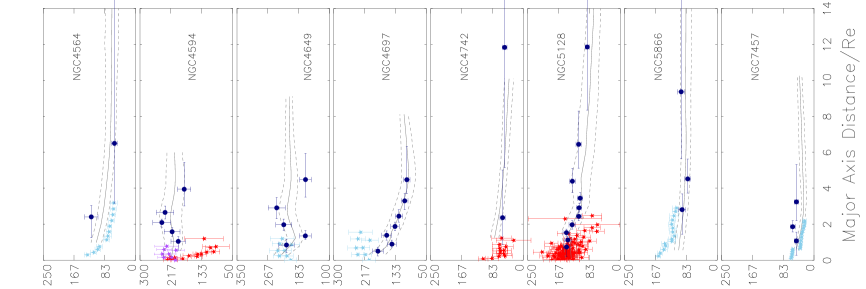
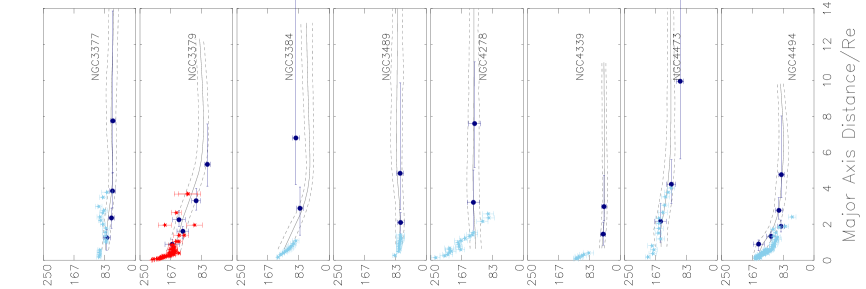
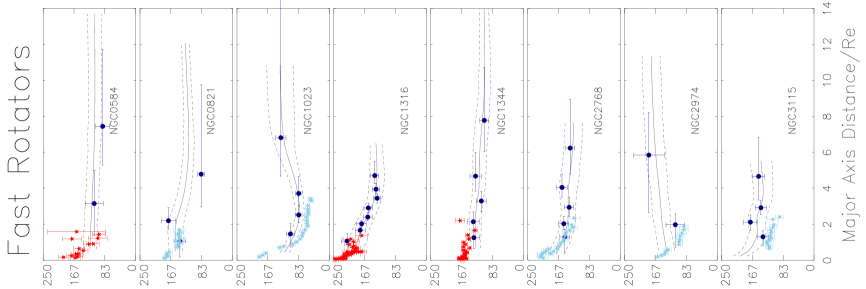
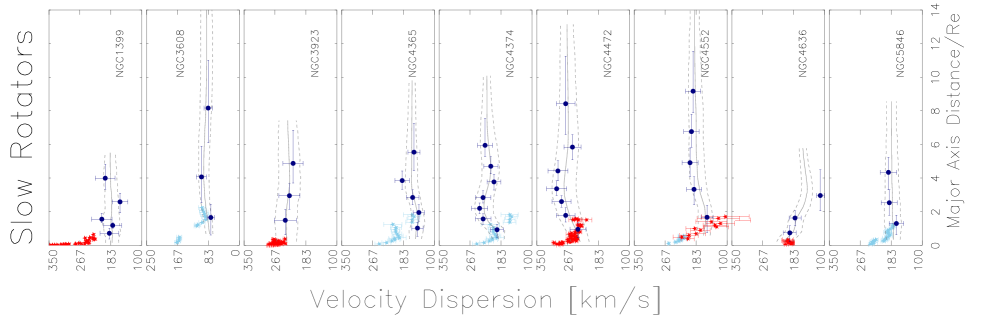
6.3 Velocity dispersion profiles
Figure 7 shows the velocity dispersion profiles, azimuthally averaged in radial bins. These have been calculated using two different methods. In the first we used the interpolated velocity dispersion field in elliptical annuli of growing radius, with position angle and ellipticity as in table 2. The values shown in the plots (solid lines) are averages over each elliptical annulus, and the errors (dotted lines) are taken conservatively as the means of the Monte Carlo simulated errors in the elliptical annulus (section 3.2.2). The second method is binning the measured radial velocities of the PNe in the radial bins built as described in section 3.2. The PN catalogs are folded by point symmetry and the dispersion with respect to the weighted mean velocity is computed in each bin. The weights are computed from the measurement errors. The errors on the dispersion are given by the expression: , where is the number of PNe in each bin. The values and the trends given by the two methods are generally in good agreement.
The profiles obtained are compared with dispersion profiles from integrated light (red stars). For the galaxies in common with the SLUGGS survey, we show the profiles from the kinemetric analysis of Foster et al. (2016) on the SLUGGS+ data in elliptical radial bins. For NGC 3384, NGC 3489, NGC 4339, NGC 4552, and NGC 4636, we extracted the azimuthally averaged profiles from the data (Cappellari et al. 2011; Emsellem et al. 2011) in elliptical bins (geometry in table 2). For the other galaxies we show the velocity dispersion along the from long slit spectroscopy (references in table 2).
Our dispersion profiles generally compare well with the literature in the regions of overlap (typically ). The results are described in section 7, separately for FRs and SRs.
We tested whether it is possible that the large scale trends in the velocity dispersion profiles are the result of statistical and smoothing effects, by using 100 models of the galaxies, built as described in appendix A.3, created with a constant dispersion profile with radius. The velocity dispersion profiles are recovered with the same procedure as for the measured PN sample. We find that although artificial local structures may sometimes appear in the velocity dispersion maps, they are not such as to influence the trends with radius of the large scale velocity dispersion fields, and typically the error bars from Monte Carlo simulations give a good estimate of the uncertainties.
6.4 Triaxiality
Significant twists of the , as well as its departures from imply an intrinsic triaxial shape for the system. In an axisymmetric object both the projected photometric minor axis and the intrinsic angular momentum are aligned with the symmetry axis of the system, while in a triaxial galaxy the rotation axis can be in any direction in the plane containing both the short and long axis. This is because in a triaxial potential the main families of stable circulating orbits are tube orbits which loop around the minor (z-tube orbits) or the major axis (x-tube orbits) (see e.g. de Zeeuw 1985; Statler 1987; Schwarzschild 1993). The relative number of z- and x-tube orbits determines the direction of the intrinsic angular momentum. Thus, depending on the variation of this ratio with radius we can have that
Therefore we consider as triaxial galaxies the objects displaying at least one of these features in their velocity fields with statistical significance. We do not consider in this analysis galaxies that show significant variation of the kinematic position angle in the last radial bin only, as the geometrical shape of the survey area might prevent an azimuthally complete detection of PNe in the outermost bin. The statistical significance is determined by our MC modeling as described in appendix A.3, which gives us the probability that a measured property of the smoothed velocity field is obtained in sequences of galaxy-specific simulated PN data sets without this feature. Table 8 provides a summary of the results, which are discussed in the following sections.
6.4.1 Galaxies with radial variation in the kinematic position angle
Figure 6 shows that the fitted may show a smooth variation with radius. This happens in NGC 3377, NGC 3379, NGC 4494, NGC 4697, NGC 4649, NGC 5128, and NGC 5866, among the FRs, and in NGC 3608, NGC 4472, and NGC 4552 among the SRs.
We tested whether the variation with radius of the for a galaxy is an artifact of the combination of a small number of tracers and the smoothing procedure. We looked at the fitted in 100 models of each galaxy, built as described in appendix A.3, which have by construction the of the mean velocity field aligned with . For each radial bin we computed the probability of obtaining the observed misalignment from the distribution of the misalignments in the models. We found that the probability of observing a twist of degrees in models of NGC 3377 is ; it is for the twist of degrees in NGC 3379, for the twist of degrees in NGC 3608, and for the twist degrees in NGC 4494. For the other galaxies, none of the 100 models produces the observed trends of .
For NGC 4472 the determination of is influenced by the kinematics of the in-falling satellite UGC 7636. An inspection of its smoothed velocity field suggests that the main body of the galaxy has approximately major axis rotation, once the PNe of the satellite are excluded. Nevertheless we include this galaxy in the sample of potentially triaxial galaxies, and we refer to Hartke et al. (2018) for a more detailed study.
NGC 5128 shows non point-symmetric kinematics, and rotation along both the photometric major and minor axes. The high number of tracers available for this galaxy (1222 PNe) makes this kinematic signature unambiguous.
NGC 1316 shows a small but significant jump of the at arcsec, that is related to the perturbed kinematics of this galaxy.
NGC 4697 has a constant profile consistent with the , with a sudden localized variation at . The study of Sambhus et al. (2006) on the same PN dataset showed evidence for a secondary PN population in this galaxy that is not in dynamical equilibrium with the main population, and which has not been excluded in this analysis. The presence of this population does not determine any significant deviation from point symmetry of its smoothed velocity field. However we refrain to include this galaxy in the sample of galaxies with triaxial halo.
Therefore, excluding NGC 1316 and NGC 4697 that have local and irregular variations of , there are 9 galaxies in the sample showing significant kinematic twist, of which 6 are FRs and 3 SRs.
6.4.2 Galaxies with kinematically decoupled halos
Galaxies with kinematically decoupled halos are galaxies whose outskirts rotate about a different direction than their inner regions, hence shows a step function with radius. NGC 1399 and NGC 4365 both show this feature beyond .
NGC 1399 is found to be slowly rotating around its (i.e. degrees) at km s-1inside 1, in very good agreement with the integral field spectroscopic data of Scott et al. (2014).
The halo , by contrast, is almost aligned with the (i.e. ) degrees. We studied whether such a misalignment is an artifact of our procedure, using models that mimic the inner kinematics, i.e. with aligned with the photometric minor axis . The probability of measuring a misalignment of the halo similar to the observed one is .
The of NGC 4365 is ill-constrained in the innermost regions where the kinematics is compatible with no rotation. At the center we do not recover the rolling about the minor axis visible in velocity fields from absorption line data (Emsellem et al. 2011; Arnold et al. 2014), because of smoothing over the inner velocity gradients. In these regions the bright background of the galaxy hampers the detection of PNe, and the resulting low number of tracers combined with the low leads to heavily smoothed velocities. We do detect a significant outer () rotation of km s-1along ( degrees), misaligned with respect to the inner kinematics reported in the literature. So we built mock models as described in appendix A.3 but with given by IFS data up to 1 (references are given in table 2). We found that none of the models displays the observed step function in the values.
We therefore conclude that the signature of a kinematically decoupled halo has a high probability to be real in both galaxies.
6.4.3 Galaxies with constant offset between photometric and kinematic major axis
The galaxies showing an approximately constant misalignment of the with respect to the are NGC 0821, NGC 1344, NGC 3115, NGC 4473, and NGC 4742 among the FRs, and NGC 3923, NGC 4374, NGC 4636, and NGC 5846 among the SRs (see figure 6).
In these cases we can define the using all the PNe, without radial binning. The derived quantities can be compared to the measured in mock models built as described in appendix A.3.
For most of the listed galaxies none of the models reproduces the observed misalignments. NGC 0821 has a misalignment of degrees with probability in the Monte Carlo models, while the misalignment of degrees of NGC 4742 has probability. Because of the small number of tracers and the low ratio this probability is higher for NGC 5846 ().
To these objects we add NGC 4473 whose is not well determined from the PN kinematics because of the very low ratio in its halo, but Foster et al. (2013) already detected a significant rotation along the minor axis using absorption line data, showing this object to be triaxial.
The PN velocity field of NGC 3115 shows a constant misalignment of degrees with respect to . This misalignment is probably related to perturbations at the interface between the disk and the spheroid, visible as deviations from axisymmetry in the photometry of the disk component (Capaccioli et al. 1987, see also discussion in appendix C). NGC 3115 is a complicated case, and is not included in the sample of galaxies with triaxial halo.
Therefore in the ePN.S sample a total of 8 galaxies, 4 FRs and 4 SRs, show a significant constant misalignment of with .
6.4.4 Summary
We conclude that a total of 19 galaxies (%) of the ePN.S sample show smoothed velocity fields that reveal their non-axisymmetric nature. 9 objects (6 FRs and 3 SRs) have significant kinematic twists, and 8 (4 FRs and 4 SRs) show a significant constant misalignment of with . In addition two SRs have a kinematically decoupled halo.
The observed features are more than 2 sigma significant for most of the cases (1.7 sigma for NGC 5846), and they are not effects of the folding operation on the catalogs nor of the smoothing procedure.
All in all, we found that all the SRs and 10 out of 24 FRs show indications of intrinsic triaxial morphology in the PN kinematics. We will discuss the signature of triaxiality in the photometry in section 8.4.
7 Results per family
7.1 Slow rotators
In the sample of 33 galaxies 9 are SRs. Figure 5 shows that they typically display some more pronounced rotation at large radii when compared to rotation in their central regions as measured from absorption line spectroscopy. The PN velocity fields show gently increasing profiles for the amplitude which, eventually, flatten around km s-1. Twists or misalignments of the are commonly observed, so that all the SRs show signatures of a triaxial halo (see figure 6). In particular, we found that the halos of NGC 1399 and NGC 4365 are kinematically decoupled with respect to the innermost regions as mapped by Scott et al. (2014) and Arnold et al. (2014). NGC 4472 has a non point-symmetric velocity field, as a result of a recent accretion event. The complicated kinematics of the SRs is also reflected in the amplitudes of the third order harmonics, which describe the presence of additional kinematic components, and twists of the .
The velocity dispersion profiles, shown in figure 7, are generally flat in the halo. Some galaxies (e.g. NGC 1399, NGC 3608) reach such a constant value around . Others (e.g. NGC 4374, NGC 4552) flatten only beyond , after a small increase. NGC 4636 is the only SR showing a falling profile.
7.2 Fast rotators
In the ePN.S sample 24 galaxies are classified as FRs (table 8). Figures 5 and 6 show that the majority of the objects have regular rotation along the photometric major axis. The comparison between inner and outer parts reveals that the rotation amplitudes show declining trends with more or less steep gradients for 14 out of 24 FRs: some galaxies show very small or no rotation in the outskirts (e.g. NGC 4278 and NGC 4473), while others reach a minimum, after which their rotation increases (e.g. NGC 4494 or NGC 4697). Among the remaining galaxies, 3 have fairly constant profiles (NGC 2768, NGC 4564, and NGC 5866), and 3 show increasing rotation (NGC 3384, NGC 4742, and NGC 7457). For NGC 0584, NGC 2974, NGC 3489 and NGC 4339, the limited number of tracers leads to heavy smoothing, allowing only an estimate of a lower limit for the rotation in the halo.
The is well aligned with the photometric major axis in the majority of cases, but 10 out of 24 galaxies display a kinematic twist (NGC 3377, NGC 3379, NGC 4494, NGC 4649, NGC 5128, and NGC 5866) or a constant misalignment with (i.e. NGC 0821, NGC 1344, NGC 4473, and NGC 4742). The smoothed velocity fields of four galaxies (NGC 3379, NGC 4649, NGC 5128, and NGC 4494, see figures in appendix D) show indications of additional components rotating along the minor axis of the system, while NGC 1344 has prolate rotation. All these features are generally interpreted as evidences of triaxiality of the systems (see section 6.4) and of the fast rotating galaxies of the sample display them in the halo.
The azimuthally averaged velocity dispersion profiles (figure 7) are found to be either constant (e.g. NGC 3377), or decreasing with radius. Some profiles decline gently (e.g. NGC 1344), while others decrease steeply in the halo (e.g. NGC 3379). This diversity between flat and falling profiles is also reflected in the variety of the profiles, as already observed by Coccato et al. (2009), and is the result of differences in the mass distributions (Gerhard et al. 2001; Romanowsky et al. 2003; Deason et al. 2012; Morganti et al. 2013; Cappellari et al. 2015; Alabi et al. 2016; Veale et al. 2018) or the presence of radial anisotropy in the orbits (Gerhard et al. 1998; de Lorenzi et al. 2009; Napolitano et al. 2009), which may contribute to a lower projected velocity dispersion. For some lenticular galaxies (e.g. NGC 1023 or NGC 3115), the two-dimensional velocity dispersion maps (see figures in appendix D) reveal the presence of the colder disk along its major axis, while the dispersion is higher along the minor axes. For NGC 1023 the presence of the disk is evident also in the azimuthally averaged velocity dispersion profile, which increases with radius as the contribution of the disk to the light decreases.
Among the fast rotating galaxies there are two mergers, NGC 1316 and NGC 5128, whose velocity fields are highly disturbed by the recent accretion events and are not very well described by point-symmetric rotation models (see appendix C for more details).
The comparison of the PN kinematics with integrated light data shows a general good agreement in the overlapping regions, confirming once again that the PNe are reliable tracers of the kinematics of the parent stellar population. The tension with the stellar kinematics in cases of high rotation and low dispersion (see e.g. NGC 1023, NGC 2768, NGC 4594) is primarily related to the presence of a known near edge-on very flat disk that dominates the major axis stellar kinematics but not that of the PNe. Because our velocity fields are the results of an averaging operation that does not distinguish the PNe from the disk from those belonging to the spheroid, the velocity gradients are underestimated. Likewise the discrepancy between the integrated light data of NGC 4494 and its PNe could be explained by a face on disk fading into the spheroid at radii beyond the coverage of the stellar kinematics, combined with the lower spatial resolution of the PN smoothed velocity field.
In addition, if the disk is obscured by dust, the fraction of observed disk PNe is reduced, causing a drop in the measured rotation and a higher dispersion. An example is the case of NGC 4594. This galaxy has a dusty disk which affects the detections of PNe in that region, leading to heavily absorbed light in this component and hence inhibit the PNe detections in that region where the rotation is highest. The rotational velocity and the dispersion profiles from PNe agree well with slit data along a direction slightly offset ( arcsec) from the disk plane (purple stars in figures 5, 7 and 8), but are offset with respect to the major axis profiles. With this in mind, we shall consider the smoothed velocity fields as giving a global description of the halo kinematics, but not of their small-scale spatial structures, unless the number of tracers is very large (as, for example, in the case of NGC 1316).
7.2.1 Embedded disks in fast rotators
The observed negative gradients of observed for many FRs at large radii has been interpreted as signatures of a rotating disk component embedded in a dispersion dominated spheroid (Coccato et al. 2009; Arnold et al. 2014). Using a photometric disk-spheroid decomposition and maximum-likelihood fit, Cortesi et al. (2013b) reconstructed the kinematics of the disk and the spheroid separately in 6 of the ePN.S lenticular galaxies (NGC 1023, NGC 2768, NGC 3115, NGC 3384, NGC 3489 and NGC 7457). Arnold et al. (2014) reproduced the rotation profile of the E5-6 galaxy NGC 3377 also performing a disk-bulge decomposition. These works showed that the variation in rotation reflects the transition between disk and bulge dominance in light, and their different spatial contribution in each galaxy explains the variety in the observed profiles (the detailed study of the profiles for the ePN.S sample is the subject of a separate paper, Coccato et al. in prep.). In the following we use the term ”disk component” for a highly flattened, but definitely three-dimensional, oblate rotating structure (see also section 8.4).
Here we can verify the interpretation for the negative gradients of by estimating and comparing the ”size” of the disk components given by the photometry, and the radius at which we observe the decrease in rotation. Figure 8 shows a subsample of the galaxies with the highest number of tracers, in order to have the best possible statistics. Most of them show a decreasing rotation amplitude. We fitted their radially binned smoothed velocity fields with a cosine, whose position angle is aligned with the photometric major axis
| (12) |
in order to extract the velocity profiles along the major axis. The fitted amplitudes are shown in figure 8. Overlaid in red is the stellar kinematics along the photometric major axis from literature slit data (references in table 2). The orange vertical lines indicate the characteristic scale of the disks. For all the galaxies shown, the quantity plotted is the disk half light radius: . is the disk scale length from an exponential fit of the disk component ( from Burkhead 1986; Scorza et al. 1998; Pignatelli 1999; Laurikainen et al. 2010; Beletsky et al. 2011; Krajnović et al. 2013; Cortesi et al. 2013b, for figures 5 and 8).
We can see that the radial distance at which the decrease in the rotation occurs is consistent with the size of the disk. Therefore we interpret this behavior as the transition between a flat component that rotates fast and a dispersion dominated rounder spheroid. For NGC 4494 there is no photometric evidence for a disk component. In this case the stellar disk component might be absent or very faint if the galaxy is seen nearly face on ( for NGC 4494). In the other FRs that are not shown in figure 8, but displaying a drop in the amplitude of rotation, the comparison between slow rotating PN system and rapid rotation in the absorption line kinematics, suggests similar transition at smaller radii.
Figure 5 shows that the three galaxies with approximately constant profiles (NGC 2768, NGC 4564, and NGC 5866) do actually show a small decrease in rotation in correspondence to , when compared with the values from absorption line spectroscopy. At larger radii their fast-rotating spheroidal halo (NGC 2768, Cortesi et al. 2013b), or alternatively an unidentified outer disk component, dominates the kinematics. Among the remaining three galaxies in figure 5 with increasing profiles, two of them (NGC 3384 and NGC 7457) have an extended disk component, to which most of the PNe belong (Cortesi et al. 2013b). NGC 4742, by contrast, does not have any photometric evidence for a disk component, hence the high rotation at large radii is likely associated with the spheroid.
7.3 Summary
Our results show that the kinematics of ETGs at large radii can be substantially different from that in the inner regions. For the SRs we observe a growth in the amplitude of rotation. For the FRs, this variation in the kinematics manifests as a decrease in the amplitude of rotation or a twist in the . We interpreted this behavior as the transition from the inner disk component into the spheroidal halo, which is dispersion dominated and might deviate from axisymmetry.
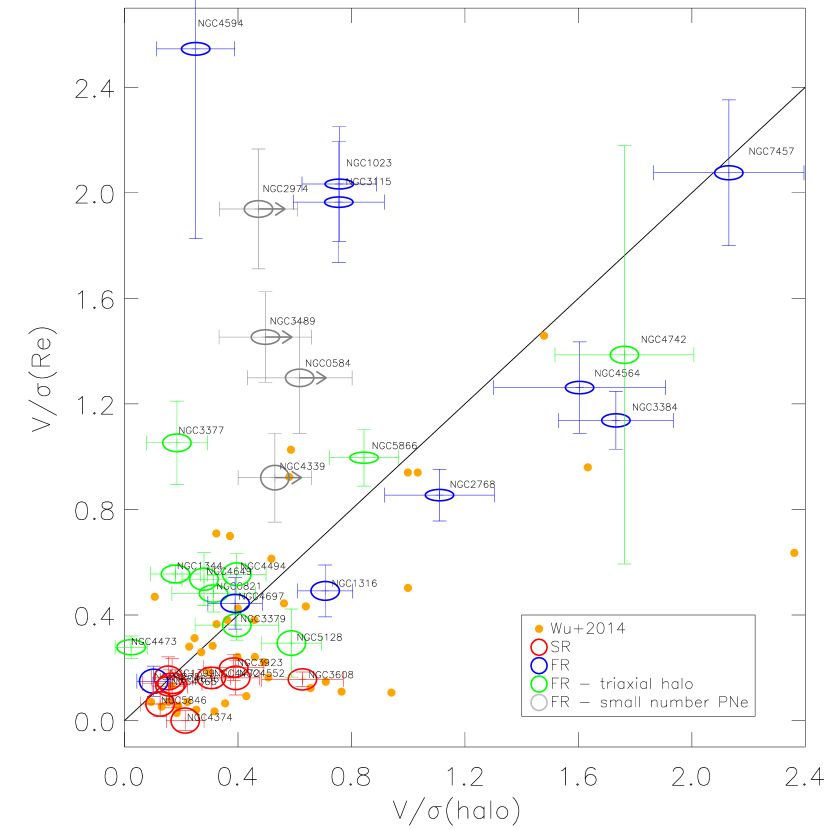
Figure 9 illustrates this conclusion by comparing the ratio in the halo and in the inner regions (at 1). The values are derived by interpolating the and profiles from integrated light (shown in figures 5 and 7, see references in table 2) at , while is the ratio of and estimated in the outermost radial bin of the PN velocity fields (see table 2 for the outermost mean radius ).
All the SRs fall below the 1:1 line, showing higher rotational support at large radii. The spread of the FRs in the diagram reflects their different intrinsic structure and kinematics. The halos of most FRs have ratio similar to the of SRs. Among these the scatter in is probably driven by the presence of a more or less prominent disk component seen at different inclinations, and embedded into the dispersion-dominated spheroid. The flattening of the ellipses in figure 9, in fact, shows that galaxies with higher also display higher .
A second group of FRs with high rotational support in the halo populate the diagram on the right of the 1:1 line. These galaxies are either dominated by disk rotation at all radii (NGC 3384 and NGC 7457), or have a rapidly rotating spheroid (NGC 2768, Cortesi et al. 2013b), or either of these (NGC 4564, NGC 4742).
The FRs with triaxial halos typically show equal values of and , spanning all values in . It is possible that the group of galaxies near the 1:1 line but without signature of triaxiality in the current data could show such signatures with higher resolution in the kinematics. Therefore we cannot presently determine whether these last two subset of FRs are different or not.
The orange full circles in the plot show the inner-halo kinematics from Wu et al. (2014), who studied the kinematics of ETGs in cosmological zoom simulations (Oser et al. 2010; Naab et al. 2014) out to . Their and were divided by a factor 0.57 to rescale their two dimensional flux-weighted measurements to one-dimensional quantities (Cappellari et al. 2007). The comparison with the observations shows that these simulations do not adequately reproduce the observed properties of fast rotating galaxies, which span a much wider spectrum of kinematic properties at large radii.
8 Discussion
8.1 Halo rotation versus central rotation
The PN velocity fields show that ETGs may have very different kinematics at large radii compared to their inner regions. We found that SRs typically increase their rotation in the halo, while most of the FRs display a decrease of towards large radii.
The observed variety of radial trends for the rotation amplitudes is consistent with the different shapes of the parameter profiles observed in the smaller sample of Coccato et al. (2009), and confirmed by Arnold et al. (2014) and Foster et al. (2016). The study of the profiles for the current sample of galaxies is the subject of a future paper (Coccato et al. in prep.).
The existence of these radial trends was recently questioned by Raskutti et al. (2014) and Boardman et al. (2017), who found no evidence for a change in their stellar kinematics beyond . The divergence from our results may arise from the different radial coverage; their kinematics does not reach to the distances where the drop in rotation typically occurs, beyond . An example is the lenticular galaxy NGC 1023, in common between the two samples. For this galaxy Boardman et al. (2017) report a rising profile to almost 2, in agreement with our observation of a decrease in rotation only beyond .
The onset of rotation of the SRs at larger radii, often along directions that do not coincide with the major axis of the galaxy, may trace the accreted stellar component, which maintains a memory of the orbital angular momentum of the accreted progenitors.
8.2 Fast rotators with disks embedded in slowly rotating halos
The sharp drop in angular momentum in some FRs has been interpreted as the fading of an embedded disk structure of in-situ stars in a dispersion dominated spheroidal halo (Coccato et al. 2009; Arnold et al. 2014). We qualitatively verified this scenario in section 7.2.1, where we observed that the radius at which the rotation along the major axis drops is consistent with the half light radius of the inner disk component.
Our results suggest that FRs contain a more or less extended rotating disk component, embedded in a more or less prominent halo with its own kinematic signature. This is reflected in the distribution of these objects in the plane (figure 9). We found that while a smaller group of FRs shows high rotation also in the halo, the halos of most FRs have rotational support comparable to that of the halos of SRs. This result is corroborated by the observation that the ePN.S FRs tend to become rounder at large radii (see figure 10).
This variety of kinematic properties is consistent with the variety of physical processes that may drive the evolution of these objects (minor mergers, major mergers that lead to a spin-up of the remnant, gas accretion, interactions with the environment, secular evolution; Duc et al. 2011; Naab et al. 2014; Penoyre et al. 2017; Smethurst et al. 2018) while preserving a rotating disk structure at the center. The comparison of our observations with simulated data from Wu et al. (2014) in figure 9 indicates, however, that those simulations do not yet reproduce the full diversity in the variety of these processes.
8.3 Signatures of triaxial halos in the kinematics
In section 6.4 we studied the velocity fields and their kinematic position angle profiles , and linked the observed misalignments and twists with the triaxiality of the halos. SRs are known to be mildly triaxial in their central regions, while the FRs are predominantly oblate (Weijmans et al. 2014; Foster et al. 2017). Kinematic twists and misalignments for the FRs are rare and small in the central regions. By sampling the kinematics at more than twice the distances probed by previous studies, the PNe line-of-sight velocities show that these features become more frequent and pronounced in the outskirts. Based on these signatures, we classified the halos of 40% of the FR galaxies as triaxial, while the remaining ones are still consistent with being axisymmetric at the resolution of the ePN.S survey. For these objects the triaxiality of the halos is not ruled out.
On the other hand, it is in principle possible that axisymmetric galaxies with a recent merger might display kinematic twists and misalignments because of the contribution of the unrelaxed accreted component to the PN velocity field. However, if the size of the accreted satellite is such as to significantly contribute to the PN population of the the host halo, and so as to produce features in the PN velocity field, then the effect is short lived. This makes the probability of occurrence of such circumstance low. Deviations from a point-symmetric velocity field were found for 5/33 cases in section 5, probably due to recent accretion/mergers in four cases and due to dust in one case. These galaxies are not included in the triaxial classification.
An examination of the smoothed velocity fields in appendix D shows that for some galaxies the trends in with radius reflect a two-component velocity field in which rotation along one axis dominates at intermediate radii and rotation along the other axis dominates further out. This is the case for NGC 3379 and NGC 4649 among the FRs, and for NGC 4552 and NGC 4636 among the SRs. The velocity field of NGC 1344, instead, shows that this galaxy is a prolate rotator. Up to now there are not many observations of this phenomenon (Tsatsi et al. 2017, and references therein), which is probably related to a recent merger (Ebrová & Łokas 2017), as the shells of this galaxy attest. Our sample contains two other galaxies (NGC 3923 and NGC 4365) known to have prolate rotation at their centers, but their halos are decoupled with respect to the inner kinematics.
A previous study of the intrinsic shapes of ETG halos was performed by Foster et al. (2016) who, using the observed distribution of ellipticities and misalignments for the SLUGGS galaxies out to were unable to rule out triaxiality in the outskirts of FRs. The same authors had previously found strong evidence for minor axis rotation, hence a triaxial halo, in NGC 4473 (Foster et al. 2013). Viaene et al. (2018) recently observed a strong kinematic twist beyond 1.5 for the massive FR NGC 5626. The extended PN kinematics allow us to generalize this result to a significant fraction of the FRs.
8.4 Signatures of triaxial halos in extended photometry
If the kinematic twists seen in the PN velocity fields for a significant fraction of ETGs indeed indicate triaxial halos in these systems, one expects additional evidence for triaxiality to come from observations of isophotal twists (Carter 1978; Leach 1981). Hence in this section we compare with photometric data from the literature, We do not expect to see a one-to-one correspondence between variations of and variations of (see also Foster et al. 2016), as the former are driven by the total potential of the galaxy, including dark matter, while the latter trace variations of the distribution of the light alone.
The isophotes of ETGs are well-described by ellipses, with deviations from perfect elliptical shape typically at the level (e.g. Bender et al. 1988). Hence the constant luminosity surfaces of ETGs can be approximated by ellipsoids (for a review see Merritt 1992). The projection on the sky of a coaxial triaxial ellipsoidal distribution of stars can result in twisting isophotes only if their axial ratios varies with radius (Stark 1977; Benacchio & Galletta 1980). The effects of triaxiality on the profiles are model dependent (e.g. Benacchio & Galletta 1980; Franx 1988; Madejsky & Moellenhoff 1990). In general considerable twists ( degrees) can be produced by moderately triaxial models, but their relative frequency is low, , as the effects on the are small whenever the systems are viewed close enough to one of their principal planes, and the magnitude of the twists depends on how much the axial ratios change.
Figure 15 in appendix B shows extended ellipticity and profiles from the literature for both FRs and SRs, for three quarters of the ePN.S sample. We chose to consider only galaxies with photometric data reaching at least 4 . Twists of are observed for almost all the galaxies classified as triaxial in section 6.4, and for several other FRs with no evidence for triaxiality at the spatial sampling of the PN kinematics. It is evident, however, that the variation of measured for the FRs is modest ( degrees) in of the cases. Thus we verify whether the occurrence of small photometric twists is consistent with the presence of a triaxial halo. We do this by constructing illustrative, observationally motivated photometric models for triaxial FR galaxies, and comparing the statistical distribution of photometric twists in these models with that observed for the ePN.S sample of FR galaxies.
The models are built on the kinematic evidence found in the previous sections suggesting that centrally flat FRs are embedded in dispersion dominated spheroids, which can be triaxial. The intrinsic shape of the central regions of FRs were investigated by Weijmans et al. (2014, survey) and Foster et al. (2017, SAMI survey), who found that these galaxies are close to oblate ()444Here and are the intrinsic axis ratios, such that . with mean flattening . SRs are, instead, less flattened (), and mildly triaxial but, because of the small number of these galaxies in the and SAMI samples, their intrinsic shape distribution is not well constrained.
In our models, the central regions of the FRs have intrinsic shape in agreement with the previous results. In their halos, a significant fraction of the FRs has kinematics similar to the SRs (see figure 9). This is consistent with the expectation that the satellites accreted into the halo should be largely uncorrelated with the dynamics of the central galaxy. Thus for our first two halo models we assume outer halo axis ratios like those for the SRs, in which the accreted stars are expected to reach down to small radii (Cooper et al. 2013; Rodriguez-Gomez et al. 2016). This choice is supported by the evidence that the ellipticity profiles of FRs generally show decreasing trends at large radii (see figures 10 and 15 in appendix). However, some FRs in figure 9 rotate rapidly also in their halos; thus we also investigate triaxial halos with flatter isophotes. We parametrize the transition between inner and outer regions in different ways. The models are described in detail in appendix B.2. In summary we use:
-
•
Model 1: a single component with a Sérsic density distribution and variable flattening: and at the center, and in the outskirts. The transition between these regions happens at , where is the kinematic transition radius defined in section 8.6.
-
•
Model 2: a two-component model including a cored Sérsic halo with intrinsic constant flattening and plus an embedded spheroidal-exponential disk with flattening and . The scale length of the disk is taken to be such that , as qualitatively observed in section 7.2.1. Within the total luminosity of the disk in this model is times that of the halo.
-
•
Model 3: as Model 2, but with a maximally triaxial halo with , .
-
•
Model 4: as Model 2, but with strongly flattened, slightly prolate-triaxial halo with , .
Figure 10 shows the maximum photometric twist
and the mean projected ellipticity measured for the subsample of
the ePN.S FRs with extended photometry (references in
table 7; the profiles are shown in
appendix B.1).
The distribution of the
galaxies in this diagram is compared with the same quantities
from the four triaxial models, each observed at 100 random viewing
angles.
We find that:
1) the fraction of twists larger than 10 degrees is of order 30% (45% for Model 3). Large twists occur for viewing angles degrees for Models 1 and 2, and for degrees for Models 3 and 4 ( for face-on view).
2) The comparison of the model prediction of twist angles with the data
points for the ePN.S FRs in figure 10 shows that most of the model projections have low twists of the same magnitude as the majority (63%) of the galaxies. Within the statistical uncertainties, the models represent well the locations of the galaxies in figure 10: an average of the models are above the 10 degrees threshold.
From the models distribution galaxies with photometric twists larger than degrees and mean ellipticity would be expected but are not observed. The missing ePN.S FRs in that region of the diagram could be a result of small number statistics, observational bias for near face-on systems, or model details.
3) Since the photometric twists are thus expected to be small in most
galaxies, the most obvious signature of a change in the intrinsic
shape is the variation of the projected ellipticity with radius, as
shown in figure 16 in the appendix. The
change in ellipticity observed in the majority of the FRs
in figure 15 (see also appendix
B.1) independently suggests the fading of
the central disk component in a more spheroidal halo, as we
previously inferred from rotation profiles.
This analysis based on illustrative oblate-triaxial photometric models shows that the presence of small photometric twists, as observed for the majority of the ePN.S FRs, is consistent with the presence of a triaxial halo. I.e., it is likely that individual oblate-triaxial models for these galaxies can be constructed that are consistent with the measured photometric twist angles.
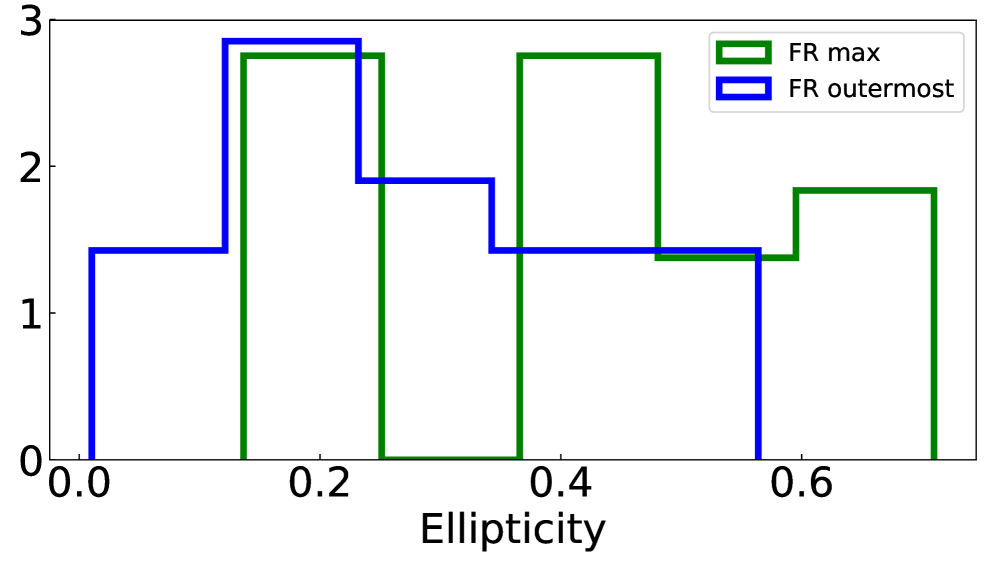
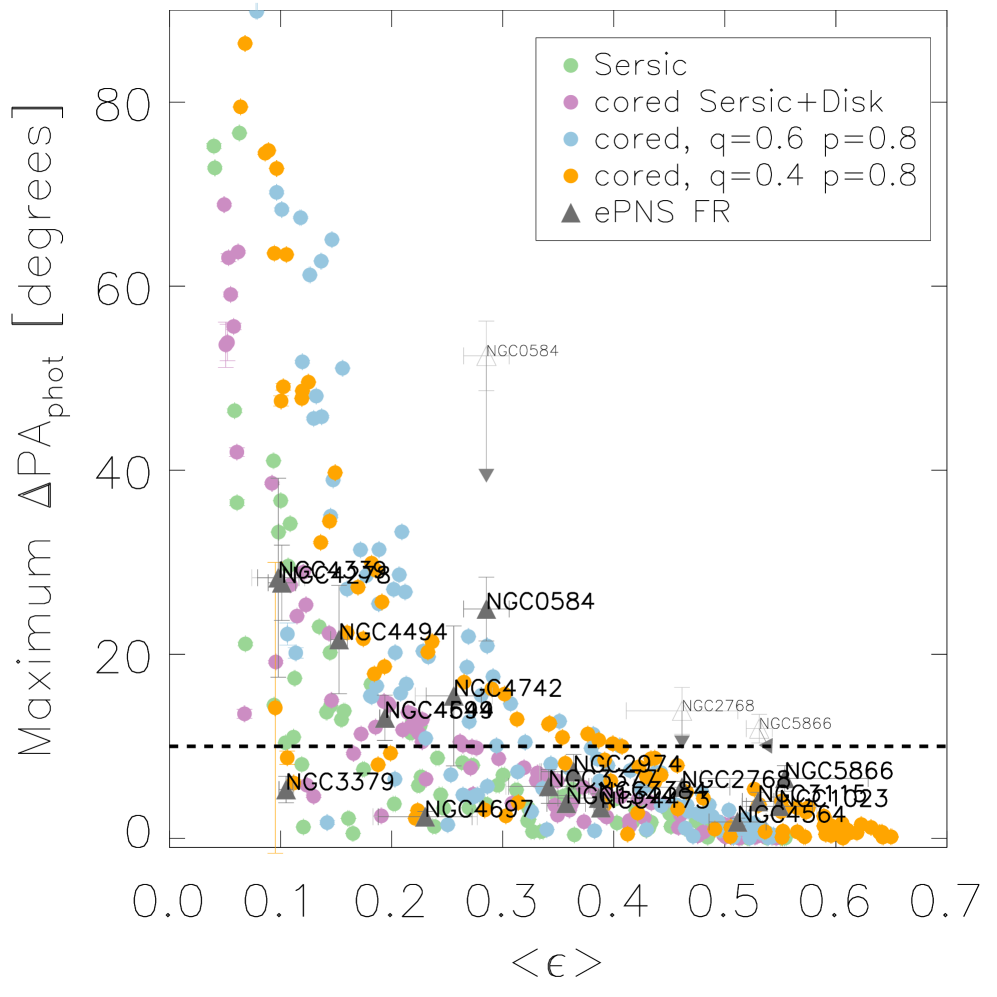
We infer that many of the ePN.S FRs show small photometric twists because of the highly flattened, oblate shape of their central regions and the gradual transition to a triaxial halo. The consequence is a near-alignment within degrees between the inner kinematics and outer photometry of most these galaxies, as analogously observed for most of the FRs (Krajnović et al. 2011; Fogarty et al. 2015, however, this numerical value also depends on sample selection effects, see the following section). Hence extended kinematic studies that sample the outer regions of these FRs are important to unveil the kinematic transition and thus the change of the intrinsic shape.
Both PN kinematics and photometry are therefore consistent with a picture in which FRs have a central disk component embedded in a spheroidal dispersion dominated component. We found this component to be triaxial for at least of the FRs in the ePN.S sample. The presence of photometric twists also for other FRs without evidence for a kinematic twist in the PN data, suggests that the fraction of galaxies with a triaxial halo might be higher. In the following sections we will see that the spheroidal component is most prominent in the most massive objects, and that the comparison with cosmological simulations suggests an ex-situ origin for it.
8.5 Comparison with the results of the ATLAS3D survey
The results discussed in the previous sections challenge a simple interpretation of the ATLAS3D survey results in terms of a dichotomy between disk FRs and triaxial SRs (see Cappellari 2016, for a review on the subject).
The ATLAS3D (A3D) survey carried out IFS and photometric observations of the central regions of a complete sample of 260 ETGs, morphologically selected from a volume-limited sample of galaxies brighter than (Cappellari et al. 2011). Their sample of ETGs spans luminosities and mostly contains lenticular galaxies, i.e. galaxies with T type : only of their ETGs are ellipticals (, Cappellari et al. 2011). The ePN.S sample is, on average, 1 mag more luminous in the K band (), and the majority of the galaxies () are ellipticals, according to their T type from HyperLeda (see Arnaboldi et al. in prep. for more details on the sample selection). The A3D IFS kinematics covers typically radii up to (Emsellem et al. 2011). The fraction of covered is actually a decreasing function of galaxy luminosity, as depends on (Cappellari et al. 2011), hence, for the ePN.S galaxies in common with the A3D sample, the mean radial coverage is . Finally if one considers that the values adopted for may underestimate the half light radii for the brightest objects (see discussion in section 8.6), this fraction is actually smaller: , where is defined in section 8.6.
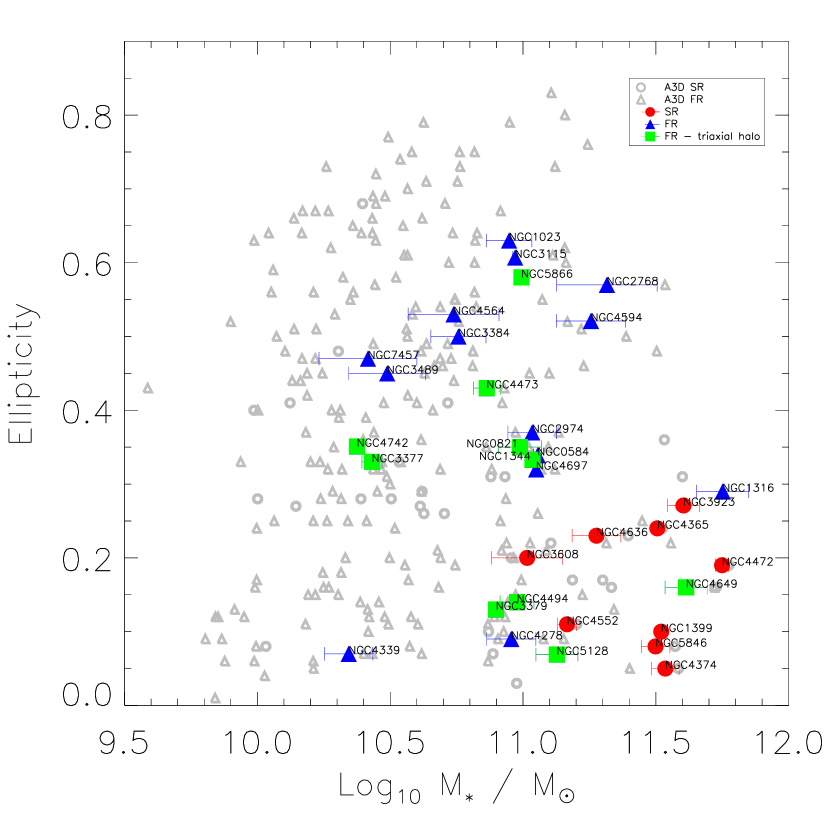
Figure 11 shows the stellar mass versus ellipticity plane for both samples. The ePN.S galaxies are on average more massive and less flattened than the A3D ETGs. In particular, the ePN.S FRs with triaxial halos are among the most massive A3D FRs. For these galaxies the PNe kinematics generally show fairly large twists of the , as the limited spatial resolution of the survey prevents the measurement of small differences in angle. In the ePN.S sample 40% of the FRs show signatures of a triaxial halo. The comparison with the photometry in section 8.4 and in appendix B.1 suggests that the number of FRs with triaxial halos in the ePN.S sample might actually be higher.
Where the data overlap, the PN kinematics agrees well with the IFS observations of the central regions, where the rotating disk component dominates the kinematics of the FRs. At larger radii both kinematics and photometry suggest that these galaxies show a transition to a spheroidal component. If we interpret this component with different kinematics and flattening as mainly formed by accreted, ex-situ, stars, we find that for the most massive galaxies it dominates at smaller fractions of , in agreement with simulations (Rodriguez-Gomez et al. 2016, see section 8.6). This dependence on mass, combined with the smaller radial coverage of the A3D kinematics, explains the different conclusions drawn by the two surveys: low mass FRs are dominated by the disk rotation up to large radii; the spheroid is more prominent in the most massive FRs, where the accreted envelope reaches smaller fractions of . Even so the radial coverage of the A3D kinematics does not reach the transition radius (see section 8.6), since the fraction of observed also depends on mass, as discussed above.
The present work shows that the wider spatial coverage of the kinematics by the ePN.S survey delivers new informations about ETGs that extend the results of previous surveys. FRs do contain inner disk components, but many of them are not simply highly flattened oblate objects. The results presented in this paper point to a more complex scenario for ETGs than the simple fast/slow rotator dichotomy. As predicted by simulations (Naab et al. 2014; Rodriguez-Gomez et al. 2016), FR galaxies appear to be more diverse objects than previously thought.
8.6 Kinematic transition radius
We found that most of the galaxies in the sample show a transition in their kinematics, marked by a change in the rotation velocity or in the kinematic position angle . In the framework of the two-phase formation scenario, we can interpret such kinematic differences as tracing stellar components with different origins, such as the in- and the ex-situ components. From simulations (Rodriguez-Gomez et al. 2016, and references therein) it is predicted that the in-situ stars are concentrated in the central regions of galaxies, while the accreted stars dominate the halos, and that their relative contribution is related primarily to the total mass. Within this framework we can define a transition radius as the distance at which we observe the described transition in the kinematics, and compare it with the total stellar mass.
The radial range is here quantified using
(A) in case of a declining profile, the interval between the radius at which is maximum and the radius at which it decreases by km s-1
(B) in case of an increasing profile, the radial range in which increases from to km s-1
(C) in case of a kinematic twist, the radial range in which changes significantly.
Table 8 lists the values measured,
and specifies the criteria (A,B,C) used for deriving it.
is also plotted in figures
5 and
6 with vertical lines.
For each galaxy we estimate the stellar mass using two different approaches, designated by and , to have also an estimate of the systematic uncertainties. The values for the masses are listed in table 7, along with the description of the procedure used for calculating them.
Figure 12 shows the stellar mass of the galaxies versus . The full circles show the same quantities in three bins of ; the error bars represent the standard deviation of the mass and of the ratio in the bin. A clear correlation exists between total stellar mass and , in the sense that the more massive galaxies tend to have transition radii at smaller fractions of . The shaded region in figure 12 shows the corresponding quantities from the N-body simulations of Cooper et al. (2013). Using their stellar mass surface density profiles in bins of dark halo virial mass (; their figure 6), we estimated the transition radius in units of half mass radii as the distance at which the accreted component overcomes the in-situ component. The total masses are converted to stellar masses via abundance matching, using the prescription given by Behroozi et al. (2010). Both data and simulation follow the same trend.
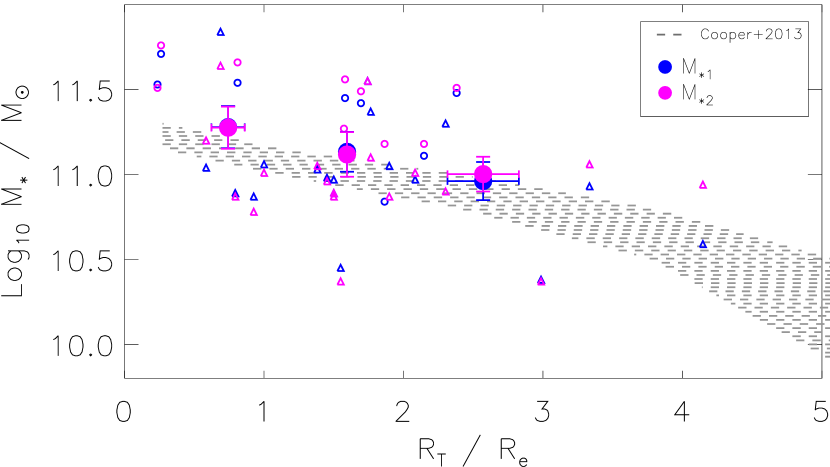
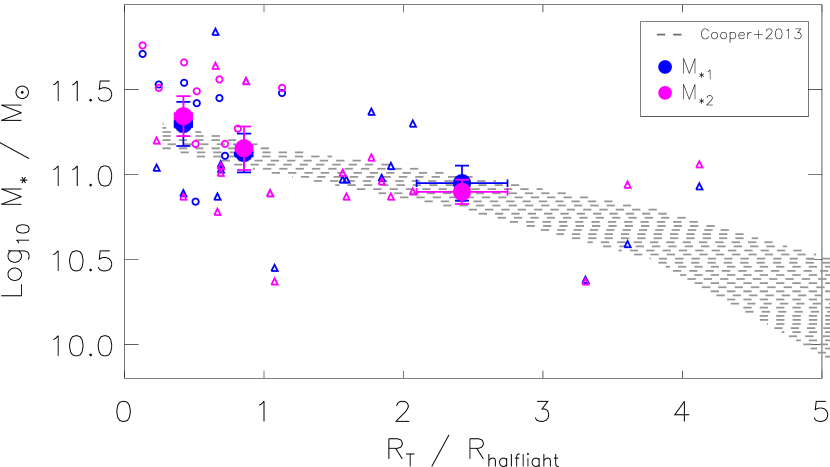
We also observe a higher scatter in for the lower mass galaxies, in agreement with the results of Rodriguez-Gomez et al. (2016) from the Illustris simulations. They defined a three-dimensional transition radius as the distance at which the accreted stellar mass fraction overcomes the in-situ, and normalized it by the stellar half mass radius . Their study shows an additional dependence of on morphology, halo formation time, and recent merger history, and that tightly correlates with the ex-situ stellar mass fraction.
We tested the dependence of the correlation found on the choice of the value of . The used values (listed in table 2) derive mostly from a calibrated average between 2MASS and RC3 determinations (Cappellari et al. 2011). Deeper photometric data would deliver larger values for for the brightest galaxies (Kormendy et al. 2009). For this reason we carried out a simple photometric analysis, to be completed in a future study, with the goal of having a homogeneous determination of for all the sample galaxies which takes into account the shallower surface brightness profile of the brightest galaxies. Using the surface brightness profiles available in the literature (references in table 7), we fitted a Sérsic law in the outermost regions of the galaxies and extrapolated the profiles up to very large radii to include all the stellar light. We then evaluated the half-light radius from the growth curves (see table 7). Figure 13 shows that with these half-light radii, the relation between and total stellar mass becomes steeper and agrees even better with the predicted trend from the simulations.
Spavone et al. (2017) quantified transition radii for a subsample of the ePN.S SRs using a parametrization of the light profiles with a multi-components Sérsic fit. Their three-components model describes the superposition of an in-situ component dominating the central regions, a relaxed, phase-mixed accreted component, to which is associated the transition radius , and an outer diffuse component of unrelaxed accreted material with transition radius . The transition radius is defined there as the radius at which one component overcomes the other. The derived from the kinematics generally compares with for the same galaxies.
D’Souza et al. (2014), using image stacking of a large sample of galaxies, defined as the radius at which the outer component of a double Sérsic model begins to dominate the integrated stellar light. They found a dependence of on the stellar mass, and, at comparable masses, their photometric values [kpc] are in the same range as our kinematic [kpc]. This is interesting considering the different approaches used to derive these quantities.
8.7 The diverse halo formation histories
Cosmological simulations (Naab et al. 2014; Penoyre et al. 2017) show that FRs, as well as SRs, are the result of different formation pathways, characterized by factors like the number of mergers, the merger mass ratio, the timing of mergers, and the gas fraction. We note, however, that the adopted star formation and AGN feedback models influence the resulting morphologies and kinematic properties, so that definitive statements about the origin of FRs and SRs cannot yet be made (see Naab & Ostriker 2017, for a recent review). In the two-phase scenario, if the formation history is dominated by dissipation, then it is likely that the system becomes a fast rotator. Dissipation is particularly important in the early stages of galaxy formation, when the in-situ component generally settles down in a flattened rotating disk component (Rodriguez-Gomez et al. 2016; Qu et al. 2017), so that before redshift the progenitors of the FRs and SRs are nearly indistinguishable (Penoyre et al. 2017). Later on, the evolution of galaxies is determined by the stochasticity of merging events, which at low redshift are mostly gas-poor (e.g. Lee & Yi 2013). Major mergers contribute to the loss of spin of the remnant, while minor mergers are responsible for the growth in size and mass. The accretion of stars happens preferentially on radial orbits, and frequent mergers efficiently mix the in-situ and the accreted stellar populations while changing the intrinsic shape towards a more spheroidal form (e.g Jesseit et al. 2005; Hilz et al. 2012, 2013; Röttgers et al. 2014). Fast rotating galaxies experience a lower number of mergers when compared to the more massive slowly rotating systems, so their in-situ component is preserved in the central regions, in an axisymmetric, rotationally supported disk (e.g. Naab et al. 2014; Penoyre et al. 2017). Their halos, which host most of the accreted component, are not necessarily axisymmetric.
9 Summary and conclusions
In this paper we reconstructed and analyzed the velocity fields of 33 ETGs into their outer halos using planetary nebulae (PNe) as tracers. For the total ePN.S sample, we combined 25 galaxies from the PN.S ETG survey with 8 objects observed with counter-dispersed imaging or multi object spectroscopy from other sources (Arnaboldi et al. in prep.). In the extended PN.S (ePN.S) sample, 24 galaxies are classified as FRs (following the definition by Emsellem et al. 2011), and 9 are SRs. The kinematic information typically extends to 6 effective radii (), from a minimum of 3 to a maximum of 13.
We derived kinematic quantities such as the amplitude of rotation, the kinematic position angle (), and the velocity dispersion, using an adaptive kernel smoothing technique validated with simulated velocity fields.
In this process, we checked whether the galaxy velocity fields were point-symmetric as expected for triaxial galaxies in dynamical equilibrium, and whether the systemic velocity is unchanged in the outer halo.
We supplemented the PN kinematics with absorption line kinematic data from the literature (typically limited to the regions inside ), in order to have a complete picture of the nature of the objects, and compared the results from different datasets in the regions of overlap. Highlights of the results are:
(1) Most FRs (70%) have decreasing rotation amplitudes with radius, while a minority shows constant (15%) or increasing (15%) trends. have in their halos aligned with the photometric major axis at the spatial sampling of the ePN.S survey. The SRs display modest but significant rotation in their outskirts. Among the FRs, 10% have very weak or no rotation in their outskirts.
(2) SRs have approximately constant velocity dispersion profiles with radius, except for NGC 4636 which shows a steep drop in dispersion beyond 200 arcsec. The FRs display a variety of velocity dispersion profile shapes: some are approximately constant, others decrease steeply with radius (figure 7).
(3) From their velocity fields, all of the SRs and of the FRs show signatures of a triaxial halo (figure 6). For these galaxies we observe either a twist in the or a constant misalignment with the photometric major axis. In addition, two SRs have halos that are decoupled in their .
(4) Five galaxies show deviations from point symmetry. For NGC 2768 and NGC 4594 these effects are small (probably related asymmetries in the light distribution, in the former, and to extinction effects in the latter) and do not influence our kinematic analysis. NGC 1316, NGC 4472, and NGC 5128 instead display strong features, that indicate halos not in dynamical equilibrium. NGC 5128 is a merger remnant with clear minor axis rotation, and hence it is a triaxial system. For NGC 4472 the determination of the is influenced by the presence of an in-falling satellite. While we included this SR among the triaxial objects, we note that the galaxy would have approximately major axis rotation once the PNe of the satellite are removed, and we refer to Hartke et al. (2018) for a more detailed study. NGC 1316 is a merger remnant with pronounced major axis rotation in the halo.
(5) In a versus diagram (figure 9), the previous results imply different locations for the slow and the FRs. The latter separate further between FRs with slowly rotating outer spheroid and FRs that rotate rapidly at large radii also. The high values of are either due to a dominating disk component (e.g. NGC 7457) or to a rapidly rotating outer spheroid (NGC 2768). The FRs with triaxial halos show approximately equal values of and , and span all values of .
(6) In the 11 FR galaxies with the largest number of PN tracers, we see a decrease in the rotation velocity profile. In 10 cases this occurs approximately at a transition radius similar to the scale radius of the known stellar disk component555 Throughout this paper we indicate with ”disk component” a highly flattened, but definitely three-dimensional, oblate, rotating component., suggesting that the transition from rapid to slow rotation is due to the radial fading of the stellar disk in a slowly rotating outer spheroid. For NGC 4494 there is no photometric evidence for a disk. In the other FRs with fewer tracers that also show a decrease in rotation, the comparison between the slow rotation of the PN system and the rapid rotation in the absorption line kinematics, which is related to an inner disk, suggests a similar transition at smaller radii.
(7) In extended photometry, the ePN.S FRs with triaxial halos show small but significant isophote twists, typically of degrees, lower than for the rounder SRs. The comparison with illustrative, observationally motivated, oblate-triaxial models shows that the distribution of observed photometric twists for the ePN.S FRs is consistent with the presence of a triaxial halo.
(8) For SRs, we estimate a kinematic transition radius from a variation in the rotation or in the profile. Combining with the transition radii of FRs, we find a relation between the ratio and stellar mass, such that the most massive galaxies have the lowest (figure 12). In the framework of the two-phase formation scenario we can interpret as marking the transition between the inner regions, dominated by the in-situ stellar component, and the halo, which is mostly accreted. The comparison with photometric studies (D’Souza et al. 2014) and cosmological simulations (Cooper et al. 2013; Rodriguez-Gomez et al. 2016) shows good agreement, in particular the prediction from simulations is quantitatively confirmed.
(9) In the mass-ellipticity plane (figure 11), the ePN.S FRs with triaxial halos are amongst the most massive of the FRs in the ATLAS3D survey. If we interpret the triaxial envelopes of these galaxies as mainly formed by accreted, ex-situ, stars, the observed mass dependence is in agreement with simulations (Rodriguez-Gomez et al. 2016) which predict that the accreted component dominates down to smaller fractions of for more massive galaxies (figure 13). The dependence on mass, combined with the fainter survey limit and smaller radial coverage of the ATLAS3D kinematics, explains the different conclusions drawn by the two surveys: low mass FRs are dominated by the disk rotation up to large radii; however, in the more massive FRs the spheroid is more prominent, where the accreted envelope reaches smaller fractions of . In the massive FRs, the inner disks frequently fade in slowly rotating outer spheroids which are often triaxial.
In the data presented here, we see
-
•
SRs
-
•
FRs without apparent disks (NGC 4494 and NGC 4742)
-
•
FRs with only inner disks and slowly rotating spheroids (e.g. NGC 3377)
-
•
FRs with dominant disks all the way to their outermost regions (e.g. NGC 7457)
-
•
FRs with inner disks and rapidly rotating spheroids (e.g. NGC 2768)
-
•
FRs with triaxial halos that are dominated by dispersion (e.g. NGC 4649) or that rotate rapidly (NGC 4742 and NGC 5866)
Thus we conclude that ETGs show considerably more diversity in their halos than is apparent from their central bright regions. We also see clear signatures of the two-phase formation scenario: three galaxies show out of equilibrium kinematics in their halos, and more generally the inner and outer regions of ETGs often have different kinematic properties, where the transition radius depends on the stellar mass as predicted by cosmological simulations.
Acknowledgements.
We are grateful to Nigel G. Douglas for his fundamental contribution to the foundation of the Planetary Nebula Spectrograph instrument. We thank Luis Ho and Zhao-Yu Li for providing us with the Carnagie photometric data for the ePN.S ETG sample. We thank Peter Erwin for sharing his expertise with photometric modeling. C.P. thanks I. Soeldner-Rembold and J. Hartke for useful comments and discussions. C.P. is also grateful to F. Hofmann for advice and suggestions on the manuscript. AC would like to thank CNPq for the fellowship 4150977/2017-4. A.J.R. was supported by National Science Foundation grant AST-1616710, and as a Research Corporation for Science Advancement Cottrell Scholar. C.T. is supported through an NWO-VICI grant (project number 639.043.308). This research has made use of NASA’s Astrophysics Data System, of the data products from the Two Micron All Sky Survey (University of Massachusetts and the IPAC/CalTech), of the NASA/ IPAC Infrared Science Archive (Jet Propulsion Laboratory, CalTech), of the NASA/IPAC Extragalactic Database (NED), and of the VizieR catalogue access tool, CDS, Strasbourg, France. We acknowledge the usage of the HyperLeda database (http://leda.univ-lyon1.fr) as well.
| Galaxy | A(a)𝑎(a)(a)𝑎(a)footnotemark: | B(a)𝑎(a)(a)𝑎(a)footnotemark: | (b)𝑏(b)(b)𝑏(b)footnotemark: | (c)𝑐(c)(c)𝑐(c)footnotemark: | (d)𝑑(d)(d)𝑑(d)footnotemark: | (e)𝑒(e)(e)𝑒(e)footnotemark: | (f)𝑓(f)(f)𝑓(f)footnotemark: | Ref. | ||
|---|---|---|---|---|---|---|---|---|---|---|
| NGC | [arcsec-1] | [ km s-1] | [ km s-1] | [ km s-1] | [ km s-1] | [arcsec] | (g)𝑔(g)(g)𝑔(g)footnotemark: | (h)ℎ(h)(h)ℎ(h)footnotemark: | phot. (i)𝑖(i)(i)𝑖(i)footnotemark: | |
| 0584 | 0.37 | 63.2 | 21. | 21. | 15. | 1901.27. | 30 | 11.07 | 11.04 | (4) |
| 0821 | 0.50 | 9.7 | 21. | 22. | 16. | 1697.16. | 38 | 10.97 | 10.87 | (1);(2) |
| 1023 | 0.26 | 15.3 | 14. | 19. | 13. | 618. 9. | 39 | 10.93 | 11.06 | (6) |
| 1316 | 0.46 | 21.3 | 30. | 24. | 21. | 1749.30. | 115 | 11.84 | 11.64 | (4) |
| 1344 | 0.40 | 10.8 | 10. | 21. | 13. | 1190.13. | 44 | 11.06 | 11.01 | (7) |
| 1399 | 0.84 | 5.2 | 37. | 27. | 18. | 1401.19. | 122 | 11.53 | 11.51 | (4) |
| 2768 | 0.33 | 17.5 | 20. | 26. | 22. | 1378.14. | 70 | 11.30 | 10.90 | (15);(19) |
| 2974 | 0.57 | 33.6 | 21. | 25. | 21. | 1803.42. | 43 | 10.87 | 11.06 | (4) |
| 3115 | 0.28 | 19.6 | 20. | 30. | 21. | 624.16. | 73 | 10.98 | 10.96 | (4) |
| 3377 | 0.32 | 19.0 | 20. | 12. | 8. | 708. 9. | 51 | 10.45 | 10.37 | (1);(2);(3);(19) |
| 3379 | 0.34 | 16.2 | 20. | 21. | 14. | 934.17. | 58 | 10.89 | 10.89 | (8);(9) |
| 3384 | 0.25 | 18.9 | 20. | 14. | 10. | 722. 9. | 42 | 10.77 | 10.88 | (16);(20) |
| 3489 | 0.32 | 14.7 | 20. | 14. | 11. | 707.12. | 22 | 10.56 | 10.61 | (16) |
| 3608 | 0.37 | 24.6 | 21. | 15. | 11. | 1235.16. | 108 | 10.84 | 11.18 | (2);(3) |
| 3923 | 0.60 | 24.3 | 30. | 36. | 26. | 1677.26. | 164 | 11.54 | 11.66 | (4) |
| 4278 | 0.88 | 2.4 | 18. | 18. | 14. | 605.17. | 59 | 10.89 | 10.87 | (12);(19) |
| 4339 | 0.43 | 20.3 | 21. | 8. | 6. | 1300. 7. | 27 | 10.38 | 10.18 | (13);(19) |
| 4365 | 0.91 | 0.2 | 21. | 20. | 14. | 1273.11. | 111 | 11.48 | 11.51 | (14) |
| 4374 | 0.86 | 1.6 | 23. | 27. | 19. | 1050.18. | 122 | 11.45 | 11.56 | (14) |
| 4472 | 0.74 | 11.3 | 20. | 38. | 33. | 959.22. | 193 | 11.71 | 11.76 | (14) |
| 4473 | 0.91 | 0.2 | 21. | 18. | 12. | 2236.13. | 38 | 10.87 | 10.78 | (17) |
| 4494 | 0.41 | 12.8 | 21. | 17. | 12. | 1348.10. | 49 | 11.05 | 10.87 | (10) |
| 4552 | 0.90 | 0.6 | 21. | 23. | 16. | 361.15. | 101 | 11.11 | 11.18 | (14) |
| 4564 | 0.24 | 16.5 | 21. | 19. | 12. | 1169.17. | 24 | 10.59 | 10.94 | (1) |
| 4594 | 0.54 | 19.3 | 30. | 32. | 28. | 1060.16. | 102 | 11.37 | 11.10 | (4);(21) |
| 4636 | 0.68 | 9.5 | 21. | 24. | 16. | 903.19. | 172 | 11.12 | 11.27 | (14) |
| 4649 | 0.86 | 1.5 | 20. | 25. | 18. | 1059.18. | 132 | 11.55 | 11.55 | (14) |
| 4697 | 0.45 | 6.0 | 35. | 23. | 16. | 1274.11. | 123 | 11.03 | 11.05 | (2);(11) |
| 4742 | 0.20 | 16.9 | 21. | 13. | 10. | 1305. 9. | 13 | 10.38 | 10.37 | (4);(22) |
| 5128 | 0.29 | 25.6 | 4. | 25. | 21. | 536.17. | 414 | 11.04 | 11.20 | (4) |
| 5846 | 0.90 | 0.1 | 21. | 25. | 17. | 1716.19. | 193 | 11.42 | 11.49 | (5);(18) |
| 5866 | 0.34 | 18.7 | 21. | 15. | 10. | 782.10. | 48 | 10.97 | 11.01 | (16);(19) |
| 7457 | 0.28 | 10.5 | 20. | 7. | 6. | 843. 5. | 62 | 10.28 | 10.63 | (16); (19) |
$b$$b$footnotetext: Mean error on the measured radial velocities.
$c$$c$footnotetext: Mean error on the smoothed velocity field.
$d$$d$footnotetext: Mean error on the velocity dispersion field.
$e$$e$footnotetext: Subtracted systemic velocity.
$f$$f$footnotetext: Half-light radius, see text.
$g$$g$footnotetext: Logarithm of the stellar mass in solar units. are derived from the K-band luminosities listed in table 2, corrected for missing flux as in Scott et al. (2013): , and applying a mass-to-light ratio of 1 (appropriate for old stellar population with a Kroupa IMF, Forbes et al. 2016).
$h$$h$footnotetext: Logarithm of the stellar mass in solar units. are derived using total luminosities obtained by fitting the surface brightness profiles with a Sérsic law and integrating till very large radii. The apparent magnitudes obtained are converted to absolute magnitudes using the distances listed in table 2, corrected for foreground galactic extinction, and homogenized to B magnitude using color indexes from the HyperLeda666Makarov et al. (2014), http://leda.univ-lyon1.fr/ database and from Sandage & Visvanathan (1978). We then applied a stellar mass to light ratio given by the relation from Bell et al. (2003): , where the color index is from HyperLeda.
$i$$i$footnotetext: References for the photometry: (1) Goudfrooij et al. (1994), (2) Lauer et al. (2005), (3) Jedrzejewski (1987), (4)Li et al. (2011), (5) Kronawitter et al. (2000), (6) Noordermeer et al. (2008), (7) Sikkema et al. (2007), (8) Capaccioli et al. (1990), (9) Gebhardt et al. (2000), (10) Napolitano et al. (2009), (11) de Lorenzi et al. (2008), (12) Peletier et al. (1990), (13) Caon et al. (1994), (14) Kormendy et al. (2009), (15) Hopkins et al. (2009), (16) Krajnović et al. (2013), (17) Caon et al. (1990), (18) Spavone et al. (2017), (19) Michard & Marchal (1993), (20) Meusinger & Ismail (2007), (21) Gadotti & Sánchez-Janssen (2012), (22) Lauer et al. (1995)
| Galaxy | class (a)𝑎(a)(a)𝑎(a)footnotemark: | point | features in | multiple | triaxial (e)𝑒(e)(e)𝑒(e)footnotemark: | (f)𝑓(f)(f)𝑓(f)footnotemark: | NOTES (f)𝑓(f)(f)𝑓(f)footnotemark: |
|---|---|---|---|---|---|---|---|
| NGC | symm.(b)𝑏(b)(b)𝑏(b)footnotemark: | (R)(c)𝑐(c)(c)𝑐(c)footnotemark: | kin. comp.(d)𝑑(d)(d)𝑑(d)footnotemark: | arcsec | |||
| 0584 | F | y | n | n | n | ——— | small number of tracers |
| 0821 | F | y | y | n | y | (A,C) | |
| 1023 | F | y | n | n | n | (A) | |
| 1316 | F | n | y | y | n | (A) - merger remnant | |
| 1344 | F | y | y | n | y | (C) - prolate rotation | |
| 1399 | S | y | y | y | y | (B) - kinematically decoupled halo | |
| 2768 | F | n | n | n | n | (A) - fast rotating halo | |
| 2974 | F | y | n | n | n | ——— | small number of tracers |
| 3115 | F | y | y | n | n | (A) - photometry reveals a perturbed disk at the interface with the spheroid component | |
| 3377 | F | y | y | y | y | (A) | |
| 3379 | F | y | y | y | y | (A,C) - hints for growing rotation in the outskirts | |
| 3384 | F | y | n | n | n | ——— | extended disk |
| 3489 | F | y | n | n | n | ——— | small number of tracers |
| 3608 | S | y | y | n | y | (B) | |
| 3923 | S | y | y | n | y | (B) | |
| 4278 | F | y | n | n | n | (A) | |
| 4339 | F | y | n | n | n | ——— | small number of tracers |
| 4365 | S | y | y | y | y | (C) - kinematically decoupled halo | |
| 4374 | S | y | y | n | y | (B) | |
| 4472 | S | n | y | y | y | (B) - recent merger; kinematics dominated by in-falling satellite | |
| 4473 | F | y | y | n | y | (A) - minor axis rotation observed by Foster et al. (2013) | |
| 4494 | F | y | y | y | y | (A) | |
| 4552 | S | y | y | y | y | (B,C) | |
| 4564 | F | y | n | n | n | (A) - fast rotating halo | |
| 4594 | F | y | n | n | n | (A) - no detections in the plane of the disk (dust absorption) | |
| 4636 | S | y | y | y | y | (C) | |
| 4649 | F | y | y | y | y | (A) - no detections on the west side of the galaxy | |
| 4697 | F | y | y | n | n | (A) - hints for growing rotation in the outskirts; note that this PN sample contains a secondary PN population out of dynamical equilibrium (Sambhus et al. 2006) | |
| 4742 | F | y | y | n | y | (C) | |
| 5128 | F | n | y | y | y | (C) - recent merger | |
| 5846 | S | y | y | n | y | (B) | |
| 5866 | F | y | y | n | y | (A) - fast rotating halo | |
| 7457 | F | y | n | n | n | ——— | extended disk |
$b$$b$footnotetext: Point symmetry properties of the PN smoothed velocity fields: ”y” marks point symmetric galaxies while ”n” marks galaxies showing asymmetries, see section 5
$c$$c$footnotetext: Significant kinematic twist or misalignment of with respect to : ”y” marks galaxies showing at least one of these, see section 6.4
$d$$d$footnotetext: For the galaxies marked with ”y”, the PN smoothed velocity fields reveal rotation along two perpendicular axes or a halo which is kinematically decoupled with respect to the innermost regions, see sections 7 and 6.4.2.
$e$$e$footnotetext: Galaxies marked with ”y” have been classified as triaxial in section 6.4.
$f$$f$footnotetext: is the radial range of the kinematic transition.
$g$$g$footnotetext: Criteria (A, B, C) used to define the radial range as described in the text (section 8), and notes on individual galaxies (see also the dedicated appendix C).
References
- Alabi et al. (2016) Alabi, A. B., Forbes, D. A., Romanowsky, A. J., et al. 2016, MNRAS, 460, 3838
- Arnaboldi et al. (1998) Arnaboldi, M., Freeman, K. C., Gerhard, O., et al. 1998, ApJ, 507, 759
- Arnaboldi et al. (1996) Arnaboldi, M., Freeman, K. C., Mendez, R. H., et al. 1996, ApJ, 472, 145
- Arnold et al. (2014) Arnold, J. A., Romanowsky, A. J., Brodie, J. P., et al. 2014, ApJ, 791, 80
- Arrigoni Battaia et al. (2012) Arrigoni Battaia, F., Gavazzi, G., Fumagalli, M., et al. 2012, A&A, 543, A112
- Barbon & Capaccioli (1975) Barbon, R. & Capaccioli, M. 1975, A&A, 42, 103
- Barbosa et al. (2018) Barbosa, C. E., Arnaboldi, M., Coccato, L., et al. 2018, A&A, 609, A78
- Bedregal et al. (2006) Bedregal, A. G., Aragón-Salamanca, A., Merrifield, M. R., & Milvang-Jensen, B. 2006, MNRAS, 371, 1912
- Behroozi et al. (2010) Behroozi, P. S., Conroy, C., & Wechsler, R. H. 2010, ApJ, 717, 379
- Beletsky et al. (2011) Beletsky, Y., Gadotti, D. A., Moiseev, A., Alves, J., & Kniazev, A. 2011, MNRAS, 418, L6
- Bell et al. (2003) Bell, E. F., McIntosh, D. H., Katz, N., & Weinberg, M. D. 2003, ApJS, 149, 289
- Bellstedt et al. (2017a) Bellstedt, S., Forbes, D. A., Foster, C., et al. 2017a, MNRAS, 467, 4540
- Bellstedt et al. (2017b) Bellstedt, S., Graham, A. W., Forbes, D. A., et al. 2017b, MNRAS, 470, 1321
- Benacchio & Galletta (1980) Benacchio, L. & Galletta, G. 1980, MNRAS, 193, 885
- Bender (1988a) Bender, R. 1988a, A&A, 202, L5
- Bender (1988b) Bender, R. 1988b, A&A, 193, L7
- Bender et al. (1988) Bender, R., Doebereiner, S., & Moellenhoff, C. 1988, A&AS, 74, 385
- Bender et al. (1994) Bender, R., Saglia, R. P., & Gerhard, O. E. 1994, MNRAS, 269, 785
- Blakeslee et al. (2010) Blakeslee, J. P., Cantiello, M., Mei, S., et al. 2010, ApJ, 724, 657
- Blakeslee et al. (2009) Blakeslee, J. P., Jordán, A., Mei, S., et al. 2009, ApJ, 694, 556
- Blakeslee et al. (2001) Blakeslee, J. P., Lucey, J. R., Barris, B. J., Hudson, M. J., & Tonry, J. L. 2001, MNRAS, 327, 1004
- Blom et al. (2012) Blom, C., Forbes, D. A., Brodie, J. P., et al. 2012, MNRAS, 426, 1959
- Boardman et al. (2017) Boardman, N. F., Weijmans, A.-M., van den Bosch, R., et al. 2017, MNRAS, 471, 4005
- Bois et al. (2011) Bois, M., Emsellem, E., Bournaud, F., et al. 2011, MNRAS, 416, 1654
- Bournaud et al. (2011) Bournaud, F., Chapon, D., Teyssier, R., et al. 2011, ApJ, 730, 4
- Bridges et al. (2007) Bridges, T. J., Rhode, K. L., Zepf, S. E., & Freeman, K. C. 2007, ApJ, 658, 980
- Brodie & Strader (2006) Brodie, J. P. & Strader, J. 2006, ARA&A, 44, 193
- Brough et al. (2006) Brough, S., Forbes, D. A., Kilborn, V. A., & Couch, W. 2006, MNRAS, 370, 1223
- Bryant et al. (2015) Bryant, J. J., Owers, M. S., Robotham, A. S. G., et al. 2015, MNRAS, 447, 2857
- Buitrago et al. (2017) Buitrago, F., Trujillo, I., Curtis-Lake, E., et al. 2017, MNRAS, 466, 4888
- Bullock & Johnston (2005) Bullock, J. S. & Johnston, K. V. 2005, ApJ, 635, 931
- Bundy et al. (2015) Bundy, K., Bershady, M. A., Law, D. R., et al. 2015, ApJ, 798, 7
- Burkhead (1986) Burkhead, M. S. 1986, AJ, 91, 777
- Caon et al. (1994) Caon, N., Capaccioli, M., & D’Onofrio, M. 1994, A&AS, 106, 199
- Caon et al. (1990) Caon, N., Capaccioli, M., & Rampazzo, R. 1990, A&AS, 86, 429
- Capaccioli et al. (1990) Capaccioli, M., Held, E. V., Lorenz, H., & Vietri, M. . 1990, AJ, 99, 1813
- Capaccioli et al. (1987) Capaccioli, M., Held, E. V., & Nieto, J.-L. 1987, AJ, 94, 1519
- Cappellari (2016) Cappellari, M. 2016, ARA&A, 54, 597
- Cappellari et al. (2007) Cappellari, M., Emsellem, E., Bacon, R., et al. 2007, MNRAS, 379, 418
- Cappellari et al. (2011) Cappellari, M., Emsellem, E., Krajnović, D., et al. 2011, MNRAS, 413, 813
- Cappellari et al. (2013a) Cappellari, M., McDermid, R. M., Alatalo, K., et al. 2013a, MNRAS, 432, 1862
- Cappellari et al. (2015) Cappellari, M., Romanowsky, A. J., Brodie, J. P., et al. 2015, ApJ, 804, L21
- Cappellari et al. (2013b) Cappellari, M., Scott, N., Alatalo, K., et al. 2013b, MNRAS, 432, 1709
- Carter (1978) Carter, D. 1978, MNRAS, 182, 797
- Carter et al. (1998) Carter, D., Thomson, R. C., & Hau, G. K. T. 1998, MNRAS, 294, 182
- Churazov et al. (2010) Churazov, E., Tremaine, S., Forman, W., et al. 2010, MNRAS, 404, 1165
- Ciardullo et al. (1993) Ciardullo, R., Jacoby, G. H., & Dejonghe, H. B. 1993, ApJ, 414, 454
- Coccato et al. (2013) Coccato, L., Arnaboldi, M., & Gerhard, O. 2013, MNRAS, 436, 1322
- Coccato et al. (2010) Coccato, L., Arnaboldi, M., Gerhard, O., et al. 2010, A&A, 519, A95
- Coccato et al. (2009) Coccato, L., Gerhard, O., Arnaboldi, M., et al. 2009, MNRAS, 394, 1249
- Cohen & Ryzhov (1997) Cohen, J. G. & Ryzhov, A. 1997, ApJ, 486, 230
- Cooper et al. (2013) Cooper, A. P., D’Souza, R., Kauffmann, G., et al. 2013, MNRAS, 434, 3348
- Cortesi et al. (2013a) Cortesi, A., Arnaboldi, M., Coccato, L., et al. 2013a, A&A, 549, A115
- Cortesi et al. (2011) Cortesi, A., Merrifield, M. R., Arnaboldi, M., et al. 2011, MNRAS, 414, 642
- Cortesi et al. (2013b) Cortesi, A., Merrifield, M. R., Coccato, L., et al. 2013b, MNRAS, 432, 1010
- Crnojević et al. (2016) Crnojević, D., Sand, D. J., Spekkens, K., et al. 2016, ApJ, 823, 19
- Croom et al. (2012) Croom, S. M., Lawrence, J. S., Bland-Hawthorn, J., et al. 2012, MNRAS, 421, 872
- Daddi et al. (2005) Daddi, E., Renzini, A., Pirzkal, N., et al. 2005, ApJ, 626, 680
- Damjanov et al. (2011) Damjanov, I., Abraham, R. G., Glazebrook, K., et al. 2011, ApJ, 739, L44
- Davies et al. (1983) Davies, R. L., Efstathiou, G., Fall, S. M., Illingw orth, G., & Schechter, P. L. 1983, ApJ, 266, 41
- Davies & Illingworth (1983) Davies, R. L. & Illingworth, G. 1983, ApJ, 266, 516
- Davies et al. (2001) Davies, R. L., Kuntschner, H., Emsellem, E., et al. 2001, ApJ, 548, L33
- De Bruyne et al. (2001) De Bruyne, V., Dejonghe, H., Pizzella, A., Bernardi , M., & Zeilinger, W. W. 2001, ApJ, 546, 903
- de Lorenzi et al. (2009) de Lorenzi, F., Gerhard, O., Coccato, L., et al. 2009, MNRAS, 395, 76
- de Lorenzi et al. (2008) de Lorenzi, F., Gerhard, O., Saglia, R. P., et al. 2008, MNRAS, 385, 1729
- de Zeeuw (1985) de Zeeuw, T. 1985, MNRAS, 216, 273
- Deason et al. (2012) Deason, A. J., Belokurov, V., Evans, N. W., & McCarth y, I. G. 2012, ApJ, 748, 2
- Debattista et al. (2002) Debattista, V. P., Corsini, E. M., & Aguerri, J. A. L. 2002, MNRAS, 332, 65
- Douglas et al. (2002) Douglas, N. G., Arnaboldi, M., Freeman, K. C., et al. 2002, PASP, 114, 1234
- Dowell et al. (2014) Dowell, J. L., Rhode, K. L., Bridges, T. J., et al. 2014, AJ, 147, 150
- D’Souza et al. (2014) D’Souza, R., Kauffman, G., Wang, J., & Vegetti, S. 2014, MNRAS, 443, 1433
- Duc et al. (2015) Duc, P.-A., Cuillandre, J.-C., Karabal, E., et al. 2015, MNRAS, 446, 120
- Duc et al. (2011) Duc, P.-A., Cuillandre, J.-C., Serra, P., et al. 2011, MNRAS, 417, 863
- Ebrová & Łokas (2017) Ebrová, I. & Łokas, E. L. 2017, ApJ, 850, 144
- Emsellem et al. (2011) Emsellem, E., Cappellari, M., Krajnović, D., et al. 2011, MNRAS, 414, 888
- Emsellem et al. (2007) Emsellem, E., Cappellari, M., Krajnović, D., et al. 2007, MNRAS, 379, 401
- Emsellem et al. (2004) Emsellem, E., Cappellari, M., Peletier, R. F., et al. 2004, MNRAS, 352, 721
- Fogarty et al. (2015) Fogarty, L. M. R., Scott, N., Owers, M. S., et al. 2015, MNRAS, 454, 2050
- Forbes et al. (2016) Forbes, D. A., Romanowsky, A. J., Pastorello, N., et al. 2016, MNRAS, 457, 1242
- Forestell & Gebhardt (2010) Forestell, A. D. & Gebhardt, K. 2010, ApJ, 716, 370
- Foster et al. (2013) Foster, C., Arnold, J. A., Forbes, D. A., et al. 2013, MNRAS, 435, 3587
- Foster et al. (2016) Foster, C., Pastorello, N., Roediger, J., et al. 2016, MNRAS, 457, 147
- Foster et al. (2011) Foster, C., Spitler, L. R., Romanowsky, A. J., et al. 2011, MNRAS, 415, 3393
- Foster et al. (2017) Foster, C., van de Sande, J., D’Eugenio, F., et al. 2017, MNRAS, 472, 966
- Fouque et al. (1992) Fouque, P., Gourgoulhon, E., Chamaraux, P., & Paturel , G. 1992, A&AS, 93, 211
- Franx (1988) Franx, M. 1988, MNRAS, 231, 285
- Franx et al. (1991) Franx, M., Illingworth, G., & de Zeeuw, T. 1991, ApJ, 383, 112
- Franx et al. (1989) Franx, M., Illingworth, G., & Heckman, T. 1989, ApJ, 344, 613
- Gabor & Davé (2012) Gabor, J. M. & Davé, R. 2012, MNRAS, 427, 1816
- Gadotti & Sánchez-Janssen (2012) Gadotti, D. A. & Sánchez-Janssen, R. 2012, MNRAS, 423, 877
- Garcia (1993) Garcia, A. M. 1993, A&AS, 100, 47
- Gebhardt et al. (2000) Gebhardt, K., Richstone, D., Kormendy, J., et al. 2000, AJ, 119, 1157
- Gerhard et al. (1998) Gerhard, O., Jeske, G., Saglia, R. P., & Bender, R. 1998, MNRAS, 295, 197
- Gerhard et al. (2001) Gerhard, O., Kronawitter, A., Saglia, R. P., & Bender, R. 2001, AJ, 121, 1936
- Gerhard (1993) Gerhard, O. E. 1993, MNRAS, 265, 213
- Goudfrooij et al. (1994) Goudfrooij, P., Hansen, L., Jorgensen, H. E., et al. 1994, A&AS, 104, 179
- Graham et al. (1998) Graham, A. W., Colless, M. M., Busarello, G., Zaggia, S., & Longo, G. 1998, A&AS, 133, 325
- Gronwall et al. (2007) Gronwall, C., Ciardullo, R., Hickey, T., et al. 2007, ApJ, 667, 79
- Guérou et al. (2016) Guérou, A., Emsellem, E., Krajnović, D., et al. 2016, A&A, 591, A143
- Halliday et al. (2001) Halliday, C., Davies, R. L., Kuntschner, H., et al. 2001, MNRAS, 326, 473
- Hartke et al. (2018) Hartke, J., Arnaboldi, M., Gerhard, O., et al. 2018, ArXiv e-prints [arXiv:1805.03092]
- Hartke et al. (2017) Hartke, J., Arnaboldi, M., Longobardi, A., et al. 2017, A&A, 603, A104
- Haynes et al. (1983) Haynes, R. F., Cannon, R. D., & Ekers, R. D. 1983, Proceedings of the Astronomical Society of Australia, 5, 241
- Hilz et al. (2013) Hilz, M., Naab, T., & Ostriker, J. P. 2013, MNRAS, 429, 2924
- Hilz et al. (2012) Hilz, M., Naab, T., Ostriker, J. P., Thomas, J. an d Burkert, A., & Jesseit, R. 2012, MNRAS, 425, 3119
- Ho et al. (2011) Ho, L. C., Li, Z.-Y., Barth, A. J., Seigar, M. S., & Peng, C. Y. 2011, ApJS, 197, 21
- Ho et al. (2012) Ho, L. C., Li, Z.-Y., Barth, A. J., Seigar, M. S., & Peng, C. Y. 2012, VizieR Online Data Catalog, 219
- Hopkins et al. (2009) Hopkins, P. F., Cox, T. J., Dutta, S. N., et al. 2009, ApJS, 181, 135
- Huang et al. (2013) Huang, S., Ho, L. C., Peng, C. Y., Li, Z.-Y., & Barth, A. J. 2013, ApJ, 768, L28
- Hui et al. (1995) Hui, X., Ford, H. C., Freeman, K. C., & Dopita, M. A. . 1995, ApJ, 449, 592
- Humphrey et al. (2006) Humphrey, P. J., Buote, D. A., Gastaldello, F., et al. 2006, ApJ, 646, 899
- Iodice et al. (2016) Iodice, E., Capaccioli, M., Grado, A., et al. 2016, ApJ, 820, 42
- Iodice et al. (2017) Iodice, E., Spavone, M., Capaccioli, M., et al. 2017, ApJ, 839, 21
- Janowiecki et al. (2010) Janowiecki, S., Mihos, J. C., Harding, P., et al. 2010, ApJ, 715, 972
- Jarrett et al. (2003) Jarrett, T. H., Chester, T., Cutri, R., Schneider, S. E., & Huchra, J. P. 2003, AJ, 125, 525
- Jedrzejewski & Schechter (1988) Jedrzejewski, R. & Schechter, P. L. 1988, ApJ, 330, L87
- Jedrzejewski (1987) Jedrzejewski, R. I. 1987, MNRAS, 226, 747
- Jensen et al. (2003) Jensen, J. B., Tonry, J. L., Barris, B. J., et al. 2003, ApJ, 583, 712
- Jesseit et al. (2005) Jesseit, R., Naab, T., & Burkert, A. 2005, MNRAS, 360, 1185
- Kelson et al. (2002) Kelson, D. D., Zabludoff, A. I., Williams, K. A., et al. 2002, ApJ, 576, 720
- Koopmans et al. (2009) Koopmans, L. V. E., Bolton, A., Treu, T., et al. 2009, ApJ, 703, L51
- Kormendy & Bender (1996) Kormendy, J. & Bender, R. 1996, ApJ, 464, L119
- Kormendy et al. (2009) Kormendy, J., Fisher, D. B., Cornell, M. E., & Bender, R. 2009, ApJS, 182, 216
- Kormendy & Illingworth (1982) Kormendy, J. & Illingworth, G. 1982, ApJ, 256, 460
- Kormendy & Westpfahl (1989) Kormendy, J. & Westpfahl, D. J. 1989, ApJ, 338, 752
- Krajnović et al. (2013) Krajnović, D., Alatalo, K., Blitz, L., et al. 2013, MNRAS, 432, 1768
- Krajnović et al. (2008) Krajnović, D., Bacon, R., Cappellari, M., et al. 2008, MNRAS, 390, 93
- Krajnović et al. (2006) Krajnović, D., Cappellari, M., de Zeeuw, P. T., & Copin, Y. 2006, MNRAS, 366, 787
- Krajnović et al. (2011) Krajnović, D., Emsellem, E., Cappellari, M., et al. 2011, MNRAS, 414, 2923
- Kronawitter et al. (2000) Kronawitter, A., Saglia, R. P., Gerhard, O., & Bender, R. 2000, A&AS, 144, 53
- Lackner et al. (2012) Lackner, C. N., Cen, R., Ostriker, J. P., & Joung, M. . R. 2012, MNRAS, 425, 641
- Lauer et al. (1995) Lauer, T. R., Ajhar, E. A., Byun, Y.-I., et al. 1995, AJ, 110, 2622
- Lauer et al. (2005) Lauer, T. R., Faber, S. M., Gebhardt, K., et al. 2005, AJ, 129, 2138
- Laurikainen et al. (2010) Laurikainen, E., Salo, H., Buta, R., Knapen, J. H., & Comerón, S. 2010, MNRAS, 405, 1089
- Leach (1981) Leach, R. 1981, ApJ, 248, 485
- Lee & Yi (2013) Lee, J. & Yi, S. K. 2013, ApJ, 766, 38
- Li et al. (2011) Li, Z.-Y., Ho, L. C., Barth, A. J., & Peng, C. Y. 2011, ApJS, 197, 22
- Lima Neto et al. (1999) Lima Neto, G. B., Gerbal, D., & Márquez, I. 1999, MNRAS, 309, 481
- Longobardi et al. (2013) Longobardi, A., Arnaboldi, M., Gerhard, O., et al. 2013, A&A, 558, A42
- Longobardi et al. (2015) Longobardi, A., Arnaboldi, M., Gerhard, O., & Mihos, J. C. 2015, A&A, 579, L3
- Loubser et al. (2008) Loubser, S. I., Sansom, A. E., Sánchez-Blázquez, P., Soechting, I. K., & Bromage, G. E. 2008, MNRAS, 391, 1009
- Ma et al. (2014) Ma, C.-P., Greene, J. E., McConnell, N., et al. 2014, ApJ, 795, 158
- Madejsky & Moellenhoff (1990) Madejsky, R. & Moellenhoff, C. 1990, A&A, 234, 119
- Madore et al. (2004) Madore, B. F., Freedman, W. L., & Bothun, G. D. 2004, ApJ, 607, 810
- Makarov et al. (2014) Makarov, D., Prugniel, P., Terekhova, N., Courtois, H., & Vauglin, I. 2014, A&A, 570, A13
- Malin & Carter (1980) Malin, D. F. & Carter, D. 1980, Nature, 285, 643
- Malin et al. (1983) Malin, D. F., Quinn, P. J., & Graham, J. A. 1983, ApJ, 272, L5
- Mandelbaum et al. (2006) Mandelbaum, R., Seljak, U., Kauffmann, G., Hirata, C. M., & Brinkmann, J. 2006, MNRAS, 368, 715
- Marcelin (1983) Marcelin, M. 1983, in IAU Symposium, Vol. 100, Internal Kinematics and Dynamics of Galaxies, ed. E. Athanassoula, 335
- McNeil et al. (2010) McNeil, E. K., Arnaboldi, M., Freeman, K. C., et al. 2010, A&A, 518, A44
- McNeil-Moylan et al. (2012) McNeil-Moylan, E. K., Freeman, K. C., Arnaboldi, M., & Gerhard, O. E. 2012, A&A, 539, A11
- Méndez et al. (2001) Méndez, R. H., Riffeser, A., Kudritzki, R.-P., et al. 2001, ApJ, 563, 135
- Méndez et al. (2009) Méndez, R. H., Teodorescu, A. M., Kudritzki, R.-P., & Burkert, A. 2009, ApJ, 691, 228
- Merritt (1992) Merritt, D. 1992, in BAAS, Vol. 24, Bulletin of the American Astronomical Society, 522–524
- Meusinger & Ismail (2007) Meusinger, H. & Ismail, H. A. 2007, Astronomische Nachrichten, 328, 562
- Michard & Marchal (1993) Michard, R. & Marchal, J. 1993, A&AS, 98, 29
- Michard & Marchal (1994) Michard, R. & Marchal, J. 1994, A&AS, 105, 481
- Morganti et al. (2013) Morganti, L., Gerhard, O., Coccato, L., Martinez-Va lpuesta, I., & Arnaboldi, M. 2013, MNRAS, 431, 3570
- Murphy et al. (2011) Murphy, J. D., Gebhardt, K., & Adams, J. J. 2011, ApJ, 729, 129
- Naab et al. (2014) Naab, T., Oser, L., Emsellem, E., et al. 2014, MNRAS, 444, 3357
- Naab & Ostriker (2017) Naab, T. & Ostriker, J. P. 2017, ARA&A, 55, 59
- Napolitano et al. (2001) Napolitano, N. R., Arnaboldi, M., Freeman, K. C., & Capaccioli, M. 2001, A&A, 377, 784
- Napolitano et al. (2011) Napolitano, N. R., Romanowsky, A. J., Capaccioli, M. an d Douglas, N. G., et al. 2011, MNRAS, 411, 2035
- Napolitano et al. (2009) Napolitano, N. R., Romanowsky, A. J., Coccato, L., et al. 2009, MNRAS, 393, 329
- Neumayer (2010) Neumayer, N. 2010, PASA, 27, 449
- Noordermeer et al. (2008) Noordermeer, E., Merrifield, M. R., Coccato, L., et al. 2008, MNRAS, 384, 943
- Norris et al. (2012) Norris, M. A., Gebhardt, K., Sharples, R. M., et al. 2012, MNRAS, 421, 1485
- Norris et al. (2006) Norris, M. A., Sharples, R. M., & Kuntschner, H. 2006, MNRAS, 367, 815
- Oser et al. (2010) Oser, L., Ostriker, J. P., Naab, T., Johansson, P. H., & Burkert, A. 2010, ApJ, 725, 2312
- Peletier et al. (1990) Peletier, R. F., Davies, R. L., Illingworth, G. D., Davis, L. E., & Cawson, M. 1990, AJ, 100, 1091
- Peng et al. (2004) Peng, E. W., Ford, H. C., & Freeman, K. C. 2004, ApJ, 602, 685
- Peng et al. (2002) Peng, E. W., Ford, H. C., Freeman, K. C., & White, R. . L. 2002, AJ, 124, 3144
- Penoyre et al. (2017) Penoyre, Z., Moster, B. P., Sijacki, D., & Genel, S. 2017, MNRAS, 468, 3883
- Pignatelli (1999) Pignatelli, E. 1999, ArXiv Astrophysics e-prints [astro-ph/9906378]
- Pota et al. (2015) Pota, V., Brodie, J. P., Bridges, T., et al. 2015, MNRAS, 450, 1962
- Pota et al. (2013) Pota, V., Forbes, D. A., Romanowsky, A. J., et al. 2013, MNRAS, 428, 389
- Proctor et al. (2009) Proctor, R. N., Forbes, D. A., Romanowsky, A. J., et al. 2009, MNRAS, 398, 91
- Pu & Han (2011) Pu, S.-B. & Han, Z.-W. 2011, Research in Astronomy and Astrophysics, 11, 909
- Qu et al. (2017) Qu, Y., Helly, J. C., Bower, R. G., et al. 2017, MNRAS, 464, 1659
- Raskutti et al. (2014) Raskutti, S., Greene, J. E., & Murphy, J. D. 2014, ApJ, 786, 23
- Rejkuba et al. (2002) Rejkuba, M., Minniti, D., Courbin, F., & Silva, D. R. . 2002, ApJ, 564, 688
- Renaud et al. (2017) Renaud, F., Agertz, O., & Gieles, M. 2017, MNRAS, 465, 3622
- Richtler et al. (2014) Richtler, T., Hilker, M., Kumar, B., et al. 2014, A&A, 569, A41
- Rix et al. (1997) Rix, H.-W., de Zeeuw, P. T., Cretton, N., van der M arel, R. P., & Carollo, C. M. 1997, ApJ, 488, 702
- Rodriguez-Gomez et al. (2016) Rodriguez-Gomez, V., Pillepich, A., Sales, L. V., et al. 2016, MNRAS, 458, 2371
- Romanowsky et al. (2003) Romanowsky, A. J., Douglas, N. G., Arnaboldi, M., et al. 2003, Science, 301, 1696
- Romanowsky & Fall (2012) Romanowsky, A. J. & Fall, S. M. 2012, ApJS, 203, 17
- Romanowsky et al. (2012) Romanowsky, A. J., Strader, J., Brodie, J. P., et al. 2012, ApJ, 748, 29
- Röttgers et al. (2014) Röttgers, B., Naab, T., & Oser, L. 2014, MNRAS, 445, 1065
- Saglia et al. (2000) Saglia, R. P., Kronawitter, A., Gerhard, O., & Bender, R. 2000, AJ, 119, 153
- Sambhus et al. (2006) Sambhus, N., Gerhard, O., & Méndez, R. H. 2006, AJ, 131, 837
- Sánchez et al. (2012) Sánchez, S. F., Kennicutt, R. C., Gil de Paz, A. an d van de Ven, G., et al. 2012, A&A, 538, A8
- Sancisi et al. (1984) Sancisi, R., van Woerden, H., Davies, R. D., & Hart, L. 1984, MNRAS, 210, 497
- Sandage & Visvanathan (1978) Sandage, A. & Visvanathan, N. 1978, ApJ, 223, 707
- Schlegel et al. (1998) Schlegel, D. J., Finkbeiner, D. P., & Davis, M. 1998, ApJ, 500, 525
- Schuberth et al. (2010) Schuberth, Y., Richtler, T., Hilker, M., et al. 2010, A&A, 513, A52
- Schuberth et al. (2012) Schuberth, Y., Richtler, T., Hilker, M., et al. 2012, A&A, 544, A115
- Schwarzschild (1993) Schwarzschild, M. 1993, ApJ, 409, 563
- Schweizer (1980) Schweizer, F. 1980, ApJ, 237, 303
- Scorza et al. (1998) Scorza, C., Bender, R., Winkelmann, C., Capaccioli, M., & Macchetto, D. F. 1998, A&AS, 131, 265
- Scott et al. (2014) Scott, N., Davies, R. L., Houghton, R. C. W., et al. 2014, MNRAS, 441, 274
- Scott et al. (2013) Scott, N., Graham, A. W., & Schombert, J. 2013, ApJ, 768, 76
- Sengupta & Balasubramanyam (2006) Sengupta, C. & Balasubramanyam, R. 2006, MNRAS, 369, 360
- Sikkema et al. (2007) Sikkema, G., Carter, D., Peletier, R. F., et al. 2007, A&A, 467, 1011
- Simien & Prugniel (1997a) Simien, F. & Prugniel, P. 1997a, A&AS, 122, 521
- Simien & Prugniel (1997b) Simien, F. & Prugniel, P. 1997b, A&AS, 126, 15
- Simien & Prugniel (1997c) Simien, F. & Prugniel, P. 1997c, A&AS, 126, 519
- Skrutskie et al. (2006) Skrutskie, M. F., Cutri, R. M., Stiening, R., et al. 2006, AJ, 131, 1163
- Sluis & Williams (2006) Sluis, A. P. N. & Williams, T. B. 2006, AJ, 131, 2089
- Smethurst et al. (2018) Smethurst, R. J., Masters, K. L., Lintott, C. J., et al. 2018, MNRAS, 473, 2679
- Sommer-Larsen & Toft (2010) Sommer-Larsen, J. & Toft, S. 2010, ApJ, 721, 1755
- Spavone et al. (2017) Spavone, M., Capaccioli, M., Napolitano, N. R., et al. 2017, A&A, 603, A38
- Spiniello et al. (2015) Spiniello, C., Napolitano, N. R., Coccato, L., et al. 2015, MNRAS, 452, 99
- Stark (1977) Stark, A. A. 1977, ApJ, 213, 368
- Statler (1987) Statler, T. S. 1987, ApJ, 321, 113
- Statler (1994) Statler, T. S. 1994, ApJ, 425, 500
- Statler & Smecker-Hane (1999) Statler, T. S. & Smecker-Hane, T. 1999, AJ, 117, 839
- Strader et al. (2011) Strader, J., Romanowsky, A. J., Brodie, J. P., et al. 2011, ApJS, 197, 33
- Tal et al. (2009) Tal, T., van Dokkum, P. G., Nelan, J., & Bezanson, R. . 2009, AJ, 138, 1417
- Teodorescu et al. (2011) Teodorescu, A. M., Méndez, R. H., Bernardi, F., et al. 2011, ApJ, 736, 65
- Teodorescu et al. (2005) Teodorescu, A. M., Méndez, R. H., Saglia, R. P., et al. 2005, ApJ, 635, 290
- Thomas et al. (2009) Thomas, J., Jesseit, R., Saglia, R. P., et al. 2009, MNRAS, 393, 641
- Tody (1993) Tody, D. 1993, in Astronomical Society of the Pacific Conference Series, Vol. 52, Astronomical Data Analysis Software and Systems II, ed. R. J. Hanisch, R. J. V. Brissenden, & J. Barnes, 173
- Tonry et al. (2001) Tonry, J. L., Dressler, A., Blakeslee, J. P., et al. 2001, ApJ, 546, 681
- Trujillo et al. (2007) Trujillo, I., Conselice, C. J., Bundy, K., et al. 2007, MNRAS, 382, 109
- Trujillo et al. (2006) Trujillo, I., Förster Schreiber, N. M., Rudnick, G., et al. 2006, ApJ, 650, 18
- Tsatsi et al. (2017) Tsatsi, A., Lyubenova, M., van de Ven, G., et al. 2017, A&A, 606, A62
- van den Bergh (1961) van den Bergh, S. 1961, AJ, 66, 562
- van der Marel et al. (1994) van der Marel, R. P., Rix, H. W., Carter, D., et al. 1994, MNRAS, 268, 521
- van Dokkum et al. (2010) van Dokkum, P. G., Whitaker, K. E., Brammer, G., et al. 2010, ApJ, 709, 1018
- Veale et al. (2018) Veale, M., Ma, C.-P., Greene, J. E., et al. 2018, MNRAS, 473, 5446
- Veale et al. (2017) Veale, M., Ma, C.-P., Thomas, J., et al. 2017, MNRAS, 464, 356
- Veljanoski et al. (2014) Veljanoski, J., Mackey, A. D., Ferguson, A. M. N., et al. 2014, MNRAS, 442, 2929
- Viaene et al. (2018) Viaene, S., Sarzi, M., Baes, M., & Puerari, I. 2018, MNRAS, 474, L47
- Walsh et al. (2015) Walsh, J. R., Rejkuba, M., & Walton, N. A. 2015, A&A, 574, A109
- Weijmans et al. (2009) Weijmans, A.-M., Cappellari, M., Bacon, R., et al. 2009, MNRAS, 398, 561
- Weijmans et al. (2014) Weijmans, A.-M., de Zeeuw, P. T., Emsellem, E., et al. 2014, MNRAS, 444, 3340
- Wellons et al. (2016) Wellons, S., Torrey, P., Ma, C.-P., et al. 2016, MNRAS, 456, 1030
- Wu et al. (2014) Wu, X., Gerhard, O., Naab, T., et al. 2014, MNRAS, 438, 2701
- Wuyts et al. (2010) Wuyts, S., Cox, T. J., Hayward, C. C., et al. 2010, ApJ, 722, 1666
- Young et al. (2006) Young, L. M., Rosolowsky, E., van Gorkom, J. H., & Lamb, S. A. 2006, ApJ, 650, 166
Appendix A Testing the adaptive kernel smoothing procedure on simulated data
Our procedure for the measurement of the mean velocity and velocity dispersion fields from the observed LOS velocities of the PNe is based on performing a weighted local average, where the weights depend on the local density of tracers. The derived quantities depend on how well the detected PNe statistically sample the parent galaxy in the phase space. In particular the spatial distribution of the PNe plays an important role, as the smoothing averages over objects that are close together on the sky. Appendix A.1 describes what determines the observed PN spatial distribution and how this, combined with a smoothing procedure, may affect the results. Appendices A.2 and A.3 study and quantify these effects on a simulated galaxy (with variable number of tracers and ratio) and on simulated velocity fields, with the same spatial distribution as the observed galaxies. We found that the smoothing procedure does not create artifacts in the velocity fields above the level; any features above this threshold are probably real.
A.1 PN spatial distribution and completeness
The observed PN spatial distribution depends on several factors. The most evident one is the incompleteness in the central high surface brightness regions because of the difficulty in detecting faint point sources against a bright background (Arnaboldi et al. in prep., Coccato et al. 2009). This is a strong function of the radius and it is quantified by the completeness function, the fraction of detected objects in different radial ranges.
In addition, the PN number density is proportional to the local surface brightness of the galaxy. This means that the number of tracers decreases with radius following the steep decrease of the surface brightness, and features in the surface brightness distribution may generate under- or over-densities of PNe. Of course at our typical number of tracers () these features in density are barely distinguishable from statistical effects.
The adopted smoothing procedure takes into account the natural non-uniformity of the PNe distribution through the use of an adaptive kernel technique, which optimizes the size of the kernel to the local density of tracers. Nevertheless a local average of the velocities over a non-uniform spatial distribution, combined with the statistics in the LOSVD sampling, may in principle generate features in the kinematic maps or biases in the estimate of the kinematic parameters. On the other hand, averaging over voids or over sparsely distributed tracers unavoidably leads to over-smoothed velocity amplitudes and to under-resolved velocity gradients. The residual velocities from the unresolved gradients may artificially boost the dispersion , creating local maxima in the velocity dispersion maps. In appendices A.2 and A.3 we assess the impact of such biases using simulated data.
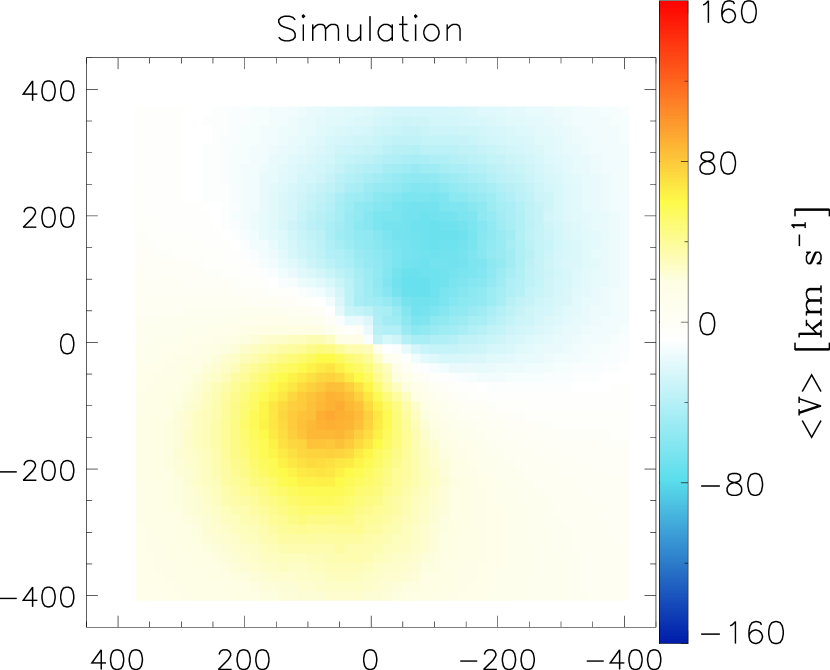
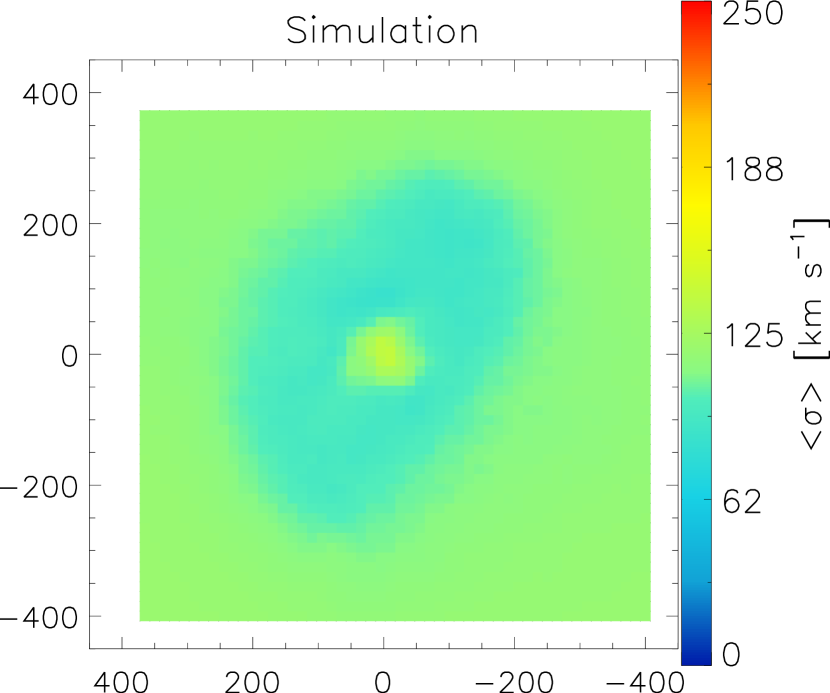
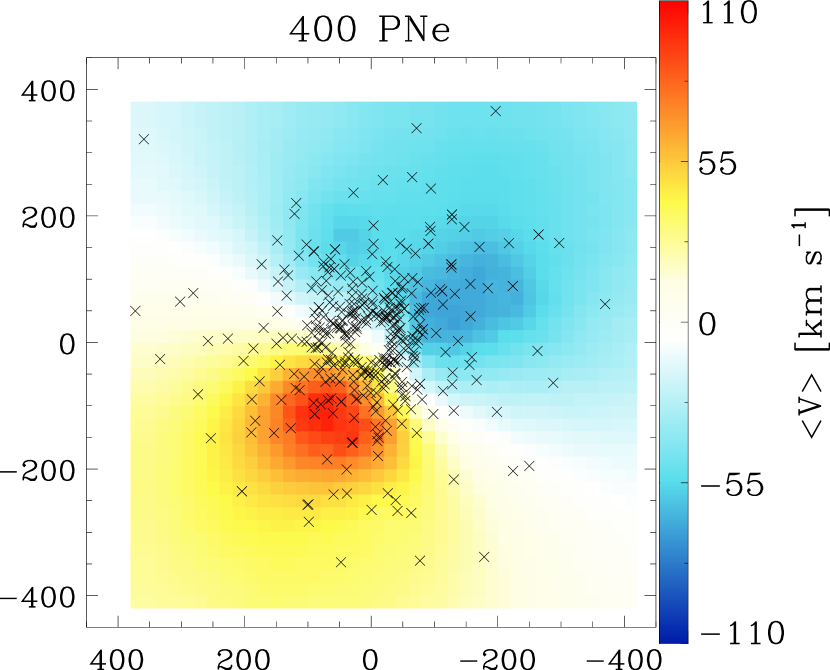
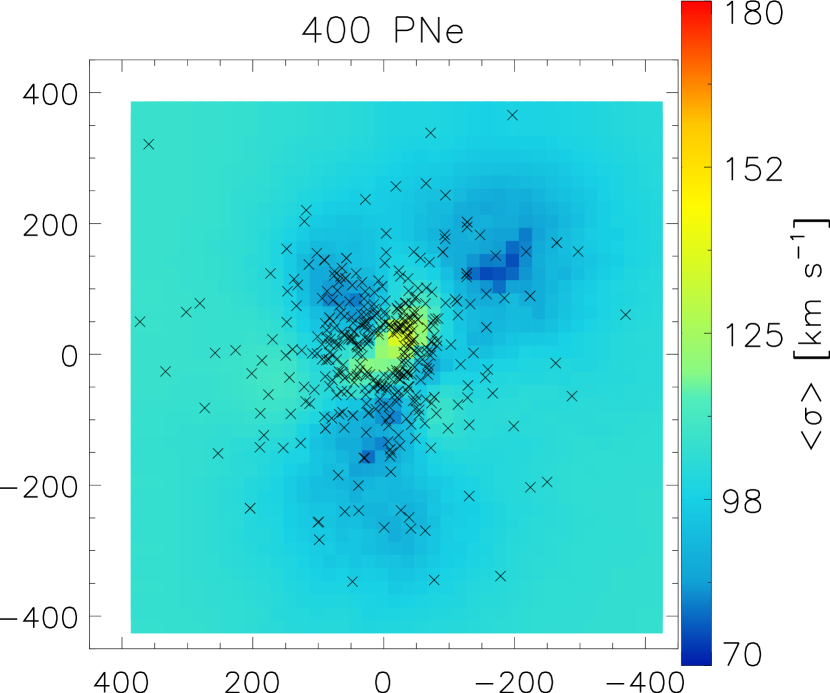
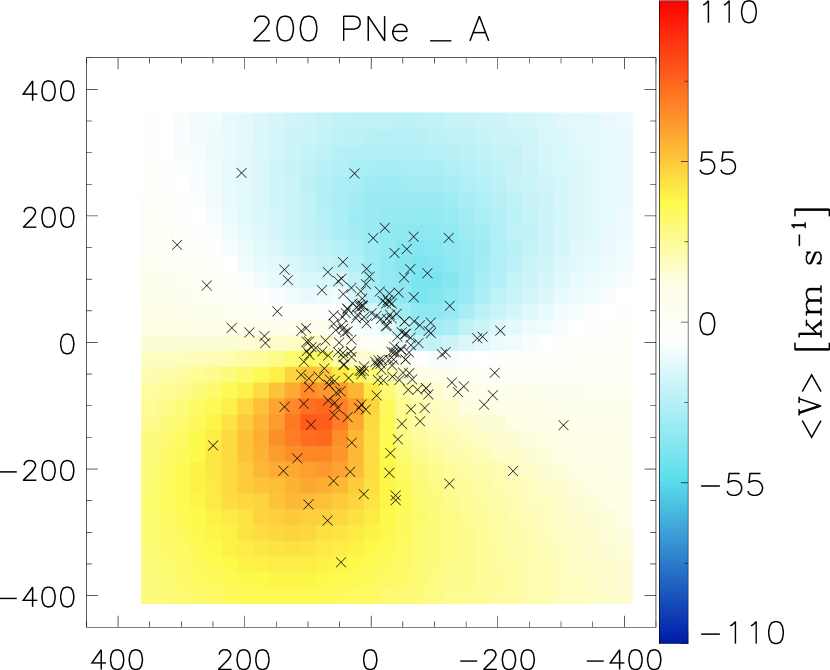
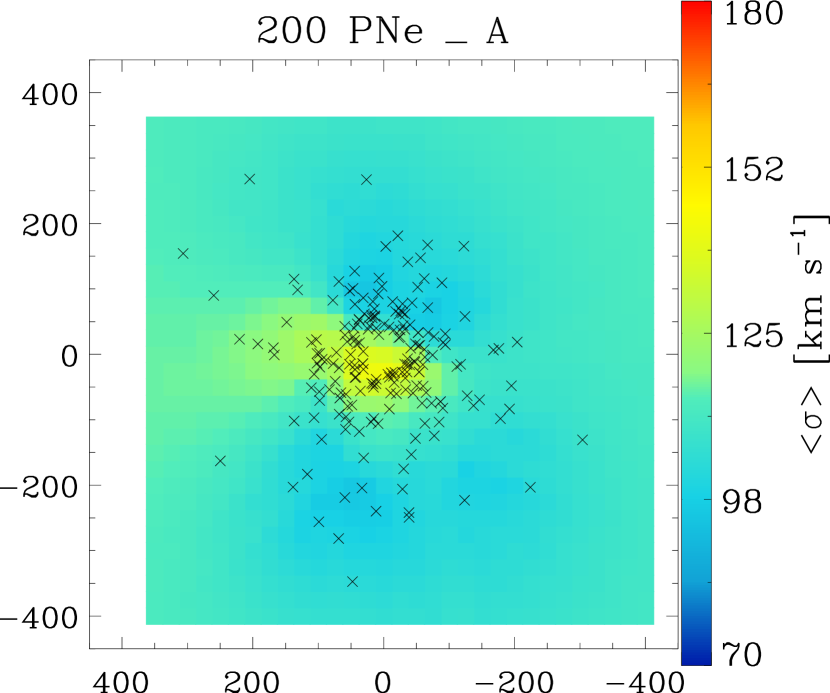
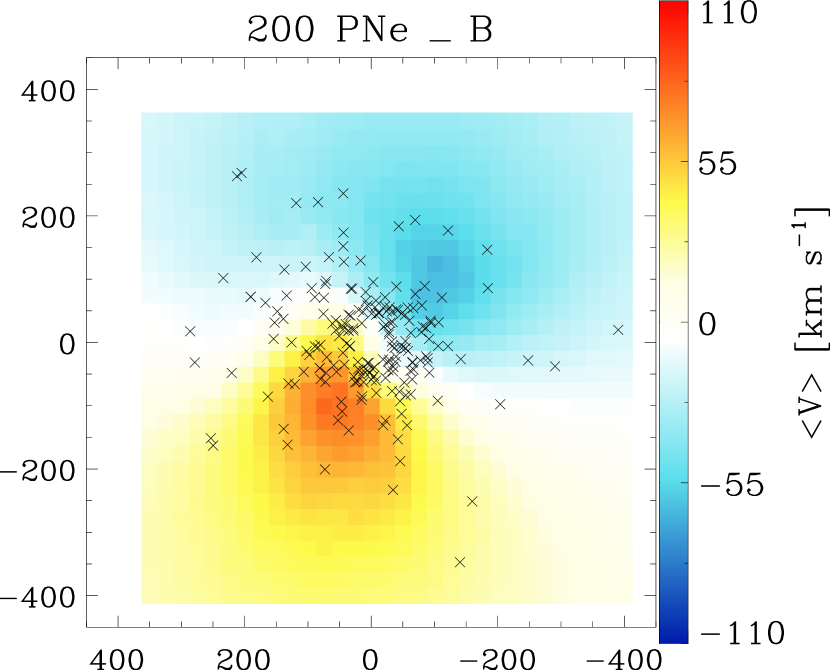
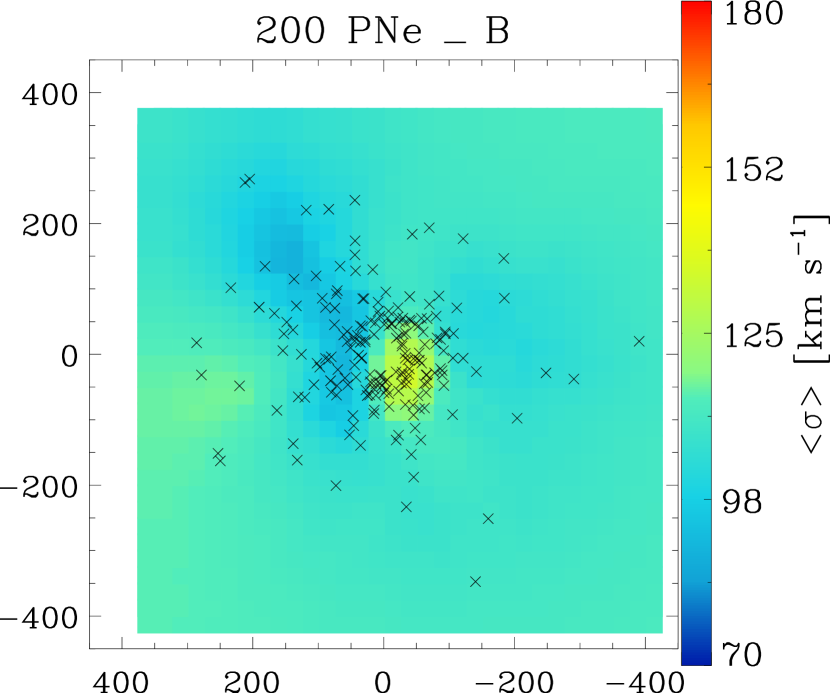
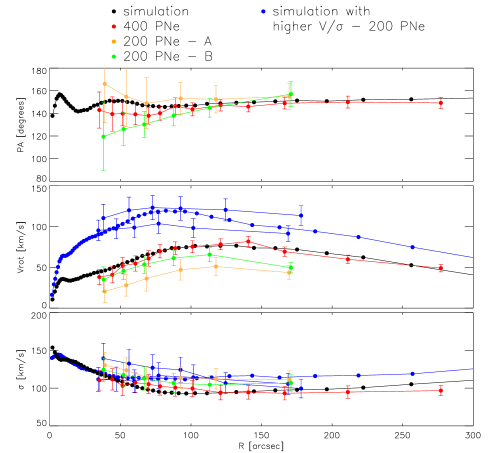
A.2 Tests with data from a simulated galaxy
We used a simulated major merger remnant, sampled by 10000 particles. We reproduced a realistic observed dataset by locating the simulated galaxy at a distance of 20 Mpc, and applying to it a completeness function similar to those observed (see Arnaboldi et al. in prep.). We observed the galaxy in a field of view similar to that of the ePN.S, wide centered on to the galaxy. At this point, the simulated galaxy can be used as a test case for the procedure: we can explore how the results change by varying the number of tracers at our disposal, by selecting randomly typical numbers of observed PNe; different random extractions of tracers give us different statistical realizations of the system, and different projections of the galaxy on the sky plane give us different ratios.
Figure 14 shows an example of such an experiment. The smoothed velocity and velocity dispersion fields are plotted for the 10000 particle simulation, together with the maps for 400 stars and 200 stars. For the 200 particles case we show two typical statistical realizations (A and B) in order to illustrate the effects of limited statistics on the kinematic quantities. The panels at the bottom right show the fitted kinematic position angles, the amplitudes of the rotational velocity, and the azimuthally averaged velocity dispersion profiles in circular bins. The kinematic quantities are in general well recovered within the errors. The simulation is point symmetric in the region selected, and so are the limited statistical realizations. The statistical fluctuations that appear in the smoothed fields usually do not cause a deviation from point symmetry nor a variation of the kinematic position angle larger than the error bars. The velocity dispersion may be marginally boosted at the center of the galaxy, associated with the lack of detections, (see the case of 200 stars in figure 14), but the dispersion profile is recovered within the errors. So we conclude that the procedure to calibrate the smoothing parameters through Monte Carlo simulations (section 3.1.1) works very well in reconstructing the mean properties of the velocity and velocity dispersion fields. Even though the smoothing procedure may create artificial peaks or deeps in the velocity maps, all these features are generally within the level. Any radial trends can therefore be considered significant only if it is outside the statistical uncertainties.
However, we can notice that as the number of tracers drops or the ratio decreases, the amplitude of rotation is systematically underestimated, while the velocity dispersion is systematically higher (see also Napolitano et al. 2001). This happens because lower numbers of stars or higher statistical noise require larger smoothing scales, which eventually become larger than the actual spatial scales of the velocity gradients. Oversmoothed velocity amplitudes, i.e. lower , imply higher in equation (2). There is no way to estimate this offsets unless the mean velocity and velocity dispersion fields of the galaxy are known from independent data, since the effects of the smoothing jointly depend on the local density of tracers, on the ratio, and on the particular statistical realization (e.g. A and B in figure 14), hence they vary from case to case. It is however safe to say that for the galaxies with limited statistics the recovered kinematics provides a lower limit to the amplitude of rotation and an upper limit for the velocity dispersion in the halos.
A.3 Statistical tests with simulated velocity fields on real galaxies
Simulated velocity fields were used to verify the results obtained for the ePN.S sample of galaxies, such as assessing the significance of deviations from point symmetry or the radial trends of the kinematic parameters. These simulated velocity fields are featureless and trend-less (fixed kinematic position angle and constant velocity dispersion) and are built for each galaxy using the positions of the observed PNe. This means that the incompleteness function is already built into the simulated catalogs and is identical to that for the real galaxy under study. In this way we can check how the smoothing procedure correlates spatially close PNe, as the degree of spatial correlation in the models will be identical to that of the real datasets.
The simulated velocity field at the positions of the ith PNe, from the real datasets, is interpolated with the simple function
| (13) |
where is the position angle of the ith PN with coordinates , its distance from the center, and is a scale-length that defines the steepness of the central velocity radial gradient. is chosen to be equal to the maximum fitted rotational amplitude for the galaxy in consideration, while has the dimension of the central void of the detections ( arcsec). We choose to align the rotation of the simulated velocity field with the real photometric position angle of the galaxy, in order to simulate the velocity field of a regular, point-symmetric disk. The model velocity field is sampled with a constant dispersion , which is equal to the mean velocity dispersion of the galaxy under study. This is done by extracting random values from a Gaussian distribution centered at 0 and with dispersion , and adding them to . The assumption of constant dispersion is certainly unrealistic for the central regions of the galaxies, but it is reasonable at large radii. We produced 100 statistical realizations for each galaxy, and each of those is treated as a real dataset for obtaining a total of 100 smoothed velocity fields.
The smoothed velocity fields obtained in this way were used to assess whether an observed feature in the galaxy velocity or velocity dispersion field is real, by studying whether it can be produced by statistical effects in a featureless velocity field, and how typically this happens (see sections 5.1 and 6.3). Also, the 100 models can provide a statistic for the fitted kinematic parameters (equation 9) to check the probability that statistical noise combined with the smoothing procedure artificially produce effects like twists of the kinematic position angle or misalignments with the photometric axes (section 6.4).
Appendix B Photometric profiles and models
In this appendix we report extended photometric data from the literature for three quarters of the ePN.S galaxies to compare with the PN kinematic analysis of this paper, as discussed in section 8.4. Furthermore we present illustrative photometric models which reproduce the main trends seen in the photometric profiles of the galaxies.
B.1 Photometric profiles from the literature
Figure 15 shows ellipticity and profiles from the literature for the subsample of the ePN.S galaxies (references in table 7) with photometric data reaching at least 4 , excluding the merger remnants NGC 1316, NGC 4472, and NGC 5128. For three galaxies, NGC 0584, NGC 2768, and NGC 5866, we marked the outermost photometric measurements that may be affected by perturbations from ongoing interactions (see appendix C). For NGC 1023 and NGC 3384 the presence of multiple components like e.g. the bar affect the and ellipticity profiles. Therefore for these galaxies we flagged the corresponding regions, as described in appendix C. These regions are highlighted with open symbols and black vertical lines in figure 15.
The profiles in figure 15 show more or less pronounced variations with radius for most of the galaxies. All SRs have isophote twists, typically degrees with a very large twist in NGC 4374. For the fast rotating galaxies classified as triaxial in section 6.4 photometric twists range from degrees with the largest twist in NGC 4494 ( degrees). For the other FRs the photometric twists range from degrees, with two galaxies NGC 4278 and NGC 0584 having twists of degrees. The latter objects are consistent with axisymmetry at the resolution of the kinematic survey, but the photometry suggests that some of them might be triaxial as well.
The ellipticity profiles show that while most of the SRs become flatter in the outskirts, the opposite is true for the FRs. Most of the FRs shown in figure 15 have decreasing ellipticity profiles at large radii, approximately at the distance where is observed to drop. The vertical lines indicate the radial range of the kinematic transition discussed in section 8.6. This is also evident from the distribution of the maximum ellipticity and of the outermost measured values in figure 10, and it is consistent with a picture where the FRs are dominated by a disk component in the central regions, embedded in a rounder, dispersion dominated outer component which is triaxial for a fraction of the sample. The exceptions to the decreasing trend in ellipticity at large radii are NGC 1344, a prolate rotator in the halo, NGC 3379 and NGC 4494 which are both very round at all radii, and NGC 2974, NGC 3384 and NGC 4339 for which the small number of tracers does not allow us to resolve any kinematic transition.
B.2 Photometric models of a FR with triaxial halo
Here we describe triaxial photometric models for FR galaxies which explain the magnitude of the photometric twists seen in figure 10, and which are used in the discussion in section 8.4. These simple models are not meant to provide an exact description of the intrinsic shape of a galaxy. Their purpose is to obtain a reasonable representation of the structure of FRs with triaxial halos, to derive what is the maximum isophotal twist expected, and compare it with the observations.
To build these models we use the results of previous studies on the intrinsic shapes of FRs that constrain their central regions. Weijmans et al. (2014) and Foster et al. (2017) found that FRs are close to oblate (), and rather flat (). Guided by the PN kinematic results, we assume that the intrinsic shape of the FR model changes from flat and oblate in the innermost regions, to rounder and mildly triaxial beyond the transition radius in the outer regions, as discussed in section 8.4. Weijmans et al. (2014) and Foster et al. (2017) found that SRs have , but the p value is not well constrained (their analysis failed to converge). The main reason for this is the rather small number of SRs in the and in the SAMI samples. In addition, as argued by Foster et al. (2017), the family of SRs comprises both truly spheroidal pressure dominated systems and flattened non-regular rotators, which might prevent the analysis to converge.
We present here four different photometric models, that have similar axis ratios in the central regions but different halos intrinsic shapes, as well as different realizations in how the transition between central-oblate regions and triaxial halos occurs:
- the Sérsic model (Model 1) is a one component model built using the three-dimensional Sérsic deprojection proposed by Lima Neto et al. (1999) with Sérsic index and variable flattening. The effective radius of the two-dimensional profile is set equal to the average of the observed arcsec. The transition radius is also the average of the measured values for the FRs: . We used for the inner axis ratios, as measured by Weijmans et al. (2014) and Foster et al. (2017). For the outer regions we choose , close to values found by Weijmans et al. (2014) for the SRs. The variation between inner and outer values of flattening is modeled by an arctangent function; the width of the radial transition is chosen to be 50 arcsec (mean , section 8.6) .
- the cored Sérsic halo plus disk model (Model 2) is a two component model built from the sum of deprojections of an spheroid and spheroidal-exponential disk as in Lima Neto et al. (1999), but we added a core with radius arcsec to the deprojected profile. Both the spheroid and the disk have constant flattening: for the former, for the latter. The horizontal scale-height of the disk is such that , i.e. the transition radius is equal to the half-light radius of the disk, as qualitatively observed in section 7.2.1. The effective radius of the two-dimensional profile of the spheroid is arcsec. The luminosity density of the disk is scaled so that it equals the luminosity density of the spheroid at , hence in this model the disk component dominates the luminosity density from the center out to . This choice makes the total integrated light of the disk inside circa times the total luminosity of the spheroidal component inside . The intrinsic axis ratios of the spheroid are , those of the disk are .
- the maximally triaxial cored Sérsic halo plus disk model (Model 3) is built as Model 2 but with axis ratios for the halo.
- Model 4 has a strongly flattened triaxial halo plus disk. The model is built as Model 2 with a cored Sérsic halo, but the axis ratios are .
Each model is observed at 100 random viewing angles. We chose a coordinate system with axes aligned, respectively, with the major, the intermediate, and the minor axis of model ellipsoids, and called and the azimuthal and polar angles that define the direction of the line-of-sight (LOS). We choose the LOS by random samplings of the solid angle centered on the center of the ellipsoids . This makes the probability of observing the galaxy face-on (i.e. ) lower with respect to edge-on (). The models, projected on a plane orthogonal to the LOS, are fitted with ellipses using the IRAF task ELLIPSE (Tody 1993), to derive surface brightness, ellipticity and position angle profiles.
Figure 16 shows the result of this analysis on three models for 6 different values of in bins of 15 degrees. The shapes of the model ellipticity and position angle profiles are qualitatively similar to the observed profiles in figure 15. Large photometric twists ( degrees) are observed for viewing angles degrees for Models 1 and 2, and for degrees for Models 3 and 4. The rate of occurrence of large twists is of order for our models (45% for Model 3), as shown also in figure 10 in section 8.4 where we report the maximum twist versus the mean ellipticity. The distribution of the models in this diagram represent well the location of the ePN.S FRs, for which we observe a fraction having photometric twists larger than degrees. This analysis based on simple triaxial photometric models shows that the presence of small photometric twists, as typically observed for most of the FRs, is consistent with the presence of a triaxial halo, i.e. it is likely that detailed individual models of these galaxies can be constructed that are consistent with the measured kinematic and photometric twist angles.
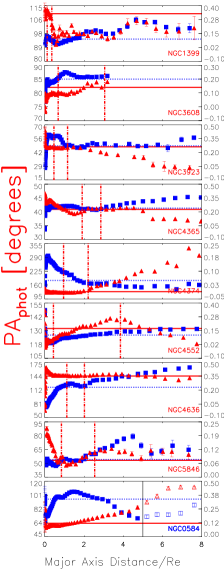
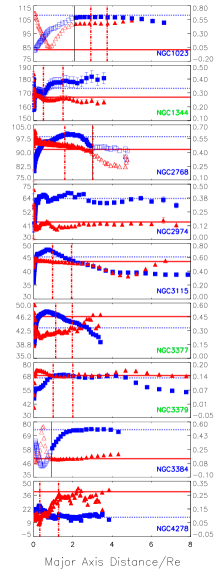
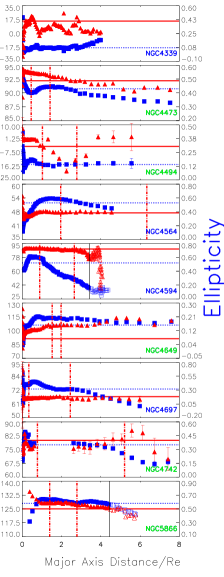
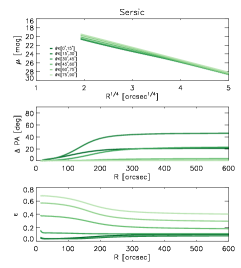
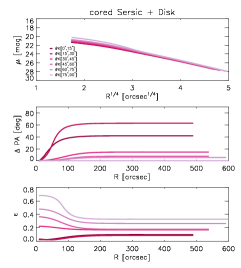
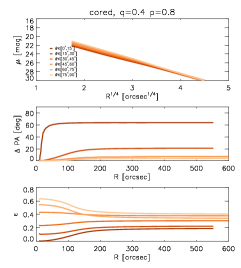
Appendix C Notes on single galaxies and comparison with the literature
C.1 Fast rotators
-
•
NGC 0584. This is the brightest member of a small cluster containing mostly E galaxies (van den Bergh 1961). It is classified as a E4 in the NED catalog, but seems to contain a disk structure (Michard & Marchal 1994). Our PN kinematic data show that the galaxy halo rotates with at least km s-1along the photometric major axis, and has a velocity dispersion of km s-1. The galaxy has central ellipticity which falls to at from whereon increases again. The photometry shows pronounced isophote twist starting at , which steepens beyond . Both the outer increase in ellipticity and the rapid outer isophote twist may be related to the nearby companion galaxy, NGC 0586; therefore we consider only the region where the ellipticity decreases as intrinsic to the galaxy.
-
•
NGC 0821. This is a field E6 galaxy. The velocity field (Emsellem et al. 2004) maps the inner regions of the galaxy where it behaves like a regular rotator along the photometric major axis. The PNe sample, instead, probes the kinematics from to and show a sustained rotation along the photometric minor axis with a maximum amplitude of km s-1, suggesting the triaxiality of the object. No rotation is detected along the major axis. The long-slit data from Proctor et al. (2009) and the integral field map of Arnold et al. (2014) agree in detecting rotation along the photometric major axis, with decreasing amplitude ( km s-1at to very slow rotation at ). They do not detect any rotation along the minor axis, but their data do not extend far beyond along that axis. The kinemetry of Foster et al. (2016), based on the same data used by Arnold et al. (2014) but with a more careful treatment of outliers, shows a radial twist of the between 40 to 60 arcsec towards the same position angle measured from the PNe. Long slit data from Weijmans et al. (2009) and Forestell & Gebhardt (2010) also show some minor axis rotation at large radii. PN data are consistent with the kinematics of the blue GCs (see Pota et al. 2013), which are found to rotate at km s-1along a direction consistent with the photometric minor axis. The red GCs instead appear to faintly counter-rotate with respect to the host galaxy stars. The outer gradient of the velocity dispersion radial profile has been debated in the literature, with implications on the inferred dark matter content of the galaxy. The PN data combined with the long slit stellar kinematics show a decrease of the velocity dispersion as a function of radius, consistently as both red and blue GCs show, while Proctor et al. (2009) and Forestell & Gebhardt (2010) found a flat profile within 100 arcsec.
-
•
NGC 1023. This is a barred lenticular galaxy (SB0), brightest member of a group of 13 galaxies (Tonry et al. 2001). It has a small companion NGC 1023A, which is probably interacting with the main galaxy (Sancisi et al. 1984), but it is likely too small to cause significant disruptions in the dynamical state of the main galaxy (Noordermeer et al. 2008). The velocity map (Emsellem et al. 2004) covers the innermost regions of the galaxy, up to half effective radii, and displays rotation with maximum amplitude of km s-1and strong twist of the zero-velocity line. The stellar kinematics along the major axis of Debattista et al. (2002) and Boardman et al. (2017) show that the rotation continues to increase mildly in the outer regions exceeding km s-1beyond . Both the PN and SLUGGS (Arnold et al. 2014) velocity maps show decreasing rotation beyond , (see also Noordermeer et al. 2008; Coccato et al. 2009; Cortesi et al. 2013b). The galaxy does not show any twist of the kinematic position angle or any misalignment with the photometric axis. The non zero third order harmonics amplitudes describe a rather cylindrical velocity field. The velocity dispersion map shows minimum values ( km s-1) at the location of the disk, while the outermost (bulge) PNe are hotter ( km s-1). The photometric position angle profile is influenced by the presence of the bar at (Barbon & Capaccioli 1975), therefore we excluded these regions from our discussion of the photometric twists.
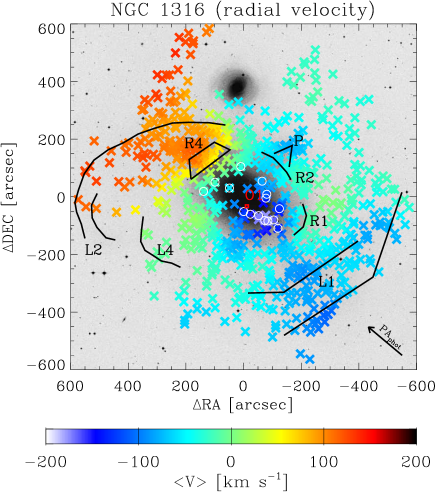
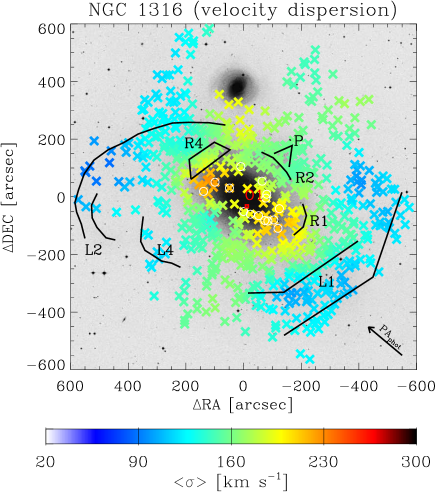
Figure 17: Smoothed velocity field and velocity dispersion field of NGC 1316 shown on the DSS image; north is up, east is left. The circles highlight the PNe belonging to a structure in the phase space, discussed in the text. The black contours trace features in the surface brightness distribution (designations from Schweizer 1980). In red is marked the position of the feature O1 observed by Richtler et al. (2014). The arrow at the bottom right shows the direction of the . -
•
NGC 1316. This is a giant elliptical (also classified as a peculiar S0), member of the Fornax cluster (Fornax A). NGC 1316 is a known merger remnant. Its photometric substructures were mapped for the first time by Schweizer (1980), and were recently studied by Iodice et al. (2017). The PN velocity field is highly asymmetric, showing that the galaxy is in a non-equilibrium phase. The modeling with a point-symmetric rotation model gives an approximate description of the properties of the galaxy. The fit of the parameter of the rotation model (see equation 10) in radial bins shows the presence of peculiar bulk motions in groups of PNe. There is no kinematics from integral field spectroscopy in literature, and the comparison with the long-slit observations from Bedregal et al. (2006) shows general good agreement with our data in the regions of overlap. The PNe in the halo of NGC 1316 (figure 17) reveal that the galaxy rotates along the major axis with an amplitude of km s-1, as already observed by Arnaboldi et al. (1998); McNeil-Moylan et al. (2012). The structures in the velocity field can be spatially associated with corresponding surface brightness features in the same location. There is an overdensity of PNe on the north-eastern part, co-located spatially with the ripple R4 (the designations of the photometric features are from Schweizer 1980, and their positions are indicated in black in figure 17), with velocities that do not have a point symmetric counterpart. Other groups of PNe that result in non-point-symmetric velocities are those possibly related with the loop L1, on the south-west side, and to the plume P in the north-west. Figure 2 shows that the PNe of NGC 1316 in the innermost radial bin ( arcsec) have a velocity offset of km s-1with respect to the systemic velocity. This is produced by a group of relatively slower PNe with mean velocity km s-1and dispersion km s-1(highlighted in figure 17 with white circles, along with the photometric feature O1 found by Richtler et al. 2014, in red). These PNe are not associated with any substructures in the light, and the fact that they are very localized in the phase space challenges (but does not rule out) the possibility that they could be contaminants. More likely this kinematic feature is the result of a combination of spatial incompleteness and differential absorption from localized dust in the galaxy, producing local lacks of detections in the phase space and so more negative smoothed velocities . A more detailed study is beyond the scope of this paper.
-
•
NGC 1344. This galaxy, also known as NGC 1340, is an E5 elliptical belonging to the Fornax cluster. It is characterized by the presence of internal and external concentric shells (Malin & Carter 1980), as consequences of a recent merger activity. The smoothed velocity field does not deviate from point symmetry, however it shows that the galaxy in the outskirts rolls around the photometric major axis. The velocity dispersion field shows a gently decreasing profile. Unfortunately there is no integral field stellar kinematics available for a comparison with the PNe kinematics. The long slit stellar kinematics (Teodorescu et al. 2005) show sustained rotation along the photometric major axis that reaches km s-1at and a decreasing velocity dispersion. The values from the spectroscopy are in agreement with those found with the PN data. We do not detect such an strong rotation, probably because of the different radial coverage of the PN data.
-
•
NGC 2768. This S0 is a field galaxy (Madore et al. 2004) or member of a poor group (Fouque et al. 1992). NGC 2768 has a cylindrical velocity field (Emsellem et al. 2004) whose amplitude remains constant at around km s-1from the innermost regions (Emsellem et al. 2004) to the outskirts (see Proctor et al. 2009; Pota et al. 2013). Our velocity map is in good agreement with that presented by Arnold et al. (2014) and extends it beyond 6. There is some discrepancy between the PN and the kinemetry fit from Foster et al. (2016) in the innermost radial bins where the disk strongly dominates. This is due to the fact that the smoothed PN velocity field in these bins is an average over the fast rotating PNe in the disk and the more slowly rotating PNe from the spheroid. A kinematic study of the different components of this galaxy was published by Cortesi et al. (2013b). At larger radii () the contribution of the disk weakens and the PN kinematics trace the spheroid. In this region we find a constant sustained ( km s-1) rotation along the photometric major axis. The velocity dispersion profile is flat at km s-1. The PN smoothed velocity field of NGC 2768 shows localized, small scale deviations from point symmetry. These asymmetries do not influence the kinematic analysis, but we used the unfolded catalog to build the velocity fields. The light distribution shows asymmetries beyond kpc radius (Duc et al. 2015) which cause an increased isophote twist beyond kpc. The PN velocity field is aligned with the major axis except in the last bin which could be related to these asymmetries. Therefore the galaxy is classified as consistent with axisymmetry. The PN kinematics agrees with that of GCs. Pota et al. (2013) found significant rotation only for the red GCs along the photometric major axis and with constant amplitude. Their velocity dispersion decreases with radius.
-
•
NGC 2974. This is an elliptical (E4) field galaxy. Its kinematics was mapped by the SAURON survey (Emsellem et al. 2004), showing that the galaxy is rotating at km s-1along the photometric major axis, while the velocity dispersion has a steep decreasing profile. PN kinematic data show that the galaxy halo rotates at least at km s-1along the photometric major axis, and has a velocity dispersion of km s-1.
-
•
NGC 3115. This is an S0 associated with a loose group of galaxies (Fouque et al. 1992). It has a nearly edge-on disk ( degrees) which flares outwards (Capaccioli et al. 1987). The long slit spectroscopy from Norris et al. (2006) and the IFS observations of Guérou et al. (2016) show that the rotation velocity increases steeply from the innermost regions to km s-1around . The major axis profile from Guérou et al. (2016) offset by 20 arcsec along the minor axis show that also the spheroidal component has pronounced rotation. The velocity dispersion field is colder ( km s-1) in the region dominated by the disk, and hotter along the minor axis (km s-1). The kinemetry of Foster et al. (2016) on SLUGGS data show that the amplitude of rotation decreases from Re outwards. The PN data show a cylindrical velocity field with gently decreasing rotation amplitude reaching km s-1at , where the spheroid dominates. The has a constant misalignment of degrees with respect to . By comparison the kinemetry from Foster et al. (2016) in figure 6 has degrees misalignment at 200” major axis radius, slightly offset from the in the same direction as the PNe, showing that both datasets agree within the errors. This misalignment is probably related to perturbations at the interface between the disk and the spheroid, visible as deviations from axisymmetry in the photometry of the disk component. Capaccioli et al. (1987) found that the spheroidal component of this galaxy shows a photometric twist of degrees, from degrees at arcsec to degrees at 350 arcsec. The disk instead flares (figure 23 from Capaccioli et al. 1987) and has a warp of few degrees (their figure 24) in the same direction of the PN velocity field. The same features are visible in the photometry of Guérou et al. (2016) (their figure 11) and in new observations with the VST telescope (VEGAS survey, Iodice private communication). This shows that NGC 3115 is indeed a complicated case, and we therefore do not include it in the sample of galaxies with triaxial halo.
-
•
NGC 3377. It is an E6 galaxy in the Leo I group. The absorption line kinematics (Coccato et al. 2009; Emsellem et al. 2004; Foster et al. 2016) shows that the galaxy displays a disk-like rotation in the inner regions, which starts to decrease at . Our analysis of the PN kinematics shows that the decreasing trend continues out to large radii, where it becomes km s-1at and km s-1beyond . The kinematic major axis position angle twists with radius in the outskirts in agreement with Foster et al. (2016). The velocity dispersion at large radii decreases very gently with radius, from km s-1at 1 and to km s-1at 8 . This is consistent with the GC study of Pota et al. (2013), whose kinematics reaches . While the red GCs show a constant rotation of km s-1, the blue ones do not rotate significantly in agreement with the PNe. The velocity dispersion of the whole GC sample is consistent with that from PNe.
-
•
NGC 3379. This is the largest galaxy in the Leo I group, classified as an E1. The PN system of this galaxy is has been widely studied in literature (Ciardullo et al. 1993; Romanowsky et al. 2003; Sluis & Williams 2006). The velocity maps from Emsellem et al. (2004) reveal that the galaxy rotates regularly along its photometric major axis ( km s-1), while the velocity dispersion has a central peak of km s-1and it decreases to km s-1around . Then, the long slit data of Statler & Smecker-Hane (1999) and Weijmans et al. (2009) show that the profile gently declines to km s-1at . The PN smoothed velocity field is in good agreement with the inner kinematics and extends it to . We find that the galaxy has a rotation along an axis that twists from the photometric major axis position angle ( at arcsec) towards higher values at large radii. We observe the onset of a rotation along the minor axis at . This is reflected in the trend of the fitted kinematic position angle and in the amplitudes of the third order harmonics. The amplitude of this additional rotation is km s-1. At the moment there are no integral field kinematic data covering these large distances from the center of the galaxy. The velocity dispersion map shows that the decline continues up to where it reaches values around 70 km s-1.
-
•
NGC 3384. This lenticular galaxy is a member of the Leo I group (Fouque et al. 1992). We find a rotation velocity of km s-1at , consistent with the rotation amplitude published by Krajnović et al. (2011). We do not observe any twist of the kinematic position angle or any misalignment with the photometric one, and the motion is that of a regular rotator. The velocity dispersion map in Emsellem et al. (2004) shows that the has a double peak at the center ( km s-1), and a declining profile that reaches km s-1at . The PN data show a velocity dispersion of km s-1. Cortesi et al. (2013b) performed a kinematic analysis of the disk and spheroid component separately. The photometric study of Meusinger & Ismail (2007) showed the presence of an ”inner component” and and ”elongated” component, visible in the profiles as a local minimum at and a local maximum at . Therefore we considered only the regions at in our discussion in section 8.4.
-
•
NGC 3489. This S0 galaxy belongs to the Leo I group. The kinematic map (Krajnović et al. 2011) shows a fast rotation along the photometric major axis, whose amplitude reaches km s-1at . PN data show that the halo of this galaxy is also rotating at km s-1. The dispersion is around 80 km s-1, consistent with Cappellari et al. (2011). We refer to Cortesi et al. (2013b) for a kinematic analysis of the the disk and spheroid component separately.
-
•
NGC 4278. This a rather round elliptical galaxy (E1-2), member of the Coma I group. The kinematic map Krajnović et al. (2011) shows that stars are regularly rotating only within along a direction slightly offset from the photometric major axis, while there is very weak or no rotation farther out. The kinemetry of Foster et al. (2016) shows that the galaxy does not significantly rotate beyond . The PN velocity field does not show any significant rotation, hence also the kinematic position angle is not very well defined. Pota et al. (2013) do not find any evidence of rotation for the metal rich GCs, while the blue metal poor GCs display a weak rotation in the outer regions, along a direction between the major and the minor axes. The velocity dispersion falls rapidly with radius from a central value of km s-1to km s-1at (Bender et al. 1994; Emsellem et al. 2004; Foster et al. 2016). Our map shows values of almost constant at km s-1, in good agreement with the literature.
-
•
NGC 4339. This is a member of the Virgo cluster, classified as intermediate type between E0 and S0. It is regular FR, showing no misalignment between the photometric and kinematic major axis (Cappellari et al. 2011). The PN motion agrees with the stellar kinematics showing a rotation of km s-1and a dispersion of km s-1.
-
•
NGC 4473. This Virgo galaxy is an E5 disky elliptical. It is well known for its multicomponent central kinematics (Emsellem et al. 2004): it is a fast but non-regular rotator ( km s-1, along the photometric major axis) and the velocity dispersion map displays a double peak, which have been interpreted as the presence of a counter-rotating disk (Cappellari et al. 2007), maybe formed in binary disk major mergers (Bois et al. 2011). We detect a low amplitude rotation of km s-1along a direction tilted with respect to the photometric major axis. The kinematics from integrated light of Foster et al. (2013) already proved this object to be triaxial. Our velocity dispersion map does show the double peaked structure along the major axis, where km s-1. The velocity dispersion decreases to km s-1at .
-
•
NGC 4494. This is an E1 galaxy in the NGC 4565 group. The velocity map from Krajnović et al. (2011) shows a kinematically distinct core. The galaxy rotates almost constantly at km s-1up to (Napolitano et al. 2009; Foster et al. 2016). In the halo we find that this amplitude decreases with radius. There is evidence for an additional component rotating along the photometric minor axis at km s-1, as also shown by the twist of the . The velocity dispersion field shows a peak at the center ( km s-1), and then decreases to km s-1at , in very good agreement with the stellar kinematics. The four-fold structure that appears in the map is a result from smoothing procedure, and reflects some unresolved gradient in the velocity field. The trend of the rotation amplitude from PN kinematics seems to be confirmed by the kinematic map from Arnold et al. (2014), but their data do not extend out in radii enough to show any rotation along the minor axis. The kinematics of GCs is studied by Foster et al. (2011) out to . They found that the metal poor GCs rotate with similar amplitude as the galaxy stars, while the metal-rich GCs show marginal rotation. The velocity dispersion profile of the global GC sample is consistent with that of the stars.
-
•
NGC 4564. NGC 4564 is an E4 galaxy in the Virgo cluster. It shows a prominent stellar disk along the apparent major axis, so that it has also been referred as an S0 (Michard & Marchal 1994). We agree with the stellar kinematic from Foster et al. (2016) and we extend it beyond , where the galaxy is still clearly rotating along its photometric major axis ( km s-1). The velocity dispersion profile is decreasing, from the central peak of 180 km s-1(Emsellem et al. 2004) to km s-1at .
-
•
NGC 4594. NGC 4594, also known as ”the Sombrero” (M 104), is an SAa galaxy in the Virgo cluster. It has an extremely bright bulge, while its disk contributes only 10% of the light (Burkhead 1986) and has pronounced dust lanes. Kinematics from line-profile measurements show that the galaxy rotates along its major axis reaching km s-1at , where the rotation curve flattens to a constant amplitude (Kormendy & Illingworth 1982; van der Marel et al. 1994). The velocity dispersion declines from the central value of km s-1to values close to km s-1where the disk component dominates. The bulge, instead, has a dispersion remarkably constant at km s-1. Our PN data extend beyond , but there is a void in the detections along the major axis because of the dust lane. For this reason the PNe do not trace the fast rotating disk, and their kinematics is in very good agreement with the integrated light kinematics of Kormendy & Westpfahl (1989) from a slit parallel to the major axis, offset by 30 arcsec. Extinction effects are probably also responsible for the slight asymmetry of the smoothed velocity field, so the kinematic analysis is performed on the unfolded catalog. These asymmetries are localized and do not significantly influence the kinematic results. The only studies of the kinematics of this galaxy at large radii is from Bridges et al. (2007) and Dowell et al. (2014) using GCs. The latter sample distances out to 24’ with 360 tracers, finding little or no evidence of rotation in the GC system as a whole, and within the red and blue subpopulations. The photometry shows ellipticity less than 0.1 and a correspondingly uncertain large isophote twist beyond 350” which we do not include in the photometric analysis.
-
•
NGC 4649. Also known as M 60, it is an E2 galaxy in the Virgo cluster. It forms a close optical pair with NGC 4647, but the lack of evidence of strong tidal interaction features (e.g. Young et al. 2006) suggests that the galaxies are at different distances. The velocity map shows a regular, cylindrical rotation of km s-1(Krajnović et al. 2011), while the dispersion has a central peak of km s-1and it decreases to km s-1at 0.5. The kinematic maps from Arnold et al. (2014) shows that the cylindrical rotation extends up to , while there the dispersion is km s-1. The PN data extend out to 5 . The smoothed PN velocity field shows that the amplitude of the rotation along the photometric major axis decreases with radius, and no rotation along the major axis is detected beyond . In the outer regions, instead, the system rotates along a nearly orthogonal direction, suggesting a triaxial halo. The velocity dispersion is roughly constant at km s-1from 1 to 5 . We see a slight bump in the dispersion profile at 3 , but it may be associated to an unresolved velocity gradient. There are several studies of the GC kinematics in NGC 4649. The most recent, with the largest sample is from Pota et al. (2015). The red GCs display a nearly constant rotation with radius along the photometric major axis. Interestingly they observe a dip in rotation velocity between 100 and 200 arcsec, where we observe the inner rotation decreasing also. The blue GCs also show hints of rotation at all radii, with lower amplitude, and generally along the major axis of the galaxy. Blue GCs also appear to have a minor axis rotating component at 300 arcsec, coinciding with the one found with the PNe. The velocity dispersion of GCs is constant at km s-1.
-
•
NGC 4697. This is an E6 galaxy in the Virgo southern extension, belonging to a group of 18 galaxies (Garcia 1993). This galaxy has 535 PN detections by Méndez et al. (2001). In this dataset Sambhus et al. (2006) found evidence for two separate PN populations, with different luminosity functions, spatial distributions, and radial velocities. In particular the secondary population of PNe is found to be azimuthally unmixed and not in dynamical equilibrium. The velocity field shows a rotation along the photometric major axis with amplitude decreasing with radius from the maximum km s-1at to km s-1at . There is a hint for an increase in the amplitude of rotation at larger distances ( km s-1at 4.5). The kinematic position angle is constant, aligned with the photometric major axis. There is a variation of the profile at , but we did not interpreted it as signature of a triaxial halo, as the present dataset still includes the secondary not-in-equilibrium population of PNe. The velocity dispersion steady declines with radius, from km s-1at 0.5 to km s-1at 4.5. The kinematic maps from Krajnović et al. (2011) and Spiniello et al. (2015) show a regular disk-like rotation with a maximum amplitude of 111 km s-1, confirming the trend for the rotation amplitudes that we find. Arnold et al. (2014) also observes a clear decline of the rotation and of the velocity dispersion, in agreement with PN data.
-
•
NGC 4742. This is a field E4 galaxy. It is a faint object, so the number of PN detections is relatively low. We detect a rotation of at least km s-1, in agreement with the stellar kinematics of Davies et al. (1983). The direction of rotation is along a direction misaligned with respect to the photometric position angle. The dispersion decreases from 100 km s-1at 1.5 arcsec (Davies et al. 1983) to below 50 km s-1in the outskirts. The photometric PA profile from Li et al. (2011) shows a jump inside which is in disagreement with Lauer et al. (1995) based on HST data. Because the PA from Lauer et al. (1995) agrees with the outer profile from Li et al. (2011) we therefore use combined ellipticity and PA profiles from both sources.
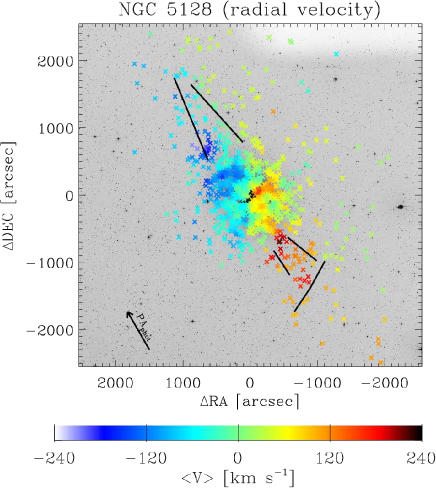
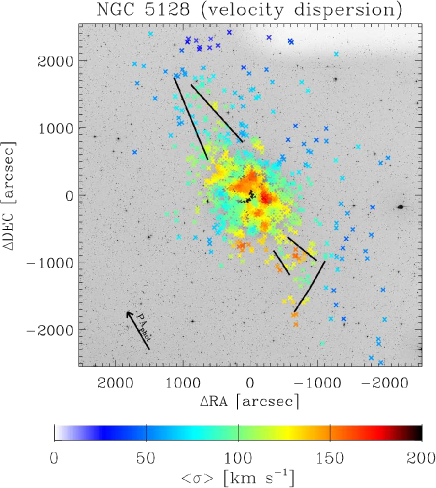
Figure 18: Smoothed velocity field and velocity dispersion field of NGC 5128 shown on the DSS image; north is up, east is left. Features in the surface brightness distribution spatially consistent with features in the PN kinematics are contoured in black. The arrow at the bottom left shows the direction of the . -
•
NGC 5128. Also known as Centaurus A, it is a giant elliptical (often classified as a peculiar lenticular) in the Centaurus group. It shows clear signs of its accretion history in tidal streams and shells (Malin et al. 1983; Peng et al. 2002; Crnojević et al. 2016), evidences of major nuclear activity (see e.g. Neumayer 2010), and jet-induced star forming regions (e.g. Rejkuba et al. 2002). Its kinematics probed by PNe reflects the presence of regions which are not in equilibrium, showing a highly asymmetric and rich in subcomponents velocity field. The fit of the parameter of the rotation model (10) in radial bins shows the presence of peculiar bulk motions in groups of PNe. The galaxy shows a rotation along the photometric major axis (NE direction) with increasing amplitude, from km s-1at arcsec () till at least km s-1at 800 arcsec (). The system also displays strong rotation ( km s-1) along the minor axis, revealing its triaxiality (see also Peng et al. 2004). The deviation from point-symmetry of the kinematics in almost all the radial bins is accompanied by several features in the light. In particular the outermost regions, from 700 arcsec outwards, show the most important kinematic features (Coccato et al. 2013), in correspondence to the elongated structure (sketched with black contours in figure 18) in light extending roughly along the radio jets (Haynes et al. 1983).
-
•
NGC 5866. NGC 5866 is an SA0 galaxy belonging to a loose group (Sengupta & Balasubramanyam 2006). It has a narrow, clear-cut dark lane, running along the disk at an angle with respect to the photometric major axis. It is a regular, disk-like rotator (Krajnović et al. 2011) with a maximum amplitude of km s-1Foster et al. (2016) at , beyond which the rotation decreases to km s-1at . Our velocity map shows that the galaxy keeps rotating at approximately constant speed ( km s-1) at large radii (up to 9 ), with a progressive twist of the kinematic position angle. The PN velocity dispersion map and velocity dispersion profile have values around 90 km s-1that are constant within the errors from 2 up to 9 . We refer to Cortesi et al. (in prep.) for a kinematic study of the disk and spheroid components. The photometric position angle is constant from 30”-80”, then decreasing by degrees until 160” = 4.5 (Michard & Marchal 1993). Beyond 160” the profile becomes more irregular which coincides with a flare or X-like structure on the deep image by Duc et al. (2015) that could be due to tidal debris along a radial orbit nearly aligned with the disk.
-
•
NGC 7457 This is a field S0. The velocity maps from Emsellem et al. (2004) and Arnold et al. (2014) show that this galaxy is a regular rotator along the major axis. Our PN velocity map shows that the rotation velocity is growing with radius, reaching km s-1at . No twisting of the kinematic major axis is observed. The velocity dispersion is relatively low, around km s-1at , km s-1at . There is good agreement between the PN kinematics and the kinemetry from Foster et al. (2016).
C.2 Slow rotators
-
•
NGC 1399. It is a CD galaxy in the Fornax I cluster. We observe a very low amplitude (15 km s-1) rotation inside along the photometric minor axis, and a slow rotation also in the halo (), which almost counter-rotates with respect to the inner regions. The rotation velocity is also very low in the innermost regions as reported by integral light kinematics studies (e.g. Graham et al. 1998; Saglia et al. 2000; Loubser et al. 2008; Scott et al. 2014), which are in good agreement with the PN data. In particular the integral field map from Scott et al. (2014) shows that NGC 1399 does not display important ordered motions in the central regions, while at a radius of ″it rotates along the minor axis ( km s-1). The velocity dispersion, instead, is relatively high: it rises steeply in the inner arcsec, reaching km s-1at the center (e.g. Saglia et al. 2000), while at large radii (from ) the PN flattens at km s-1. McNeil et al. (2010) showed that kinematics of the red GCs of NGC 1399 is in excellent agreement with the PNe.
-
•
NGC 3608. This is an E2 galaxy in the Leo II group. It is known to have a counter-rotating core (Jedrzejewski & Schechter 1988) in the central , aligned with the photometric major axis and rotating at km s-1(Halliday et al. 2001; Emsellem et al. 2004). From galaxy starts to rotate at approximately along the photometric major axis (Foster et al. 2016). The PN kinematics shows that the growing trend continues at larger radii, where the amplitude of rotation reaches km s-1. The twist of the reveals that the system is triaxial. The velocity dispersion decreases from the central value of km s-1to 100 km s-1at (Halliday et al. 2001). We find a constant velocity dispersion profile in the halo ( km s-1).
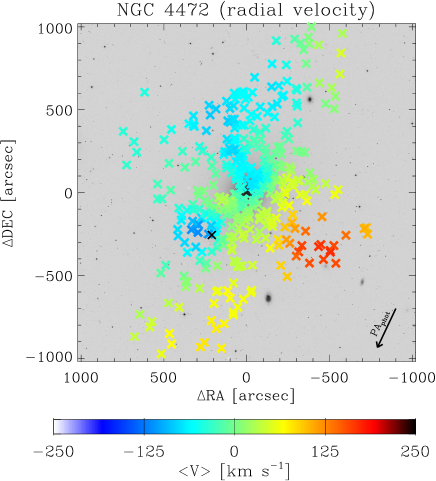
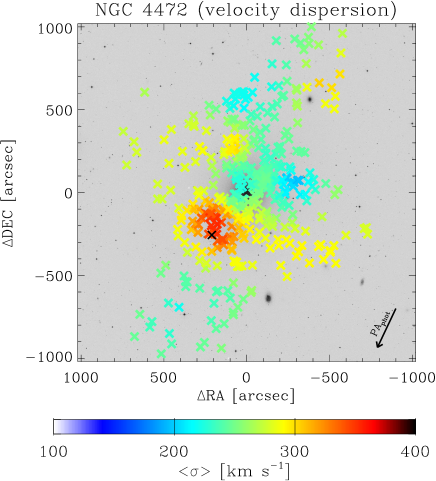
Figure 19: Smoothed velocity field and velocity dispersion field of NGC 4472 shown on the DSS image; north is up, east is left. The black cross marks the position of the in-falling dwarf UGC 7636. The arrow at the bottom right shows the direction of the . -
•
NGC 3923. This an E4-5 galaxy in a group of 8 galaxies (Brough et al. 2006). We detect a cylindrical velocity field along an intermediate direction between the minor and the major axes, which rotate at km s-1. The velocity dispersion is constant around km s-1. Long-slit kinematics from Carter et al. (1998) inside shows that NGC 3923 does not rotate significantly along the photometric major axis for , but it displays a weak rotation ( km s-1) along the photometric minor axis. They also found a falling dispersion profile, from the central value of km s-1to km s-1at . Norris et al. (2012) studied the kinematics of 79 GC/UCD extended to more than . They do not show appreciable rotation, and their velocity dispersion seem constant with radius.
-
•
NGC 4365. It is an E3 galaxy, one of the brightest member of the Virgo cluster. It has a complex kinematic structure with a counter-rotating core (Bender 1988a), aligned with the photometric major axis, and a prolate rotation of km s-1(Davies et al. 2001), which indicates a triaxial potential. Our PN velocity field extends to . The inner kinematics () is compatible with no rotation. We do not detect the rolling about the minor axis that Arnold et al. (2014) report, probably because of the smoothing over the inner velocity gradients. We do measure a significant outer () rotation of km s-1along the major axis, counter-rotating with respect to the kinematically decoupled core. The velocity dispersion map has almost constant values, around km s-1, with slightly lower values in the region along the major axis ( km s-1). The velocity dispersion measured by Davies et al. (2001) shows a inner value of km s-1which decreases to km s-1at . Arnold et al. (2014) measure a km s-1at , consistent with the values found with PNe. Blom et al. (2012), studying the GC kinematics, found that the intermediate metallicity subpopulation (green) rotates along the photometric minor axis, as the stellar population at intermediate radii, while the red GCs rotate only at large radii along the photometric major axis in the opposite direction of the core of the galaxy, in agreement with the PN kinematics at large radii.
-
•
NGC 4374. Also known as M84, it is a bright E1 galaxy in the Virgo cluster. The galaxy does not show significant rotation in the innermost , as reported by Emsellem et al. (2004) and Foster et al. (2016), while the velocity dispersion steeply decreases from 310 km s-1at the center to km s-1at . The PN velocity field shows evidence for rotation only at large radii (), with constant amplitude km s-1and along a direction compatible with the minor axis. The velocity dispersion is rather constant around km s-1up to 6. Our kinematics is in agreement with that from the SLUGGS velocity maps (Arnold et al. 2014; Foster et al. 2016), but their data extend only to . The long slit kinematics of Coccato et al. (2009) reaches almost and agrees in showing no signs of rotation along the major axis, the onset of rotation along the minor, and constant velocity dispersion in the outer regions around km s-1.
-
•
NGC 4472. NGC 4472 (M 49) is an E2 galaxy, the brightest object in the Virgo cluster. It is surrounded by a complex system of diffuse shells and other features in light which are evidences of its recent and still ongoing accretion activity (see Janowiecki et al. 2010; Arrigoni Battaia et al. 2012; Hartke et al. 2018). It is classified as a non regular rotator by Krajnović et al. (2011), who also found evidence for a counter-rotating core. From the galaxy rotates at km s-1(Cappellari et al. 2011; Veale et al. 2017). Beyond the PN data show a complicated and out of equilibrium kinematics. The halo rotates along a direction compatible with the galaxy minor axis. This motion is neither point- nor axi-symmetric, and is dominated by the kinematics of the in-falling satellite, the dwarf UGC 7636. A visual inspection of the smoothed velocity field reveals that the main body of the galaxy would show major axis rotation once the PNe belonging to the satellite are excluded (see Hartke et al. 2018, for a detailed study). While the velocity dispersion profile is flat over at km s-1, we notice a high dispersion feature with km s-1in a position corresponding to the coordinates of UGC 7636.
-
•
NGC 4552. NGC 4552 (M 89) is an E0-1 galaxy in Virgo. It known to possess a kinematically distinct core, with the innermost region rotating at km s-1, and the region outside 0.3 having very weak rotation (Simien & Prugniel 1997b; Emsellem et al. 2004). Our PN smoothed velocity field shows that the galaxy start rotating beyond . The smoothed velocity field reveal that the rotation is about two perpendicular directions. This is reflected in the twist of the kinematic position angle with radius. The velocity dispersion map from the data is consistent with the one from the integrated light (Emsellem et al. 2004), and it shows constant values with radius, around km s-1.
-
•
NGC 4636. This is an E0-1 galaxy in the Virgo cluster. The velocity map from Krajnović et al. (2011) does not show significant rotation in the innermost region (). The velocity dispersion, instead, has a central value of km s-1and it decreases to 190 km s-1at 0.25. The long slit kinematics from Pu & Han (2011) show that the galaxy starts rotating along the minor axis at arcsec (0.2 ), and along the major axis at arcsec (). The profile is gently decreasing along the minor axis, reaching km s-1at 0.5 , while it is rather flat along the major, around 190 km s-1, then it decreases to km s-1where the rotation starts. We detect a weak rotation ( km s-1) along a direction compatible with the minor axis. In addition, in the smoothed velocity map there is evidence for a rotation of comparable magnitude at larger radii () around the major axis, in very good agreement with Pu & Han (2011). The PN velocity dispersion profile decreases abruptly from km s-1at to km s-1at . Schuberth et al. (2012) find a strong rotation signature for the blue GCs ( km s-1along the major axis, but in opposite direction with respect to the outermost PNe). The red GCs have a weaker rotation ( km s-1) along an axis that changes with being aligned with the minor axis to the photometric major axis, in agreement with the PN kinematics. For radii beyond the axis of rotation remains constant along the direction of the major axis. The dispersion profile of the blue GC declines with radius, while the red GCs show values of km s-1.
-
•
NGC 5846. This is an E0 galaxy, the brightest member in a group of ten. Emsellem et al. (2004) detect a low rotation of km s-1and a high central dispersion of 255 km s-1. PN smoothed velocity field is consistent with low amplitude rotation. We find constant values for the velocity dispersion around 180 km s-1. The SLUGGS kinematic maps Arnold et al. (2014); Foster et al. (2016) are consistent with PN data. Pota et al. (2013) showed that neither the GC subpopulations show significant rotation. The velocity dispersion of the red GCs has a flat profile, around values comparable with those found for the PNe. The blue GCs have systematically higher km s-1.
Appendix D Velocity and Velocity Dispersion Fields
The following figures show the smoothed velocity and the velocity dispersion fields for all the galaxies of the sample. The maps are interpolated on a regular grid of coordinates, as described in section 6.1. The fields are rotated such that the photometric major axis is horizontal ( values are listed in table 2); the orientation is specified by the direction of the arrows indicating North and East. The X and Y axes units are arc seconds. The elliptical contours displayed on the velocity fields are ellipses of constant ellipticity as given in table 2, and of major axes radii equal to even multiples of (table 2).
![[Uncaptioned image]](/html/1712.05833/assets/x57.png)
![[Uncaptioned image]](/html/1712.05833/assets/x58.png)
![[Uncaptioned image]](/html/1712.05833/assets/x59.png)
![[Uncaptioned image]](/html/1712.05833/assets/x60.png)
![[Uncaptioned image]](/html/1712.05833/assets/x61.png)
![[Uncaptioned image]](/html/1712.05833/assets/x62.png)
![[Uncaptioned image]](/html/1712.05833/assets/x63.png)
![[Uncaptioned image]](/html/1712.05833/assets/x64.png)
![[Uncaptioned image]](/html/1712.05833/assets/x65.png)
![[Uncaptioned image]](/html/1712.05833/assets/x66.png)
![[Uncaptioned image]](/html/1712.05833/assets/x67.png)
![[Uncaptioned image]](/html/1712.05833/assets/x68.png)
![[Uncaptioned image]](/html/1712.05833/assets/x69.png)
![[Uncaptioned image]](/html/1712.05833/assets/x70.png)
![[Uncaptioned image]](/html/1712.05833/assets/x71.png)
![[Uncaptioned image]](/html/1712.05833/assets/x72.png)
![[Uncaptioned image]](/html/1712.05833/assets/x73.png)
![[Uncaptioned image]](/html/1712.05833/assets/x74.png)
![[Uncaptioned image]](/html/1712.05833/assets/x75.png)
![[Uncaptioned image]](/html/1712.05833/assets/x76.png)
![[Uncaptioned image]](/html/1712.05833/assets/x77.png)
![[Uncaptioned image]](/html/1712.05833/assets/x78.png)
![[Uncaptioned image]](/html/1712.05833/assets/x79.png)
![[Uncaptioned image]](/html/1712.05833/assets/x80.png)
![[Uncaptioned image]](/html/1712.05833/assets/x81.png)
![[Uncaptioned image]](/html/1712.05833/assets/x82.png)
![[Uncaptioned image]](/html/1712.05833/assets/x83.png)
![[Uncaptioned image]](/html/1712.05833/assets/x84.png)
![[Uncaptioned image]](/html/1712.05833/assets/x85.png)
![[Uncaptioned image]](/html/1712.05833/assets/x86.png)
![[Uncaptioned image]](/html/1712.05833/assets/x87.png)
![[Uncaptioned image]](/html/1712.05833/assets/x88.png)
![[Uncaptioned image]](/html/1712.05833/assets/x89.png)