2017 Vol. X No. XX, 000–000
22institutetext: Shanghai Astronomical Observatory, Chinese Academy of Sciences, Shanghai 200030, China
\vs\noReceived []; accepted []
Joint Fit of Warm Absorbers in COS & HETG Spectra of NGC 3783
Abstract
Warm Absorbers (WAs), as an important form of AGN outflows, show absorption in both UV and X-ray band. Using XSTAR generated photoionization models, for the first time we present a joint fit to the simultaneous observations of HST/COS and Chandra/HETG on NGC 3783. Totally five WAs explain well all absorption features from the AGN outflows, which spread a wide range of ionization parameter log from 0.6 to 3.8, column density log from 19.5 to 22.3 cm-2, velocity from 380 to 1060 km , and covering factors from 0.33 to 0.75, respectively. Not all the five WAs are consistent in pressure. Two of them are likely different parts of the same absorbing gas, and two of the other WAs may be smaller discrete clouds that are blown out from the inner region of the torus at different periods. The five WAs suggest a total mass outflowing rate within the range of 0.22-4.1 solar mass per year.
keywords:
galaxies: individual (NGC3783) — quasars: absorption lines — ultraviolet: galaxies — X-ray: galaxies1 Introduction
Warm absorbers (WAs), known as an important form of Active Galactic Nuclei (AGN) feedback, are likely having an effective impact on the host galaxy, and even the intergalactic environment. WAs, the outflowing ionized gas that generates absorption in the X-ray and UV bands, are detected in about 50 Type I Seyfert galaxies either in UV (Crenshaw et al. 1999) or in X-ray band (Reynolds 1997). It offers great opportunities to study the specific processes of gas around black holes such as the angular momentum transfer during accretion, and also how the AGN feedback affects host galaxies.
A lot of efforts have been spent to study the WAs in the past three decades (since identified by Halpern 1984), but nevertheless the WA properties and origins are not fully understood. Nowadays the strategy for WA studies is to focus on a few exceptional Seyfert galaxies, and cumulate a large amount of data, many of which are simultaneous multi-wavelength spectral observations. UV spectrum has higher spectral resolution and accurate dynamic measurements, corresponds to a small number of atomic transitions. In contrast, the X-ray spectrum covers more transitions from ions at various ionization states, but is subject to lower resolution and observation precision (e.g., Kaspi et al. 2002). Combination of High-resolution UV or X-ray spectroscopy brings more comprehensive WA studies (e.g., Costantini 2010). Tens of joint UV-X-ray campaigns have provided much insight into the physical conditions of these absorbing outflows.
However, a broad understanding of these WAs in the two bands has yet to emerge. One important reason is that the ionization levels and kinematics of both the UV absorbers and X-ray WAs are measured through different methods, and frequently there is only partial overlap in the conditions of the two sets of absorbers (Crenshaw et al. 2003). Zhang et al. (2015, hereafter as Z15) upgraded XSTAR111https://heasarc.gsfc.nasa.gov/lheasoft/xstar/xstar.html and provided a method to fit every physical components in UV spectra the same way used in fitting X-ray spectra. As a consequence, the observed spectra can be fitted simultaneously, providing better constrains on the properties of WAs based on the combined information from the UV and X-ray regimes.
Seyfert I galaxy NGC 3783 (41.6 Mpc, from NED222http://ned.ipac.caltech.edu) is a perfect target as it is very bright in the X-ray and UV bands, and exhibits strong absorption features detected with many instruments such as ROSAT, ASCA, Chandra, XMM-Newton, Suzaku, FUSE, HST/STIS, and HST/COS (e.g., Turner et al. 1993; Shields & Hamann 1997; Kaspi et al. 2002; Gabel et al. 2003a; Blustin et al. 2002; Netzer et al. 2003; Krongold et al. 2003; Brenneman et al. 2011). The accumulative exposure time on its nuclear region taken by Chandra/HETG is more than 1 Ms. Simultaneous UV-X-ray observations of NGC 3783 was taken in both 2001 and 2013, which show clear variations in velocity of WAs (Scott et al. 2014). However, the derived physical parameters such as column density , ionization parameter , and velocity , vary from authors to authors among the X-ray studies, while the UV regime is more promising to give precise but less constrained and from individual lines (discussed in Section 5.1).
A major obstacle in the WA studies is that the contribution of WAs identified in the UV band is not well accounted in the X-ray spectra, vice versa. In this paper, we aim to identify WAs from the simultaneous HETG and COS observations of NGC 3783 in 2013, using the joint fitting method presented in Z15. Section 2 describes the observations and data reduction. In Section 3 we analyze the radiation and absorption components in the spectra and prepare the suitable models for them. We give the fitting results in Section 4. The discussion and exploration are presented in Section 5. We end with a summary of our conclusions.
2 Observation and data reduction
NGC 3783 was observed by Chandra/HETG and HST/COS simultaneously in March 2013 (PI: William Brandt) with exposure times of 160 ks and 4 ks, respectively. The observations were closely conducted within five days.
2.1 COS Spectrum
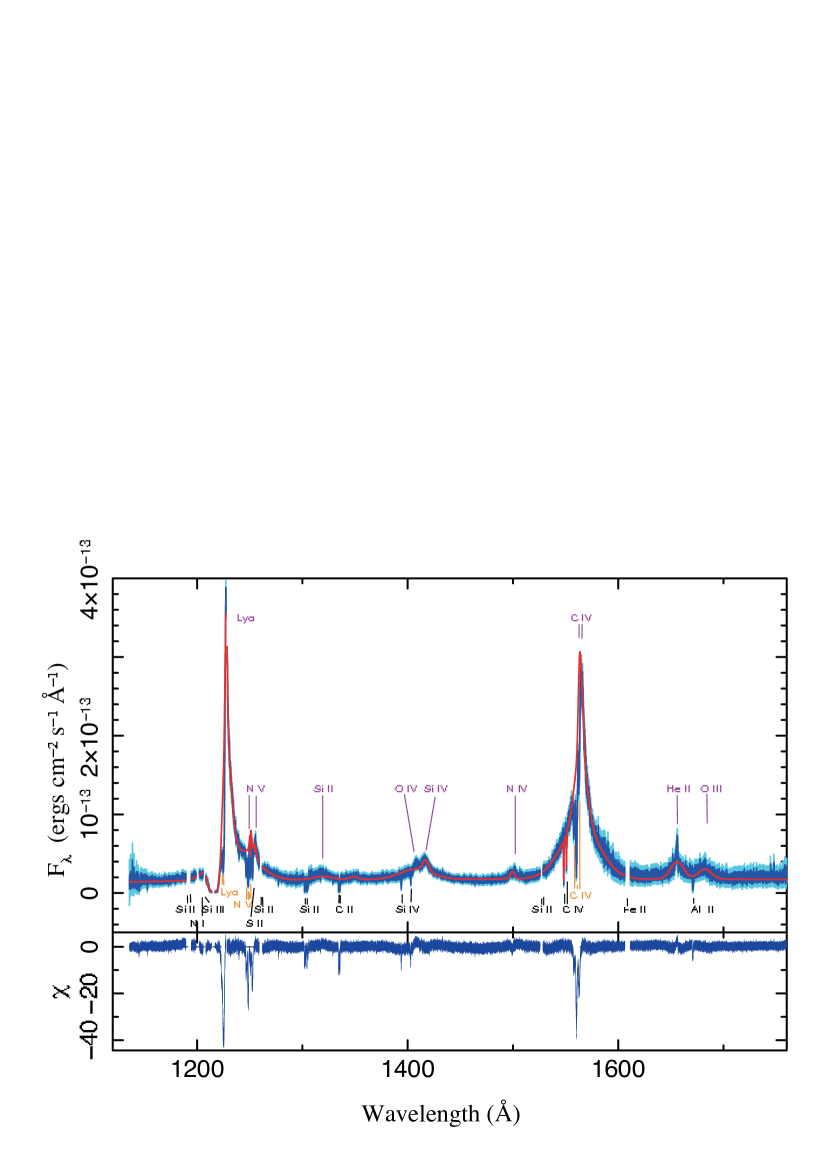
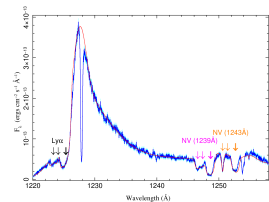
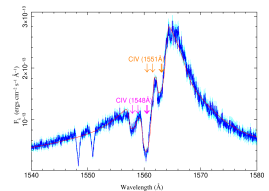
The COS spectrum covers the wavelength band of 1135-1795 Å (Osterman et al. 2011), consisting of G130M and G160M data (Grating centered at 130 and 160 nm) where M means the medium spectral resolution from 16000 to 21000. In fact, this NGC 3783 observation in 2013 consists of eight discrete shorter observations, four from G130M and four from G160M respectively, which are all primarily calibrated and processed through the pipeline CAL before being downloaded from Multi-mission Archive for Space Telescopes (MAST333http://archive.stsci.edu). Flat-fielding, alignment, and co-addition of the processed exposures are carried out using IDL routines described in Danforth et al. (2010). They are merged with exposure weighting, and the final spectrum has signal-to-noise (S/N) ratios per resolution element (0.07 Å, or 17 km ) ranging from 15-25. Finally the COS flux spectrum is converted into the format commonly used in the X-ray studies through the IDL tool PINTOFALE444 http://hea-www.harvard.edu/PINTofALE/. A Pulse Height Amplitude (PHA) file is obtained, with the corresponding response (RSP) file that convolves G130M and G160M line spread functions (LSF). Figure 1 presents the COS spectrum of NGC 3783.
2.2 HETG Spectrum
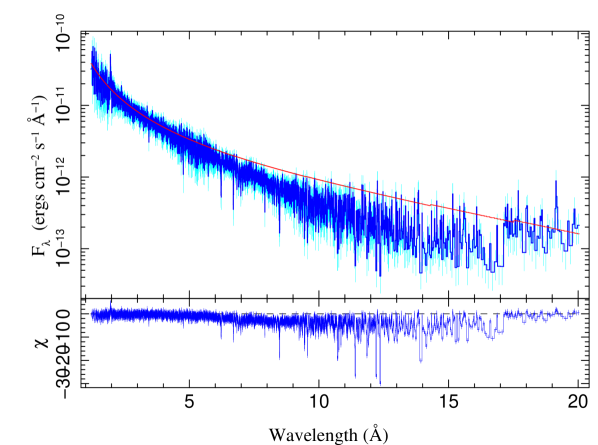
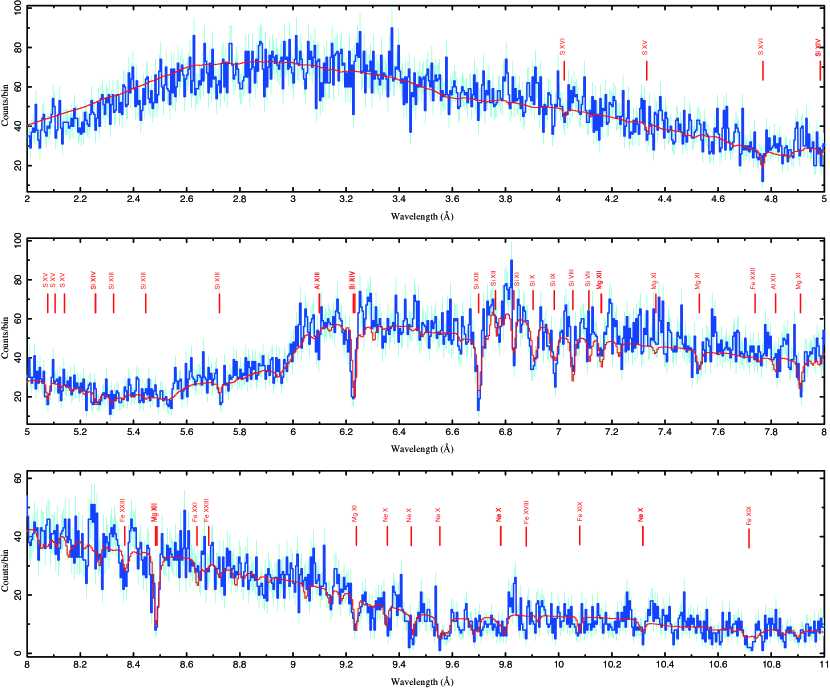
As joint observations, Chandra observed NGC 3783 with HETG instrument twice within two days in March 2013, which have exposure time of about 60 ks (ID: 14991) and 100 ks (ID: 15626), respectively. The HETG consists of two sets of gratings: the Medium Energy Grating (MEG) which covering the wavelength range of 2.5-31 Å and the High Energy Gratings (HEG) with the range of 1.2-15 Å. Since NGC 3783 is heavily obscured by WAs especially in the longer wavelength band, only 2-11 Å band is taken into account in this work. The two observations are not apparently contaminated by other sources in the field of view, but the zeroth order images are confronted with the pile-up issue. Therefore we run the ISIS script 555http://space.mit.edu/cxc/analysis/findzo/index.html to calculate a more accurate position of this source and use the standard data reduction steps of Chandra Interactive Analysis of Observations666http://cxc.cfa.harvard.edu/ciao/threads/diffuse emission (version 4.9) to get the spectra and corresponding response (RMF and ARF) files. For the spectral analysis, we only use the first order spectra for the better S/N ratio. Figure 2 is the combined MEG and HEG spectrum of NGC 3783.
3 Analysis and Model preparation
We use the Interactive Spectral Interpretation System (ISIS777http://space.mit.edu/cxc/isis/; version 1.6.2, Houck 2002) to analyze and fit the spectra. ISIS is a programmable, interactive tool for studying the physics of spectra. The emission and absorption lines are identified based on AtomDB888http://www.atomdb.org (version 3.0.3) (Foster et al. 2012).
The photoionization code XSTAR (Version 2.2, Kallman 2001) is employed to model the emitting and absorbing plasma that are photoionized by the central AGN. In XSTAR models, the intrinsic free parameters are column density and the ionization parameter , where is the luminosity in the 1-1000 Ryd energy range, is the hydrogen density, and is the distance to the ionizing source. The metal abundances are generally set to solar values.
3.1 Local Absorption in Milky Way
The column density of Galactic gas absorption is about cm-2 along the line of sight to NGC 3783 (Kalberla et al. 2005), which is included in all the later analysis by employing the ISM absorption model TBnew999http://pulsar.sternwarte.uni-erlangen.de/wilms/research/tbabs/. Dust extinction can effectively reduce the UV radiation. We take this effect into consideration by using the extinction curve formula proposed by Gordon et al. (2009), with parameter (Cardelli et al. 1989), and in the case of NGC 3783.
3.2 Spectral Energy Distribution of NGC 3783
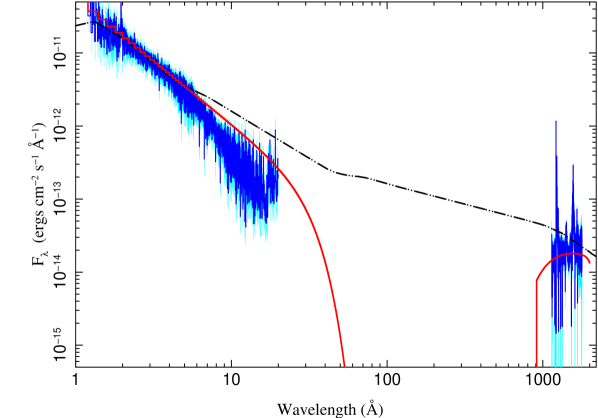
It is necessary to construct the spectral energy distribution (SED) of NGC 3783 for generating the photoionization models. The HETG and COS spectra are put into one plot (Figure 3). The intrinsic UV continuum from the accretion disk can be corrected from the local absorption. The ionizing spectrum in X-ray band is obtained by fitting the continuum in the 2-6 keV band which is not severely affected by WAs. The local absorption is strong between the HETG and COS bands, as shown by the red line, thus no more data points are likely to be found in between. We use the typical AGN SED (Elvis et al. 1994) but scaled with wavelength () to match the intrinsic UV and X-ray continuum, in order to mimic the intrinsic SED of NGC 3783. The ionizing luminosity is then obtained as .
3.3 Emission in NGC3783
The intrinsic radiation in NGC 3783 has different origins in the UV and X-ray bands. In the X-ray band, the continuum radiation mostly comes from the Comptonized corona at the inner region of the accretion disk. We use a single power-law model to account for it.
The intrinsic UV radiation on the other hand generally comes from the accretion disk, board line region (BLR), and narrow line region (NLR). The multiple blackbody emission in the accretion disk can also be fitted empirically by a power-law model. The radiation from photoionized clouds in BLR and NLR however needs to be generated by XSTAR.
As in Z15, we take the plausible assumption that the clouds in BLR have approximately virial speed, i.e. , where represents the black hole mass and represents the distance to the center. In this case, in the BLR are several groups of clouds with different velocities. Each group is assumed having the same ionization condition and the same full width at half-maximum (FWHM) value, thus taken as one photoionization component. The clouds in the NLR have much smaller rotational velocity (2000 km s-1), which are also described by one photoionization component.
To obtain the line-broading paramter () for generating those photoionization components in XSTAR, we fit strong emission lines with Gaussians. The best target for profile decomposition is the Ly, N v doublet, and C iv doublet, which have high S/N ratio in the COS spectra. We fit the five lines jointly according to their rest wavelength relations, taking the strong and weak line flux ratio of the doublets as in an optically thin case 2:1. Three groups of Gaussians with FWHM values of 8100, 2500, and 600 km are needed (Table 1), in which the former two indicate the virial velocities in the BLR and the latter is for the NLR. The redshift of the NLR components =0.009815(19), slightly larger than the =0.009760 of the host galaxy obtained by de Vaucouleurs et al. (1991), will be used as the systemic redshift in this work.
We generate two XSTAR table models for the BLR and one table model for the NLR. The densities of the BLR and NLR are set to cm-3 and cm-3, respectively (Z15). For both cases, the column density is set to cm-2, the temperature is set to 15 000 K, the metallicities are set to the solar values, while the ionization parameter and the redshift are left as free parameters.
3.4 Absorption in NGC3783
The HETG spectrum, which is grouped to 0.01 Å per bin, reveals tens of absorption lines, mostly from k-shell transitions of H-like and He-like ions of O, Ne, Mg, Si, and S and L-shell transitions of Si and Fe (Figure 2). The L-shell Si lines are from lower ionized absorbing gas, while the two strong lines Si xiii at 6.7 Å and Si xiv at 6.2 Å suggest higher ionization. For the highly ionized WAs, we take the line-broadening parameter of 350 km estimated from the 900 ks HETG observations in 2001 (Kaspi et al. 2002), which is larger than MEG spectral resolution of 170 km .
The outflow velocities of WAs can be better estimated from the N v and C iv doublet troughs in the COS spectrum. By fitting with Gaussians, we find dynamic components with velocities of 600, 880, and 1070 km (Table 1), of which the second one is identified by the absorption dip of N V 1239 Å line, and the asymmetric shape of the C IV 1548 Å absorption line. To determine the turbulent velocity is s somewhat complex since the thermal broadening can make an important contribution. According to , turbulent velocities are obtained from their fitted FWHM. represents the thermal velocity, which is about where is the temperature in unit of K and is the atomic number. The temperatures of these lower ionized WAs are about K according to the thermal stability curve of NGC 3783 generated by Netzer et al. (2003), and meanwhile, we take the mean value of carbon and nitrogen atomic numbers as the value. All the turbulent velocity values and outflowing velocities are listed in Table 1.
Based upon the lack of response of WAs to the changes of continuum, some lower distance limits are given (Netzer et al. 2003; Behar et al. 2003). They may be located between the inner region of torus to the NLR (1-25 pc), as assumed in our model. While the WAs can easily cover the region of accretion disk, they usually do not cover the whole BLR that has a transverse size of cm (Onken & Peterson 2002). We use the XSPEC model ‘partcov’ to mimic this effect when fitting the COS spectrum.
At last, we generate XSTAR models for these WAs. The column density , the ionization parameter , and the redshift are the free parameters. The WA with velocity of 600 km is saturated in the N v and C iv absorption lines, which has been taken into account by XSTAR.
| Å | Å | km | km | km | ||
| Emission lines from BLR and NLR | ||||||
| Ly (1215.67) | 0.41617 | 2606.3 | 3440 | |||
| 2882.2 | 1068 | |||||
| 771.4 | 253 | |||||
| N v (1238.82) | 0.15553 | 728.8 | 1250.95 | 3440 | ||
| 176.8 | 1251.11 | 1068 | ||||
| 121.9 | 1250.98 | 253 | ||||
| N v (1242.81) | 0.077805 | 364.4 | 1254.98 | 3440 | ||
| 88.4 | 1255.14 | 1068 | ||||
| 60.9 | 1255.01 | 253 | ||||
| C iv (1548.19) | 0.19045 | 3752.3 | ||||
| 1627.5 | ||||||
| 682.6 | (set) | |||||
| C iv (1550.78) | 0.094824 | 1876.1 | 3440 | |||
| 813.8 | 1068 | |||||
| 341.3 | 253 | |||||
| Absorption lines from Warm Absobers | ||||||
| N v (1238.82) | 0.15553 | 600 | 83 | |||
| N v (1242.81) | 0.077805 | 1252.52 | 600 | 198 | 83 | |
| 1250.58 | 1067 | 192 | 81 | |||
| 1251.36 | 880 | 156 | 65 | |||
| C iv (1548.19) | 0.19045 | 1560.28 | 600 | 198 | 83 | |
| 1557.87 | 1067 | 192 | 81 | |||
| 1558.84 | 880 | 156 | 65 | |||
| C iv (1550.78) | 0.094824 | |||||
| 1560.48 | 1067 | 192 | 81 | |||
| 1561.45 | 880 | 156 | 65 | |||
4 Joint Fitting and Five Warm Absorbers
The HETG and COS spectra are well fitted by these physical components. The photon indices of power-laws in the X-ray and UV bands are and 2.430.04 respectively, as shown by the red line in Figure 3. The XSTAR models for BLR and NLR can nicely reproduce the COS emission lines except for the Si iv line at 1416 Å that needs an additional Gaussian component (Figure 1). A Gaussian absorption model is used to account for the local broad Ly absorption.
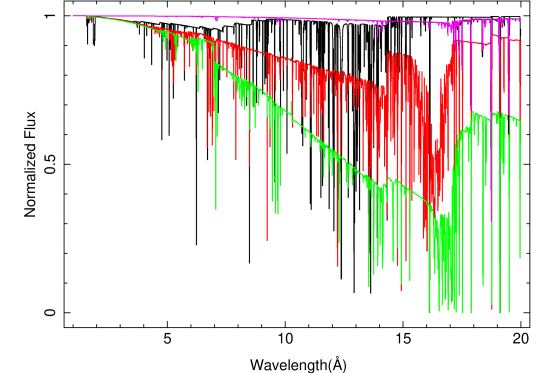
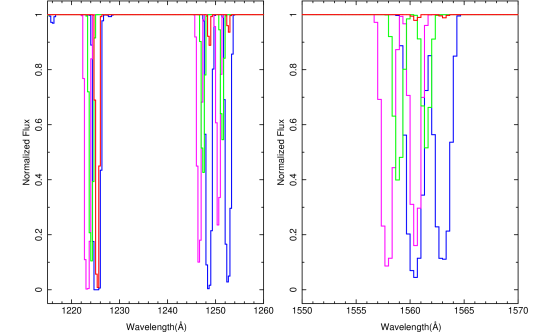
Totally five WAs are used to fit the absorption features in both the COS and HETG spectra (Figure 5 & 6). The parameters of the best-fit WAs are listed in Table 2, and their synthetic spectral models in the two bands are shown in Figure 4. WA 1-4 have absorptions in both the UV and X-ray bands, while WA 5 only appears in the X-ray band. WA 1 & 2 have similar low ionization states, similar column densities, and their velocities are higher than other WAs. WA 3 & 4 have similar velocities and column densities, but at slightly different ionization states. Now that WA 1-4 are nicely constrained in the HETG spectrum, WA 5 seems highly ionized, with the highest column density.
| log | log | Outflow velocity | Covering | |
|---|---|---|---|---|
| km s-1 | factor | |||
| WA1 | ||||
| WA2 | ||||
| WA3 | ||||
| WA4 | ||||
| WA5 | - |
5 Discussion
5.1 Comparison of WAs with Previous Studies
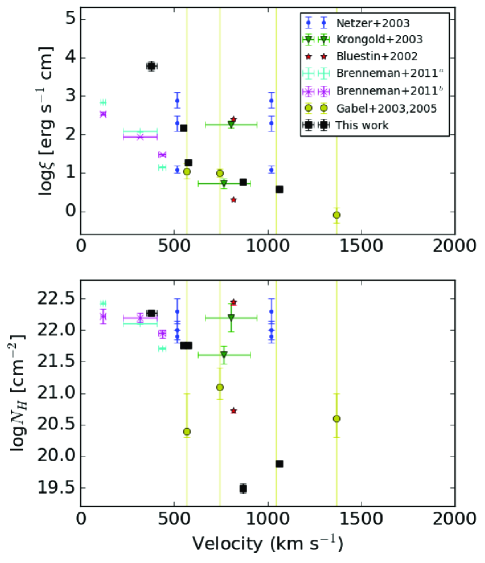
The WAs in NGC 3783 have been extensively studied in both the UV and X-ray bands even before the high-resolution grating observations (e.g., Turner et al. 1993; Shields & Hamann 1997). Later on, based on the high resolution spectra, different photoionization models are applied to describe the WAs (as summarized in Scott et al. 2014). These models usually have the same column density parameter , but different ionization parameters such as , , or . In order to apply the comparison among different studies, we convert them all to as used in XSTAR by: (Crenshaw & Kraemer 2012) and (Krongold et al. 2003). The spectral modeling results are mainly from the X-ray spectra: Chandra/HETG observations (Netzer et al. 2003; Krongold et al. 2003; Brenneman et al. 2011), XMM-Newton/RGS observations (Blustin et al. 2002), and Suzaku/XIS observations (Brenneman et al. 2011). In the UV regime, dynamic components are better constrained. HST/STIS and FUSE spectra give the radial velocity of four WAs: 1350, 550, 725, and 1027 km (e.g., Gabel et al. 2003a). By comparing photoionization models with individual lines, Gabel et al. (2005) constrained the and for three of the four WAs.
We compare our results with theirs in Figure 7, but the results do not simply match with each other. Since their studies use the systemic redshift of 0.009760 (de Vaucouleurs et al. 1991) while we use 0.009815 of the NLR instead, their velocities are all supplemented by 17 km . WA 3 & 4 match well two absorbers identified in the X-ray band by Netzer et al. (2003) in velocity, ionization paramter, and conlumn density. On the other hand, The velocities of WA 1, 3, & 4 also match two UV dynamic components measured by Gabel et al. (2003a), but we do not detect their 1365 km component. In fact, Gabel et al. (2003b) found that this 1365 km component has a decrease in velocity of km from 2000 to 2002 based on the STIS observations. The authors speculated a possible mechanism for this deceleration that there is a directional shift in the motion of the WA with respect to our line of sight to the background emission sources, and deduced an upper limit time scale of 17 years that the WA would move outside the BLR. The non-detection of this WA in our work supports this scenario. Our WA 2 is not close to any previous identified one, though its properties are similar to WA 1. It may just move inside our line of sight in a short time. WA5 is likely at higher ionization state than previous detections, but still has similar column density.
5.2 Pressure Balance
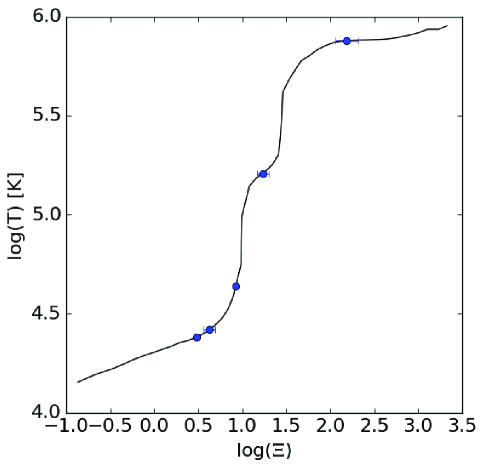
Gonçalves et al. (2006), Holczer et al. (2007), and Goosmann et al. (2016) constructed a continuous distribution of column density with ionization parameter, taking that all WAs are in pressure equilibrium. We thus generate the thermal photoionization equilibrium curve (Krolik et al. 1981; known as S-curve) in Figure 8, but find not all five WAs are on the unstable vertical part which does not prefer the continuous distribution. However, WA 3 & 4 are likely in pressure balance. They have similar velocities, column densities, and their covering factors are complemental. It is reasonable to believe that they are the same absorbing gas, while different parts have slightly different ionization state. WA 1 & 2 are dropping out from the pressure balance region. They have lower ionization parameters, lower column densities, lower covering factors, but higher velocities. They may be smaller discrete clouds that are easily blown out from the inner region of the torus at different periods.
5.3 Mass Outflow Rate
Bi-conical chimney is a natural geometry for WA outflows (Dorodnitsyn et al. 2008). We use the following formula to estimate the mass loss rate, which is derived by Krongold et al. (2007): , where is a factor that depends on the particular orientation of the disk and the wind and, for all reasonable angles ( and ) it is of the order of unity. is the line-of-sight outflow velocity.
According to the matching results in Section 5.1, the electron density of WA 4 is in the range of - cm-3 as derived by Gabel et al. (2005) and Netzer et al. (2003). Combining with the ionizing luminosity and obtained, we estimate that WA 4 is 0.7-22.0 pc away from the nucleus. After taking the covering fraction into account, the mass outflow rate from WA 4 is 0.018-0.56 per year. Taking that WA 3 is likely at the same location of WA 4, our best-fit parameters of WA 3 indicate a mass outflow rate of about 0.0035-1.1 per year. On the other hand, WA 1 and WA 2 may represent two blown-out clouds. We adopt a spherical-shape assumption for WA 1 and WA 2. Taking the BLR transverse size is of cm (Onken & Peterson 2002), and based on the best-fit values of corresponding covering factors, their sizes are estimated as and cm, respectively. Adopting those values as their thickness, the best-fit column densities of WA 1 and WA 2 indicate that their electron densities are about and cm-3, respectively. The distances of 15.9 and 20.9 pc for WA 1 and WA 2 respectively can be derived. Their mass outflow rate are estimated following the same method as for WA 4, which are 0.010 and 0.005 per year. WA 5 is highly ionized and cannot be efficiently blowed away by the radiation pressure. Its distance to the black hole should be larger than the inner radius of torus that is about 1 pc and less than other WAs which gives an upper limit of 15.9 pc. Based on these constraints, the range of mass outflow rate of WA 5 is about 0.15-2.4 per year. At last, the cumulated mass outflow rate of the five WAs is in the range of 0.22-4.1 per year. We can see that WAs disappeared and new WAs appeared during the past decade, so the mass outflow rate is statistical.
6 Summary
The bright Seyfert I galaxy NGC 3783 was observed by Chandra/HETG and HST/COS simultaneously in March 2013. We perform a joint fit on these two band spectra to constrain the properties of WAs.
-
•
We joint fit the two band spectra of NGC 3783 by considering the physical components of the local gas absorption, local dust extinction, AGN Comptonized corona emission, accretion disk black body emission, BLR emission, NLR emission, and the intrinsic WAs. Finally five WAs can explain well all absorption lines in both the UV and X-ray band spectra.
-
•
The five WAs do not stay together at the pressure balance part of the S-curve. Two WAs are likely different parts of the same absorbing gas. While the other two WAs may be smaller discrete clouds that are blown out from the inner region of the torus at different periods. The highest ionized WA has highest column density, which infers some tenuous but highly volume-occupied gas.
-
•
The total mass outflow rate of the five WAs is in the range of 0.22-4.1 per year.
Acknowledgements.
The work is supported by the National Natural Science Foundation of China under the grant 11203080 and 11573070. L. Ji is also supported by 100 talents program of the Chinese Academy of Sciences. We also thank for the help from Dr. Yangsen Yao on the UV data processing.References
- Behar et al. (2003) Behar, E., Rasmussen, A. P., Blustin, A. J., et al. 2003, ApJ, 598, 232
- Blustin et al. (2002) Blustin, A. J., Branduardi-Raymont, G., Behar, E., et al. 2002, A&A, 392, 453
- Brenneman et al. (2011) Brenneman, L. W., Reynolds, C. S., Nowak, M. A., et al. 2011, ApJ, 736, 103
- Cardelli et al. (1989) Cardelli, J. A., Clayton, G. C., & Mathis, J. S. 1989, ApJ, 345, 245
- Costantini (2010) Costantini, E. 2010, Space Sci. Rev., 157, 265
- Crenshaw & Kraemer (2012) Crenshaw, D. M., & Kraemer, S. B. 2012, ApJ, 753, 75
- Crenshaw et al. (1999) Crenshaw, D. M., Kraemer, S. B., Boggess, A., et al. 1999, ApJ, 516, 750
- Crenshaw et al. (2003) Crenshaw, D. M., Kraemer, S. B., & George, I. M. 2003, ARA&A, 41, 117
- Danforth et al. (2010) Danforth, C. W., Keeney, B. A., Stocke, J. T., Shull, J. M., & Yao, Y. 2010, ApJ, 720, 976
- de Vaucouleurs et al. (1991) de Vaucouleurs, G., de Vaucouleurs, A., Corwin, Jr., H. G., et al. 1991, Third Reference Catalogue of Bright Galaxies. Volume I: Explanations and references. Volume II: Data for galaxies between 0h and 12h. Volume III: Data for galaxies between 12h and 24h.
- Dorodnitsyn et al. (2008) Dorodnitsyn, A., Kallman, T., & Proga, D. 2008, ApJ, 687, 97
- Elvis et al. (1994) Elvis, M., Wilkes, B. J., McDowell, J. C., et al. 1994, ApJS, 95, 1
- Foster et al. (2012) Foster, A. R., Ji, L., Smith, R. K., & Brickhouse, N. S. 2012, ApJ, 756, 128
- Gabel et al. (2003a) Gabel, J. R., Crenshaw, D. M., Kraemer, S. B., et al. 2003a, ApJ, 583, 178
- Gabel et al. (2003b) Gabel, J. R., Crenshaw, D. M., Kraemer, S. B., et al. 2003b, ApJ, 595, 120
- Gabel et al. (2005) Gabel, J. R., Kraemer, S. B., Crenshaw, D. M., et al. 2005, ApJ, 631, 741
- Gonçalves et al. (2006) Gonçalves, A. C., Collin, S., Dumont, A.-M., et al. 2006, A&A, 451, L23
- Goosmann et al. (2016) Goosmann, R. W., Holczer, T., Mouchet, M., et al. 2016, A&A, 589, A76
- Gordon et al. (2009) Gordon, K. D., Cartledge, S., & Clayton, G. C. 2009, ApJ, 705, 1320
- Halpern (1984) Halpern, J. P. 1984, ApJ, 281, 90
- Holczer et al. (2007) Holczer, T., Behar, E., & Kaspi, S. 2007, ApJ, 663, 799
- Houck (2002) Houck, J. C. 2002, in High Resolution X-ray Spectroscopy with XMM-Newton and Chandra, ed. G. Branduardi-Raymont
- Kalberla et al. (2005) Kalberla, P. M. W., Burton, W. B., Hartmann, D., et al. 2005, A&A, 440, 775
- Kallman (2001) Kallman, T. R. 2001, in Astronomical Society of the Pacific Conference Series, Vol. 247, Spectroscopic Challenges of Photoionized Plasmas, ed. G. Ferland & D. W. Savin, 175
- Kaspi et al. (2002) Kaspi, S., Brandt, W. N., George, I. M., et al. 2002, ApJ, 574, 643
- Krolik et al. (1981) Krolik, J. H., McKee, C. F., & Tarter, C. B. 1981, ApJ, 249, 422
- Krongold et al. (2003) Krongold, Y., Nicastro, F., Brickhouse, N. S., et al. 2003, ApJ, 597, 832
- Krongold et al. (2007) Krongold, Y., Nicastro, F., Elvis, M., et al. 2007, ApJ, 659, 1022
- Netzer et al. (2003) Netzer, H., Kaspi, S., Behar, E., et al. 2003, ApJ, 599, 933
- Onken & Peterson (2002) Onken, C. A., & Peterson, B. M. 2002, ApJ, 572, 746
- Osterman et al. (2011) Osterman, S., Green, J., Froning, C., et al. 2011, Ap&SS, 335, 257
- Reynolds (1997) Reynolds, C. S. 1997, MNRAS, 286, 513
- Scott et al. (2014) Scott, A. E., Brandt, W. N., Behar, E., et al. 2014, ApJ, 797, 105
- Shields & Hamann (1997) Shields, J. C., & Hamann, F. W. 1997, The Astrophysical Journal, 481, 752
- Turner et al. (1993) Turner, T. J., Nandra, K., George, I. M., Fabian, A. C., & Pounds, K. A. 1993, ApJ, 419, 127
- Zhang et al. (2015) Zhang, S. N., Ji, L., Kallman, T. R., et al. 2015, MNRAS, 447, 2671