Theory of a Carbon-Nanotube Polarization Switch
Abstract
Recently, it was suggested that the polarization dependence of light absorption to a single-walled carbon nanotube is altered by carrier doping. We specify theoretically the doping level at which the polarization anisotropy is reversed by plasmon excitation. The plasmon energy is mainly determined by the diameter of a nanotube, because pseudospin makes the energy independent of the details of the band structure. We find that the effect of doping on the Coulomb interaction appears through the screened exchange energy, which can be observed as changes in the absorption peak positions. Our results strongly suggest the possibility that oriented nanotubes function as a polarization switch.
I Introduction
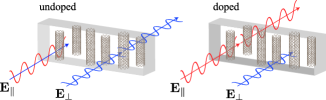
A carbon nanotube (CNT) Iijima and Ichihashi (1993) absorbs light whose linear polarization is parallel to the tube’s axis (), but not when the polarization is perpendicular to it (). Ajiki and Ando (1994); Hwang et al. (2000); Ichida et al. (2004) The optical anisotropy of a CNT enables oriented CNTs to function as an optical polarizer. Shoji et al. (2008); Kang et al. (2010) Recently, it was theoretically predicted that the polarization dependence is reversed by charge doping; Sasaki et al. (2016) a doped CNT transmits and absorbs (see Fig. 1).
The absorption of originates from the resonant excitation of collective oscillations of electrons (plasmon), which differs entirely from the excitation of individual electrons or excitons by in an undoped CNT. García de Abajo (2014); Sasaki et al. (2016) This theory of plasmon resonance accounts qualitatively for the anomalous absorption peaks observed experimentally in doped CNTs. Kazaoui et al. (1999); Liu et al. (2003); Kramberger et al. (2012); Igarashi et al. (2015) However, because the theoretical conclusion was derived using the Drude model which only takes account of intra-band electronic transitions, the exact doping and chirality Saito et al. (1998) dependencies of the absorption spectrum remain unknown.
In this paper we elucidate these dependencies by investigating the competition between intra and inter-band transitions with the Kubo formula. On the basis of predicted doping and chirality dependencies, we conclude that doped CNTs absorb over frequencies ranging from infrared to visible. This expands the application range of CNT polarizers and suggests the possibility that the polarization direction of transmitted light is changed by 90 degrees with doping rather than by spatial rotation.
This paper is organized as follows. In Sec. II, we explain the optical selection rule of CNTs. By calculating the dynamical conductivity, we show that momentum conservation and pseudospin play very essential role in determining the possible transitions. In Sec. III, we examine absorption spectra for armchair and zigzag CNTs, which are the main result of this paper. The effect of Coulomb interaction on the absorption spectra is studied in Sec. IV. Our discussion is provided in Sec. V. The calculation details which are necessary to reproduce the results of Secs. II and III are given in Appendix.
II Selection Rule
II.1 Parallel Polarization
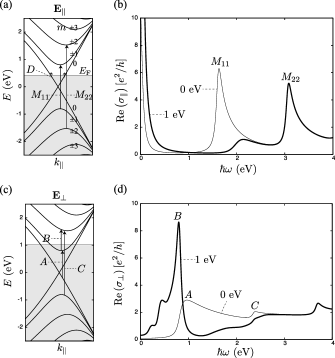
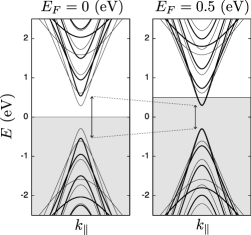
The electronic transition caused by is a direct transition without a change in momentum of a photo-excited electron. Ajiki and Ando (1994) In the band-diagram of a armchair CNT shown in Fig. 2(a), each of the band curves plotted as a function of the wavevector along the tube’s axis () is an eigenstate of the momentum around it and specified by magnetic quantum number . Minot et al. (2004) The two bands with linear dispersion that cross each other at have vanishing , while the other curve is degenerate () corresponding to the clockwise and anticlockwise circumferential motions, and the magnitude increases with the energy . Because the same value appears in the conduction and valence bands symmetrically with respect to , there are two possible cases of direct transition: transition between the valence and conduction bands (inter-band transition) or within either band (intra-band transition).
The doping dependence of the direct inter-band transition is roughly known from Fermi-Dirac statistics. When the doping level is low, e.g. eV (undoped), the direct inter-band transitions denoted by and in Fig. 2(a) are both allowed by the Pauli exclusion principle, Petit et al. (1999); Malić et al. (2006) while when the doping level is high, e.g. eV, is forbidden, although is still allowed. In Fig. 2(b), the calculated real part of the dynamical conductivity shows that the peak disappears when eV. Meanwhile, a Drude peak corresponding to the direct intra-band transition denoted by in Fig. 2(a) develops in the zero-frequency limit of . The peak intensity increases with doping because the density of states at increases with doping. The disappearance of the peak and enhancement of the Drude peak are evidence of high doping that is provided by the absorption spectra of .
II.2 Perpendicular Polarization
The electronic transition caused by is the indirect transition, and transitions with an change of , , are dominant over transitions with . This selection rule is a consequence of momentum conservation being applied to a case where, at the surface of a CNT, the azimuthal component of is approximately written as a sine (or cosine) function of the azimuthal angle () of the cylinder. Ajiki and Ando (1994) More exactly, this is a consequence of momentum conservation being used in combination with the two facts that a plane wave is a superposition of different magnetic quantum numbers and that tube diameter of nanometer scale is much shorter than the light wavelength of micrometer scale. Bohren and Huffman (1983); Sasaki et al. (2016) The proof goes as follows. When the light polarization is set perpendicular () to a tube’s axis (), an incident plane wave of frequency and amplitude is written as . In a cylindrical coordinate system , the field is expressed as
| (1) |
By using the formula for the Bessel functions, , we obtain the azimuthal component as
| (2) |
Because , is dominated by the modes with when , which we assume throughout this paper. 111 It is possible that in electron energy loss spectroscopy, de Broglie wavelength may be comparable to and electronic transitions satisfying are allowed. Electronic transitions with were demonstrated via Raman spectroscopy for an undoped CNT placed in a metal nanogap, Takase2013 where the light wavelength is reduced by the plasmon at the nanogap. Applying the momentum selection rule to the band-diagram in Fig. 2(c) we can expect that the transitions denoted by and to develop the peaks in for an undoped and doped CNT, respectively, and these are confirmed in Fig. 2(d).
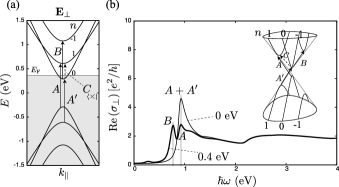
The selection rule, , explained above is a result of the momentum conservation only, and the indirect transitions are further restricted to the forward scattering by the symmetry that originates from the two sublattices nature of the electronic wavefunction known as pseudospin. Sasaki et al. (2011) For example, it suppresses a transition (of the backward scattering) denoted by in Fig. 2(c) to develop a strong peak in like the and peaks although it is a transition between band-edges with a large density of states. A profound effect of pseudospin on the selection rule is more clearly seen for a doped semiconducting CNT. In the band-diagram of a zigzag CNT shown in Fig. 3(a), each of the band curves is specified by shifted magnetic quantum number where is a nonzero integer () and . When eV, the transition denoted by with is allowed by the momentum selection rule, however, it is actually forbidden by pseudospin. Meanwhile the transition denoted by with is fully allowed. This difference is peculiar because the transition energy of is smaller than that of . It becomes clear that () is forward (backward) scattering by drawing the three-dimensional band-diagram in the inset of Fig. 3(b). As a result of pseudospin the peak position in is approximately given by 0.8 eV. The peak position of the doped zigzag CNT is similar to that of the doped armchair CNT ( in Fig. 2(d)) regardless of the difference of the band-diagrams of the zigzag and armchair CNTs. It should be noted that the lack of the transition with does not mean that there is an asymmetry between the clockwise and anticlockwise circumferential motions of the electrons. Each band with the index is actually degenerate () corresponding to the different valleys, and the subband with in one valley relates with the subband with in the other valley. Thus the lack of the transitions with in one valley means the transitions with in different valley are allowed.
III Depolarization and plasmon
According to the selection rule only, we may expect the peaks caused by , such as in Fig. 2(d) and in Fig. 3(b), to appear in the absorption spectra of undoped CNTs. Božović et al. (2000) However, it is not. The calculated absorption spectrum which is given by divided by the relative permittivity as () does not exhibit the corresponding peak when eV, as shown in the inset of Fig. 4. This is widely known as the depolarization effect. Ajiki and Ando (1994); Hwang et al. (2000); Ichida et al. (2004) As a result of the momentum transfer from to an electron, a non-uniform density distribution around the tube’s axis similar to an electric dipole is introduced and induces a depolarization field. Ajiki and Ando (1994) When the doping level is low, the depolarization field almost cancels out the applied field, and the total field defined by the sum of the applied and depolarization fields, is suppressed. Even though the electronic transition is allowed by the selection rule, the electron does not undergo a transition since the electric field by itself almost disappears due to the depolarization effect.

The main point of this paper is that the efficacy of the depolarization field depends strongly on doping. When the doping level is as high as eV, absorption peaks develop in the region eV as shown in Fig. 4. It can be shown that these peaks originate from the fact that the depolarization field is strongly enhanced at the specific frequency. Even if an infinitely small electric field is applied to a doped CNT, the depolarization field has a finite amplitude. This state is produced by the self-sustaining collective motion of the electrons (plasmon or plasmon-polariton), which is in sharp contrast to the single-particle excitation constituting the absorption peaks of . Meanwhile, the Drude peak is absent for , which is also in contrast to the case of .
The total electric field that the electrons in a CNT really “see” is given by the applied field divided by the relative permittivity . Mathematically, it is shown that by solving Maxwell equations while taking account of the boundary conditions at the tube’s surface, Sasaki et al. (2016) is written as
| (3) |
where is the diameter of a CNT and is the permittivity of the surrounding medium. Ajiki and Ando (1994) To observe that the vanishing real part of is essential for the appearance of plasmon, we plot the real and imaginary parts of as a function of energy in Fig. 5(a) for undoped and doped CNTs. Indeed, when eV, vanishes at an energy that corresponds to the absorption peak position seen in Fig. 4, where a small magnitude of helps the total electric field to enhance in a resonant fashion. Note that in the present calculations a surrounding medium with is assumed Igarashi et al. (2015) where is the permittivity of free space, and that a large value of has the advantage of decreasing the plasmon energy, because shifts upward in effect and zero of which shows a redshift.

To understand the cause of the appearance of plasmons in the doped CNTs more clearly, we consider the relative significance of the contributions made by intra and inter-band transitions to . Bohren and Huffman (1983) By noting that in Eq. (3) is proportional to the imaginary part of the dynamical conductivity, , we show each contribution, and , for the representative case of high doping level ( eV) in Fig. 5(b). is a negative value for the frequency range of interest. Thus, if we neglect the intra-band transitions, and the condition for plasmon existence is unsatisfied. When eV, the contribution made by the intra-band transition () causes a peak in so that exhibits a dip at eV. With increasing from a dip, decreases and increases. As a result, becomes zero at around 1.2 eV and the sign of changes at the energy. It is interesting that when combined with the intra-band transitions, the contribution of the inter-band transitions to the dynamical conductivity is not negligible since it tends to redshift the plasmon energy when eV.
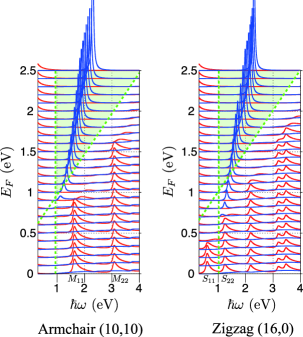
Figure 6 shows the details of the dependence of the absorption spectra of a armchair ( nm) and zigzag CNTs ( nm). There are several noticeable features should be mentioned. Firstly, the plasmon peak starts to develop when the () peak by starts to disappear for the armchair (zigzag) CNT. Secondly, the plasmon peak intensity and frequency increase as increasing . Thirdly, the doping dependence of the plasmon frequency in the armchair CNT is similar to that in the zigzag CNT. This suggests that when CNTs are intentionally doped, they will eventually have a similar excitation structure regardless of the chirality. Finally, the plasmon peak is present in the dispersion region (or the vicinity thereof) where single particle excitation is not allowed, indicating that a plasmon cannot collapse into individual electron-hole pairs and the kinematic stability is guaranteed for the plasmon.
IV Coulomb Interaction
In this section, we examine how the Coulomb interaction affects the results presented in the preceding sections. Because the Coulomb interaction weakens at high doping or in a metallic CNT due to the screening effect, we focus on a semiconducting CNT at low doping level. The results shown in this section are obtained by extending the existing framework developed for calculating exciton of an undoped CNT Ando (1997); Uryu and Ando (2006) to a doped CNT. The details will be presented elsewhere. 222The results shown in this section are dependent on an energy cutoff which limits the electron or hole states being taken into account in evaluating the physical quantities. We set .
The Coulomb interaction changes the absorption spectrum through two main effects: self-energy correction to the band-diagram (band renormalization) and formation of excitons. First we show the band renormalization.
IV.1 Band Renormalization
The thick curved lines in Fig. 7 show the renormalized band-diagram of a zigzag CNT, which is given by adding the screened exchange energy (or self-energy) to the original (bare) band-diagram denoted by the thin curved lines. When eV, the self-energy makes the band gap increase significantly. When eV, on the other hand, the self-energy is modest; the band gap is almost identical to that of the bare band. This is due to that the electron-hole pairs within the conduction band screen more effectively the Coulomb interaction than the inter-band electron-hole pairs. Sasaki et al. (2012) Note also that the self-energy for the states away from the Fermi level does not vanish and this tends to blue-shift the plasmon peak.
IV.2 Absorption Spectra
The exciton formation together with the band renormalization changes the absorption spectrum significantly. When eV, the absorption peaks of are governed by excitons as shown in Fig. 8. By comparing the result with the spectrum calculated without the Coulomb interaction, the sizable enhancement of oscillator strength is seen for each peak. Meanwhile, the correction to the absorption spectrum of is minor: a small peak due to the exciton formation is observed in . These results are consistent with Refs. Ando, 1997 and Uryu and Ando, 2006.

Figure 9(a) shows the behavior of the absorption peaks of under doping. When eV, the peak disappears due to exclusion principle. The peak intensity of () is suppressed by doping. Kazaoui et al. (1999) Further increase of doping results in that the and peaks exhibit red-shift due to the band renormalization. The red-shift of the peaks serves as a unique information of the self-energy because the peak positions should not change when the self-energy correction is not taken into account (see Fig. 6). As shown in Fig. 9(b), the exciton peak of disappears soon after reaches the bottom of the first subband ( eV), and the plasmon peak develops when eV. Such transition from exciton to plasmon may be observed when the broadening of the exciton of an undoped CNT is sufficiently suppressed. Uryu and Ando (2006)

V Discussion
We compare the present results with experimental ones. Kazaoui et al. found a broad peak in the absorption by thin films of heavily doped single-walled CNTs. Kazaoui et al. (1999) The pristine films consist of semiconducting and metallic CNTs since (0.68 eV), (1.2 eV), and (1.8 eV) are all observed. The doping-induced peak appears when , , and disappear by doping, which is consistent with our results. It was found that the peak energy depends on doping level: 1.07 eV (1.3 eV) for CBr0.15 (CCs0.10), while the details about the dependence was unknown. Igarashi et al. clarified that using electrochemical doping the peak energy increased with increasing the doping. Igarashi et al. (2015) They showed further that semiconducting and metallic single-walled CNTs cause independently the absorption peak at approximately 1 eV. These are consistent with our results. However, the calculated peak energy is slightly above ( eV) the experimental result. This discrepancy warrants further examination. Petit et al. showed that doping thin films with naphthalene-lithium did not cause the corresponding absorption peak even though the doping level is high enough to make an absorption peak. Petit et al. (1999) This suggests an interesting possibility that the surrounding of CNTs is modulated by the doping and that doping has an influence on the plasmon absorption (such as the peak energy and intensity) through a mechanism beyond the description by static dielectric constant.
When fully verifying the proposed theory, it is desirable to orient CNTs that are doped and separated into a single chirality. In the past, the depolarization effect was experimentally verified by absorption and Raman spectroscopy in which undoped CNTs are oriented by stretching the organic films on which they are dispersed Ichida et al. (2004) or by controlling magnetic effects Islam et al. (2004) or CNT growth processes. Murakami et al. (2005) Although experiments have already been performed on the doping dependence of light absorption for CNTs with a single chirality, Igarashi et al. (2015) there is no corresponding absorption measurements for oriented and doped CNTs. Recently, He et al. developed a technology for aligning CNTs spontaneously by improving vacuum filtration, He et al. (2016) and this approach can be used for the purpose.
If doped CNTs can be oriented, they will provide an opportunity for searching for novel phenomena even if they are not separated into a single chirality. Because the anisotropy of light absorption is related to the anisotropy of the electron-phonon interaction, there is a strong possibility that characteristic signals of doping will be explored by the polarized Raman spectroscopy. Kalbac et al. (2009) For example, in doped metallic CNTs, phonon frequency hardening have been observed in the manner that depends on the phonon eigenvector. Farhat et al. (2007) A phenomenon similar to it should be observed also for semiconducting CNTs.
The idea of the polarization reversal of light absorption in doped CNTs can also be applied to doped graphene nanoribbons, because it has been shown that the optical selection rule of nanoribbons is similar to that of CNTs. Sasaki et al. (2011) However, a modification of Eq. (3) caused by the edge is needed for nanoribbons and the coupling of nanoribbons to the substrate must be taken into account.
Since the length of a CNT is finite in the axial direction, there is also a depolarization effect in the axial direction. Zhang et al. (2013) The optical selection rule of finite length CNTs is obtained by extending the calculations on a nanoribbon. Indeed, due to the formation of a standing wave by the ends of a CNT, it can be proved that there is a wavelength shift of roughly the reciprocal of the axial length, which can explain why the plasmon peak is formed in the terahertz region of . Zhang et al. (2013)
Here, we mention a subject closely related to the optical properties of doped CNTs, that is, quantum wells. The band-diagram of a CNT bears a similarity to that of a quantum well and the concepts such as depolarization and exciton effects have been used to understand the optical properties of quantum wells. The term “intersubband transitions” is commonly used to describe only the transitions within the conduction band of quantum wells. Liu and Capasso (2000) This is a reasonable assumption when the width of doped quantum wells is approximately 10 nm or longer. For CNTs with diameter of the order of 1 nm, however, the inter-band transitions have very important effects on absorption spectrum for both undoped and doped cases. Note also that the pseudospin selection rule is a fundamental new point of CNTs, not seen in quantum wells.
Two degrees of freedom of the light polarization are utilized in modern optical transmission technology to double the amount of information transmitted simultaneously. For example, a light is propagated by associating its parallel polarization with pictorial information and perpendicular polarization with sound. Nano-scale materials that respond differently depending on polarization direction are advantageous for information manipulation in highly refined structures where light propagates, for example as an extremely thin Polaroid film. The fact that the polarization direction of light transmitted through CNTs can be rotated by 90 degrees simply by doping implies the possibility of performing further information manipulation by electric means. From the viewpoint of condensed matter physics, the doping-induced change in the phase of the excited states from excitons to plasmons is an intriguing topic. Our conclusion is thus to stimulate both fundamental research on CNTs and application research related to optical devices.
Acknowledgments
The authors thank K. Yanagi and J. Kono for discussions.
Appendix A Method
We employed a tight-binding model with the hopping integral eV and atomic distance Å, to calculate the band diagram and wavefunction of the electrons in CNTs. Saito et al. (1998) As a function of wavevector , the model Hamiltonian is written in the form of a matrix:
| (4) |
The off diagonal element is a complex number given by
| (5) |
and denotes the complex conjugate of . By expressing the energy eigenvalue equation in terms of the magnitude and phase of as , we obtain the energy eigenvalue and Bloch wavefunction as and
| (6) |
respectively. The band index () corresponds to the valence (conduction) band. The low energy band diagram near the charge neutrally point is given by a pair of double cones (known as the Dirac cones).
Because the interaction between the electron and light is given by the minimal substitution, , the electric currents defined from are
| (7) |
Putting Eqs. (4) and (5) into Eq. (7) we have the following expressions of the current operators,
| (8) | |||
| (9) |
where is the Fermi velocity of graphene.
The wavevectors are quantized by the periodic boundary condition around and along the tube’s axis. Malić et al. (2006) For the case of armchair CNTs, the quantized wavevectors are specified by two integers and as
| (10) | |||
| (11) |
Note that is the CNT length, is the diameter, and the surface area of a CNT () is . As a result of the longer axial length than the diameter (), the band diagram of a CNT is well described by the cross sections of the Dirac cone (see Fig. 3(b)). We also note that the effect of orbital hybridization between and due to the curvature of the azimuthal direction is negligible in this study. For the case of zigzag CNTs, the quantized wavevectors are specified by two integers and as
| (12) | |||
| (13) |
Note that is the CNT length, is the diameter, and the surface area of a CNT is the same as CNTs.
We calculated the dynamical conductivity in the framework of the linear response theory,
| (14) |
where is the spin degeneracy, is the Fermi distribution function at room temperature ( eV), and () is inversely proportional to the relaxation time of an excited electron. We fix meV ( fs) in all calculations. For an armchair CNT, the current operator () couples to (). Due to the momentum selection rule for , the absorption is the product of
| (15) |
and , while for , the absorption is the product of
| (16) |
and . The factor one-half in Eq. (16) originates from the field decomposition of into the pair . Equations (15) and (16) are the exact definition of the absorption plotted in the text as and , respectively. Note also that holds in the absence of the Aharonov-Bohm flux along the tubule axis.
It is instructive to evaluate the matrix element to show that only the forward scattering is allowed by the selection rule of pseudospin. We take zigzag CNTs and focus on the transitions between band edges (). The matrix element of is known from Eqs. (6) and (8) as
| (17) |
Thus, for the inter-band transitions (), the transitions satisfying , which are the forward scattering, have the largest matrix element squared. For the intra-band transitions (), the transitions satisfying , which are the forward scattering too, are allowed. The intra-band backward scattering satisfies and has vanishing matrix element. Sasaki et al. (2012)
The polarization characteristics of the absorption spectrum has been investigated for incident light energies up to 6 eV. Murakami et al. (2005) The absorption peaks observed at 4.5 and 5.25 eV were found to exhibit different polarization dependencies. The behavior is also reproduced by our calculation, that is, peaks caused by and appear approximately at 5 and 6 eV, respectively, as shown in Fig. 10. The discrepancy between experiment and calculation may be attributed to the fact that we have ignored the overlap between the wavefunctions at nearest neighbor electrons giving asymmetry in the conduction and valence bands. Saito et al. (1998) The qualitative agreement suggests the correctness of the optical matrix elements used to evaluate the dynamical conductivity. Note that the peak structure of at about 6 eV may be regarded as a plasmon resonance because has a peak structure at the energy and approaches zero. Note also that a realistic doping level does not change these high-energy peaks and that the problem can be discussed simply in terms of the photo-electron interaction and the density of the electronic state. Shyu and Lin (1999)

References
- Iijima and Ichihashi (1993) Sumio Iijima and Toshinari Ichihashi, “Single-shell carbon nanotubes of 1-nm diameter,” Nature, 363, 603–605 (1993), ISSN 0028-0836.
- Ajiki and Ando (1994) Hiroshi Ajiki and Tsuneya Ando, “Aharonov-Bohm effect in carbon nanotubes,” Physica B: Condensed Matter, 201, 349–352 (1994), ISSN 09214526.
- Hwang et al. (2000) J. Hwang, H. H. Gommans, A. Ugawa, H. Tashiro, R. Haggenmueller, K. I. Winey, J. E. Fischer, D. B. Tanner, and A. G. Rinzler, “Polarized spectroscopy of aligned single-wall carbon nanotubes,” Physical Review B, 62, R13310–R13313 (2000), ISSN 0163-1829.
- Ichida et al. (2004) M Ichida, S Mizuno, H Kataura, Y Achiba, and A Nakamura, “Anisotropic optical properties of mechanically aligned single-walled carbon nanotubes in polymer,” Applied Physics A, 78, 1117–1120 (2004).
- Shoji et al. (2008) Satoru Shoji, Hidemasa Suzuki, Remo Proietti Zaccaria, Zouheir Sekkat, and Satoshi Kawata, “Optical polarizer made of uniaxially aligned short single-wall carbon nanotubes embedded in a polymer film,” Physical Review B, 77, 153407 (2008), ISSN 1098-0121.
- Kang et al. (2010) Byeong Gyun Kang, Young Jin Lim, Kwang-Un Jeong, Kyu Lee, Young Hee Lee, and Seung Hee Lee, “A tunable carbon nanotube polarizer,” Nanotechnology, 21, 405202 (2010), ISSN 0957-4484.
- Sasaki et al. (2016) Ken-ichi Sasaki, Shuichi Murakami, and Hideki Yamamoto, “Theory of intraband plasmons in doped carbon nanotubes: Rolled surface-plasmons of graphene,” Applied Physics Letters, 108, 163109 (2016), ISSN 0003-6951.
- García de Abajo (2014) F. Javier García de Abajo, “Graphene Plasmonics: Challenges and Opportunities,” ACS Photonics, 1, 135–152 (2014), ISSN 2330-4022.
- Kazaoui et al. (1999) S. Kazaoui, N. Minami, R. Jacquemin, H. Kataura, and Y. Achiba, “Amphoteric doping of single-wall carbon-nanotube thin films as probed by optical absorption spectroscopy,” Physical Review B, 60, 13339–13342 (1999), ISSN 0163-1829.
- Liu et al. (2003) X. Liu, T. Pichler, M. Knupfer, and J. Fink, “Electronic and optical properties of alkali-metal-intercalated single-wall carbon nanotubes,” Physical Review B, 67, 125403 (2003), ISSN 0163-1829.
- Kramberger et al. (2012) C. Kramberger, F. Roth, R. Schuster, R. Kraus, M. Knupfer, E. Einarsson, S. Maruyama, D. J. Mowbray, A. Rubio, and T. Pichler, “Channeling of charge carrier plasmons in carbon nanotubes,” Physical Review B, 85, 085424 (2012), ISSN 1098-0121.
- Igarashi et al. (2015) Toru Igarashi, Hideki Kawai, Kazuhiro Yanagi, Nguyen Thanh Cuong, Susumu Okada, and Thomas Pichler, “Tuning Localized Transverse Surface Plasmon Resonance in Electricity-Selected Single-Wall Carbon Nanotubes by Electrochemical Doping,” Physical Review Letters, 114, 176807 (2015), ISSN 0031-9007.
- Saito et al. (1998) R Saito, G Dresselhaus, and M S Dresselhaus, Physical Properties of Carbon Nanotubes (Imperial College Press, London, 1998).
- Minot et al. (2004) E D Minot, Yuval Yaish, Vera Sazonova, and Paul L McEuen, “Determination of electron orbital magnetic moments in carbon nanotubes.” Nature, 428, 536–9 (2004), ISSN 1476-4687.
- Petit et al. (1999) P. Petit, C. Mathis, C. Journet, and P. Bernier, “Tuning and monitoring the electronic structure of carbon nanotubes,” Chemical Physics Letters, 305, 370–374 (1999), ISSN 00092614.
- Malić et al. (2006) Ermin Malić, Matthias Hirtschulz, Frank Milde, Andreas Knorr, and Stephanie Reich, “Analytical approach to optical absorption in carbon nanotubes,” Physical Review B, 74, 195431 (2006), ISSN 1098-0121.
- Bohren and Huffman (1983) Craig F. Bohren and Donald R. Huffman, Absorption and scattering of light by small particles (Wiley, 1983) ISBN 9780471293408.
- Note (1) It is possible that in electron energy loss spectroscopy, de Broglie wavelength may be comparable to and electronic transitions satisfying are allowed. Electronic transitions with were demonstrated via Raman spectroscopy for an undoped CNT placed in a metal nanogap, Takase2013 where the light wavelength is reduced by the plasmon at the nanogap.
- Sasaki et al. (2011) Ken-ichi Sasaki, Keiko Kato, Yasuhiro Tokura, Katsuya Oguri, and Tetsuomi Sogawa, “Theory of optical transitions in graphene nanoribbons,” Physical Review B, 84, 085458 (2011), ISSN 1098-0121.
- Božović et al. (2000) I. Božović, N. Božović, and M. Damnjanović, “Optical dichroism in nanotubes,” Physical Review B, 62, 6971–6974 (2000), ISSN 0163-1829.
- Sasaki et al. (2012) Ken-ichi Sasaki, Keiko Kato, Yasuhiro Tokura, Satoru Suzuki, and Tetsuomi Sogawa, “Decay and frequency shift of both intervalley and intravalley phonons in graphene: Dirac-cone migration,” Physical Review B, 86, 201403 (2012), ISSN 1098-0121.
- Ando (1997) Tsuneya Ando, “Excitons in Carbon Nanotubes,” Journal of the Physics Society Japan, 66, 1066–1073 (1997), ISSN 0031-9015.
- Uryu and Ando (2006) Seiji Uryu and Tsuneya Ando, “Exciton absorption of perpendicularly polarized light in carbon nanotubes,” Physical Review B, 74, 155411 (2006), ISSN 1098-0121.
- Note (2) The results shown in this section are dependent on an energy cutoff which limits the electron or hole states being taken into account in evaluating the physical quantities. We set .
- Islam et al. (2004) M. F. Islam, D. E. Milkie, C. L. Kane, A. G. Yodh, and J. M. Kikkawa, “Direct Measurement of the Polarized Optical Absorption Cross Section of Single-Wall Carbon Nanotubes,” Physical Review Letters, 93, 037404 (2004), ISSN 0031-9007.
- Murakami et al. (2005) Yoichi Murakami, Erik Einarsson, Tadao Edamura, and Shigeo Maruyama, “Polarization Dependence of the Optical Absorption of Single-Walled Carbon Nanotubes,” Physical Review Letters, 94, 087402 (2005), ISSN 0031-9007.
- He et al. (2016) Xiaowei He, Weilu Gao, Lijuan Xie, Bo Li, Qi Zhang, Sidong Lei, John M. Robinson, Erik H. Hároz, Stephen K. Doorn, Weipeng Wang, Robert Vajtai, Pulickel M. Ajayan, W. Wade Adams, Robert H. Hauge, and Junichiro Kono, “Wafer-scale monodomain films of spontaneously aligned single-walled carbon nanotubes,” Nature Nanotechnology, 11, 633–638 (2016), ISSN 1748-3387.
- Kalbac et al. (2009) Martin Kalbac, Hootan Farhat, Ladislav Kavan, Jing Kong, Ken-ichi Sasaki, Riichiro Saito, and Mildred S. Dresselhaus, “Electrochemical Charging of Individual Single-Walled Carbon Nanotubes,” ACS Nano, 3, 2320–2328 (2009), ISSN 1936-0851.
- Farhat et al. (2007) H Farhat, H Son, Ge. G Samsonidze, S Reich, M S Dresselhaus, and J Kong, “Phonon Softening in Individual Metallic Carbon Nanotubes due to the Kohn Anomaly,” Physical Review Letters, 99, 145506 (2007), ISSN 0031-9007.
- Zhang et al. (2013) Qi Zhang, Erik H Hároz, Zehua Jin, Lei Ren, Xuan Wang, Rolf S Arvidson, Andreas Lüttge, and Junichiro Kono, “Plasmonic nature of the terahertz conductivity peak in single-wall carbon nanotubes.” Nano letters, 13, 5991–6 (2013), ISSN 1530-6992.
- Liu and Capasso (2000) H. C. Liu and Federico Capasso, Intersubband transitions in quantum wells : physics and device applications I (Academic Press, 2000) ISBN 9780080864600, p. 309.
- Shyu and Lin (1999) F. L. Shyu and M. F. Lin, “ plasmons in two-dimensional arrays of aligned carbon nanotubes,” Physical Review B, 60, 14434–14440 (1999), ISSN 0163-1829.