Nitrogen-Vacancy Ensemble Magnetometry Based on Pump Absorption
Abstract
We demonstrate magnetic field sensing using an ensemble of nitrogen-vacancy centers by recording the variation in the pump-light absorption due to the spin-polarization dependence of the total ground state population. Using a 532 nm pump laser, we measure the absorption of native nitrogen-vacancy centers in a chemical vapor deposited diamond placed in a resonant optical cavity. For a laser pump power of 0.4 W and a cavity finesse of 45, we obtain a noise floor of 100 nT/ spanning a bandwidth up to 125 Hz. We project a photon shot-noise-limited sensitivity of 1 pT/ by optimizing the nitrogen-vacancy concentration and the detection method.
I Introduction
The nitrogen-vacancy (NV) center in diamond is currently one of the most studied and anticipated platforms for high spatial-resolution sensing of magnetic fields Balasubramanian et al. (2008); Rondin et al. (2014); Schirhagl et al. (2014), electric fields Dolde et al. (2011) and temperature Kucsko et al. (2013); Neumann et al. (2013) at ambient conditions. Several novel applications using diamond sensors are currently being developed in the fields of neuroscience Hall et al. (2012); Barry et al. (2016), cellular biology Steinert et al. (2013); Glenn et al. (2015), nanoscale magnetic resonance microscopy Lovchinsky et al. (2016), paleomagnetism Fu et al. (2014), and microelectronics Kolkowitz et al. (2015); Jakobi et al. (2016).
Many magnetometer schemes using NV centers are based on recording the change in the detected fluorescence level upon a shift of the electron spin precession frequency due to a change of an external magnetic field Clevenson et al. (2015); Glenn et al. (2015); Barry et al. (2016); Ahmadi et al. (2017). The fluorescence contribution of an ensemble of NV centers to the signal increases the optically detected magnetic resonance (ODMR) amplitude and hence boosts the sensitivity by , where is the number of NV centers Taylor et al. (2008). However, the high refractive index of diamond ( 2.4) together with the near uniform emission of NV center ensembles trap most of the generated fluorescence due to total internal reflection. This limits the collection efficiency and, thus, the smallest detectable magnetic field change. To increase the fluorescence collection from a diamond, several techniques have been demonstrated such as fabricating a solid immersion lens Hadden et al. (2010), side-collection detection Le Sage et al. (2012), employing a silver mirror Israelsen et al. (2014), using a dielectric optical antenna Riedel et al. (2014), emission into fabricated nanopillar waveguides Momenzadeh et al. (2015) and employing a parabolic lens Wolf et al. (2015). Alternatively, magnetic fields can also be sensed by observing the change in the shelving-state infrared absorption Jensen et al. (2014), or the change in fluorescence when transitioning through the ground state level anti-crossing of the NV center Wickenbrock et al. (2016).
In this article, we report on a new measurement technique for NV ensemble magnetometry, which is based on monitoring the spin-dependent absorption of the pump field. Using the absorption detected magnetic resonance (ADMR) measurement technique in conjunction with a cavity resonant with the pump field, we fully circumvent challenges associated with inefficient collection of fluorescence, by detecting the absorption through the transmitted cavity mode. We demonstrate a NV ensemble magnetometer for low-frequency magnetic field sensing with a measured noise floor of 100 nT/ spanning a bandwidth up to 125 Hz. Intriguingly, using the reflection of an impedance-matched cavity and a diamond crystal with an optimized NV concentration, we project an estimated sensitivity of 1 pT/.
II Absorption detected magnetic resonance
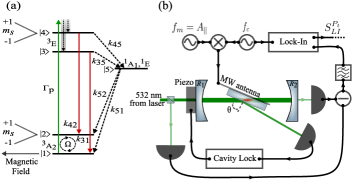
The electronic level structure of the NV defect is summarized in Fig. 1(a). It consists of a 3A2 spin-triplet ground state, a 3E spin-triplet excited state, and a 1A1 1E shelving state. Pumping with a 532 nm laser results in an excitation above the zero phonon line, which decays on a picosecond timescale Huxter et al. (2013) to the 3E excited states by non-radiative transitions. Moreover, there exists a non-radiative decay path through the shelving state which is more probable for of the excited state 4. Continuous optical pumping depopulates the spin sublevel and accumulates the population in . The zero-field splitting of the ground state levels 1 and 2 is 2.87 GHz at room temperature, making the transition between these levels accessible using microwave (MW) fields. The presence of a local magnetic field lifts the degeneracy of 1 with a splitting proportional to 2, where = 2.8 GHz/T is the gyromagnetic ratio of the electron spin and corresponds to the magnetic field projection along the NV symmetry axis. A change in the external magnetic field hence results in a detectable shift in the electron spin resonance frequency of the ODMR or the ADMR spectrum, respectively. The continuous-wave sensitivity of the spin resonances to small changes of an external magnetic field is proportional to max[, where is the derivative with respect to the MW frequency of the ADMR signal . Using a cavity around the diamond host crystal, a change in can be detected by a measurement of the remaining pump light either transmitted through or reflected off the cavity. Intriguingly, by appropriately tailoring the impedance of the cavity it is possible to obtain a unity contrast in the reflected light power, which in turn may lead to a sensitivity in the pT/ range.
III Experiment
We use the native 14NV- concentration of an off-the-shelf single-crystal diamond grown by chemical vapor deposition. A schematic of the experimental setup is shown in Fig. 1(b). The optical cavity consists of two concave mirrors with a 10 cm radius of curvature set in a confocal configuration, resulting in a minimum beam waist of 92 m with a Rayleigh length of 50 mm. The mirrors have the measured reflectivities of = 94.8 0.1 and = 99.8 0.1 at the pump wavelength of 532 nm. With the diamond rotated at its Brewster angle ( 67∘), the round-trip beam path in the diamond is 2 1.3 mm and the estimated excitation volume is 3.5 10-2 mm3, accounting for the standing wave and the transverse beam profile. The finesse of a cavity is defined by , where corresponds to the cumulative round-trip loss product and is the propagation loss coefficient. In the absence of the diamond, the finesse solely depends on the product of the mirror reflectivities and is calculated as , which is confirmed by the measured finesse of . Incorporating the diamond into the cavity reduces the finesse to , which indicates that all the effective loss in the loaded cavity can be attributable solely to losses occurring through the diamond. The corresponding cumulative round-trip loss of the loaded cavity shows that the cavity is slightly under-coupled. The propagation loss can be decomposed to , in which is the absorption loss coefficient and is attributed to all other loss channels such as surface-based absorption, scattering losses, and birefringence losses. The total fraction of reflected light from the diamond to intra-cavity power was measured as 0.006, of which approximately 80 was -polarized light. This translates to an absorption loss coefficient of 0.0301 mm-1, taking 0.006. With an independent measurement using a confocal microscope, we determined the NV- concentration, [NV-], to be 2.9 1010 mm-3 ( 0.16 ppb) corresponding to 109 NV- centers within the excitation volume. Considering the absorption cross section of a single 14NV- at 532 nm ( 3.1 10-15 mm2 Wee et al. (2007)), a NV related absorption loss coefficient of 9 10-5 mm-1 is obtained. Hence, in our diamond sample most of the propagation loss is attributed to non-NV loss channels. Using the NV absorption loss coefficient, we estimate the ratio between the excitation rate and the intra-cavity power 75 kHz/W, where the intra-cavity and incident powers are linked through .
III.1 Spectrum
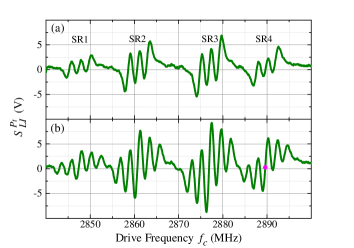
We performed ADMR measurements by recording the remaining pump-light transmitted through the diamond loaded cavity while sweeping the MW drive frequency across the spin resonance. To reduce the technical noise level in our measurement, we tapped off some laser light before the cavity, recorded it with a second photodetector and subtracted the two photocurrents, as indicated in Fig. 1(b). In order to remove low frequency technical noise, we applied lock-in detection with a frequency modulated MW drive, directly yielding at the output, where indicates the transmitted power through the cavity and refers to lock-in (further experimental details can be found in the supplemental material). A typical frequency modulated ADMR spectrum is presented in Fig. 2(a). In these measurements, a static magnetic field was aligned along the [111] axis, resulting in the outermost electron spin resonances (SR1,SR4), while the inner peaks (SR2,SR3) correspond to the electron spin resonances of the other three crystallographic orientations. The three-peak feature of the ADMR spectrum in Fig. 2(a) is a consequence of the hyperfine interaction between the NV electron spin and the intrinsic 14N nuclear spin with a coupling constant of MHz Smeltzer et al. (2009). To enhance max[)], we excited all three 14N hyperfine transitions simultaneously by mixing the modulation frequency with a = signal. The three-frequency excitation results in five peaks for each electron spin resonance, as shown by the measured spectrum in Fig. 2(b).
III.2 Model
An ADMR spectrum may be obtained either by recording the pump beam reflected from the cavity, , or transmitted through the cavity, , as a function of the applied MW frequency, and may be modeled using a set of optical Bloch equations considering the five electronic levels and the transitions summarized in Fig. 1(a) El-Ella et al. (2017). The steady-state level populations are then obtained as a function of Rabi frequency , optical excitation rate , and MW detuning from the spin transition. The cavity reflection or transmission itself is a function of loss inside the cavity which is dominated by the absorption in diamond, while the NV absorption in diamond depends on the NV ensemble ground state spin population. Applying a resonant MW field () increases the population in the shelving state , which possesses a longer lifetime ( ns Robledo et al. (2011); Acosta et al. (2010)) than the 3E excited states, and hence, a lower average population remains in the ground states and to absorb the pump photons. Ultimately, the resonant MW field decreases the optical loss inside the cavity which can be monitored through the light transmitted or reflected from the cavity. The steady-state population of the optical ground state can be written as:
| (1) |
where and are the steady-state population of 1 and 2, respectively. As the absorption of a NV ensemble directly depends on , a change in the propagation loss as a function of [NV-] can be described as:
| (2) |
where is the loss coefficient attributed to non-NV absorption. As pump absorption in our sample is dominated by non-NV related processes, the absorption-based spin contrast related to the fraction is on the order of when monitoring the absorption through the cavity transmission. The steady-state cavity outputs as a function of MW detuning are then reformulated in terms of transmitted and reflected powers:
| (3) |
| (4) |
where is the laser input power to the cavity, and are the transmissions of the first and the second mirror, respectively, and we assume . For the sake of simplicity, the intra-cavity excitation rate () is calculated in terms of the input power and the propagation loss when no MW field is applied (, = 1). The lock-in signal can be described as a function of detuning between the carrier frequency and the resonance frequency (), and the modulation depth through:
| (5) |
where is the lock-in gain factor, is the off-resonant detected voltage, and is either the reflected or transmitted cavity power. The expression is summed over the 14N nuclear spin quantum number = -1,0,1, and the three frequencies separated by in order to account for the simultaneous drive of all three hyperfine transitions.
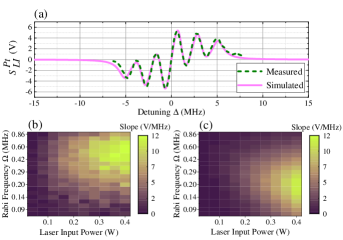
Using Eq. (5), is plotted as a solid line in Fig. 3(a), taking = 0.4 W, = 0.3 MHz, a pure dephasing rate of = 1/3 MHz, a longitudinal relaxation rate of = 0.182 kHz, and level decay rates extracted from Robledo et al. (2011). We also plot the measured ADMR spectrum as a dashed line in Fig. 3(a). The ADMR spectrum was recorded with the same and as the simulated spectrum. The match between the simulated and measured traces is very good, with just a small mismatch due to the uncertainty in the estimation of the parameters , , and in the simulation.
III.3 Sensitivity
To optimize the magnetic field sensitivity, we measure the dependence of of three-frequency excitation spectra on the pump power and Rabi frequency, and , at . The results of these measurements are presented in Fig. 3(b). The maximum slope is achieved at = 0.4 W and 0.3 MHz, where the optical excitation rate by virtue of the cavity enhancement overcomes the MW power-induced broadening, allowing for a narrowing regime to be reached Jensen et al. (2013). The simulated slopes are presented in Fig. 3(c) and obtained using the same parameters as in Fig. 3(a). We observe a very good agreement with respect to the overall trend, the slope magnitude, and the location of the slope maximum.
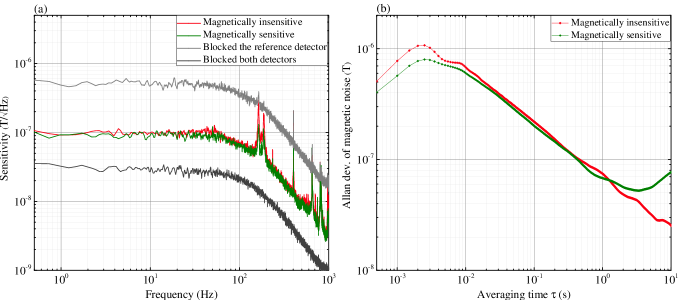
For deducing the sensitivity of the magnetometer, we independently measured four time traces of the lock-in signal for = 0.4 W. The first trace was measured in the optimal magnetically sensitive configuration, with the MW drive on resonance with a spin transition () corresponding to the purple dot in Fig. 2(b). The second trace was measured in the magnetically insensitive configuration, with the MW drive frequency far-detuned from any spin resonance (). The third trace was measured by blocking the reference detector which monitored the laser output. The last trace was measured with all detectors blocked, which shows the sum of electronic noise from the lock-in detector and photodetectors. The Fourier transforms of these time traces with a frequency resolution of 0.24 Hz are presented in Fig. 4(a) where the y-axis is displayed in units of sensitivity. It shows a 125 Hz bandwidth and a 12 dB/octave roll-off that is generated by the low-pass filter of the lock-in detector. The choice of this bandwidth is a consequence of the low ADMR contrast () measured through the cavity transmission. When the MW drive is off resonance, a noise floor of 100 nT/ is achieved. The increased noise floor when we blocked the reference detector and only monitored the transmission through the cavity shows the impact of substantial technical noise at the 35 kHz modulation frequency. Next, we calculated the Allan deviation of both magnetically insensitive and magnetically sensitive traces, which allows us to investigate the intrinsic noise in the system. The results are presented in Fig 4(b). The drop of the Allan deviation with a slope of -1/2 in both traces is a signature of white noise. For the magnetically sensitive measurements, the white noise reaches a minimum at 3.3 s. The increase of the Allan deviation at higher averaging time is a sign of thermal or mechanical drift in the system.
IV Outlook
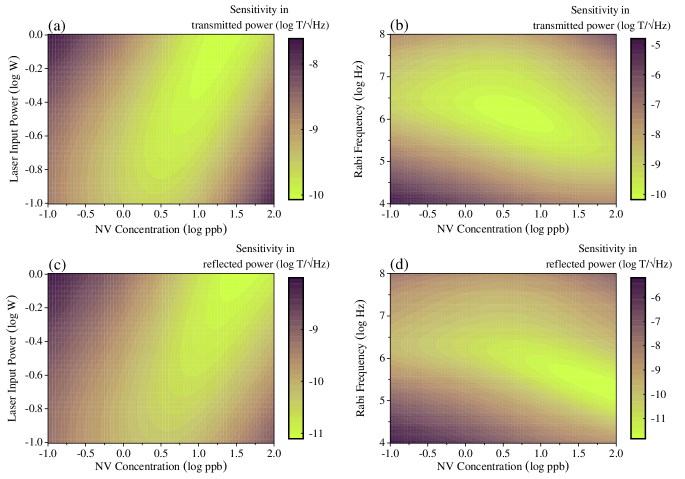
To better understand the context and magnitude of the measured sensitivity, we estimate the shot-noise-limited sensitivity for a single-peak ADMR as a function of [NV-], , and . Using the same physical dimensions as in our setup (cavity length and diamond thickness), we assume a diamond host where for any [NV-]. In addition, we consider that the reflectivity of the incoupling mirror is such that when for a given optical input power, ensuring that the cavity is impedance-matched. The intra-cavity power is thereby always maximized and there is no cavity reflection when no MW field is applied. The shot-noise-limited sensitivity was estimated from the ratio of the shot-noise level to max[]. The results of this calculation are presented in Fig. 5 for both transmitted (a,b) and reflected (c,d) powers. We have fixed MHz for (a,c) and W for (b,d). By monitoring the transmitted power and optimizing [NV-], , and , a shot-noise-limited sensitivity in the sub-100-pT/ range can be expected. In comparison, by monitoring the reflected power , a sensitivity in the pT/ range is projected. As the cavity is impedance-matched, applying no MW field results in . However, applying on resonance with a spin transition reduces the loss in the cavity and pushes the cavity into the over-coupled regime. For the case presented in Fig. 5(d) with a fixed input power W, the optimal sensitivity of 1 pT/ is obtained for MHz and [NV-] 70.8 ppb. At these settings, the cavity finesse is 13.7, the intra-cavity power reaches W and the maximum reflected power = 0.15 W . The total reflected power of such an over-coupled cavity contributes to the ADMR signal.
V Conclusion
In this article, we report on magnetic field sensing using an ensemble of NV centers based on the variation of a cavity’s transmitted pump power due to electron-spin absorption. Frequency-modulated ADMR spectra were measured, which was used to measure the local magnetic noise spectral density with a noise floor of 100 nT/ spanning a bandwidth up to 125 Hz. Our simulations show that a photon shot-noise-limited sensitivity of 1 pT/ can be achieved when measuring a cavity’s reflected power near the impedance-matched point and using a diamond with an optimized NV density. Cavity-based ADMR is an alternative to its ODMR counterpart, and has advantageous in terms of both detection contrast and device application. With the appropriate cavity design and sample optimization, it is anticipated that the work and technique presented here will provide a solid foundation for NV-based magnetometers.
VI Acknowledgments
We would like to thank Kristian Hagsted Rasmussen for help with the diamond sample preparation. We are also grateful to Jonas Schou Neergaard-Nielsen for fruitful discussions. This work was supported by the Danish Innovation Foundation through the EXMAD project and the Qubiz center, as well as the Danish Research Council through the Sapere Aude project (DIMS).
References
- Balasubramanian et al. (2008) G. Balasubramanian, I. Y. Chan, R. Kolesov, M. Al-Hmoud, J. Tisler, C. Shin, C. Kim, A. Wojcik, P. R. Hemmer, A. Krueger, T. Hanke, A. Leitenstorfer, R. Bratschitsch, F. Jelezko, and J. Wrachtrup, Nature 455, 648 (2008).
- Rondin et al. (2014) L. Rondin, J. P. Tetienne, T. Hingant, J. F. Roch, P. Maletinsky, and V. Jacques, Reports on Progress in Physics 77, 56503 (2014).
- Schirhagl et al. (2014) R. Schirhagl, K. Chang, M. Loretz, and C. L. Degen, Annual Review of Physical Chemistry 65, 83 (2014).
- Dolde et al. (2011) F. Dolde, H. Fedder, M. W. Doherty, T. Nöbauer, F. Rempp, G. Balasubramanian, T. Wolf, F. Reinhard, L. C. L. Hollenberg, F. Jelezko, and J. Wrachtrup, Nature Physics 7, 459 (2011).
- Kucsko et al. (2013) G. Kucsko, P. C. Maurer, N. Y. Yao, M. Kubo, H. J. Noh, P. K. Lo, H. Park, and M. D. Lukin, Nature 500, 54 (2013).
- Neumann et al. (2013) P. Neumann, I. Jakobi, F. Dolde, C. Burk, R. Reuter, G. Waldherr, J. Honert, T. Wolf, A. Brunner, J. H. Shim, D. Suter, H. Sumiya, J. Isoya, and J. Wrachtrup, Nano Letters 13, 2738 (2013).
- Hall et al. (2012) L. T. Hall, G. C. G. Beart, E. A. Thomas, D. A. Simpson, L. P. McGuinness, J. H. Cole, J. H. Manton, R. E. Scholten, F. Jelezko, J. Wrachtrup, S. Petrou, and L. C. L. Hollenberg, Scientific reports 2, 1 (2012).
- Barry et al. (2016) J. F. Barry, M. J. Turner, J. M. Schloss, D. R. Glenn, Y. Song, M. D. Lukin, H. Park, and R. L. Walsworth, Proceedings of the National Academy of Sciences 113, 14133 (2016).
- Steinert et al. (2013) S. Steinert, F. Ziem, L. T. Hall, A. Zappe, M. Schweikert, N. Götz, A. Aird, G. Balasubramanian, L. Hollenberg, and J. Wrachtrup, Nature Communications 4, 1607 (2013).
- Glenn et al. (2015) D. R. Glenn, K. Lee, H. Park, R. Weissleder, A. Yacoby, M. D. Lukin, H. Lee, R. L. Walsworth, and C. B. Connolly, Nature Methods 12, 736 (2015).
- Lovchinsky et al. (2016) I. Lovchinsky, A. O. Sushkov, E. Urbach, N. P. de Leon, S. Choi, K. D. Greve, R. Evans, R. Gertner, E. Bersin, C. Müller, L. McGuinness, F. Jelezko, R. L. Walsworth, H. Park, and M. D. Lukin, Science 351, 836 (2016).
- Fu et al. (2014) R. R. Fu, B. P. Weiss, E. A. Lima, R. J. Harrison, X.-N. Bai, S. J. Desch, D. S. Ebel, C. Suavet, H. Wang, D. Glenn, D. L. Sage, T. Kasama, R. L. Walsworth, and A. T. Kuan, Science 346, 1089 (2014).
- Kolkowitz et al. (2015) S. Kolkowitz, A. Safira, A. A. High, R. C. Devlin, S. Choi, Q. P. Unterreithmeier, D. Patterson, A. S. Zibrov, V. E. Manucharyan, H. Park, and M. D. Lukin, Science 347, 1129 (2015).
- Jakobi et al. (2016) I. Jakobi, P. Neumann, Y. Wang, D. Dasari, F. E. Hallak, M. A. Bashir, M. Markham, A. Edmonds, D. Twitchen, and J. Wrachtrup, Nature Nanotechnology 12, 1 (2016).
- Clevenson et al. (2015) H. Clevenson, M. E. Trusheim, C. Teale, T. Schröder, D. Braje, and D. Englund, Nature Physics 11, 393 (2015).
- Ahmadi et al. (2017) S. Ahmadi, H. A. El-Ella, J. O. Hansen, A. Huck, and U. L. Andersen, Physical Review Applied 8, 034001 (2017).
- Taylor et al. (2008) J. M. Taylor, P. Cappellaro, L. Childress, L. Jiang, D. Budker, P. R. Hemmer, A. Yacoby, R. Walsworth, and M. D. Lukin, Nature Physics 4, 810 (2008).
- Hadden et al. (2010) J. P. Hadden, J. P. Harrison, A. C. Stanley-Clarke, L. Marseglia, Y. L. D. Ho, B. R. Patton, J. L. O’Brien, and J. G. Rarity, Applied Physics Letters 97, 241901 (2010).
- Le Sage et al. (2012) D. Le Sage, L. M. Pham, N. Bar-Gill, C. Belthangady, M. D. Lukin, A. Yacoby, and R. L. Walsworth, Physical Review B 85, 121202 (2012).
- Israelsen et al. (2014) N. M. Israelsen, S. Kumar, M. Tawfieq, J. S. Neergaard-Nielsen, A. Huck, and U. L. Andersen, Journal of Optics 16, 114017 (2014).
- Riedel et al. (2014) D. Riedel, D. Rohner, M. Ganzhorn, T. Kaldewey, P. Appel, E. Neu, R. J. Warburton, and P. Maletinsky, Physical Review Applied 2, 064011 (2014).
- Momenzadeh et al. (2015) S. A. Momenzadeh, R. J. Stöhr, F. F. De Oliveira, A. Brunner, A. Denisenko, S. Yang, F. Reinhard, and J. Wrachtrup, Nano Letters 15, 165 (2015).
- Wolf et al. (2015) T. Wolf, P. Neumann, K. Nakamura, H. Sumiya, T. Ohshima, J. Isoya, and J. Wrachtrup, Physical Review X 5, 041001 (2015).
- Jensen et al. (2014) K. Jensen, N. Leefer, A. Jarmola, Y. Dumeige, V. M. Acosta, P. Kehayias, B. Patton, and D. Budker, Physical Review Letters 112, 160802 (2014).
- Wickenbrock et al. (2016) A. Wickenbrock, H. Zheng, L. Bougas, N. Leefer, S. Afach, A. Jarmola, V. M. Acosta, and D. Budker, Applied Physics Letters 109, 053505 (2016).
- Huxter et al. (2013) V. M. Huxter, T. a. a. Oliver, D. Budker, and G. R. Fleming, Nature Physics 9, 744 (2013).
- Wee et al. (2007) T. L. Wee, Y. K. Tzeng, C. C. Han, H. C. Chang, W. Fann, J. H. Hsu, K. M. Chen, and E. C. Yu, Journal of Physical Chemistry A 111, 9379 (2007).
- Smeltzer et al. (2009) B. Smeltzer, J. McIntyre, and L. Childress, Physical Review A 80, 1 (2009).
- El-Ella et al. (2017) H. A. R. El-Ella, S. Ahmadi, A. M. Wojciechowski, A. Huck, and U. L. Andersen, Optics Express 25, 14809 (2017).
- Robledo et al. (2011) L. Robledo, H. Bernien, T. V. D. Sar, and R. Hanson, New Journal of Physics 13 (2011).
- Acosta et al. (2010) V. M. Acosta, A. Jarmola, E. Bauch, and D. Budker, Physical Review B 82, 201202 (2010).
- Jensen et al. (2013) K. Jensen, V. M. Acosta, A. Jarmola, and D. Budker, Physical Review B 87, 014115 (2013).