Abstract
Recent detection of suborbital gamma-ray variability of Flat Spectrum Radio Quasar (FSRQ) 3C 279 by Fermi Large Area Telescope (LAT) is in severe conflict with established models of blazar emission. This paper presents the results of suborbital analysis of the Fermi/LAT data for the brightest gamma-ray flare of another FSRQ blazar 3C 454.3 in November 2010 (Modified Julian Date; MJD 55516-22). Gamma-ray light curves are calculated for characteristic time bin lengths as short as 3 min. The measured variations of the 0.1–10 GeV photon flux are tested against the hypothesis of steady intraorbit flux. In addition, the structure function is calculated for absolute photon flux differences and for their significances. Significant gamma-ray flux variations are measured only over time scales longer than 5 h, which is consistent with the standard blazar models.
keywords:
blazars; variability; gamma-rays100 \doinum10.3390/galaxies5040100 \pubvolume5 \historyReceived: 31 October 2017; Accepted: 1 December 2017; Published: 12 December 2017 \TitleSuborbital Fermi/LAT Analysis of the Brightest Gamma-Ray Flare of Blazar 3C 454.3 \AuthorKrzysztof Nalewajko \orcidA \AuthorNamesKrzysztof Nalewajko \corresCorrespondence: knalew@camk.edu.pl(Please carefully check the accuracy of names and affiliations. Changes will not be possible after proofreading.)
1 Introduction
Blazars—active galaxies with relativistically beamed non-thermal broad-band emission—belong to the brightest gamma-ray sources in the sky. Their emission is notoriously variable, and their gamma-ray variability has been measured on time scales ranging from years to minutes (see Madejski & Sikora (2016) for a recent review). The Fermi Large Area Telescope is the most sensitive instrument for measuring high-energy (HE) gamma rays in the energy range 0.1–10 GeV Atwood et al. (2009). Since August 2008, it performs an almost uninterrupted monitoring of the entire sky, orbiting Earth at the period of .
Determining the shortest variability time scale for the gamma-ray emission of blazars has tremendous theoretical implications for the physics of energy dissipation and particle acceleration in relativistic jets. Before the launch of Fermi, the shortest variability time scales of were measured in the very-high-energy (VHE) gamma rays above by ground-based Cherenkov telescopes, in particular by H.E.S.S. in PKS 2155-304 Aharonian et al. (2007) and by MAGIC in Mrk 501 Albert et al. (2007). Such a short variability time scale is much shorter than the light-crossing time of supermassive black holes located at the bases of relativistic jets of blazars. This implicates the existence of very compact local dissipation sites, e.g., related to relativistic magnetic reconnection Giannios et al. (2009); Nalewajko et al. (2011), or extremely efficient jet focusing due to recollimation shocks Bodo & Tavecchio (2017). In addition, the combination of high apparent luminosity with small size of the emitting region, i.e., exceptional radiative compactness, poses a problem of potentially very efficient intrinsic absorption of gamma-ray photons. Additional challenges arise in the case of the most luminous blazars known as flat spectrum radio quasars (FSRQs) due to the presence of dense radiation fields that provide a target for external absorption of gamma rays Tavecchio et al. (2011); Nalewajko et al. (2012). In order to avoid such absorption, one can consider highly relativistic bulk motions with Lorentz factors Begelman et al. (2008) or possibly conversion of gamma-ray photons into axions Tavecchio et al. (2012).
There were previously claims of the detection of gamma-ray variability in Fermi/LAT sources at suborbital time scales, e.g., in PKS 1510-089 Foschini et al. (2013). When analysing the brightest gamma-ray flares of blazars during the first four years of the Fermi mission Nalewajko (2013), the very brightest case of 3C 454.3 at MJD 55520 (November 2010) Abdo et al. (2011) was investigated for possible evidence of suborbital variability. That analysis, performed with the older calibration standard P7V6, was inconclusive, and hence it was not published at that time (upper limits on variability time scales of a few hours were reported for this event by Foschini et al. (2011)). However, after the Fermi Collaboration presented the case for suborbital variability in blazar 3C 279 at MJD 57189 (Jun 2015) Ackermann et al. (2016), it became clear that the case of 3C 454.3 needs to be reconsidered. Indeed, the theoretical implications of detectable suborbital gamma-ray variability in 3C 279 are extreme (see also Petropoulou et al. (2017); Vittorini et al. (2017); Aharonian et al. (2017)). For example, in the standard ERC (External Radiation Comptonization) scenario of gamma-ray emission in FSRQ blazars, the minimum jet Lorentz factor should be to satisfy the opacity, cooling, Eddington and SSC constraints, and to achieve equipartition between matter and magnetic fields Ackermann et al. (2016). Moreover, a large fraction of the total jet power should be concentrated into a tiny emitting region of at the distance scale comparable to the broad-line region . Such requirements cannot be reconciled with the conventional models of blazar emission Dermer et al. (2009); Sikora et al. (2009); Ghisellini et al. (2010); Böttcher et al. (2013); Nalewajko et al. (2014).
2 Results
Figure 1 shows the long-term gamma-ray variations of blazar 3C 454.3, calculated with the use of adaptive time bins Sobolewska et al. (2014). Over the period of 1000 days, the gamma-ray flux of 3C 454.3 varies by almost factor 1000. Correspondingly, the lengths of the time bins range from 25 days down to 20 min, always satisfying the detection condition of . During this time, 3C 454.3 produced three major outbursts. The first two, peaking at MJD 55167 and MJD 55294, were originally investigated in Ackermann et al. (2010). The last one, peaking at MJD 55520 with (for 3 h bins) Abdo et al. (2011), represents the brightest gamma-ray state of any blazar to date, also exceeding the brightest gamma-ray pulsars.
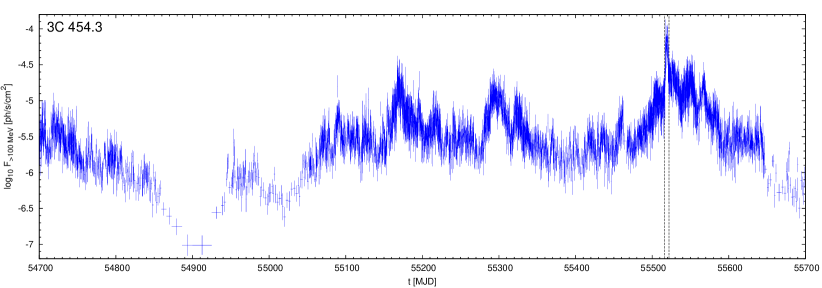
Figure 2 presents the gamma-ray light curves of 3C 454.3 produced on sub-orbital time scales in the time range MJD 55516-22. These light curves are calculated for three values of characteristic minimum time bin length . As the lengths of visibility windows appear modulated on a superorbital time scale, the number of time bins per orbit is variable.
The maximum likelihood analysis returns the predicted number of gamma-ray photons (events/counts) associated with 3C 454.3. It is a good measure of the relative measurement error , or the signal-to-noise ratio . Within the time range of MJD 55517-21, we find persistent values of per time bin, with the median values for , respectively.
For every orbit where we have at least three independent consecutive measurements (there is no such case for ), we perform a reduced test against the null hypothesis that the photon flux is constant within the orbital visibility window. In Figure 2, we report the probability values for the null hypothesis. We find the median values of for , respectively. The smallest values that we found are ; hence, we can hardly reject the null hypothesis and claim statistically significant suborbital flux variability.
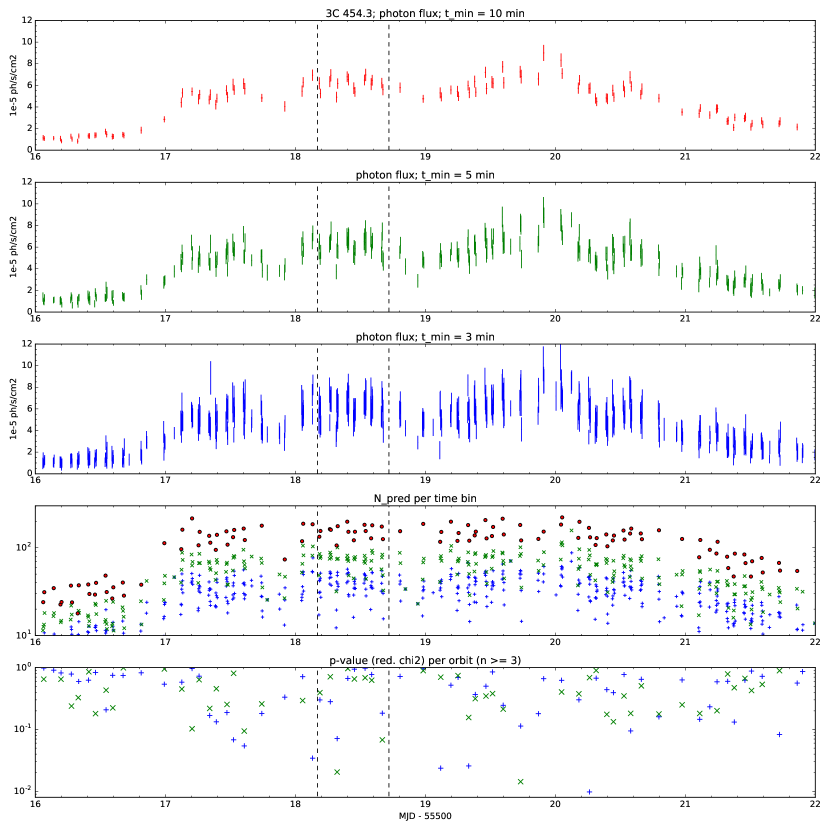
Figure 3 shows a short section (MJD 55518.17-72) of the suborbital light curves, comparing directly the flux measurements for . Within this time range, the strongest departure from constant flux is found for the orbit centred at MJD 55518.32. For , we have four measurements with , which yields . We also measure the weighted mean photon flux (in units of ), the root-mean-square (rms) of flux , and the rms of flux statistical error . For comparison, in the case of , we have eight measurements with , , , , and .
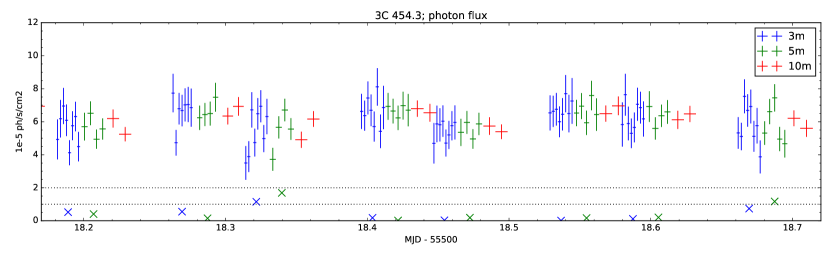
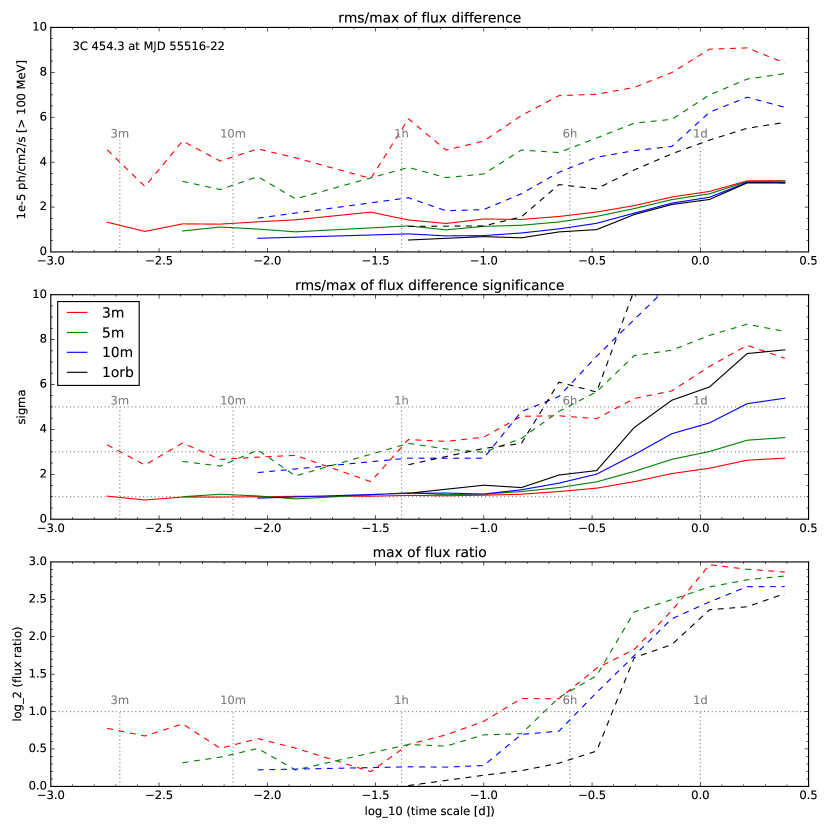
Figure 4 shows the results of structure function analysis. As described in Section 4, structure function is calculated for (1) absolute photon flux difference, (2) statistical significance of photon flux difference, and (3) photon flux ratio. For a particular light curve, the time delay values probe the range from to about three days. We use the root-mean-square (rms) statistic (square root of classical structure function) to probe systematic variations, and the maximum (max) statistic to probe occasional variations (shots). The rms of absolute flux difference decreases systematically with increasing for , as expected for statistical noise. The rms values converge at for . The maximum values decrease systematically and do not converge again as expected.
On the other hand, the rms of statistical significance of flux difference converges for short time delays at . For the same range of time delays, the maximum values of are close to 3. For longer time delays, the rms of exceeds unity, systematically increasing with increasing . For example, for , we find that for , and for (1-orbit light curve). The maximum values of also exceed 3 for . The significance of occasional flux variations (max) exceeds 5 for (for and ). However, the significance of systematic flux variations (rms) exceeds 3 only for .
In order to estimate the flux-doubling time scale , the max values of the flux ratio are evaluated. Estimates of the flux-doubling time scale are found to increase systematically with , from for , to for .
3 Discussion
This analysis of blazar 3C 454.3 at MJD 55520 can be compared with the recent study of blazar 3C 279 at MJD 57189 Ackermann et al. (2016). In the case of 3C 279, the exposure to gamma-rays per orbit was enhanced by factor thanks to first successful pointing observation by Fermi/LAT. Although occultations by the Earth were still significant, the visibility windows were longer and the exposure to the target more uniform. Nevertheless, the number of gamma-ray counts collected over very short time bins, , is on average higher in the case of 3C 454.3, since its average photon flux is higher by factor . Moreover, such high gamma-ray flux was sustained over a longer period of almost four days, allowing for many more suborbital detections.
At redshift , the luminosity distance to 3C 454.3 is , hence . An upper limit on suborbital photon flux variation amplitude of (the rms of photon flux difference for at ) with the mean photon energy of (corresponding to the photon index of ; see below) can be translated into the apparent gamma-ray luminosity of . This limit is comparable with the apparent luminosity of suborbital variations detected in blazar 3C 279 (, ) Ackermann et al. (2016). Because of the high redshift of 3C 454.3, the eventual detection of gamma-ray variability on the time scales of several minutes would create even more serious problems to the theory of blazars.
4 Materials and Methods
The analysis of Fermi/LAT data presented in this work is performed with the final software package Science Tools version v10r0p5111https://fermi.gsfc.nasa.gov/ssc/data/analysis/software/ and with the final instrument calibration standard P8R2_SOURCE_V6. Photons are selected in the energy range 0.1–10 GeV from a Region of Interest (RoI) of , applying a zenith angle cut of . Background sources were selected from the 3FGL catalog Acero et al. (2015) within the radius of . We applied a detection criterion and .
Although Fermi/LAT is characterised by very wide field-of-view (2.4 sr), individual sources are visible only during short time intervals for each orbit. Using the spacecraft telemetry data, I select visibility windows when the angular separation between the source and the main axis of LAT is , also selecting for good-time-intervals (GTIs) and avoiding the South Atlantic Anomaly (SAA). Such visibility windows are of variable length, but typically they are shorter than 30 min. Given a minimum time scale , each visibility window of duration is divided into as many as possible time bins of equal length , i.e., . While this choice results in slightly different values of for each orbit, it assures that the entire exposure of 3C 454.3 (except windows shorter than ) is used in the analysis.
A standard maximum likelihood analysis is used to measure the gamma-ray flux of 3C 454.3. In order to minimise the number of degrees of freedom, all other parameters, including the normalisations and photon indices of background sources, were fixed to their average values determined from a global fit performed over time range MJD 55516-22. The photon index of 3C 454.3 was fixed at the value determined in the same way.
From the maximum likelihood analysis, light curves are obtained in the form , where is the centre of time bin, is the measured photon flux, and is the statistical 1 error of photon flux measurement. A structure function Emmanoulopoulos et al. (2010) is calculated from a given light curve by considering all pairs of measurements made at times , binned according to the logarithm of time delay . Given a measured parameter , for every delay bin, the distribution of differences is determined, and then the statistics and are calculated. In particular, three types of variations are considered: (1) absolute photon flux difference ; (2) significance of photon flux difference ; and (3) photon flux ratio .
5 Conclusions
Analysis of gamma-ray variability of blazar 3C 454.3 during its brightest gamma-ray flare at MJD 55516-22 from the Fermi/LAT data is performed on suborbital time scales (). The statistical significance of photon flux measurements is certainly not worse than in the case of blazar 3C 279 around MJD 57189 Ackermann et al. (2016), where exposure was increased thanks to a successful pointing observation. By probing different characteristic suborbital time scales , no evidence is found for statistically significant suborbital variability. The reduced test against the null hypothesis of constant flux per orbital visibility window returns . The structure function analysis suggests: (1) an upper limit on suborbital variations at corresponding to ; (2) occasional (max) flux variations become significant () for ; (3) systematic (rms) flux variations become significant () for ; and (4) the flux-doubling time scale is of the order . These results are consistent with the standard models of blazar emission.
Acknowledgements.
Discussions with Greg Madejski and Alex Markowitz are acknowledged. This work was supported by the Polish National Science Centre grant 2015/18/E/ST9/00580. This work is based on public data acquired by the Fermi Large Area Telescope created by NASA and DoE (USA) in collaboration with institutions from France, Italy, Japan and Sweden. \conflictsofinterestThe author declares no conflict of interest. \reftitleReferencesReferences
- Madejski & Sikora (2016) Madejski, G.M.; Sikora, M. Gamma-Ray Observations of Active Galactic Nuclei. Annu. Rev. Astron. Astrophys. 2016, 54, 725.
- Atwood et al. (2009) Atwood, W.B.; Abdo, A.A.; Ackermann, M.; Althouse, W.; Anderson, B.; Axelsson, M.; Baldini, L.; Ballet, J.; Band, D.L.; Barbiellini, G.; et al. The Large Area Telescope on the Fermi Gamma-Ray Space Telescope Mission. Astrophys. J. 2009, 697, 1071.
- Aharonian et al. (2007) Aharonian, F.; Akhperjanian, A.G.; Bazer-Bachi, A.R.; Behera, B.; Beilicke, M.; Benbow, W.; Berge, D.; Bernlöhr, K.; Boisson, C.; Bolz, O.; et al. An Exceptional Very High Energy Gamma-Ray Flare of PKS 2155-304. Astrophys. J. 2007, 664, L71.
- Albert et al. (2007) Albert, J.; Aliu, E.; Anderhub, H.; Antoranz, P.; Armada, A.; Baixeras, C.; Barrio, J.A.; Bartko, H.; Bastieri, D.; Becker, J.K.; et al. Variable Very High Energy -Ray Emission from Markarian 501. Astrophys. J. 2007, 669, 862.
- Giannios et al. (2009) Giannios, D.; Uzdensky, D.A.; Begelman, M.C. Fast TeV variability in blazars: Jets in a jet. Mon. Not. Roy. Astron. Soc. 2009, 395, L29.
- Nalewajko et al. (2011) Nalewajko, K.; Giannios, D.; Begelman, M.C.; Uzdensky, D.A.; Sikora, M. Radiative properties of reconnection-powered minijets in blazars. Mon. Not. Roy. Astron. Soc. 2011, 413, 333.
- Bodo & Tavecchio (2017) Bodo, G.; Tavecchio, F. Recollimation shocks and radiative losses in extragalactic relativistic jets. arXiv 2017, arXiv:1710.06713.
- Tavecchio et al. (2011) Tavecchio, F.; Becerra-Gonzalez, J.; Ghisellini, G.; Stamerra, A.; Bonnoli, G.; Foschini, L.; Maraschi, L. On the origin of the gamma-ray emission from the flaring blazar PKS 1222+216. Astron. Astrophys. 2011, 534, A86.
- Nalewajko et al. (2012) Nalewajko, K.; Begelman, M.C.; Cerutti, B.; Uzdensky, D.A.; Sikora, M. Energetic constraints on a rapid gamma-ray flare in PKS 1222+216. Mon. Not. Roy. Astron. Soc. 2012, 425, 2519.
- Begelman et al. (2008) Begelman, M.C.; Fabian, A.C.; Rees, M.J. Implications of very rapid TeV variability in blazars. Mon. Not. Roy. Astron. Soc. 2008, 384, L19.
- Tavecchio et al. (2012) Tavecchio, F.; Roncadelli, M.; Galanti, G.; Bonnoli, G. Evidence for an axion-like particle from PKS 1222+216? Phys. Rev. D 2012, 86, 085036.
- Foschini et al. (2013) Foschini, L.; Bonnoli, G.; Ghisellini, G.; Tagliaferri, G.; Tavecchio, F.; Stamerra, A. Fermi/LAT detection of extraordinary variability in the gamma-ray emission of the blazar PKS 1510-089. Astron. Astrophys. 2013, 555, A138.
- Nalewajko (2013) Nalewajko, K. The brightest gamma-ray flares of blazars. Mon. Not. Roy. Astron. Soc. 2013, 430, 1324.
- Abdo et al. (2011) Abdo, A.A.; Ackermann, M.; Ajello, M.; Allafort, A.; Baldini, L.; Ballet, J.; Barbiellini, G.; Bastieri, D.; Bellazzini, R.; Berenji, B.; et al. Fermi Gamma-ray Space Telescope Observations of the Gamma-ray Outburst from 3C454.3 in November 2010. Astrophys. J. 2011, 733, L26.
- Foschini et al. (2011) Foschini, L.; Ghisellini, G.; Tavecchio, F.; Bonnoli, G.; Stamerra, A. Search for the shortest variability at gamma rays in flat-spectrum radio quasars. Astron. Astrophys. 2011, 530, A77.
- Ackermann et al. (2016) Ackermann, M.; Anantua, R.; Asano, K.; Baldini, L.; Barbiellini, G.; Bastieri, D.; Gonzalez, J.B.; Bellazzini, R.; Bissaldi, E.; Blandford, R.D.; et al. Minute-timescale >100 MeV -Ray Variability during the Giant Outburst of Quasar 3C 279 Observed by Fermi-LAT in 2015 June. Astrophys. J. 2016, 824, L20.
- Petropoulou et al. (2017) Petropoulou, M.; Nalewajko, K.; Hayashida, M.; Mastichiadis, A. A hadronic minute-scale GeV flare from quasar 3C 279? Mon. Not. Roy. Astron. Soc. 2017, 467, L16.
- Vittorini et al. (2017) Vittorini, V.; Tavani, M.; Cavaliere, A. Meeting the Challenge from Bright and Fast Gamma-Ray Flares of 3C 279. Astrophys. J. 2017, 843, L23.
- Aharonian et al. (2017) Aharonian, F.A.; Barkov, M.V.; Khangulyan, D. Scenarios for Ultrafast Gamma-Ray Variability in AGN. Astrophys. J. 2017, 841, 61.
- Dermer et al. (2009) Dermer, C.D.; Finke, J.D.; Krug, H.; Böttcher, M. Gamma-Ray Studies of Blazars: Synchro-Compton Analysis of Flat Spectrum Radio Quasars. Astrophys. J. 2009, 692, 32–46.
- Sikora et al. (2009) Sikora, M.; Stawarz, Ł.; Moderski, R.; Nalewajko, K.; Madejski, G.M. Constraining Emission Models of Luminous Blazar Sources. Astrophys. J. 2009, 704, 38.
- Ghisellini et al. (2010) Ghisellini, G.; Tavecchio, F.; Foschini, L.; Ghirlanda, G.; Maraschi, L.; Celotti, A. General physical properties of bright Fermi blazars. Mon. Not. Roy. Astron. Soc. 2010, 402, 497.
- Böttcher et al. (2013) Böttcher, M.; Reimer, A.; Sweeney, K.; Prakash, A. Leptonic and Hadronic Modeling of Fermi-Detected Blazars. Astrophys. J. 2013, 768, 54.
- Nalewajko et al. (2014) Nalewajko, K.; Begelman, M.C.; Sikora, M. Constraining the Location of Gamma-Ray Flares in Luminous Blazars. Astrophys. J. 2014, 789, 161.
- Sobolewska et al. (2014) Sobolewska, M.A.; Siemiginowska, A.; Kelly, B.C.; Nalewajko, K. Stochastic Modeling of the Fermi/LAT -Ray Blazar Variability. Astrophys. J. 2014, 786, 143.
- Ackermann et al. (2010) Ackermann, M.; Ajello, M.; Baldini, L.; Ballet, J.; Barbiellini, G.; Bastieri, D.; Bechtol, K.; Bellazzini, R.; Berenji, B.; Blandford, R.D.; et al. Fermi Gamma-ray Space Telescope Observations of Gamma-ray Outbursts from 3C 454.3 in 2009 December and 2010 April. Astrophys. J. 2010, 721, 1383.
- Acero et al. (2015) Acero, F.; Ackermann, M.; Ajello, M.; Albert, A.; Atwood, W.B.; Axelsson, M.; Baldini, L.; Ballet, J.; Barbiellini, G.; Bastieri, D.; et al. Fermi Large Area Telescope Third Source Catalog. Astrophys. J. Suppl. 2015, 218, 23.
- Emmanoulopoulos et al. (2010) Emmanoulopoulos, D.; McHardy, I.M.; Uttley, P. On the use of structure functions to study blazar variability: Caveats and problems. Mon. Not. Roy. Astron. Soc. 2010, 404, 931.