Bulk electronic structure of non-centrosymmetric EuGe3 (= Co, Ni, Rh, Ir) studied by hard x-ray photoelectron spectroscopy
Abstract
Non-centrosymmetric EuGe3 (=Co, Ni, Rh, and Ir) possesses magnetic Eu2+ ions and antiferromagnetic ordering appears at low temperatures. Transition metal substitution leads to changes of the unit cell volume and of the magnetic ordering. However, the magnetic ordering temperature does not scale with the volume change and the Eu valence is expected to remain divalent. Here we study the bulk electronic structure of non-centrosymmetric EuGe3 (=Co, Ni, Rh, and Ir) by hard x-ray photoelectron spectroscopy. The Eu 3 core level spectrum confirms the robust Eu2+ valence state against the transition metal substitution with a small contribution from Eu3+. The estimated Eu mean-valence is around 2.1 in these compounds as confirmed by multiplet calculations. In contrast, the Ge spectrum shifts to higher binding energy upon changing the transition metal from 3 to 4 to 5 elements, hinting of a change in the Ge- bonding strength. The valence bands of the different compounds are found to be well reproduced by ab initio band structure calculations.
I Introduction
Strongly correlated 4-electron systems have been a platform for studying various anomalous phenomena, such as valence fluctuations, unconventional superconductivity, heavy fermion behavior and spin/charge ordering Varma1976 ; Antonov2011 . The ground state property of these compounds are characterized by competing Kondo effects or Rudermann-Kittel-Kasuya-Yoshida (RKKY) interactions. Both interactions originate from the interplay of localized electrons and itinerant conduction electrons, though the former quenches the magnetic moments, while the latter leads to magnetic ordering in the ground state. The competition between Kondo effect and RKKY interactions in Ce- and Yb-compounds are often discussed within the Doniach phase diagram Doniach1977 . In the vicinity of the quantum critical point (QCP), where the non-thermal parameter controlled phase transition happens at absolute zero temperature, particularly, quantum fluctuations accommodate exotic phenomena Si2010 .
Eu-compounds exhibit very different phase diagrams from Ce- and Yb-compounds, and an absence of a QCP. Most of the reported Eu-compounds favor a Eu2+ (, =7/2) valence state with an antiferromagnetic ground state. However, the energy difference between Eu2+ and the non-magnetic Eu3+ (, =0) valence state is not so largeBauminger1973 and is reachable by applying external pressure or chemical substitution. Indeed, amongst the most extensively studied Eu-compounds series with the ThCr2Si2-type crystal structure, pressure or chemical substitution controlled first-order valence transitions and valence fluctuations are frequently reported Onuki2016 . In the Eu(Pd1-xAux)2Si2 system, EuAu2Si2 possesses a Eu2+ valence state and exhibits antiferromagnetic ordering below the Néel temperature () of K Felner1975 . Substitution of smaller Pd ions decreases the lattice parameter and, by contrast, increases . Above , the magnetic transition is suddenly taken over by a first-order valence transition to Eu3+.Segre1982 The Eu valence deviates from integer values, to so called intermediate valence states, and is 2.8 in EuPd2Si2 below 150 K Sampath1981 . A similar tendency is also reported for Eu(Pt1-xNix)2Si2 Mitsuda2007 and EuNi2(Si1-xGex)2 Wada1999 systems in such a way that the substitution by elements with small ionic radii works in the same way as pressure and leads to a non-magnetic ground state. Application of external pressure shows a consistent behavior compared with chemical substitutions Hesse1997 . Due to the different ionic size between Eu2+ and Eu3+, the change of the Eu valence state is often assigned to Kondo volume collapse effectsAllen1982 ; Allen1992 . In contrast, changes of the Eu valence state and ground state property are found to be independent of the volume effect in Eu(Rh1-xIrx)2Si2 system. The conversion from divalent EuRh2Si2 to valence-fluctuating EuIr2Si2 involves only a 1.5% volume change, indicating its origins in electronic structure changesSeiro2011 . Very recently, exotic behavior has been discovered in EuRhSi3 and Eu2Ni3Ge5 Nakamura2015 ; Muth2016 ; Nakashima2017 that cannot be explained by the conventional phase diagram of Eu-compounds. Both EuRhSi3 and Eu2Ni3Ge5 have magnetic Eu2+ ions and exhibit antiferromagnetism below =49 K and 19 K, respectively, at ambient pressure. Electrical resistivity measurements under pressure have reported the suppression of a magnetic ordering temperature and a successive phase transition to a non-magnetic heavy fermion state without a hint of a valence transition Muth2016 ; Nakashima2017 . These behaviors are similar to Ce- and Yb-compounds and indicate the possible existence of a QCP. These new aspects of Eu-compounds urge a systematic study of the electronic structure and its relation to physical properties.
Eu-based ternary germanides EuGe3 (=Co, Ni, Rh, Ir) and EuRhSi3 are isostructural, possess a BaNiSn3-type structure () which is similar to the ThCr2Si2-type structure, though without centrosymmetry Bednarchuk2015a . Magnetic susceptibility measurements Goetsch2013 ; Bednarchuk2015a ; Bednarchuk2015b ; Bednarchuk2015c and Mössbauer spectroscopy Maurya2014 ; Maurya2016 report the presence of magnetic Eu2+ ions in all the compounds and localized Eu 4 moments order antiferromagnetically at similar temperatures. The magnetic moments order antiferromagnetically along the -axis at =15.4, 13.5 and 12.3 K for EuCoGe3, EuNiGe3 and EuIrGe3, respectively. EuCoGe3 and EuIrGe3 exhibit additional magnetic transitions at 13.4 and 7.5 K, respectively, due to a change of the antiferromagnetic structureBednarchuk2015a ; Bednarchuk2015c . Recently, three antiferromagnetic phases have been discovered in EuIrGe3 and a helical magnetic structure based on the Dzyaloshinskii-Moriya interaction was proposed.Kakihana2017 Conversely in EuRhGe3, the magnetic moments order perpendicular to the -axis at 12 K Bednarchuk2015a ; Bednarchuk2015c . For each compound, the effective magnetic moments are close to the Eu2+ ionic value of 7.90 Bednarchuk2015a . All the transition metals are nonmagnetic in EuGe3. Despite the variation of transition metal substitution and the change in the unit cell volume, the Eu ions seems to have a robust Eu2+ valence state with being barely affected. In the EuNi(Si1-xGex)3 system, transport measurements reported a monotonous decrease of with an increase in Ge substitution indicating its strong connection with the volume change Uchima2014a . However, the change of in EuGe3 by transition metal substitution does not show a propotional change with the unit cell volume. This implies that variation of the physical properties of the EuGe3 by transition metal substitution is rather dominated by the change in electronic structure rather than the unit cell volume effect. In order to study the transition metal substitution effect on the electronic structure of EuGe3, we performed hard x-ray photoelectron spectroscopy (HAXPES). By using the bulk sensitive HAXPES method, we can unambiguously determine the Eu valence from Eu 3 core level spectra and suppress the surface contribution. The Eu 3 core level spectra confirmed that the Eu2+ valence state is robust against transition metal substitution. The estimated Eu valence is close to 2.1. In contrast, Ge 2 core level spectrum shifts to high binding energy by changing transition metal from 3 to 4 to elements. A similar trend was observed in the Eu 4 spectrum in the valence band. We compare the measured valence band electronic structure with ab initio band structure calculations.
II Experimental
HAXPES measurements were performed at the GALAXIES beamline Ceolin2013 ; Rueff2015 of the SOLEIL synchrotron. The incident energy was selected by using the third order of the Si(111) monochromator (=6.9 keV) yielding a photon bandwidth of meV. The photon beam was linearly polarized with the electrical field vector in the plane of the storage ring. Photoelectrons were collected by using a hemispherical analyzer EW4000 (VG Scienta). The binding energy of spectra was calibrated by measuring the Fermi edge of a Au film. The overall energy resolution was estimated to be 250 meV from Au Fermi edge fitting. EuGe3 (=Co, Ni, Rh and Ir) single crystals were grown by the metal-flux method Bednarchuk2015a . The grown crystals were characterized by x-ray diffraction, magnetic susceptibility and electrical resistivity measurements. The clean surfaces of the samples were obtained by fracturing in-situ under vacuum (better than 510-8 mbar). The samples were aligned in a grazing incidence (normal emission) geometry. In order to avoid radiation damage, all the measurements were performed at the lowest reachable temperature of 30 K.
III Results and discussion
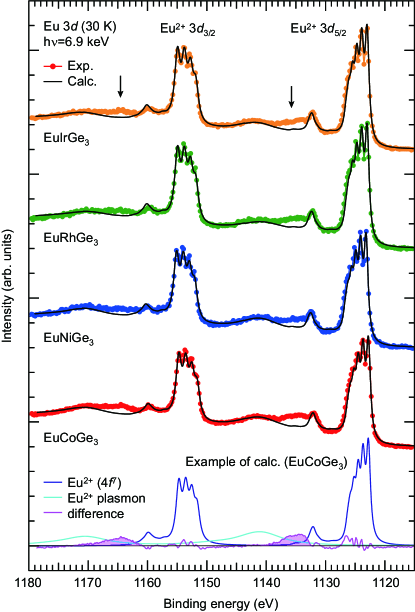
Figure 1 shows the Eu 3 core level spectra of EuGe3 (=Co, Ni, Rh and Ir) measured at 30 K. The Eu 3 spectra are split into a 3 (1120-1145 eV) and 3 (1150-1175 eV) components due to spin-orbit interaction. Each spin-orbit partner further split into a Eu2+ component at lower binding energy and the Eu3+ component at higher binding energy representing the Eu and Eu transitions, respectively. Here, denotes a core hole and the outgoing photoelectron. Broad structures around 1140 and 1170 eV are attributed to plasmon statellites related to the Eu2+ 3 photoemission process. Compared to the Eu 3 spectrum of other divalent Eu compounds, such as EuRh2Si2 (mean-Eu valence at 300-20 K) Ichiki2017 and EuNi2(Si0.21Ge0.79)2 ( at 300 K) Ichiki2017b , the relative intensity of Eu3+ components to those of Eu2+ is small and buried in the tail of the Eu2+ components and its statellite structures. As expected from magnetic susceptibility and Mössbauer measurements, the Eu valence states in the EuGe3 series are very close to Eu2+. In order to elucidate Eu3+ contributions, a simulation analysis was performed by carrying out atomic multiplet calculations to account for the lineshape of the Eu 3 core level spectra. The Eu 3 spectra were simulated by using the XTLS (version 9.01) code Tanaka1994 with a 4 (Eu2+) ground-state configuration. The electrostatic and exchange parameters were obtained by Cowan's atomic Hartree-Fock program with relativistic corrections Cowan1981 . The exchange parameters were scaled down to 86 of their Hartree-Fock values. The calculated spectra are convoluted with a Lorentzian function for lifetime broadening and a Gaussian to account for the experimental resolution. The broadening parameters as well as the values used for the Coulomb and exchange multiplet interactions are listed in Ref. Slater, . An example of the simulation for EuCoGe3 is shown in the bottom of Fig. 1. The plasmon satellites (light blue line) are reproduced by broadening the simulated Eu2+ atomic multiplet spectrum and shifting in order to be in agreement with the experimental energy. Their relative intensity and the energy position to the Eu2+ 3 components were calibrated using the Ge 2 peak and its plasmon position (see inset of Fig. 2 (b)). The solid black lines in Fig. 1 represent the simulated spectra including the atomic multiplet spectrum, plasmon satellites and integral background Shirley1972 . The experimental spectra are fitted by adjusting the intensity of the calculated spectra such that the difference between the experimental and the calculated spectra are minimized. As seen in Fig. 1, the simulations can well reproduce the multiplet structures of the experimental spectra. Since the simulations only take into account the Eu2+ contribution, the deviations from the simulated spectrum at 1135 and 1165 eV are assigned to the Eu3+ contributions. We extracted the Eu3+ component by subtracting the simulated spectrum from that of experiment. A contribution from the Eu3+ plasmon satellites to the Eu spectrum is negligibly small and therefore not considered in this analysis. Some residual wiggling feature on the difference spectrum (purple line) originates mostly from tiny deviations in the peak positions and peak widths of the multiplet structures. The Eu valence was estimated by using the formula ). Here, and denote integrated spectral intensities of the simulated Eu2+ spectrum (dark blue line) and the extracted Eu3+ component (purple area in Fig. 1), respectively. The obtained Eu valences are =2.11, 2.09, 2.08 and 2.09 () for EuCoGe3, EuNiGe3, EuRhGe3 and EuIrGe3, respectively. We should note that the estimated inelastic mean-free path is Å for 5.7 keV photoelectrons Tanuma1994 , therefore, the Eu3+ signal is not likely to be coming from the surface states.
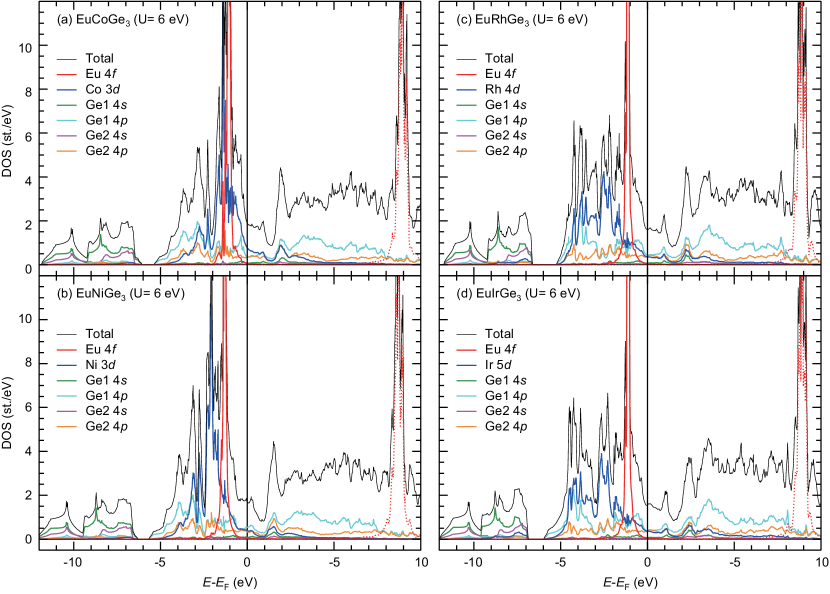
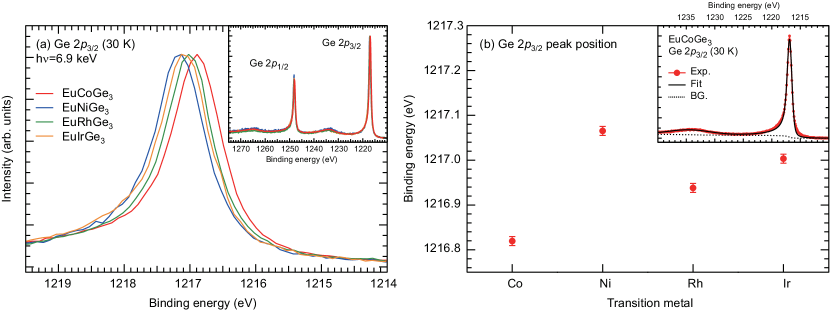
Figure 2(a) shows spectra with the Ge component for all the compounds. The inset shows the Ge 2 complete spectra. The Ge 2 spectra tends to shift towards higher binding energy upon going from 3 to 4 to 5 elements. In order to obtain a precisely this energy shift, a fitting analysis was performed on the spectra by using Gaussian and Lorentzian functions note1 . In addition, a Mahan function Mahan1975 with = 0.16 is used to account for the asymmetry of the line shapes. The result of the fitting analysis is plotted in Fig. 2 (b) with an example of such a fit in the inset. A large energy shift of meV is observed between EuCoGe3 and EuNiGe3. The energy shift of the Ge 2 peak for EuRhGe3 and EuIrGe3 relative to EuCoGe3 are and 180 meV, respectively. We note that the Fermi level () was carefully checked just before and after each measurement to correct for possible drift of the incident photon energy. The energy shift between EuCoGe3 and EuNiGe3 can be understood as a result of the energy shift of towards higher-energy in the conduction bands with increasing 3 occupation.
In the related ternary compounds in the form of Ge2 (: Rare earth, : transition metal), the strong -Ge bonding based upon hybridization of states with Ge states is reported Jeon1989 ; Chen1993 . In a similar vein, a strong bonding between -Ge can also be expected in the EuGe3 family as well. The energy shift of the Ge binding energy amongst EuCoGe3, EuRhGe3 and EuIrGe3 indicates the change of bonding by transition metal substitution.
In order to study the atomic orbital character of the valence band electronic structure, we performed band structure calculations using the full-potential nonorthogonal local orbital code (FPLO) Koepernik1997 ; Koepernik1999 . The local density approximation (LDA) with the Perdew and Wang flavor Perdew1992 of the exchange and correlation potential was chosen. Additionally, the strong Coulomb replusion between the Eu 4 electrons of europium was included in a mean-field way by applying the LDA+U method. The calculations were performed for the experimentally obtained lattice parameters reported in Ref. Bednarchuk2015a, with =0.7 eV and varying from 5 to 7 eV. It should be noted that varying only changes the energy separation between the filled and unfilled Eu 4 states and does not change the results qualitatively. The calculated total and partial density of states (PDOS) are presented in Fig. 3. The europium ions in the unit cell are configured such that they have a ferromagnetic arrangement in the -plane and antiferromagnetically aligned along the -axis. Therefore, the DOSs are symmetric for both the spin channels except for Eu 4. The DOSs in the minority-spin channel are inverted and added together with the majority-spin DOSs for comparison to experiments. The majority-spin states of Eu (solid red line) are fully occupied and appear as a localized sharp peak around 1 eV while the Eu 4 minority-spin states (dashed red line) remain unoccupied. These results reflect the magnetic Eu 4 state in all compounds. The Co and Ni 3 PDOSs appear centered at -1.5 eV and -2 eV, respectively. An increase of the 3 electron number in EuNiGe3 shifts the center of 3 PDOS away from that decreases the hybridization to Eu . The Rh 4 and Ir PODSs show a more extended nature than 3 PDOS, appear from to -6 eV and then below -7 eV. The occupied Ge PDOS are mainly distributed from to -6 eV, hybridizing with transition metal and Eu PDOSs. The Ge 4 PDOS appears at -7 to -10 eV. Commonly in all four compounds, a quasi-gap-like low DOS region appears 1 eV above .
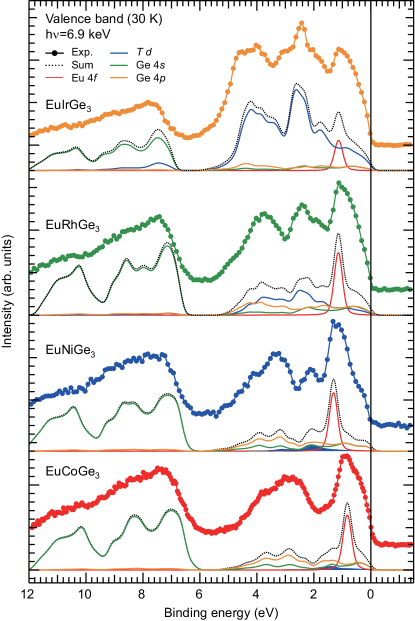
The experimentally measured valence band spectra after integral background correction Shirley1972 are displayed in Fig. 4. The HAXPES valence band spectra cannot be directly compared to the theoretical DOSs, since the photoionization cross-section of Eu 4 states is not the only one to contribute to the spectrum. Therefore the PDOSs are weighted with the corresponding photoionization cross-sections extracted or interpolated from Ref. Trzhaskovskaya2001, ; Trzhaskovskaya2002, ; Trzhaskovskaya2006, . Then, the simulated theoretical spectra were convoluted with a Gaussian function (FWHM: 0.3 eV) and Fermi-Dirac function of 30 K. We consider the Eu 4, , and Ge states as mainly contributing to the valence band. The simulated spectra show good accordance with experimental spectra. Note that we used the DOS with =5 eV for EuCoGe3 and =6 eV for other compounds, based on the agreement of Eu 4 peak position. In all the compounds, a localized Eu2+ 4 peak is observed around 1 eV. A broad round shape of the Eu 4 peak is due to Eu2+ multiplet structures Gerken1983 . A peak around 2 eV in EuNiGe3, EuRhGe3 and EuIrGe3 corresponds to transition metal states overlapping with the Ge states. Due to the larger photoionization cross-section of Ir 5 and Rh 4 compared to those of Ni 3 and Co 3, the spectral weight of transition metal states is enhanced in EuIrGe3 and EuRhGe3. The broad structure between 6-12 eV is mainly attributed to Ge states. The Eu peak shows a similar tendency as that of the Ge 2 spectrum, shifting to higher binding energy by changing transition metal atoms. However, unlike the Ge 2 spectrum, no significant energy shift was observed between EuRhGe3 and EuIrGe3. The experimental valence band spectra have low DOS at , especially for EuNiGe3. The result is consistent with the reported transport measurements Uchima2014b . The decrease in DOS at from EuCoGe3 to EuNiGe3 can be understood as a rigid-band shift due to an increase in 3 orbital occupation by substitution of Co by Ni which shifts the 3 states to higher binding energy.
Finally we comment on the pressure response of EuGe3. Recent temperature dependence of the electrical resistivity studies under pressure reported a successive increase of for EuGe3 (=Co, Ni, Rh, Ir) Uchima2014b ; Kakihana2017 . The antiferromagnetic ordering in EuGe3 stably exists up to 8 GPa and no sign of a Eu valence transition was observed. Our valence band spectra give an explanation to the robust Eu2+ magnetic states against pressure. The dominant part of the Eu 4 DOS of EuGe3 is localized at 1 eV below which is deeper than other Eu-compounds possessing an intermediate Eu valence state or valence transition Mimura2004 ; Ichiki2017 . It hinders a charge transfer from Eu 4 to the conduction band that make up the valence fluctuation or non-magnetic Eu3+ states. Moreover, the calculated DOS of EuGe3 (see Fig. 3) has a quasi-gap like region just above the that can also prevent charge transfer. In divalent antiferromagnetic EuFe2As2, the Eu2+ 4 states are localized at 1-2 eV below Adhikary2013 . X-ray absorption spectroscopy under pressure reported a change of antiferromagnetic to ferromagnetic ordering above 8 GPa. Althoug the Eu valence gradually increases, the Eu2+ magnetic moments remain up to 20 GPa Kumar2014 .
IV Conclusions
We have performed bulk sensitive HAXPES and successfully revealed the electronic structure of EuGe3 (=Co, Ni, Rh and Ir). The Eu 3 core level spectrum revealed that the Eu valence states of all the compounds are almost Eu2+ with negligible contribution of Eu3+. The estimated Eu valence is close to 2.1. The Ge 2 core level spectrum shows the chemical shift to higher binding energy by changing transition metal from 3 to 4 and to 5 elements indicating the change of chemical bonding between and Ge. The valence band electronic structure was systematically studied with the support of ab initio band structure calculations. The experimental valence band spectra shows good accordance with the theoretical simulation. The Eu2+ 4 states are localized at 1 eV below in all compounds. All the compounds have a quasi-gap like region just above . This favours the robust Eu2+ magnetic state against transition metal substitution and also gives an explanation to its stability against external pressure.
Acknowledgements.
We would like to thank Denis Céolin and Dominique Prieur for their skilful technical assistance. Y. U. thanks Kojiro Mimura and Arata Tanaka for helpful discussions. P. S. was supported by Ames Laboratory's Laboratory-Directed Research and Development (LDRD) funding. Ames Laboratory is operated for the US Department of Energy by the Iowa State University under Contract No. DE-AC02-07CH11358.References
- (1) C. M. Varma, Rev. Mod. Phys. 48, 219 (1976).
- (2) V. N. Antonov, L. V. Bekenov, and A. N. Yaresko, Adv. Condens. Matter Phys. 2011, 107, (2011).
- (3) S. Doniach, Physica B+C 91, 231-234 (1977).
- (4) Q. Si, and F. Steglich, Science 329, 1161-1166 (2010).
- (5) E. R. Bauminger, D. Froindlich, I. Nowik, S. Ofer, I. Felner, and I. Mayer, Phys. Rev. Lett. 30, 1053 (1973).
- (6) Y. Ōnuki, A. Nakamura, F. Hondoa, D. Aoki, T. Tekeuchi, M. Nakashima, Y. Amako, H. Harima, K. Matsubayashi, Y. Uwatoko, S. Kayama, T. Kagayama, K. Shimizu, S. E. Muthu, D. Braithwaite, B. Salce, H. Shiba, T. Yara, Y. Ashitomi, H. Akamine, K. Tomori, M. Hedo, and T. Nakama, Phil. Mag. 97, 3399-3414 (2017).
- (7) I. Felner, J. Phys. Chem. Solids 36, 1063-1066 (1975).
- (8) C. U. Segre, M. Croft, J. A. Hodges, V. Murgai, L. C. Gupta, and R. D. Parks, Phys. Rev. Lett. 49, 1947 (1982).
- (9) E. V. Sampathkumaran, L. C. Gupta, R. Vijayaraghavan, K. V. Gopalakrishnan, R. G. Pillay, and H. G. Devare, J. Phys. C: Solid State Phys. 14 L237, (1981).
- (10) A. Mitsuda, Y. Ikeda, N. Ietaka, S. Fukuda, and Y. Isikawa, J. Mag. Mag. Mat. 310 319-321 (2007).
- (11) H. Wada, M. F. Hundley, R. Movshovich, and J. D. Thompson, Phys. Rev. B 59, 1141 (1999).
- (12) H. J. Hesse, R. Lübbers, M. Winzenick, H. W. Neuling, and G. Wortmann, J. Alloys Compd. 246, 220-231 (1997).
- (13) J. W. Allen, and R. M. Martin, Phys. Rev. Lett. 49, 1106 (1982).
- (14) J. W. Allen, and L. Z. Liu, Phys. Rev. B 46, 5047 (1992).
- (15) S. Seiro, and C. Geibel, J. Phys.: Condens. Matter 23, 375601 (2011).
- (16) A. Nakamura, T. Okazak, M. Nakashima, Y. Amako, K. Matsubayashi, Y. Uwatoko, S. Kayama, T. Kagayama, K. Shimizu, T. Uejo, H. Akamine, M. Hedo, T. Nakama, Y. Ōnuki, and H. Shiba, J. Phys. Soc. Jpn 84, 053701 (2015).
- (17) S. E. Muthu, D. Braithwaite, B. Salce, A. Nakamura, M. Hedo, T. Nakama, Y. Ōnuki, J. Phys. Soc. Jpn. 85, 094603 (2016).
- (18) M. Nakashima, Y. Amako, K. Matsuyabashi, Y. Uwatoko, M. Nada, K. Sugiyama, M. Hagiwara, Y. Haga, T. Takeuchi, A. Nakamura, H. Akamine, K. Tomori, T. Yara, Y. Ashitomi, M. Hedo, T. Nakama, and Y. Ōnuki, J. Phys. Soc. Jpn. 86, 034708 (2017).
- (19) O. Bednarchuk, A. Gagor and D. Kaczorowski, J. Alloys. Comp. 622, 432-439 (2015).
- (20) R. J. Goetsch, V. K. Anand, and D. C. Johnston, Phys. Rev. B 87, 064406 (2013).
- (21) O. Bednarchuk, and D. Kaczorowski, J. Alloys. Comp. 646, 291-297 (2015).
- (22) O. Bednarchuk, and D. Kaczorowski, A. Phys. Pol. A 127, 418-420 (2015).
- (23) A. Maurya, P. Bonville, A. Thamizhavel, and S. K. Dhar, J. Phys.: Condens. Matter 26, 216001 (2014).
- (24) A. Maurya, P. Bonville, R. Kulkarni, A. Thamizhavel, and S. K. Dhar, J. Mag. Mag. Mat. 401, 823-831 (2016).
- (25) M. Kakihana, H. Akamine, K. Tomori, K. Nishimura, A. Teruya, A. Nakamura, F. Honda, D. Aoki, M. Nakashima, Y. Amako, K. Matsubayashi, Y. Uwatoko, T. Takeuchi, T. Kida, M. Hagiwara, Y. Haga, E. Yamamoto, H. Harima, M. Hedo, T. Nakama, and Y. Ōnuki, J. Alloys and Comp. 694, 439-451 (2017).
- (26) K. Uchima, Y. Takaesu, H. Akamine, M. Kakihana, K. Tomori, T. Uejo, A. Teruya, A. Nakamura, M. Hedo, T. Nakama, K. Yagasaki, K. Matsubayashi, and Y. Uwatoko, J. Phys.: Conf. Ser. 568, 042032 (2014).
- (27) D. Céolin, J. M. Ablett, D. Prieur, T. Moreno, J. P. Rueff, T. Marchenko, L. Journel, R. Guillemin, B. Pilette, T. Marin, and M. Simon, J. Electron Spectrosc. Relat. Phenom. 190, 188-192 (2013).
- (28) J. P. Rueff, J. M. Ablett, D. Céolin, D. Prieur, T. Moreno, V. Balédent, B. Lassalle-Kaiser, J. E. Rault, M. Simon, and A. Shukla, J. Synchrotron Rad. 22, 175-179 (2015).
- (29) K. Ichiki, T. Matsumoto, H. Anzai, R. Takeshita, K. Abe, S. Ishihara, T. Uozumi, H. Sato, A. Rousuli, S. Ueda, Y. Taguchi, K. Shimada, H. Namatame, M. Taniguchi, S. Hamano, A. Mitsuda, H. Wada, and K. Mimura, J. Electron Spectrosc. Relat. Phenom. 220, 28-32 (2017).
- (30) K. Ichiki, K. Mimura, H. Anzai, T. Uozumi, H. Sato, Y. Utsumi, S. Ueda, A. Mitsuda, H. Wada, Y. Taguchi, K. Shimada, H. Namatame, and M. Taniguchi, Phys. Rev. B. 96, 045106 (2017).
- (31) A. Tanaka, and T. Jo, J. Phys. Soc. Jpn. 63, 2788-2807 (1994).
- (32) R. D. Cowan, J. Opt. Soc. Am. 58, 808-818 (1968); The Theory of Atomic Structure and Spectra (University of California Press, Berkeley, 1981).
- (33) The value of the and Slater integrals and the spin-orbit interaction () used for the atomic multiplet calculations were obtained by Cowan's atomic Hartree-Fock (HF) program Cowan1981 . The obtained HF values are reduced to 86% for the simulations of the Eu2+ spectrum. The parameters of the 3 and 3 configurations in the simulations of the Eu2+ 3 spectra are: (, , , )= (11.23, 7.00, 5.03, 0.160) and (, , , )= (12.79, 8.04, 5.75, 0.202), respectively, and (, , , , , )= (9.85, 3.76, 5.75, 3.37, 2.33, 11.24). All values are in units of eV. The simulated spectra are convoluted with Lorentzian functions with FWHM=0.7 and 1.0 eV for Eu2+ 3 and 3, respectively, and a Gaussina function with FWHM=0.25 eV.
- (34) D. A. Shirley, Phys. Rev. B 5, 4709 (1972).
- (35) S. Tanuma, C. J. Powell, and D. R. Penn, Surf. Interface. Anal. 21, 165 (1994).
- (36) The Ge 2 peak and its plasmon satellite were fitted by a Gaussian function with FWHM=0.3 eV, and Lorentzian functions with FWHM=0.8 eV and 8 eV, respectively.
- (37) G. D. Mahan, Phys. Rev. B 11, 4814, (1975).
- (38) Y. Jeon, B. Qi, F. Lu, and M. Croft, Phys. Rev. B 40, 1538 (1989).
- (39) J. Chen, E. Kemly, M. Croft, Y. Jeon, X. Xu, S. A. Shaheen, and P. H. Ansari, Solid State Commun. 85, 291-296 (1993).
- (40) K. Koepernik, B. Velický, R. Hayn, and H. Eschrig, Phys. Rev. B 55, 5717 (1997).
- (41) K. Koepernik, and H. Eschrig, Phys. Rev. B 59, 1743 (1999).
- (42) J. P. Perdew, and Y. Wang, Phys. Rev. B 45, 13244 (1992).
- (43) M. B. Trzhaskovskaya, V. I. Nefedov, and V. G. Yarzhemsky, Atomic Data Nuclear Data Tables 77, 97-159 (2001).
- (44) M. B. Trzhaskovskaya, V. I. Nefedov, and V. G. Yarzhemsky, Atomic Data Nuclear Data Tables 82, 257-311 (2002).
- (45) M. B. Trzhaskovskaya, V. K. Nikuliln, V. I. Nefedov, and V. G. Yarzhemsky, Atomic Data Nuclear Data Tables 92, 245-304 (2006).
- (46) F. Gerken, J. Phys. F: Met. Phys. 13, 703 (1983).
- (47) K. Uchima, N. Arakaki, S. Hirakawa, Y. Hiranaka, T. Uejo, A. Teruya, A. Nakamura, M. Takeda, Y. Takaesu, M. Hedo, T. Nakama, K. Yagasaki and Y. Uwatoko, JPS Conf. Proc. 1, 012015 (2014).
- (48) K. Mimura, Y. Taguchi, S. Fukuda, A. Mitsuda, J. Sakurai, K. Ichikawa, and O. Arita, Physica B 351, 292-294 (2004).
- (49) G. Adhikary, N. Sahadev, D. Biswas, R. Bindu, N. Kumar, A. Thamizhavel, S. K. Dhar, and K. Maiti, J. Phys.: Condens. Matter 25, 225701 (2013).
- (50) R. S. Kumar, Y. Zhang, A. Thamizhavel, A. Svane, G. Vaitheeswaran, V. Kanchana, Y. Xiao, P. Chow, C. Chen, and Y. Zhao, Appl. Phys. Lett. 104, 042601 (2014).