More Rapidly Rotating PMS M Dwarfs with Light Curves Suggestive of Orbiting Clouds of Material
Abstract
In a previous paper, using data from K2 Campaign 2, we identified 11 very low mass members of the Oph and Upper Scorpius star-forming region as having periodic photometric variability and phased light curves showing multiple scallops or undulations. All the stars with the “scallop-shell” light curve morphology are mid-to-late M dwarfs without evidence of active accretion, and with photometric periods generally 1 day. Their phased light curves have too much structure to be attributed to non-axisymmetrically distributed photospheric spots and rotational modulation. We have now identified an additional eight probable members of the same star-forming region plus three stars in the Taurus star-forming region with this same light curve morphology and sharing the same period and spectral type range as the previous group. We describe the light curves of these new stars in detail and present their general physical characteristics. We also examine the properties of the overall set of stars in order to identify common features that might help elucidate the causes of their photometric variability.
1 Introduction
If observed with enough precision, nearly all stars show some type of short term photometric variability, with many different physical mechanisms as the source of that variability. NASA’s Kepler mission, and its successor K2 mission (Howell et al. 2014), have produced long duration, continuous, high precision light curves of more than 300,000 stars which have served to highlight many of these known mechanisms for producing photometric variability. Inevitably, the quality and quantity of those light curves has also resulted in identification of stars whose photometric variability is not easily associated with any of the previously known physical mechanisms and which offer the possibility for exploring new physics. In Stauffer et al. (2017; hereafter S17), we identified 23 stars observed by K2 in the 8 Myr old Upper Scorpius association as having photometric variability not easily attributable to the mechanisms usually associated with low mass, pre-main sequence (PMS) stars. All of these stars are mid to late M dwarfs with no obvious IR excess nor other indication of ongoing accretion; most are very rapid rotators with periods often less than 1 day. Half of those stars fall in a category which we dubbed “scallop-shell” light curves. These latter stars all had P 0.65 days and very structured phased light curves with many humps or arcs and variability amplitudes sometimes up to 10%. For about half these stars, the light curve shape is remarkably stable over the 78 day duration of the campaign; for the other half, there are one or two sudden state-changes in the morphology of the phased light curve usually only affecting about 20% of the waveform and often occurring coincident in time with a major flare event. S17 and David et al. (2017) also describe two other types of rapidly rotating M dwarfs with differing unusual light curve morphologies. We do not address these latter types of variability in this paper, though it may be that in some cases the physical mechanism driving the variability may be the same as for the stars with scallop-shell light curve morphology.
We have now identified eight more low mass members of the Upper Sco association or its younger neighbor, the Oph cluster (age 1 Myr), whose K2 Campaign 2 light curves are unusual and in many cases share the same characteristics as the scallop-shell stars in S17. From K2 Campaign 13, we have also identified three low mass members of the Taurus star-forming region that share those characteristics as well. In §2, we describe the young stars targeted in Campaigns 2 and 13 of the K2 mission and the sources of data for this paper; we also provide a table identifying the stars with unusual light curves which are the topic of this paper. In §3, we illustrate the light curve morphologies for the new set of stars with “scallop-shell” light curves. In §4, we discuss the light curve of one particular star, EPIC 204099739, whose pedigree is less certain. in §5, we review the properties of all the stars that have light curves with this morphology.
2 Newly Identified Stars of Interest and Observational Data
The stars we discuss in this paper were observed by NASA’s K2 mission during its Campaign 2 (August to November 2014) or its Campaign 13 (March to May 2017). The light curves we examined were all associated with stars identified as probable or possible members of the Upper Sco and Oph star-forming region (Campaign 2) or the Taurus star-forming region (Campaign 13). The original set of stars with unusual light curve morphologies discussed in S17 were identified during the early stages of our project to measure rotation periods and accretion signatures for the PMS stars in Upper Sco when both our membership lists and our light curve processing were at preliminary stages. We now have an improved membership list, more refined light curve versions, and a more complete set of rotational data (Rebull et al. 2018). In the process of reviewing the final set of light curves, we identified 8 additional rapidly rotating M dwarfs with unusual, structured, periodic light curves similar in morphology to the stars with “scallop shell” light curve morphologies in S17. In addition, from the Campaign 13 data, we have identified three low mass candidate Taurus members with the same properties. All of these stars are listed in Table 1, where we also provide some basic photometric and spectroscopic properties for these stars.
| EPIC ID | RA | Dec | aaObserved color where both bands have published measurements in the literature. Otherwise, is estimated using a conversion based on the Gaia DR1 magnitudes and 2MASS values. | ()o | [W3] | SpTbbSpectral types and H equivalent widths for EPIC 203821589 and 203897692 are from Wilking et al. 2015, and for EPIC 247343526 are from Slesnick et al. 2006. All other spectroscopic information are from our own spectra, as reported in the Appendix. | H EqW | Li EqW | P1ccAn asterisk is attached to the period (P1 or P2) to designate which star in a binary has the unusual light curve which is discussed in this paper. All of the binary companions have normal, spotted-star light curve morphologies, except EPIC 204060981, where both stars in the binary system have scallop-shell light curves. EPIC 246682490 actually appears to be a triple; the third period is 0.4214d. | P2ccAn asterisk is attached to the period (P1 or P2) to designate which star in a binary has the unusual light curve which is discussed in this paper. All of the binary companions have normal, spotted-star light curve morphologies, except EPIC 204060981, where both stars in the binary system have scallop-shell light curves. EPIC 246682490 actually appears to be a triple; the third period is 0.4214d. | |
|---|---|---|---|---|---|---|---|---|---|---|---|
| (deg) | (deg) | (mag) | (mag) | (mag) | (mag) | (Å) | (Å) | (days) | (days) | ||
| Upper Sco Scallop shells | |||||||||||
| 203354381 | 246.616 | -26.421 | 9.845 | 5.88 | 5.24 | 0.200 | 0.5993 | ||||
| 203636498 | 245.271 | -25.462 | 10.943 | 6.34 | 6.06 | 0.310: | M5.5 | -9.3 | 0. 61 | 0.7794 | |
| 204060981 | 242.734 | -23.825 | 9.473 | 5.88 | 5.11 | 0.279 | M4.5 | -6.7 | 0.65 | 0.3996* | 0.3802* |
| 205267399 | 244.674 | -18.544 | 10.082 | 5.52 | 5.17 | 0.272 | M5 | -9.0 | no: | 0.3311 | 0.3344* |
| Oph Scallop shells | |||||||||||
| 203821589 | 247.000 | -24.805 | 9.269 | 8.15 | 5.66 | 0.470 | M4.75 | -7.5 | yes: | 0.9105 | 0.6677* |
| 203897692 | 246.484 | -24.504 | 9.764 | 10 | 6.03 | M5 | -12 | 0.5011 | 0.6043* | ||
| 204185983 | 246.470 | -23.326 | 7.870 | 6.75 | 4.06 | 0.244 | M1.5 | -2.5 | 0.68 | 1.0529 | |
| Taurus Scallop shells | |||||||||||
| 246676629 | 74.868 | +14.273 | 10.062 | 5.46 | 5.26 | 0.292 | M3.5 | -5.9 | 0.4: | 0.6253* | 0.6332 |
| 246682490 | 74.770 | +14.349 | 9.467 | 5.17 | 4.77 | 0.190 | M3.5 | -6.1 | 0.2: | 3.6324 | 0.4377* |
| 247343526 | 70.223 | +20.930 | 11.621 | 6.42 | 6.42 | 0.412 | M5 | -11.0 | 0.3568 | ||
| Possible Scallop shell in Upper Sco | |||||||||||
| 204099739 | 242.163 | -23.668 | 9.146 | 5.33 | 4.78 | 0.246 | M3.5 | -5.0 | 0.56 | 0.7158 | 0.7428* |
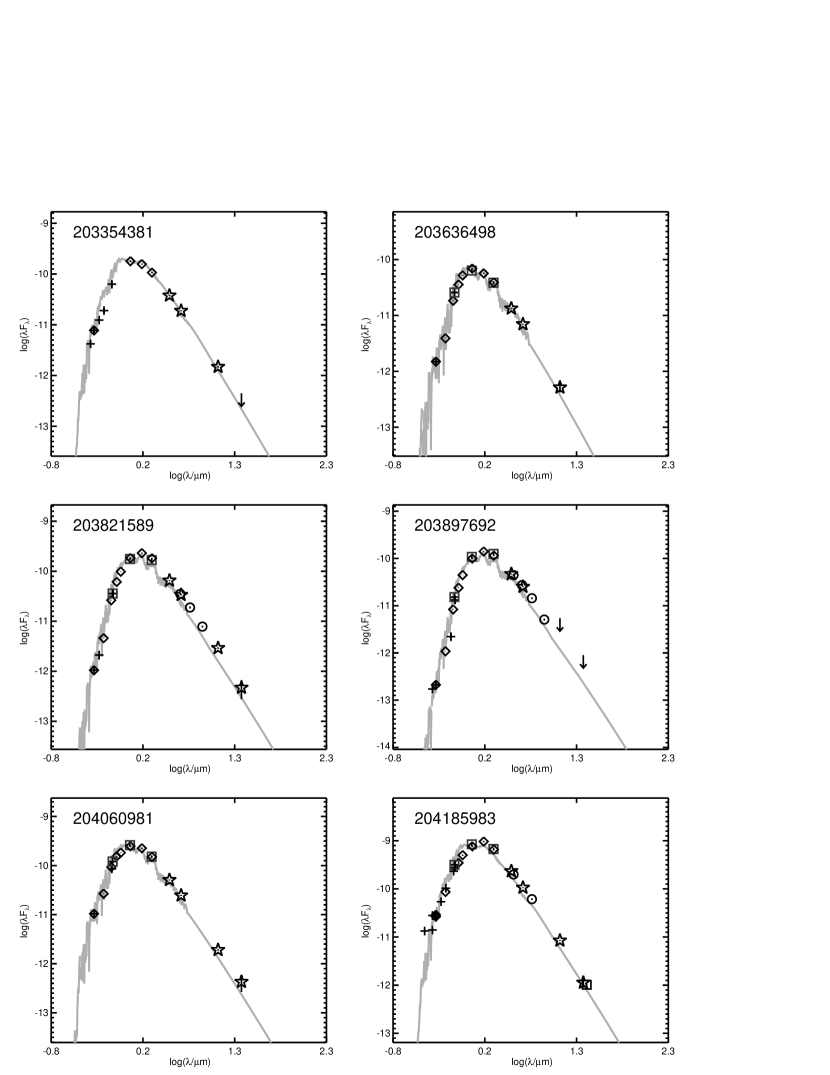
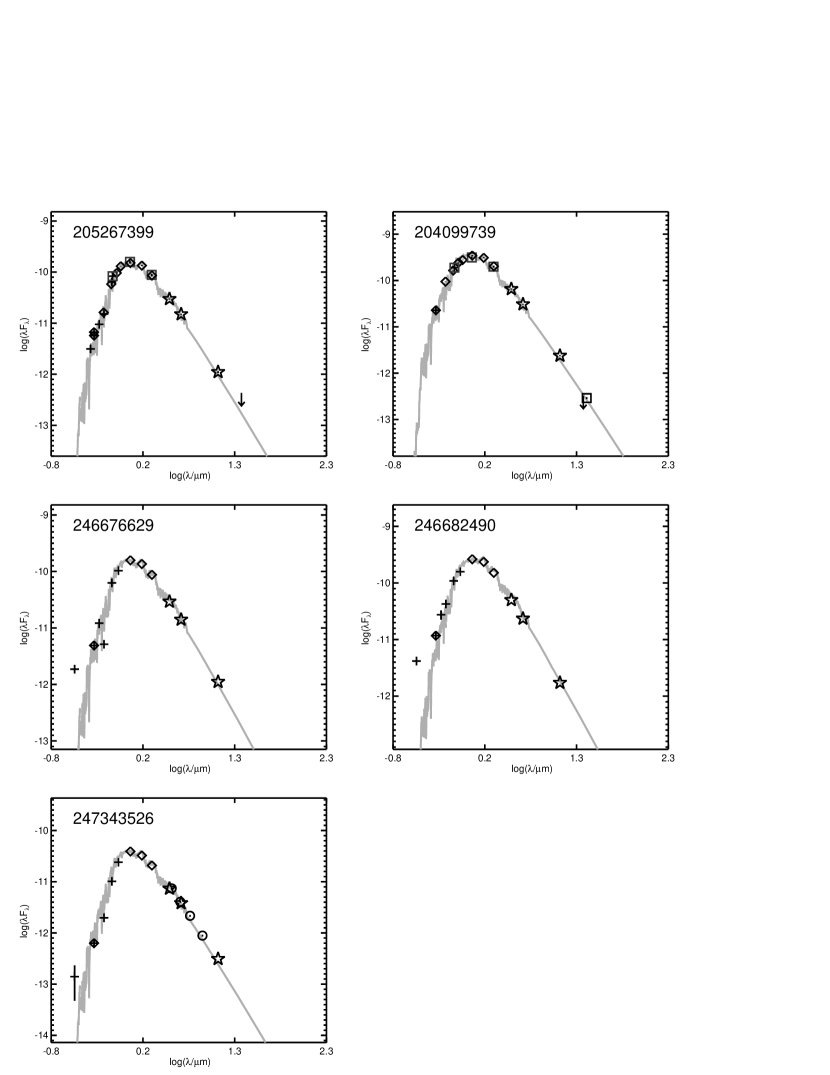
The EPIC catalog available at MAST provides accurate coordinates for all of the stars in our sample. Using those coordinates, we downloaded all available near and mid-IR photometry for our stars from the 2MASS (Skrutskie et al. 2006), WISE (Wright et al. 2010), Spitzer (Werner et al. 2004) SEIP111http://irsa.ipac.caltech.edu/data/SPITZER/Enhanced/SEIP/overview.html and FEPS (Meyer et al. 2006), AKARI (Murakami et al. 2007), and SDSS (e.g., Ahn et al. 2014) archives as well as and band photometry from APASS (Henden & Munari 2014). We also downloaded photometry for most of our stars from the PAN-STARRS1 database (Flewelling et al. 2016), and Gaia DR1 magnitudes from the IRSA mirror site for Gaia DR1. Spectral types were available in the literature for four of our stars (Wilking et al. 2005, Slesnick et al. 2006, Luhman & Mamajek 2012); in many cases, those same references also provided H and lithium (6708Å) equivalent widths. We have used our own Keck HIRES, Palomar 5m DBSP, Lick 3m KAST, and SOAR Goodman spectra to provide spectral data for seven of the stars in Table 1, as described in the Appendix. We used all of the photometry and spectral type data to produce spectral energy distributions (SEDs) for the stars in Table 1. As was true for the original S17 sample, all of the new stars appear to be mid-to-late M dwarfs, and all appear not to have a detected IR excess. The SEDs for the new sample are provided in the Appendix.
At the time of the writing of this paper, light curves for the stars in Campaign 2 were publicly available at MAST from Luger et al. (2017) and Vanderburg et al. (2016). We also had available to us two sets of light curves created by co-author Ann Marie Cody (see Cody et al. 2017, 2018). For Campaign 13, we had from MAST the K2 project-provided light curves (their PDC version) and the Vanderburg et al. (2016) light curves, plus our own light curves from co-author Ann Marie Cody. For each star, we examined all of the available light curves, and chose the one which seemed to produce the final phased light curve with the fewest artifacts and the highest signal-to-noise. In some cases, we did further processing on the light curves prior to phasing to the period identified in the Lomb-Scargle periodogram, either to remove long-term trends or to separate the light of the two stars in a binary (that is, when the periodogram showed two well-resolved peaks). For these latter stars, we list both periods in Table 1. It is likely that the two components of these binaries have similar masses, because otherwise the secondary would be unlikely to contribute enough of the light to yield a detectable peak in the periodogram222For specificity, we designate the star with the stronger peak in the Lomb-Scargle periodogram as the primary – e.g. EPIC 204060981A. However, the data we have does not allow us to determine which component is more massive nor which component is more luminous. Thus these designations should be regarded as tentative, pending future radial velocity or high-spatial resolution imaging studies. This was demonstrably true in the Pleiades, where the dM stars with two peaks in their periodogram formed a well-separated sequence above the single star locus in a vs. CMD (see Figure 19 of Stauffer et al. 2016). We discuss binary issues more in later sections of this paper. We note that one of the stars in Table 1, EPIC 204060981, turned out to be the first system where both components of the binary fall into the “scallop-shell” category.
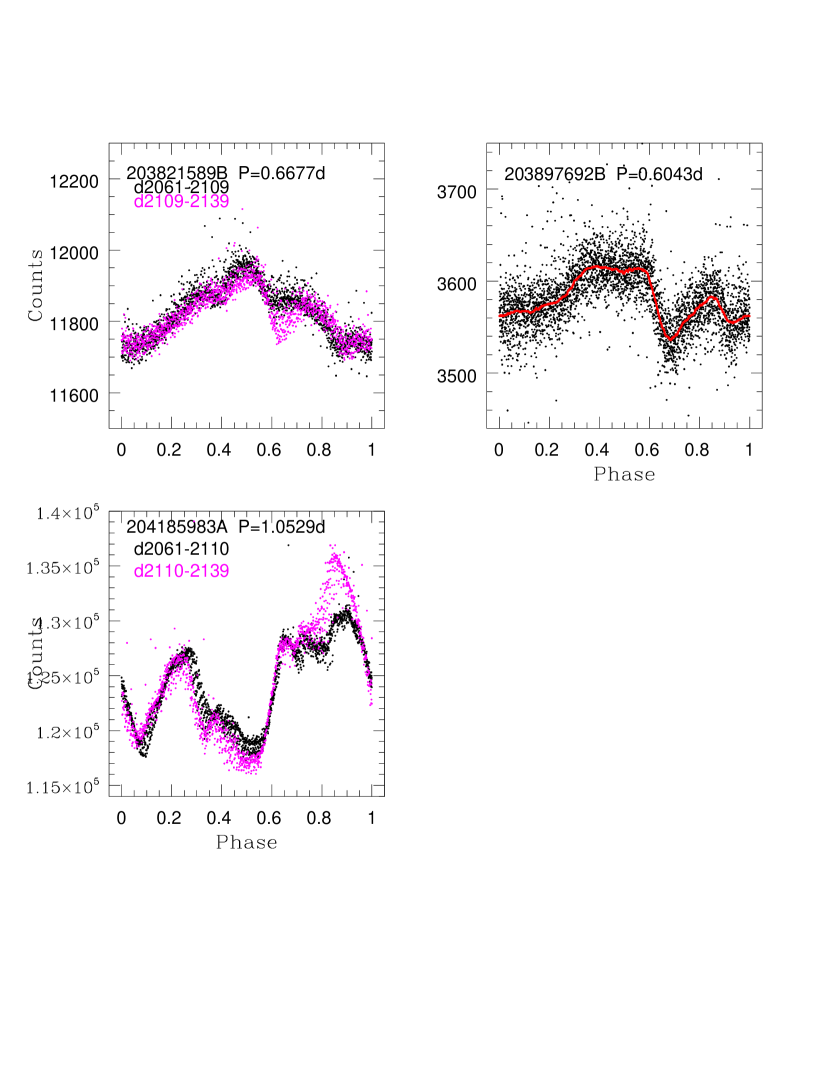
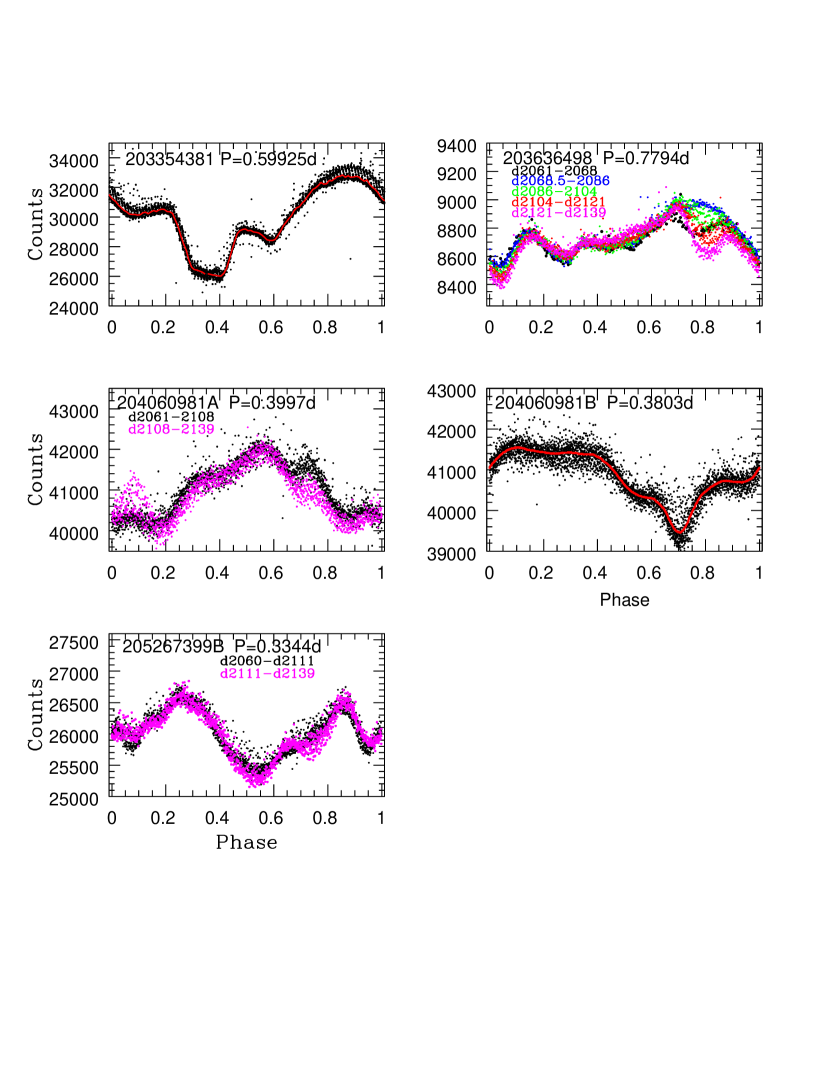
3 Light Curve Morphologies of the Stars in Table 1
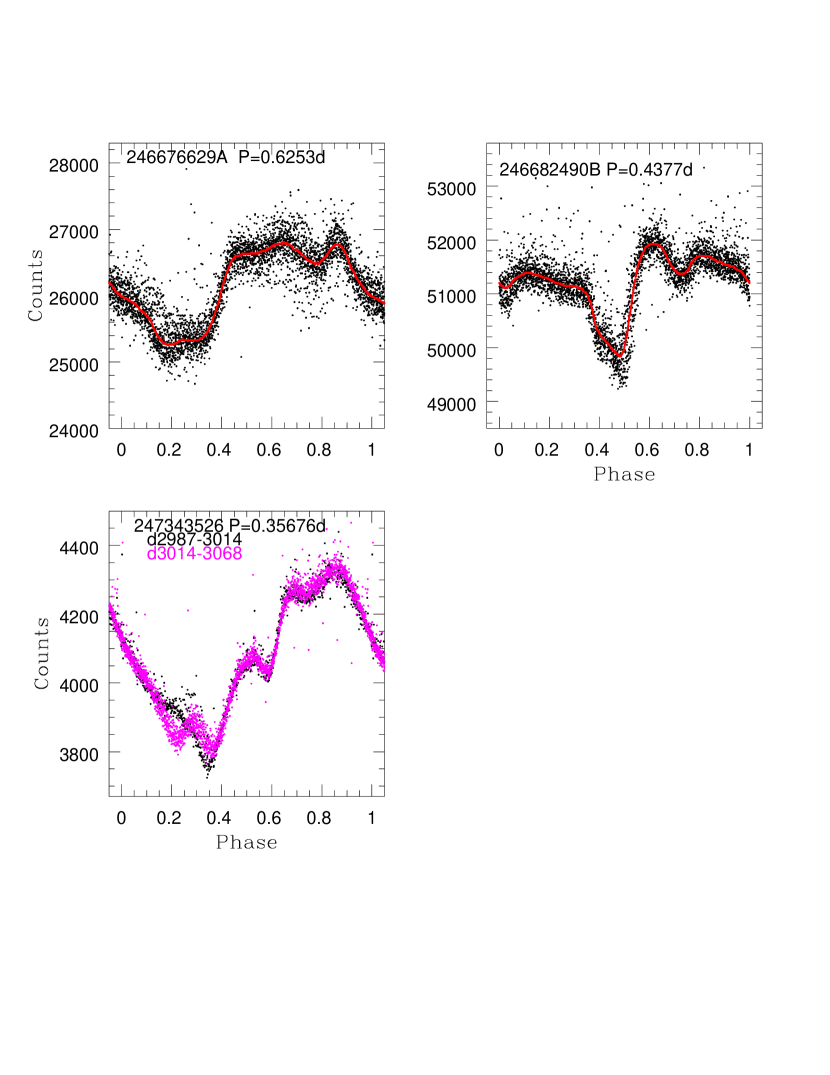
Figures 1-3 show the phased light curves for all of the stars in Table 1 except for EPIC 204099739, which we discuss separately in §4. EPIC 204060981 appears twice, because it is a binary and both components of the binary have scallop-shell phased light curves. Where the light curve morphology was stable or nearly stable over the entire 78 days of the campaign, we simply show all points in the phased light curves as black dots. Where there was a significant change in morphology during the campaign, we have divided the data for the star into two or more time windows, and then plotted the phased light curve with different color points for each time window. Close examination of these phased light curves shows that the changes in light curve morphology are generally restricted to small ranges in phase in all cases – as was the case for the stars identified in S17.
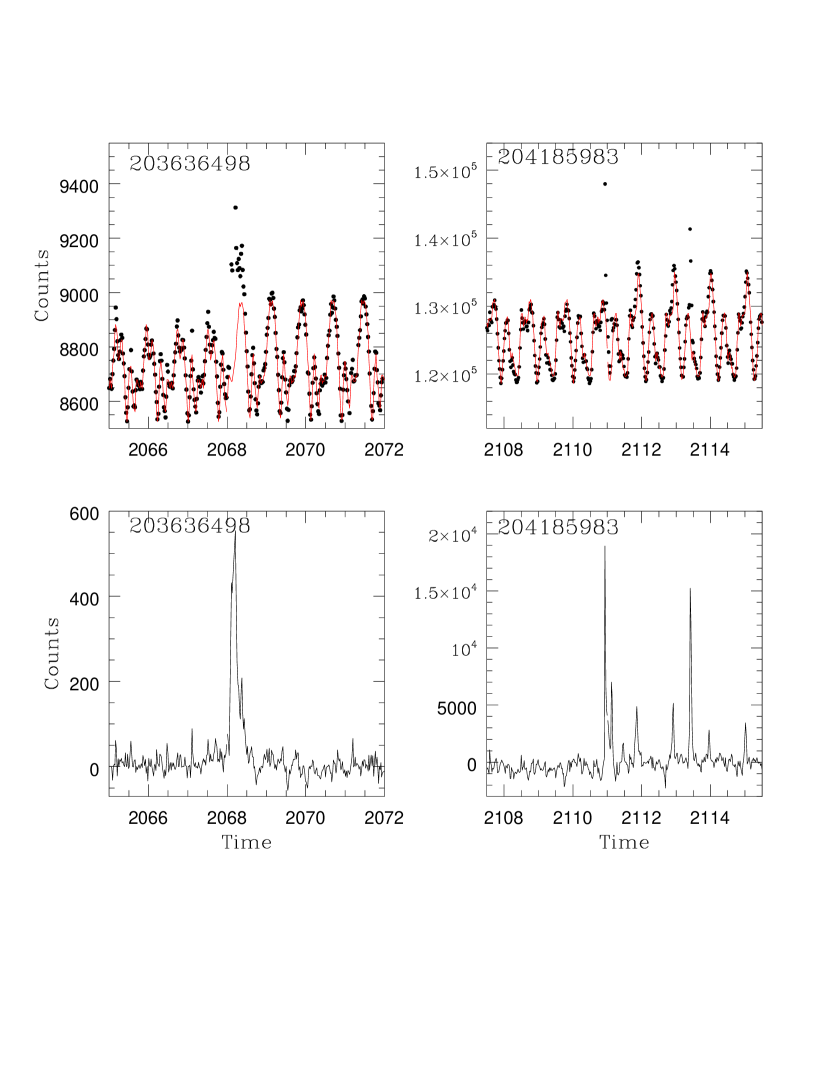
In S17, we showed that in about half the cases where the phased light curve suddenly changed shape, the epoch where the change took place corresponded closely to the occurrence of a flare or flare-like event in the light curve. For the six stars in Figures 1-3 that show changing morphology in their phased light curve, two show a flare or flare-like event at the time of the transition. Figure 4 shows an expanded view of these light curves around the time of the change in light curve morphology. The flare-like events occur at day 2068.3 for EPIC 203636498 and at day 2111.0 for EPIC 204185983A333The times listed here and throughout the remainder of the paper are in days since January 1, 2009, or as JD - 2454833. Kepler was launched on March 7, 2009.. We have made median fits to the phased light curve waveform for the 10 day period immediately prior to and after the flare; in these plots, the median fits are shown as red curves and the original light curves as filled dots. We have subtracted the median fits to the phased light curve waveform from the original light curve and plotted the residuals in the bottom panels of Figure 4. For EPIC 204185983, there are additional smaller possible flares for day 2111. We believe the peak at day 2113.4 may be real, but the other small flux peaks are more likely just due to mismatches between the median fit and the actual period-to-period shape of the light curve. For both stars, after the flare, the phased light curve becomes brighter at about the point in the phased waveform when the flare occurred. This again was what we observed for the flares in the S17 sample.
3.1 EPIC 204185983: The Brightest Star with a Scallop-Shell Light Curve
In the Kepler bandpass, EPIC 204185983 is about a magnitude brighter than any of the other stars with scallop-shell light curve morphology, which should in principle allow us to obtain a more detailed measurement of its light curve shape and evolution. The third panel of Figure 3 does indeed show that its light curve is very well-defined, and it appears to have considerable morphological evolution over the K2 campaign. For that reason, we have examined its light curve in more detail than for the other stars in Figures 1-3.
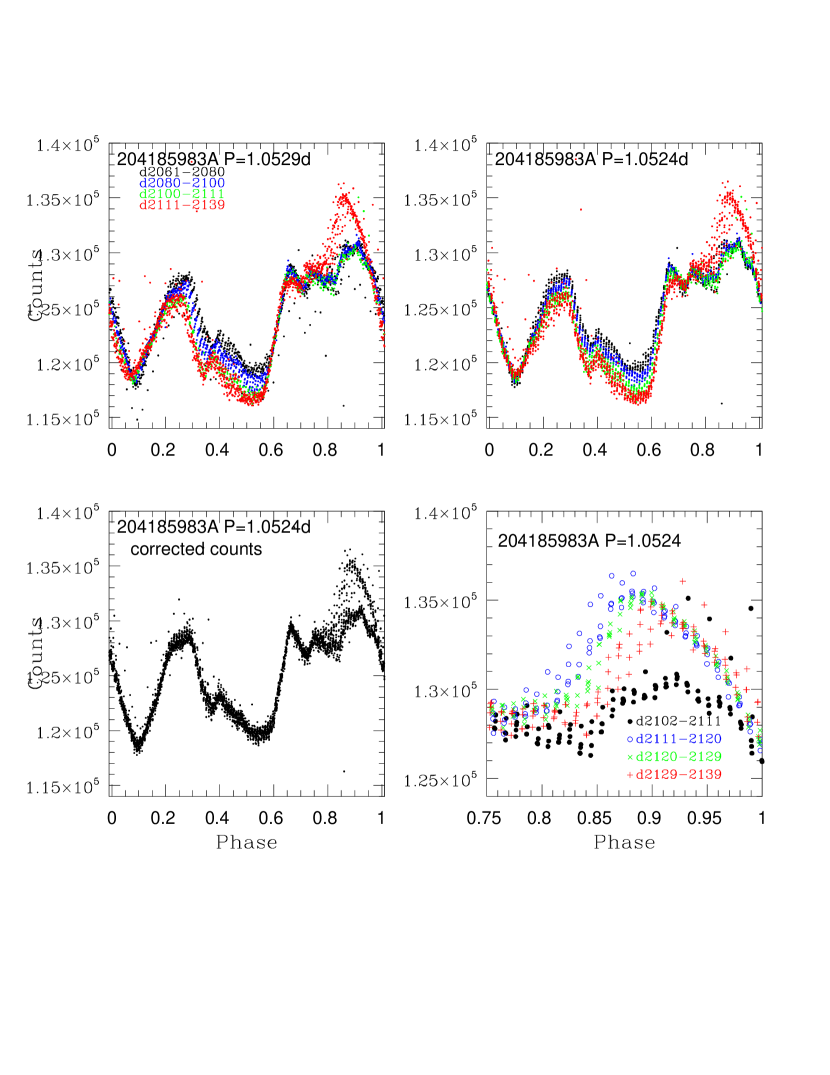
Figure 5a repeats the plot for Figure 3c, but this time breaking the light curve up into four time windows. The period of 1.0529 days was chosen primarily because it yielded the least scatter near phases 0.0, 0.2 and 0.65 where the phased light curve is changing in flux most rapidly. However, as illustrated in Figure 5a, between phases 0.25 and 0.6 the light curve undergoes a progressive decrease in flux by 3% and a shift in phase over the K2 campaign. Figure 5b shows that by adopting a slightly different period of 1.0524 days, the progressive phase shift for 0.25 0.6 is eliminated and some of the other features align better over time.
We next created a toy model with a linear decrease in flux with time at the rate of 3% in 80 days for phases 0.2 to 0.65, with edge tapering for 0.15 0.2 and 0.65 0.7. Figure 5c shows that the toy model does a generally good job of removing the time evolution of the light curve shape. The last panel in Figure 5 provides a closer view of the other major evolutionary change in the light curve – the sudden jump in flux for 0.9 that occurred at day 2111 (as highlighted in Figure 4). Figure 5d shows that after the flare, the flux excess slowly decreases with time, possibly evolving back to the shape it had prior to the flare. All of these characteristics illustrate that while there is short timescale evolution in some of the scallop-shell light curves, there must be some underlying structure (the star’s magnetic field topology?) which remains relatively stable over the 80 day timescale of a typical K2 campaign.
3.2 Towards a Quantitative Criterion for Scallop-Shell Light Curves
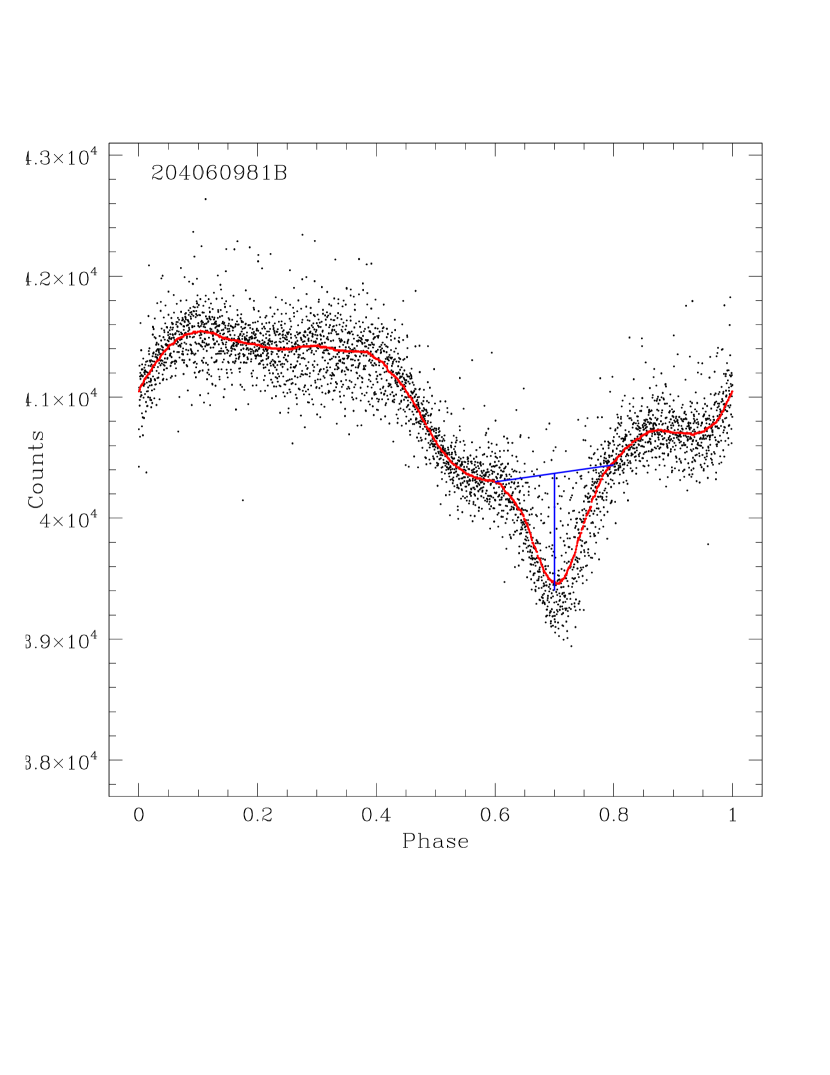
Assignment of a given phased light curve to the scallop-shell class has been done solely on a morphological basis (that is, not based on one or more numerical criteria). However, one of the morphological characteristics is that the light curve has too much structure to be attributable to rotational modulation of non-axisymmetrically distributed photospheric spots. Essentially, that means that scallop-shell light curves must have several “humps” or “dips” that each span less than 20% of the full period of the star. To provide a partial quantitative basis for this criterion, we have determined one measure of the light curve structure for all of the scallop-shell stars and a comparable number of randomly selected Upper Sco spotted stars of the same spectral type range. The parameter we measure is the ratio “f” of the amplitude in counts of the most prominent “hump” or “dip” in the light curve compared to the full amplitude of the entire phased light curve. Specifically, we slide a line segment covering 0.2 in phase across a median-fitted version of the light curve and find the location where the separation between the line and the median-fitted curve at the mid-point in phase is largest. This is illustrated in Figure 6a for EPIC 204060981B. For a sine-wave, there is an analytic solution, f = 0.095. Figure 6b shows the histogram of “f” values for the scallop-shell stars and the stars with typical spotted-star morphologies. Most of the spotted stars have “f” values just slightly larger than that for a pure sine function, as expected given their “sinusoidal” waveforms. The scallop-shell stars have much larger “f” values, reflective of the fact that their inclusion in the class is based on having very structured phased light curves. There are a few spotted stars, however, that have “f” values that overlap with the scallop-shell distribution. These are stars with “double-dip” light curves (McQuillen et al. 2013), where spots at two widely different longitudes contribute significantly to the light curve. The “double-dip” stars have fewer structures in their phased light curves than the scallop-shells, something not captured by the “f” parameter.

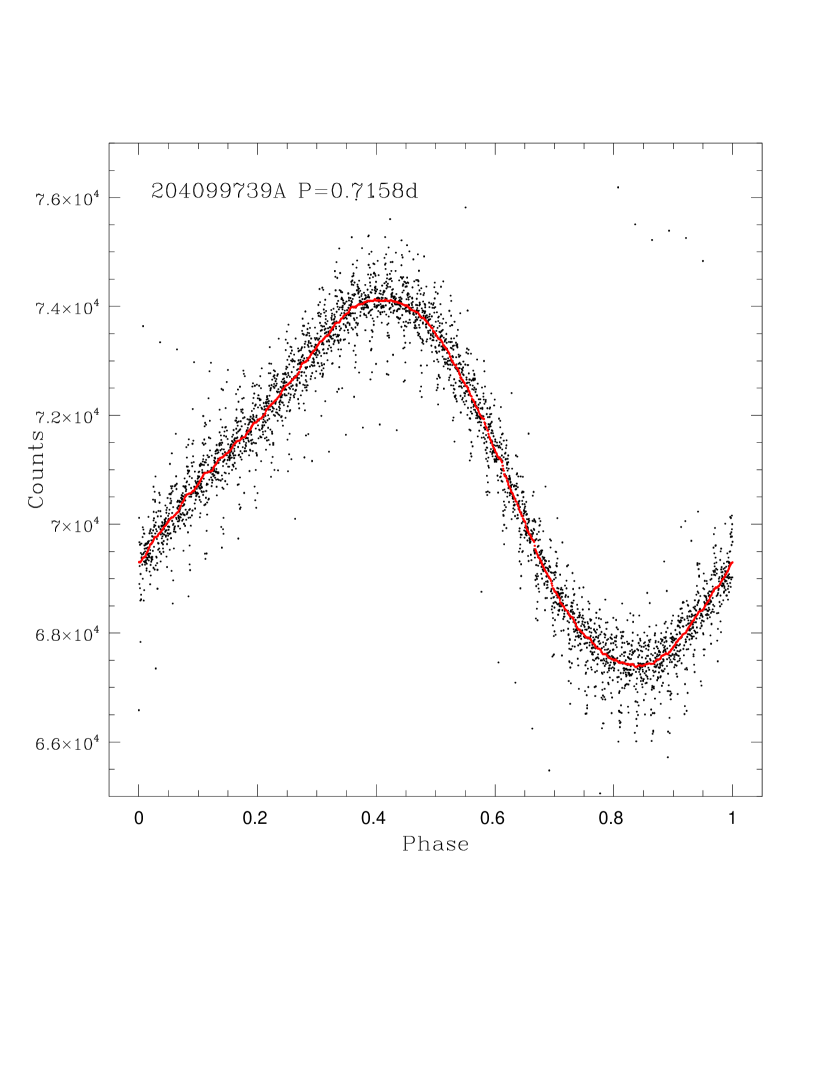
4 EPIC 204099739: Another Scallop, a Young Eclipsing Binary, or a Young Star with a Disintegrating Planetary Companion?
The last star in Table 1, EPIC 204099739, has a K2 light curve that appears superficially common-place, but when viewed in detail is unlike any of the other K2 light curves we have examined.
The full, detrended K2 light curve for EPIC 204099739 is shown in Figure 7a. The highly structured, repetitive pattern shown by the light curve is similar to many others in Upper Sco, signaling that there are two periods present in the data, with the beat cycle time being about 20 days. The Lomb-Scargle periodogram for EPIC 204099739 shows a very dominant =0.7158 day peak with a much weaker secondary peak corresponding to a slightly longer period of =0.743 days. When the light curve is phased to the dominant 0.7158 day period (Figure 7b), one sees a very stable, nearly sinusoidal light curve morphology with a full amplitude near 10%. Light curves of this shape and amplitude are common among young M dwarfs, and they can be modeled well with a large star-spot at moderately high latitude seen from an inclination angle such that at least some of the spot stays in view of the observer for the entire rotation period. The stability of the light curve shape over the 78 day K2 Campaign 2 (K2C2) indicates that the spot lifetime is at least longer than the campaign length, something that again is quite common for young M dwarfs.
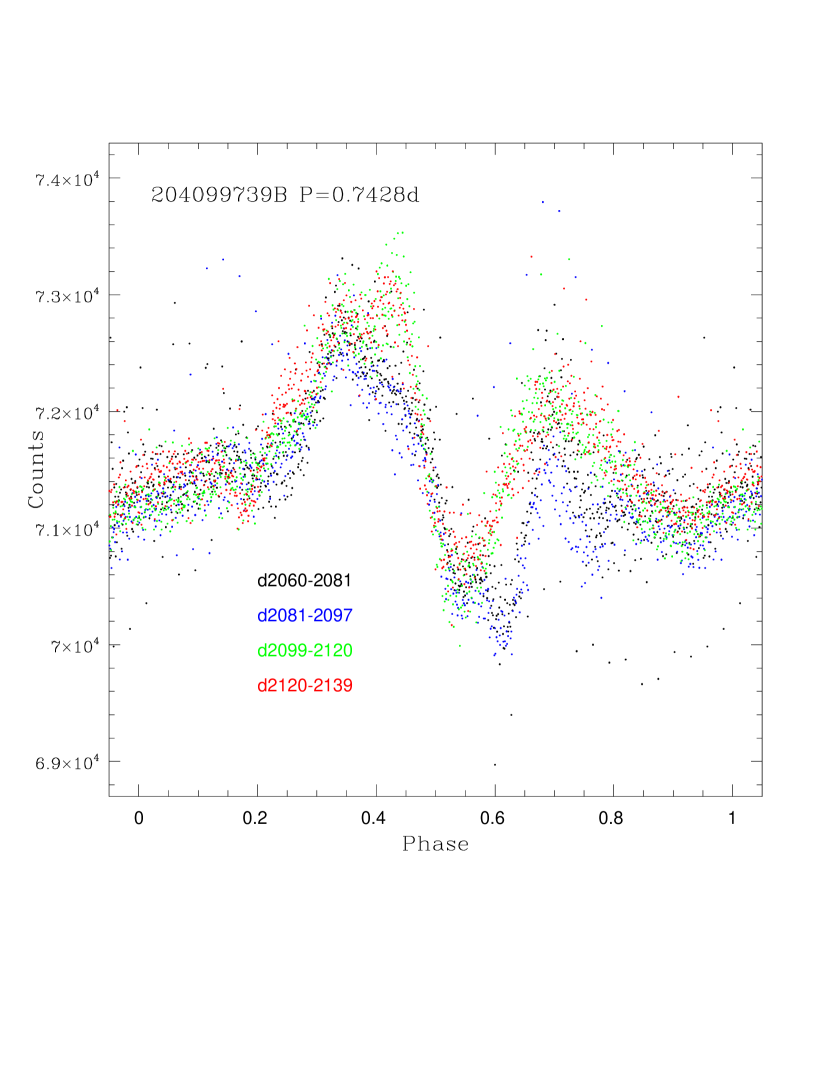
To obtain a measure of the light curve morphology associated with the second period, we subtracted the light curve shown in Figure 7b from the original light curve, and then phased the residual light curve to =0.7428 days. That phased light curve is shown in Figure 8a. The different colored points in the figure correspond to four approximately 20 day time windows, from black (start of campaign), to blue, to green, to red (end of campaign). This phased light curve has a very unusual shape, best characterized as two flux peaks separated by a relatively narrow flux dip. Comparing the locus of the black and blue points to that for the green and red points, there is apparently a small, abrupt shift in the light curve morphology around day 2098. Figure 8b displays the original light curve for an eight day window centered on day 2099. There was a relatively strong flare or flare-like event at day 2097.3; this was by far the strongest flare for EPIC 204099739 during K2C2.
Star-spots of any kind cannot explain the light curve morphology shown in Figure 8a. We instead consider three classes of objects that might offer possible solutions. Our conclusion from this exercise is that the object associated with the 0.7428 day period is most likely a second star whose variability arises from the mechanism producing the scallop-shell light curves associated with the other objects in Table 1.
4.1 Is the P = 0.7428 day Waveform the Signature of a Young, Disintegrating Planet?
Prototypical stars whose Kepler light curve signatures have been attributed to disintegrating planets are KIC 12557548 (Rappaport et al. 2012) and K2-22 (Sanchis-Ojeda et al. 2015). Both these stars show periodic, variable depth flux dips with some evidence for flux brightenings before and/or after the flux dip. Both are short period systems ( = 16 hr and 9 hr, respectively), and both have maximum dip depths of about 1%. Those characteristics bear superficial resemblance to the light curve morphology for EPIC 204099739. However, other aspects of the = 0.7428 day phased light curve for EPIC 204099739 differ greatly from the disintegrating planet prototypes. First, the flux dip depths for KIC 12557548 and K2-22 are highly variable (by a factor of 10 in depth) even on very short timescales, whereas for EPIC 204099739 the depths are stable except for the single abrupt change. Second, the amplitude of the preceding flux peak in EPIC 204099739 is nearly 3% and the trailing flux peak has an amplitude of more than 1%. For KIC 12557548 and K2-22, those amplitudes are all less than 0.1%. The extent in phase of the dip and flux humps for KIC 12557548 and K2-22 is also much less than what is seen for EPIC 204099739 (Figure 8a). It seems very unlikely that the cometary debris tail models that can explain KIC 12557548 and K2-22 (see discussion in Sanchis-Ojeda et al. 2015) could be amped up sufficiently to explain the much larger amplitude and longer in duration flux peaks seen in EPIC 204099739. We therefore discard this possibility.
4.2 Is the P = 0.7428 day Waveform the Signature of a Heartbeat Binary?
Another recent discovery from the Kepler mission light curves are the so-called heartbeat stars (Thompson et al. 2012; Smullen & Kobulnicky 2015; Zimmerman et al. 2017). These stars can show complex phased light curve waveforms, including sometimes having two flux peaks straddling a relatively narrow flux dip. The amplitudes of both the peaks and the dips can at least approach 1%. These systems have been found to have relatively short periods and moderate to high eccentricities; their photometric variability is primarily ascribed to tidal distortions that are strongest near periastron. Models of such systems (e.g., Figure 5 of Thompson et al. 2012) can yield flux peak and dip signatures that closely resemble those seen for EPIC 204099739 in shape and phase width (the light curve signature depends sensitively on eccentricity, observer inclination angle and periastron view angle). However, we again believe that in detail, EPIC 204099739’s light curve is quite unlikely to result from this mechanism. The decisive argument is that, at least over the timescale of the K2 campaign, the tidally induced photometric variability should be essentially fixed in morphology. The observed abrupt change in light curve shape at day 2097 seems completely incompatible with this mechanism.
4.3 Is the P = 0.7428 day Waveform the Signature of a Companion Star with a Scallop-Shell Light Curve?
We did not originally consider EPIC 204099739 as an obvious member of the scallop class. The other members of the class have various combinations of flux peaks and flux dips, but none that resembled two flux peaks separated by a flux dip. However, in essentially all other aspects, EPIC 204099739 does seem compatible with that category:
-
•
It has a very short period, as do all other members of the class.
-
•
It has a photometric amplitude of at least 4%, which is typical of the class (but see below).
-
•
It shows an abrupt change in phased light curve morphology which occurs at the time of a flare or flare-like event, one of the most striking characteristics of the class.
-
•
It is a young M dwarf with no evidence of on-going accretion nor of a primordial dust disk.
If the P = 0.7428 day period corresponds to a scallop-shell waveform, then to fit our other assumptions EPIC 204099739 must be a binary star – with one star corresponding to the = 0.7158 day sinusoidal variation and the other star having a rotation period of = 0.7428 days. We have little knowledge of the orbital period of the system; our only insight comes from our two spectra of the system, both of which show single lines and radial velocities that differ at most slightly from that expected for an Upper Sco member. This offers some evidence against this being a close binary, but more spectra or AO (adaptive optics) imaging are needed to confirm. We also have no certain knowledge of the relative brightness of the two stars, but we can place constraints on their relative contribution to the K2 light curve. The amplitude of variability for the = 0.7158 day waveform is about 10%. That is actually a lower limit since some fraction of the system light comes from the second star. Very few young dM stars have photometric variability amplitudes exceeding 20% at R band. Therefore, it is unlikely that the second star contributes more than 50% of the light to the K2 light curve. If the second star did contribute 50% of the light, then the true amplitude of variability for the scallop-shell component would be about 8%, which is close to the maximum seen for any of the scallop-shell stars presented in this paper or in S17.


5 Physical Properties of the Stars having Scallop Shell Light Curves
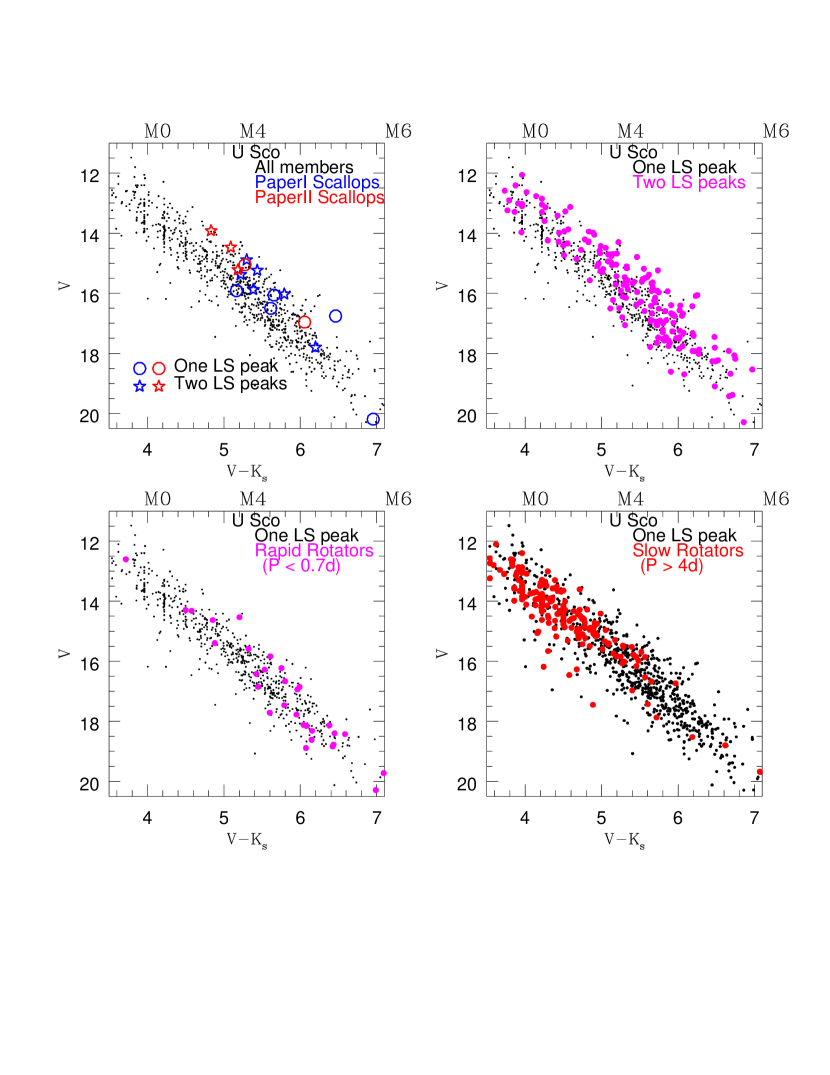
The preceding sections have focused entirely on the K2 light curves for the scallop-shell stars. The light curve morphologies, periods, amplitudes, and evolution with time presumably place strong constraints on possible physical mechanisms that could explain the photometric variability of these stars. Now that we have a sample of 20 of these stars, it is useful to see how their general (non-time-domain) properties compare to other stars of the same mass and age, as that too could help constrain possible physical mechanisms.
Figure 9 shows several versions of a vs. CMD for Upper Sco. The first panel highlights the stars with scallop-shell light curves. It demonstrates that these stars are, on average, towards the bright side of the locus, suggesting that they are either younger or more often in binary systems. The next panel specifically highlights stars we detect as binaries (via two peaks in the K2 periodogram), which confirms that these stars are also displaced to the bright side of the Upper Sco locus, as expected. Panel (c) highlights the most rapidly rotating dM members. They too appear, on average, to be younger and/or weighted towards being binaries. Finally, the last panel shows a similar plot for the more slowly rotating dM Upper Sco members. Other than not sampling well the lowest mass (and hence faster rotating) part of the population, the slow rotators do not show any obvious displacement relative to the mean cluster locus in the CMD.
The simplest synthesis of what is shown in these CMDs is that at Upper Sco age, M dwarf members of binary systems tend to be rapid rotators compared to their single (or low-q binary) cousins, where . We had reached a similar conclusion previously for the M dwarfs observed with K2 in the Pleiades (Stauffer et al. 2017). That about half of the stars with scallop-shell light curves are in binaries is likely just a product of two correlations: (a) the fact that the physical mechanism producing the scallop-shell light curves is likely linked to very rapid rotation; and (b) the fact that components of binaries tend to be the most rapidly rotating M dwarfs in Upper Sco.
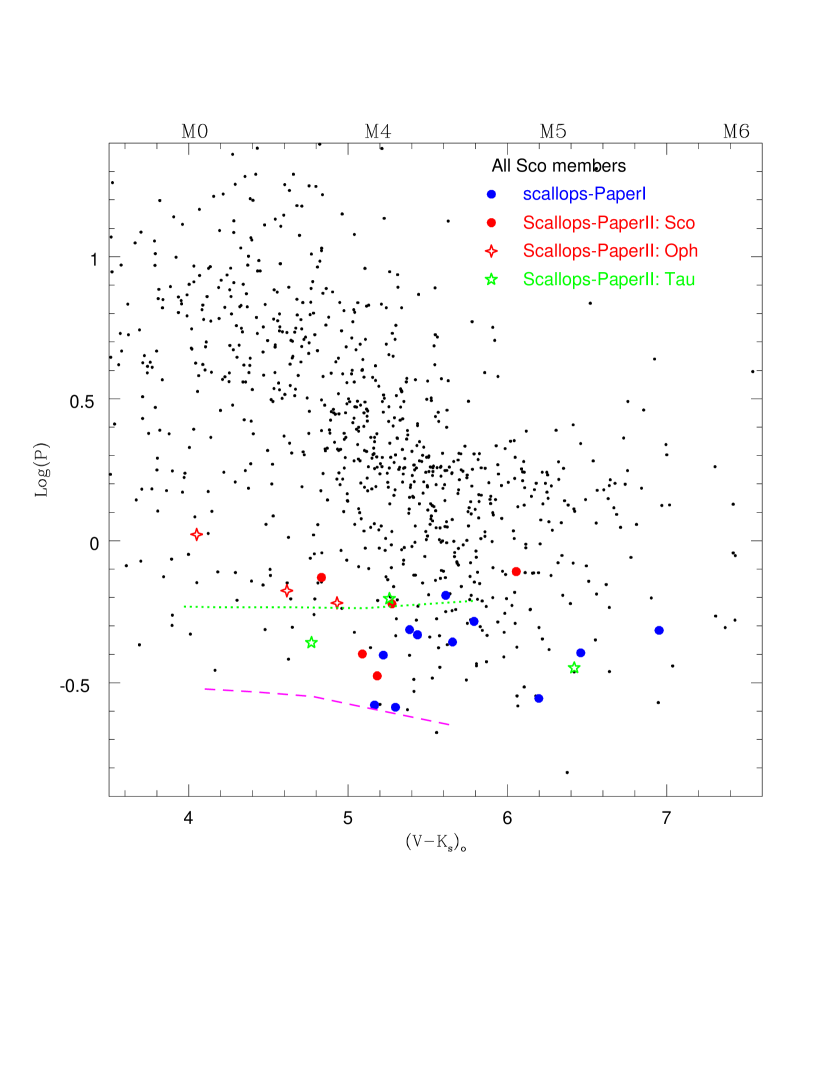
Direct demonstration of the relatively rapid rotation of the stars with scallop-shell light curves is provided in Figure 10. The scallop-shell stars clearly segregate to the most rapidly rotating portion of the diagram. The most slowly rotating stars with scallop-shell light curves are those in Oph – where the much younger age means that even dM stars with 1 day periods are rotating relatively close to breakup. The Taurus scallop-shell stars have periods intermediate between the Oph average and the Upper Sco average, indicating perhaps that Taurus is intermediate in age between those two clusters. We have used Maeder’s (2009) formula for the breakup period: where is the star’s polar radius when rotating at breakup and we have used the BHAC15 (Baraffe et al. 2015) models to provide radii for a given mass and age. The curve representing the breakup period at 8 Myr makes a reasonable lower bound to the Upper Sco period distribution, lending some credence to this prediction. However, the curve for the breakup period at 2 Myr is perhaps surprising. If valid, it would suggest that the Oph stars are of order 2 Myr old, and that at least the WTTs in Taurus have an age of 3-4 Myr (as recently suggested by Rees et al. 2016 for other reasons), rather than the more traditional age of 1-2 Myr. However, the radii we use to estimate the breakup period are uncertain for several reasons and this may allow the curves to shift up or down by a significant amount. We note for now simply that plots such as this might eventually be useable as a test of the theoretical evolutionary models or perhaps as an additional means to estimate ages of PMS clusters.
The fraction of the Upper Sco M dwarfs that are scallops is a strong function of rotation rate: (a) none of the Upper Sco stars with 1.0 days are scallops; (b) 9% (16 of 179) of those with 1 day are scallops; (c) 15% (15 of 101) of those with 0.7 days are scallops; and (d) 22% (12 of 55) of those with 0.5 days are scallops. Models to explain the scallop-shell light curves probably require there to be a torus of gas and dust at the Keplerian co-rotation radius and that our line-of-sight pass through that torus (Townsend & Owocki 2005; Stauffer et al. 2017; Farihi, von Hippel & Pringle 2017; D’Angelo et al. 2017). Therefore, the percentage of stars with scallop-shell light curve morphologies are lower limits to the fraction of stars having these tori; for plausible torus scale heights, the majority of the rapidly rotating young dM stars may be so affected. Also, several more of the rapidly rotating dMs have marginally detected light curve features which we suspect arise from the same processes as for the stars in Table 1 (we provide a complete list of all the possible members of the scallop-shell class in Rebull et al. 2018); we have concentrated on a highly reliable sample of scallop-shell stars in this paper and in S17 in order to allow us to best illustrate their light curve morphologies.
6 Summary and Next Steps
Using the data presented in this paper and in S17, we have identified a previously unknown type of variable star. Based on our current sample of 23 such stars, the “scallop-shell” variability class has the following characteristics:
-
•
They all have phased light curves with multiple humps and dips and too much small-scale structure to be accounted for by rotational modulation of photospheric spots;
-
•
They all have very short periods, ranging from 0.26 days to 1.05 days;
-
•
With one exception, they all have mid-M spectral types, ranging from M3 to M6. The one exception has spectral type M1.5. None of these stars show a detected IR excess;
-
•
All of the members of the class have ages believed to be 10 Myr. A similar-sized sample of rapidly rotating M dwarfs with age 100 Myr show no examples of stars with this light curve morphology;
-
•
The light curve morphology is most commonly stable over timescales corresponding to a K2 campaign duration (75-80 days);
-
•
For the minority of the members that do show light curve morphology changes, the change occurs abruptly and usually only affects 20% of the light curve (in phase). In about half the cases where there is a jump in light-curve morphology, a flare-like event is present at the time of the morphology change;
-
•
The light curve amplitudes in the Kepler bandpass range from a couple per cent to more than 15%;
-
•
Among the most rapidly rotating M dwarfs in Upper Sco, more than 20% of the stars have scallop-shell light curves. Assuming a physical model where the photometric variability of these stars depends on our line of sight intersecting a torus of gas and dust orbiting the star, half or more of the most rapidly rotating M dwarfs in Upper Sco may be subject to this physical process.
We view our current paper and our previous paper (S17) primarily as discovery papers. By that, we mean our goal is primarily to make the community of young star researchers aware that there are two dozen young PMS stars in three of the nearest sites of active star formation that have striking photometric variability not well-explained by any of the standard mechanisms. We have attempted to provide as clear a description of the empirical properties of the light curve morphologies of these stars as possible. However, there is very much left to do. The most pressing need is to derive a detailed physical model, though some progress has been recently made on that front (D’Angelo et al. 2017; Farihi et al. 2017). High spatial-resolution imaging and multi-epoch radial velocity data for the scallop-shell stars in binary systems to determine their orbital separation would help identify any direct physical link between binarity and scallop-shell photometric variability. We doubt if there is such a link, but the large fraction of the scallop-shell stars that are in binary systems argues in favor of making this test. Simultaneous, multi-wavelength synoptic monitoring of a few of the stars with the largest K2 photometric variability to determine the dependence of the variability amplitude with wavelength would directly constrain the physical mechanism driving the variability. New synoptic photometry at any epoch would help determine the temporal stability of the light curve morphologies. A few of the scallop-shell stars have poorly determined kinematics and hence their membership in Upper Sco, Oph or Taurus is uncertain - accurate radial velocities plus improved distances and proper motions (which should soon become available from Gaia DR2) will help in this regard.
If the unusual light curve morphologies we have found were simply curiosities, the time and effort needed to explain their properties might not be justifiable. However, given the current emphasis of targeting M dwarfs – and in particular late M dwarfs – in the search for the nearest rocky, habitable zone planets, our Upper Sco and Taurus stars take on more significance. A large fraction of the low mass M dwarfs in Upper Sco may have the gas (and dust) tori that we believe give rise to the scallop-shell light curves (D’Angelo et al. 2017). Understanding the formation and evolution of these tori may well have consequences for understanding the angular momentum evolution of these stars. For those reasons, we hope that other teams will work to unlock the secrets of these stars and determine their importance to understanding the early evolution of M dwarfs.
References
- Ahn et al. (2014) Ahn, C., Alexandroff, R., Allende Prieto, C., et al. 2014, ApJS, 211, 17
- D’Angelo et al. (2017) D’Angelo, C., Jardine, M., & See, V. 2017, MNRAS, submitted.
- Bouvier et al. (1999) Bouvier, J., Chelli, A., Carrasco, L., et al. 1999, A&A, 349, 619.
- Butler et al. (2015) Butler, C., Erkan, E., Budding, E. et al. 2015, MNRAS, 446, 4205.
- Clemens et al. (2004) Clemens, J., Crain, J., & Anderson, R. 2004, SPIE, 5492, 331.
- Cody et al. (2014) Cody, A., Stauffer, J., Baglin, A. et al. 2014, AJ, 147, 82.
- Cody et al. (2017) Cody, A., Hillenbrand, L., David, T., et al. 2017, ApJ, 836, 41.
- Cody et al. (2018) Cody, A., Hillenbrand, L., David, T., et al. 2018, submitted.
- Cutri et al. (2012) Cutri, R. M., Wright, E. L., Conrow, T., et al. 2012, http://wise2.ipac.caltech.edu/docs/release/allsky/expsup/
- David et al. (2017) David, T., Petigura, E., Hillenbrand, L., et al. 2017, ApJ, 835, 168.
- Erickson et al. (2011) Erickson, K., Wilking, B., Meyer, M., et al. 2011, AJ, 142, 140.
- Farihi et al. (2017) Farihi, J., von Hippel, T., & Pringle, J. 2017, MNRAS, 471, L145.
- Feiden (2016) Feiden, G. 2016, A&A, 593, A99.
- Flewelling et al. (2016) Flewelling, H., Magnier, E., Chambers, K. et al. 2016, arXiv:1612.05243.
- Gaia Collaboration et al. (2016) Gaia Collaboration, Prusti, T., de Bruijne, J.H.J., et al., 2016, A&A, 595, 1.
- Henden & Munari (2014) Henden, A., & Munari, U., 2014, CoSka, 43, 518
- Howell et al. (2014) Howell, S., Sobeck, C., Haas, M., et al. 2014, PASP, 126, 398.
- Jones et al. (1996) Jones, B., Fischer, D., & Stauffer, J. 1996, AJ, 112, 1562.
- Luger et al. (2016) Luger, R., Agol, E., Kruse, E., et al. 2016, AJ, 152, 100.
- Maceroni & Rucinski (1997) Maceroni, C. & Rucinski, S. 1997, PASP, 109, 782.
- Maceroni & Montalban (2004) Maceroni, C. & Montalban, J. 2004, A&A, 426, 577.
- McQuillen et al. (2013) McQuillen, A., Aigrain, S., & Mazeh, T. 2013, MNRAS, 432, 1203.
- Meyer et al. (2006) Meyer, M., Hildebrand, L., Backman, D., et al. , 2006, PASP, 118, 1690
- Morales-Calderon et al. (2011) Morales-Calderon,M., Stauffer, J., Hillenbrand, L. et al. 2011, ApJ, 733, 50.
- Murakami et al. (2007) Murakami, H., Baba,H., Barthel, P. et al. 2007, PASJ, 59, 369
- Oke & Gunn (1982) Oke, J.B. & Gunn, J.E. 1982, PASP, 94, 586.
- Preibisch et al. (2001) Preibisch, T., Guenther, E. & Zinnecker, H. 2001, AJ, 121, 1040.
- Preibisch et al. (2002) Preibisch, T., Brown, A., Bridges, T. et al. 2002, AJ, 124, 404.
- Rappaport et al. (2012) Rappaport, S., Levine, A., Chiang, E. et al. 2012, ApJ, 752, 1.
- Rebull et al. (2016) Rebull, L., Stauffer, J., Bouvier, J., et al. 2016, AJ, 152, 114.
- Rebull et al. (2018) Rebull, L., Stauffer, J., Cody, A., et al. 2018, in preparation.
- Rees et al. (2016) Rees, J., Wilson, T., Bell, C. et al. 2̇016, IAU Sump. 314, 205.
- Rizzuto et al. (2015) Rizzuto, A., Ireland, M., & Kraus, A. 2015, MNRAS, 448, 2737.
- Sanchis-Ojeda et al. (2015) Sanchis-Ojeda, R., Rappaport, S., Palle, E., et al. , 2015, ApJ, 812, 112.
- Skrutskie et al. (2006) Skrutskie, M., Cutri, R. M., Stiening, R., et al. , 2006, AJ, 131, 1163
- Slesnick et al. (2006) Slesnick, C., Carpenter, J., Hillenbrand, L., & Mamajek, E. 2006, AJ, 132, 2665.
- Smullen & Kobulnicky (2015) Smullen, R. & Kobulnicky, H. 2015, ApJ, 808, 166.
- Stauffer et al. (1979) Stauffer, J., Spinrad, H., & Thorstensen, J. 1979, PASP, 91, 59.
- Stauffer et al. (2015) Stauffer, J., Cody, A., McGinnis, P., et al. 2015, AJ, 149, 130.
- Stauffer et al. (2016) Stauffer, J., Rebull, L., Bouvier, J., et al. 2016, AJ, 152, 115.
- Stauffer et al. (2017) Stauffer, J., Collier-Cameron, A., Jardine, M., et al. 2017, AJ, 153, 152.
- Strassmeier et al. (1990) Strassmeier, K., Fekel, F., Bopp, B. et al. 1990, ApJS, 72, 191.
- Townsend & Owocki (2005) Townsend, R. & Owocki, S. 2005, MNRAS, 357, 251.
- Vanderburg & Johnson (2014) Vanderburg, A., & Johnson, J., 2014, PASP, 126, 948
- Vogt et al. (1994) Vogt, S., Allen, S., Bigelow, B. et al. , 1994, SPIE, 2198, 362.
- Werner et al. (2004) Werner, M., Roellig, T., Low, F., et al. , 2004, ApJS, 154, 1
- Wilking et al. (2005) Wilking, B., Meyer, M., Robinson, J., & Green, T. 2005, AJ, 130, 1733.
- Wright et al. (2010) Wright, E., Eisenhardt, P. R. M., Mainzer, A. K., et al., 2010, AJ, 140, 1868
- Zimmerman et al. (2017) Zimmerman, M., Thompson, S., Mullally, F., et al. 2017, ApJ, 846, 147.
Appendix A New Spectroscopy
We have obtained high resolution spectra for EPIC 203636498 and 204099739 using the Keck HIRES spectrograph (Vogt et al. 1994). These spectra cover the wavelength range roughly 4800 to 9200 Å, at a spectral resolution of about R = 45,000. We have obtained intermediate resolution spectra for EPIC 204060981, 205267399, 204185983 and 204099739 using the Palomar 5m Double Spectrograph (Oke & Gunn 1982), with one star being in common with the HIRES data (EPIC 204099739). These spectra cover the wavelength range roughly 3800 to 7400 Å, at a spectral resolution of about R = 3000 for the blue-arm and R = 6000 for the red arm. We have obtained low resolution spectra for two of the Taurus members, EPIC 246676629 and 246682490, with the Lick 3m KAST spectrograph. The spectral resolution for these spectra is R 1000, and the wavelength range is 5600-7750 Å. Finally, we have obtained an additional low resolution spectrum for EPIC 246676629 using the SOAR telescope and Goodman spectrograph (Clemens et al. 2004). The resolution in this case is R 850 and the wavelength coverage is 5000-9000 Å.
We measured equivalent widths for H and lithium using the SPLOT routine in IRAF for all of these spectra. All of the stars have H equivalent widths in the range -2.5 to -10, in accord with expectations for WTTS of a few Myr age. Where our spectra have sufficient S/N, all of them but one show lithium absorption equivalent widths also in the range expected for early to mid M dwarfs of this age. The one exception is EPIC 205267399, which has a good S/N DBSP spectrum but a limit of its lithium equivalent width of 0.15 Å. Everything else suggests this star is a member of Upper Sco, so we retain it in our sample. The relatively low spectral resolution for the KAST and Goodman spectra is not optimal for measurement of the lithium feature, but we believe it is present in both EPIC 246676629 (both spectra) and EPIC 246682490. The lithium equivalent widths for these stars are uncertain at probably the 50% level, which we indicate in Table 1 by adding a colon after the value we have measured.
We have also used these spectra to determine spectral types based on the strength of the TiO bandheads in the 6500-7500 Å range (Stauffer et al. 1979; Preibisch et al. 2001). The estimated spectral types are listed in Table 1.
Figure 11 show the H profiles from our HIRES spectra; Figure 12 show the H profiles from our DBSP spectra. The H emission lines have approximately Gaussian shapes, as expected for rapidly rotating dMe stars. A few of the profiles have possible weak, high velocity wings, but higher S/N spectra would be needed to confirm this. Figure 13 shows the red-optical wavelength range for several of the stars observed with DBSP, Goodman and KAST to illustrate the data available for spectral typing.


Appendix B Spectral Energy Distributions
Spectral energy distributions for all the stars from Table 1 are provided here as Figure 14 and Figure 15. Plots are log in cgs units (ergs s-1 cm-2) against log in microns. Symbols: : optical literature (SDSS, APASS); box at short bands: DENIS ; diamond: 2MASS ; circle: IRAC; box at long bands: MIPS; stars: WISE; arrows: limits; vertical bars (often smaller than the symbol) denote uncertainties. A Kurucz-Lejeune model for the corresponding spectral type (taken to be M3 for the one star without known type) is also shown as the grey line, normalized to the observations at . Note that this is not a robust fit, but just to “guide the eye.” The Oph members have been lightly reddened to better fit the optical points ( in all cases). Essentially all the stars have SEDs consistent with pure photospheres; none have large IR excesses.