Identification of High Mass X-ray Binaries selected from XMM-Newton observations of the LMC††thanks: These observations are based on SALT proposal 2013-2-RSA_OTH_UKSC-004.
Abstract
The Large Magellanic Cloud (LMC) currently hosts around 23 high mass X-ray binaries (HMXBs) of which most are Be/X-ray binaries. The LMC XMM-Newton survey provided follow-up observations of previously known X-ray sources that were likely HMXBs, as well as identifying new HMXB candidates. In total 19 candidate HMXBs were selected based on their X-ray hardness ratios. In this paper we present red and blue optical spectroscopy, obtained with SALT and the SAAO 1.9-m telescope, plus a timing analysis of the long term optical light curves from OGLE to confirm the nature of these candidates. We find that 9 of the candidates are new Be/X-ray Binaries, substantially increasing the LMC Be/X-ray binary population. Furthermore, we present the optical properties of these new systems, both individually and as a group of all the BeXBs identified by the XMM-Newton survey of the LMC.
keywords:
Magellanic Clouds – X-rays: binaries – stars: emission-line, Be1 Introduction
High Mass X-ray Binaries (HMXBs) include supergiant X-ray binaries (SGXBs) and Be/X-ray binaries (BeXBs). SGXBs are luminosity class I-II stars, with their mass transfer mechanisms being either Roche lobe overflow or wind accretion. BeXBs making up the largest fraction of HMXBs, having a Oe or Be companion with luminosity class III-V. These stars are either late type O or early B, emission line stars, with the majority having spectral types of B0-B1 (Negueruela & Coe 2002, Coe et al. 2005, McBride et al. 2008). The emission originates from a decretion disc around the star, which formed due to the rapid rotation (rotating at 75% (Rivinius et al., 2013) of their critical velocity) of the stars, although the mechanism responsible for the decretion disc formation is poorly understood (Porter & Rivinius, 2003).
The Magellanic Clouds (MCs) are our closest neighbouring galaxies. As such they provide an independent astrophysical laboratory outside of the Milky Way, with minimal extinction and known distances. As such they can be used for extensive studies of their stellar populations and, potentially, the environmental impact on star formation (SF) (Dray 2006, Walter et al. 2015). We can measure the recent SF rate of the MCs directly by means of their HMXB population, since these massive stars must have formed recently (Grimm et al., 2003). The Small Magellanic Cloud (SMC) contains a large population of HMXBs. A recent census by Haberl & Sturm (2016) shows that 120 HMXBs have been identified in the SMC, of which more than 60 show X-ray pulsations indicating the spin period of a neutron star. It provides a comprehensive sample to conduct population synthesis studies to help understand the recent SF, and how the SMC’s environment affected it. Conversely, only 40 HMXBs have been identified in the Large Magellanic Cloud (LMC), of which only 23 have been confirmed (Antoniou & Zezas, 2016; Vasilopoulos et al., 2016, 2017). With so few confirmed HMXBs in the LMC it is difficult to make comparisons with population synthesis and SF studies. More complete samples of LMC HMXBs will allow one to investigate the effects of metallicity on SF at better spatial resolution scales, by comparing the SF history of the SMC (Z0.2 Z⊙, Luck et al. 1998) with the LMC (Z0.5 Z⊙, Cole et al. 2005) and the Milky Way.
Thus in an effort to increase the sample of confirmed LMC HMXBs, we investigate the nature of the optical counterparts of 19 HMXB candidates, some of which were identified by previous surveys (Liu et al., 2005), but with improved positions and hardness ratios from the XMM-Newton survey, as well as new candidates identified by the XMM-Newton survey. We use spectra from the Southern African Large Telescope (SALT) to search for H emission from the decretion disc, blue spectra from the SAAO 1.9 m telescope to determine the spectral class of the central star, and finally we conduct a timing analysis using -band OGLE IV light curves. Based on the X-ray and optical properties we confirm 9 of the candidates as BeXBs. In section 2 we give an overview of the observations, in section 3 we describe the analysis procedures, followed by a discussion of the results in section 4, and a outline of our conclusions in section 5.
2 Overview of Observations
2.1 XMM data
We selected our targets for optical follow-up spectroscopy from preliminary source detection lists, which we obtained from XMM-Newton (Jansen et al., 2001) observations. For our analysis we used the observations from the LMC survey, a very large XMM-Newton programme to cover the central part of the LMC (PI: F. Haberl), which included archival, as well as ToO observations up to October 2013 within 4° centred at R.A. = 05h 22m 00s, Dec. = -68° 30′ 00″ (see Figure 1 in Maggi et al. 2016). XMM-Newton carries three X-ray telescopes with a CCD detetcor the European Photon Imaging Camera (EPIC-pn, EPIC-MOS; Strüder et al. 2001; Turner et al. 2001, respectively) in each focal plane. To derive X-ray source detection lists for each observation, we followed the analysis steps of Sturm et al. (2013), applying a maximum likelihood algorithm (edetect_chain) from the XMM-Newton Science Analysis Software111SAS, http://xmm.esa.int/sas/ to images from the three cameras, simultaneously.
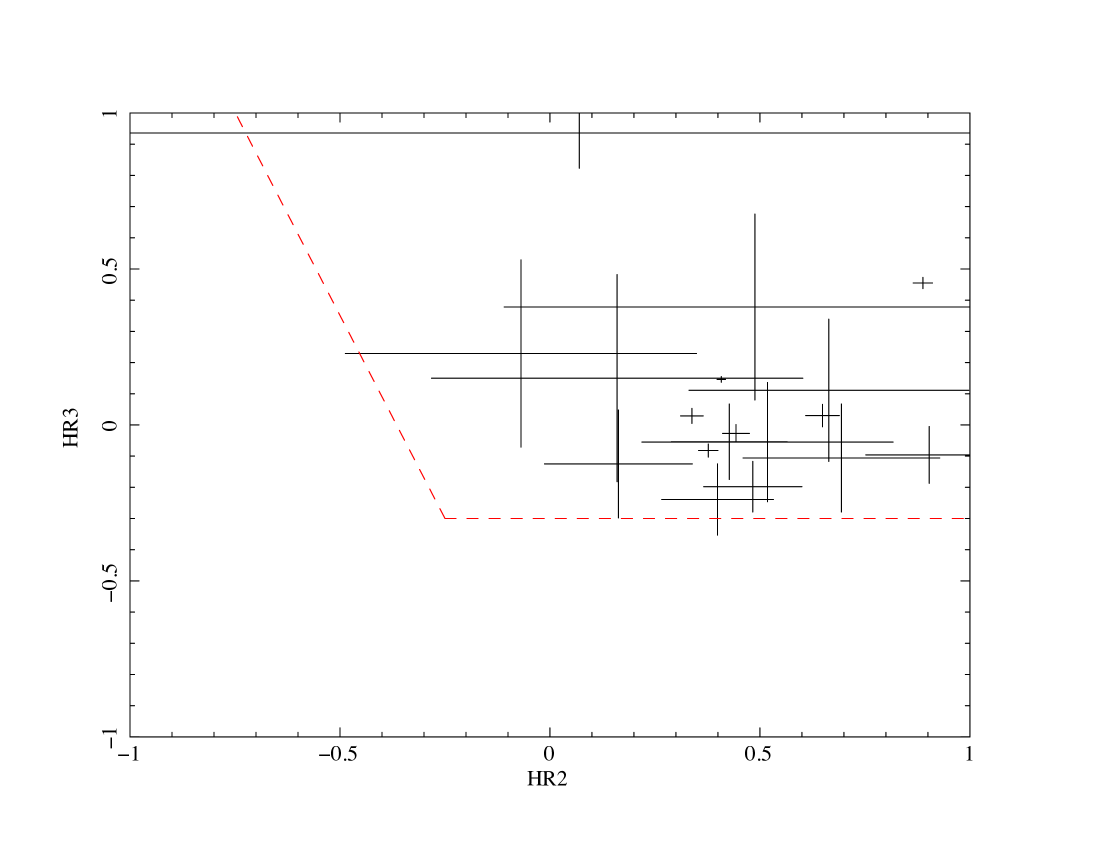
Candidates for HMXBs are characterised by hard X-ray spectra, which allows them to be selected using hardness ratios (X-ray colours; Sturm et al. 2013). In addition their optical counterparts are bright (typically magnitudes between 13 and 17 for stars in the Magellanic Clouds). From our source lists we selected 19 candidates which fulfilled hardness ratio criteria (see below) and had a possible optical counterpart within 5″ with appropriate optical brightness and colours. Finally we added Swift J0513.4-6547, a discovered Be/X-ray binary pulsar (Krimm et al., 2009) to our sample. The target list is presented in Table 1 with X-ray properties obtained from re-processing the data with the latest version of SAS (16.1) and including new data, which became available since our first detection run. To improve the X-ray coordinates, we applied astrometric corrections, using a catalogue of background AGN as the reference frame. In contrast to Sturm et al. (2013), we applied background filtering individually for each instrument, which gains exposure time for EPIC-MOS. Candidate 5, originally detected with very low existence likelihood could not be confirmed as an X-ray source and was excluded from the list.
We performed source detection simultaneously on images from the three instruments and the five standard energy bands 0.20.5 keV, 0.51 keV, 12 keV, 24.5 keV, and 4.512 keV and computed four hardness ratios HRi = (Ri+1 Ri)/(Ri+1 + Ri), with Ri the inferred source counts in band i. Several of our candidates are detected multiple times. In some cases more than 20 detections are available due to frequent calibration observations undertaken of the supernova remnant N132D or from a monitoring program of Cal 83, a supersoft X-ray source in the LMC.
HR2 and HR3 are listed in Table 1 and plotted in Fig. 1 and were derived using the sum of counts from all observations covering the source, i.e. represent average hardness ratios. Similarly, average X-ray fluxes are given, which are converted from count rates using conversion factors taken from Sturm et al. (2013). Also X-ray coordinates were computed as error-weighted mean and errors (1 confidence, with a 0.5″ systematic uncertainty added in quadrature) propagated, when multiple detections are available.
A comparison of the X-ray positions with the positions of the selected counterparts from the Two Micron All Sky Survey (2MASS; Skrutskie et al., 2006), shows agreement better than 2 for most of the candidates (Table 1). The largest discrepancy in X-ray to optical separation is seen for BeCand-18. This is detected as weak source in 24 observations of N132D, in most cases at the rim of the field of view (FoV) with off-axis angles 13′, which results in relatively large positional uncertainties. The large number of observations covering BeCand-18 allowed us to reduce the error considerably (Table 1). Also, in two observations the source was located at off-axis angles of 6.3′ and 8.7′, which also yield separations of 3.9″ and 3.1″, respectively. BeCand-8 and BeCand-9 are also located in the FoV of the N132D observations. BeCand-8 is brighter than the other two candidates and its X-ray and 2MASS position match perfectly, confirming the correct astrometry of these observations. We conclude, that the large discrepancy in X-ray/optical separation for BeCand-18 makes a chance coincidence highly likely.
We took the U, B and V magnitudes of the selected optical counterparts from the Magellanic Clouds Photometric Survey (MCPS; Zaritsky et al., 2004), computed UB, BV colours and the reddening-free parameter Q = UB 0.72(BV) which shows typical values of 1.1 to 0.7 for the known Be/X-ray binaries in the Small Magellanic Cloud (SMC; Haberl & Sturm, 2016). The distribution of Q values from our candidate sample (Table 1) is fully consistent with that of the SMC systems.
| Be222BeCand-5: preliminary X-ray detection not confirmed. BeCand-6: no XMM-Newton data, Swift discovery (Krimm et al., 2009). BeCand-8/11: coordinates of optical counterpart from 2MASS 6X. BeCand-9: No 2MASS catalog entry, coordinates of optical counterpart from OGLE (with Imag). BeCand-2: The value for B (16.676 0.091 mag) is obviously wrong in the MCPS catalogue, therefore we used B = 13.78 mag from Massey (2002) to compute the Q value. BeCand-18: likely a chance coincidence between optical and X-ray source. | —————————————– XMM-Newton —————————————– | ———- 2MASS ———- | X-2M | MCPS | |||||||
| Cand | RA | Dec | Err | N | HR2 | HR3 | Flux | RA | Dec | Sep | Q |
| [h m s] | [° ′ ″] | [″] | det | [cgs]333Average (error weighted) 0.212 keV flux in erg s-1 cm-2 | [h m s] | [° ′ ″] | [″] | [mag] | |||
| 1 | 04 55 46.68 | -69 57 21.0 | 1.47 | 1 | 0.66 0.33 | 0.11 0.23 | 1.07E-13 | 04 55 46.34 | -69 57 18.8 | 2.85 | -1.159 |
| 2 | 05 00 46.24 | -70 44 35.4 | 0.50 | 1 | 0.41 0.01 | 0.15 0.01 | 1.13E-11 | 05 00 46.05 | -70 44 36.0 | 1.14 | -0.852 |
| 3 | 05 07 22.33 | -68 47 58.2 | 1.21 | 2 | 0.43 0.14 | -0.05 0.12 | 1.01E-13 | 05 07 22.15 | -68 47 59.2 | 1.43 | -0.515 |
| 4 | 05 07 55.35 | -68 25 05.1 | 0.27 | 4 | 0.38 0.02 | -0.08 0.02 | 1.59E-12 | 05 07 55.47 | -68 25 05.3 | 0.66 | -1.049 |
| 6 | 05 13 28.28 | -65 47 18.4 | 0.37 | 05 13 28.26 | -65 47 18.7 | 0.35 | -0.923 | ||||
| 7 | 05 20 49.11 | -69 19 30.1 | 0.71 | 3 | 0.07 1.98 | 0.94 0.11 | 1.50E-13 | 05 20 48.84 | -69 19 30.3 | 1.40 | -0.576 |
| 8 | 05 24 17.14 | -69 25 33.7 | 0.24 | 30 | 0.40 0.13 | -0.24 0.11 | 8.05E-14 | 05 24 17.15 | -69 25 33.8 | 0.08 | -0.631 |
| 9 | 05 25 46.46 | -69 44 50.9 | 0.33 | 22 | 0.48 0.12 | -0.20 0.08 | 2.35E-14 | 05 25 46.32 | -69 44 51.7 | 1.11 | -0.401 |
| 10 | 05 28 58.38 | -67 09 46.4 | 0.75 | 1 | 0.16 0.18 | -0.12 0.17 | 1.18E-13 | 05 28 58.46 | -67 09 45.9 | 0.69 | -0.871 |
| 11 | 05 30 10.89 | -69 47 55.8 | 0.91 | 1 | 0.07 0.42 | 0.23 0.30 | 2.66E-14 | 05 30 10.79 | -69 47 55.4 | 0.71 | -0.623 |
| 12 | 05 30 11.32 | -65 51 23.9 | 0.37 | 2 | 0.34 0.03 | 0.03 0.02 | 1.21E-12 | 05 30 11.37 | -65 51 24.1 | 0.34 | -0.973 |
| 13 | 05 30 45.42 | -70 40 35.7 | 1.10 | 2 | 0.52 0.30 | -0.06 0.19 | 2.35E-14 | 05 30 45.16 | -70 40 34.8 | 1.55 | -0.573 |
| 14 | 05 30 59.27 | -68 32 53.4 | 1.68 | 1 | 0.16 0.44 | 0.15 0.33 | 1.08E-14 | 05 30 59.41 | -68 32 53.8 | 0.83 | -0.962 |
| 15 | 05 31 08.33 | -69 09 23.5 | 0.51 | 1 | 0.89 0.02 | 0.46 0.02 | 2.16E-12 | 05 31 08.45 | -69 09 23.5 | 0.64 | -0.524 |
| 16 | 05 33 20.87 | -68 41 22.6 | 0.65 | 2 | 0.65 0.04 | 0.03 0.04 | 6.47E-13 | 05 33 20.69 | -68 41 23.5 | 1.28 | -0.945 |
| 17 | 05 33 28.23 | -67 48 45.9 | 0.82 | 1 | 0.69 0.23 | -0.11 0.17 | 1.59E-13 | 05 33 28.19 | -67 48 46.5 | 0.68 | -0.765 |
| 18 | 05 25 50.70 | -69 27 29.9 | 0.30 | 24 | 0.90 0.15 | -0.10 0.09 | 6.12E-14 | 05 25 50.59 | -69 27 32.9 | 3.02 | -0.804 |
| 19 | 05 40 45.48 | -69 14 52.7 | 1.19 | 2 | 0.49 0.60 | 0.38 0.30 | 2.07E-14 | 05 40 45.58 | -69 14 51.7 | 1.19 | -0.772 |
| 20 | 05 41 34.18 | -68 25 48.5 | 0.12 | 25 | 0.44 0.03 | -0.03 0.03 | 2.81E-11 | 05 41 34.32 | -68 25 48.4 | 0.77 | -0.955 |
2.2 SALT H spectra
H spectra were taken with SALT (Buckley et al., 2006) between January 13 2014 and February 8 2014 , and on October 30 2017 with RSS (Burgh et al., 2003) in longslit mode, using the PG2300 grating with a slit width of , and 22 binning, yielding a resolution of 0.9 Å around H. The 2-D product spectra received from the SALT pipeline were reduced with PySALT (Crawford et al., 2010), and wavelength calibrated with a Thorium-Argon lamp. The exposure dates and times for each observation are shown in Table 2.
| BeCand | —————- SALT—————- | —————- 1.9 m —————- | OGLE IV ID | ||
|---|---|---|---|---|---|
| Date | Exp. Time (s) | Date | Exp. Time (s) | ||
| 1 | 13-01-2014 | 200 | 24-11-2016 | 3600 | LMC530.26.30737 |
| 2 | 13-01-2014 | 200 | 24-11-2016 | 3600 | LMC508.31.62 |
| 3 | 15-01-2014 | 400 | 26-11-2016 | 5400 | LMC510.11.55526 |
| 4 | 14-01-2014 | 200 | - | - | LMC510.20.50751 |
| 6 | 14-01-2014 | 250 | 26-11-2016 | 3600 | LMC506.16.16 |
| 7 | 14-01-2014 | 250 | - | - | LMC503.11.56624 |
| 8 | 07-02-2014 | 400 | - | - | LMC503.09.85386 |
| 9 | 16-01-2014 | 500 | - | - | LMC516.25.32805 |
| 10 | 14-01-2014 | 250 | 26-11-2016 | 3600 | LMC518.23.4542D |
| 11 | 07-02-2014 | 500 | 29-11-2016 | 5400 | - |
| 12 | 15-01-2014 | 200 | 24-11-2016 | 3600 | LMC519.29.9750 |
| 13 | 08-02-2014 | 300 | 27-11-2016 | 5400 | LMC515.31.15984 |
| 14 | 30-10-2017 | 1300 | - | - | LMC517.22.4360 |
| 15 | 19-01-2014 | 150 | 27-11-2016 | 1800 | LMC517.05.18792 |
| 16 | 18-01-2014 | 160 | - | - | LMC517.20.21029 |
| 17 | 15-01-2014 | 200 | 25-11-2016 | 5400 | LMC518.03.9420 |
| 18 | 15-01-2014 | 250 | 27-11-2016 | 3600 | LMC503.08.66672 |
| 19 | 16-01-2014 | 400 | 29-11-2016 | 3600 | LMC553.24.87 |
| 20 | 16-01-2014 | 150 | 27-11-2016 | 1800 | LMC554.06.18693 |
-
•
The ′′-′′ signifies the absence of a particular dataset. SALT: The SALT dataset comprises of all the H spectra. The 1.9 m dataset comprises of all the blue spectra for spectral classification, while the listed exposure times are those of the averaged combined spectra.
2.3 SAAO 1.9 m blue spectra
Blue spectra were taken with the SAAO 1.9 m telescope between 2016 November 24 and 29. The observations were carried out with the SpUpNIC spectrograph (Crause et al., 2016), using grating 4 to cover a wavelength range of 3800–5000 Å, with 12 binning, yielding a resolution of 4 Å. Depending on the source brightness and the weather conditions, exposure times ranged from 1200 to 1800 seconds, and were observed multiple times if necessary to produce averaged spectra with SNR of 40. Table 2 shows the observation dates and the total exposure times for the average combined spectra. The spectra were reduced and extracted using IRAF444http://iraf.noao.edu, cosmic ray cleaned using a Python based lacosmic routine (van Dokkum, 2001), and wavelength calibrated using Copper-Argon arc lamps. The final, averaged combined spectra were rectified and smoothed with a 3 point boxcar smoothing routine, using IRAF’s splot routine.
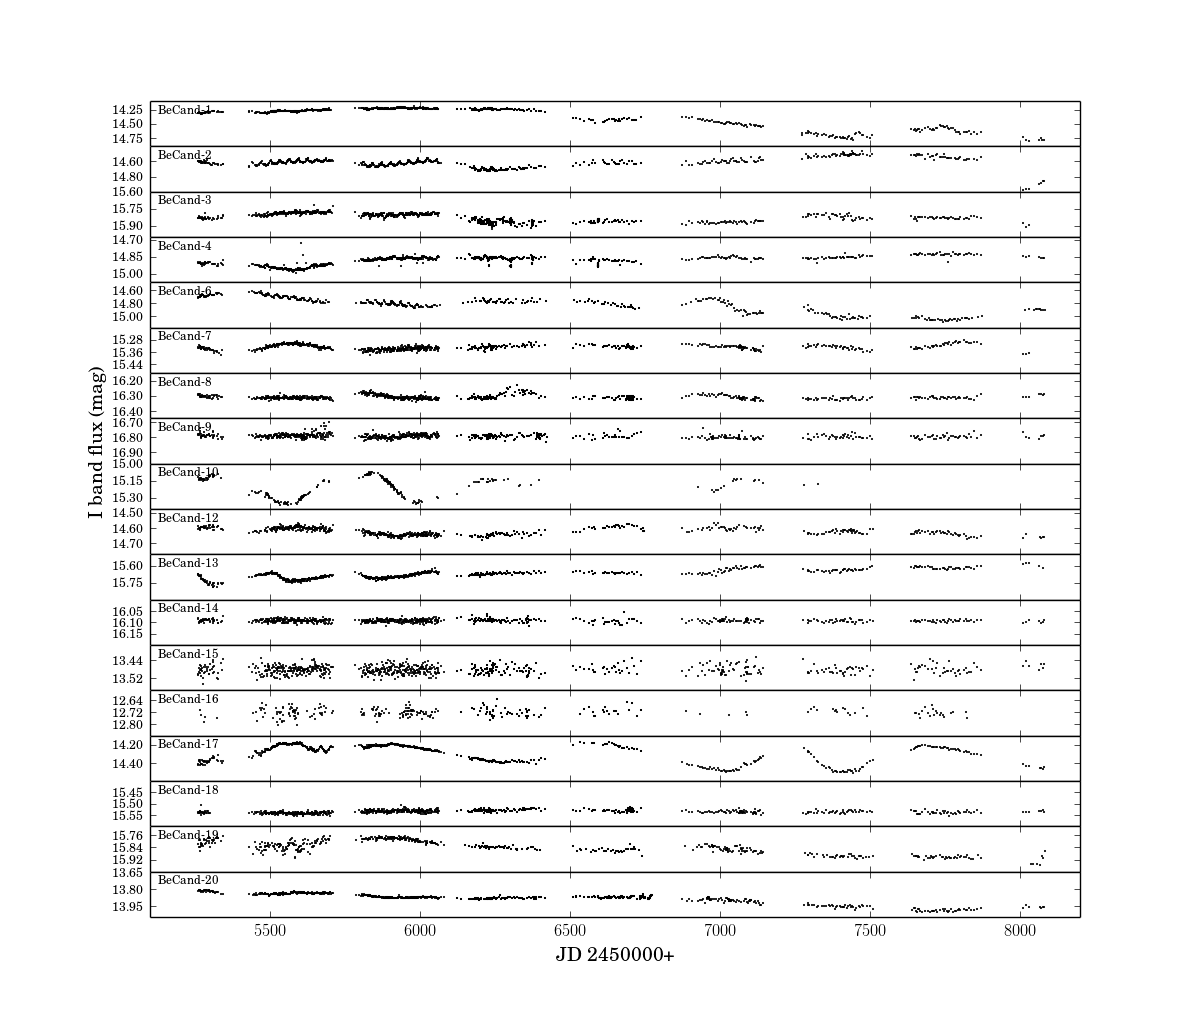
2.4 OGLE IV light curves
The Optical Gravitational Lensing Experiment (Udalski et al., 2015) provided long term I band light curves with roughly daily sampling for 18 of the candidates in the OGLE IV field. BeCand-11 was the only candidate for which no photometry was available, but the respective OGLE ID’s for which photometry was available are listed in Table 2. The OGLE light curves were used to study the variability of the candidate optical counterparts. The identified periodicities and comments on the variability are listed in Table 3.
3 Analysis Methods
3.1 SALT H spectra
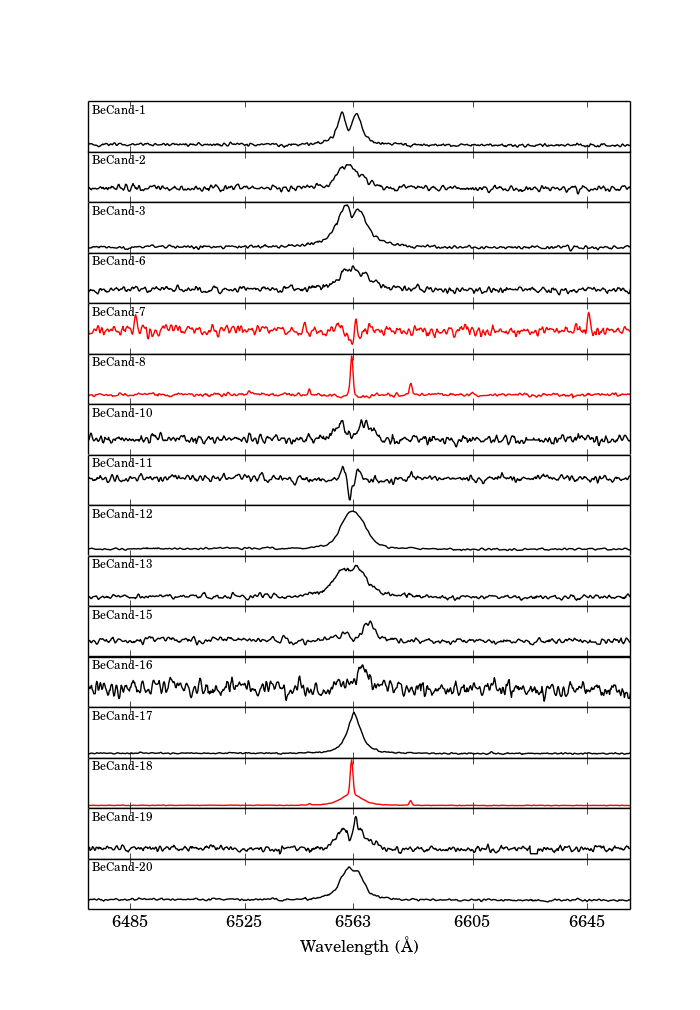
Two categories of H emission were observed namely, narrow emission characteristic of diffuse, interstellar HII regions in the LMC, which is not intrinsic to the candidates, and broad emission resulting from Doppler shifts due to the motion of the decretion disc. BeCand-8 only showed narrow H emission, while BeCand-18 had extended narrow H emission superimposed on broad H emission (Figure 2). Out of the 19 optical candidates 13 candidates exhibited intrinsic H emission. IRAF’s splot was used to measure the equivalent widths (EWs), as well as the V/R ratios for the double peaked profiles. The H profile measurements for each candidate was repeated 5 times to determine a average EW and V/R ratio, with the uncertainty estimated from the standard deviation of the mean. Figure 2 shows the emission H spectra and Table 3 lists the various H profile measurements for the 15 HMXB candidates that exhibit H emission.
| BeCand | RA | Dec | V mag | EW(H) | V/R | Sp Type | Period | BeXB? |
|---|---|---|---|---|---|---|---|---|
| (J2000) | (J2000) | MCPS | (Å) | (days) | ||||
| 1 | 04 55 46.34 | -69 57 18.8 | 14.47 | 0.997 | B1 IIIe | 76 2 | yes | |
| 2a | 05 00 46.05 | -70 44 36.0 | 14.73 | - | O9 Ve | 30.7 0.5, 442 58 | yes | |
| 3 | 05 07 22.15 | -68 47 59.2 | 15.79 | 1.230 | B3 IIIe | 5.27 0.02 | yes | |
| 4b | 05 07 55.35 | -68 25 05.1 | 14.96 | - | - | OB | 262 46 | yes |
| 6c | 05 13 28.28 | -65 47 18.4 | 15.10 | - | B0-B1 Ve | 27.4 0.4 | yes | |
| 7 | 05 20 49.11 | -69 19 30.1 | 15.178 | - | - | 440 43 | ? | |
| 8d | 05 24 17.14 | -69 25 33.7 | 15.962 | - | - | 32.7 0.4, 547 190 | ? | |
| 9 | 05 25 46.46 | -69 44 50.9 | 16.39 | - | - | - | Variability | ? |
| 10 | 05 28 58.38 | -67 09 46.4 | 15.04 | 0.952 | B0-B0.5 Ve | 193 48 | yes | |
| 11 | 05 30 10.89 | -69 47 55.8 | 16.07 | 1.086 | B2-B3 IIIe | - | yes | |
| 12 | 05 30 11.32 | -65 51 23.9 | 14.88 | - | B1-B3 IIIe-Ve | 74 2 | yes | |
| 13 | 05 30 45.42 | -70 40 35.7 | 15.58 | - | B0.5-B1 Ve | 280 44 | yes | |
| 14e | 05 30 59.27 | -68 32 53.4 | 15.91 | - | - | - | None | no |
| 15f | 05 31 08.33 | -69 09 23.5 | 13.70 | 0.365 | B0 IIIe | Variability | yes | |
| 16g | 05 33 20.87 | -68 41 22.6 | 12.68 | - | - | B0.5 Ib | Variability | yes |
| 17 | 05 33 28.23 | -67 48 45.9 | 14.82 | - | Earlier B0.5 IIIe | 560 87 | yes | |
| 18h | 05 25 50.70 | -69 27 29.9 | 15.12 | - | B2 IVe-Ve | None | no | |
| 19 | 05 40 45.48 | -69 14 52.70 | 15.98 | 0.740 | B1-B3 IIIe-Ve | Variability | yes | |
| 20 | 05 41 34.18 | -68 25 48.5 | 14.04 | - | B0-B1 IIIe | 31.5 0.4 | yes |
-
•
The coordinates for the optical counterparts are from Table 1 listed in the 2MASS column.
-
•
A indicate a measurement that could not be made, either due to the absence or the quality of the data. In the case of the V/R column, V/R measurements could only be taken for double peaked H emission lines.
-
a
BeCand-2: Classified as BeXB (Vasilopoulos et al., 2016).
-
b
BeCand-4: OB spectral class determined from photometry, and classified as BeXB (Maggi et al., 2013).
-
c
BeCand-6: Classified as BeXB (Coe et al., 2015).
-
d
BeCand-8: The H emission does not originate from a decretion disc around the central star, but is from a surrounding nebula.
-
e
BeCand-14: The H spectrum was taken in a follow-up campaign with SALT on 30 October 2017.
-
f
BeCand-15: Vasilopoulos et al. (2017) classified the optical companion as a B0 II-Ibe star.
-
g
BeCand-16: Spectral class determined by Vasilopoulos et al. (2017). Possible infilling of the H line, however the spectrum does not have sufficient SNR to measure a accurate EW.
-
h
BeCand-18: The quoted EW includes only the broad component of the H emission profile.
3.2 SAAO 1.9 m blue spectra
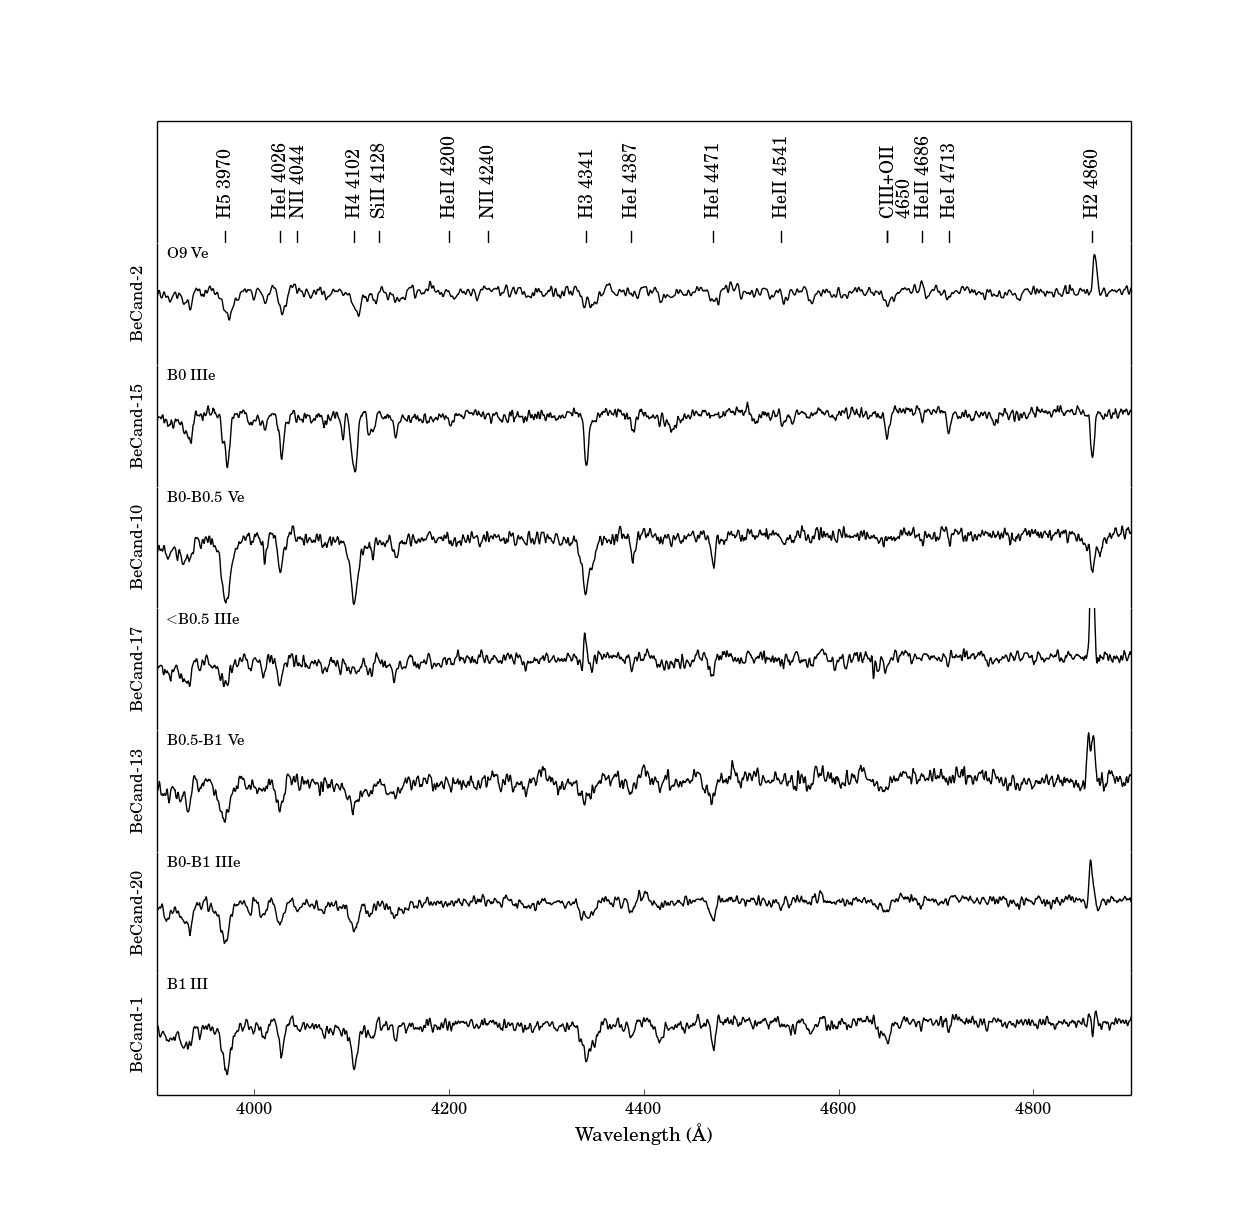
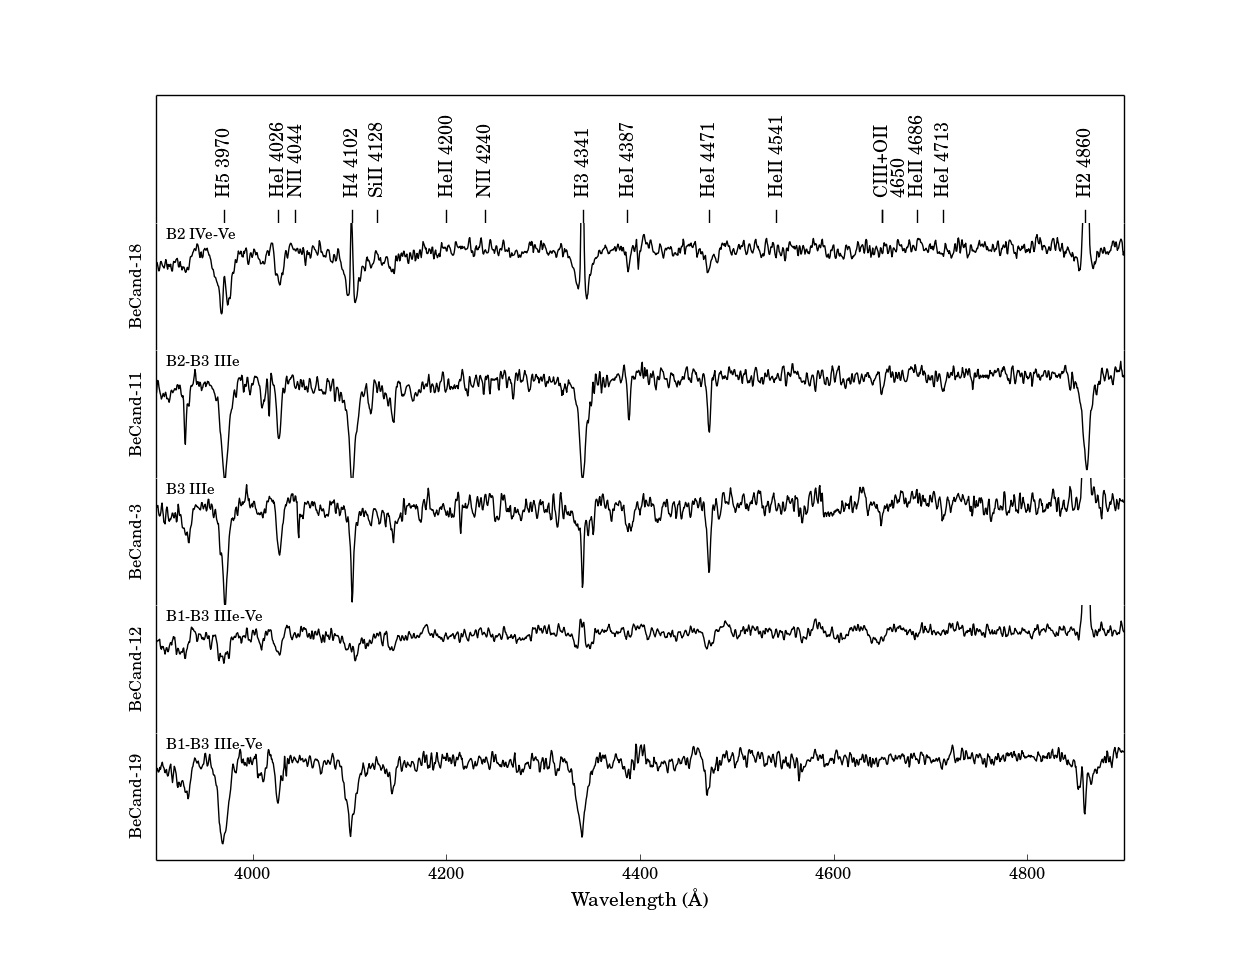
The LMC has a lower metallicity than that of the Milky Way (MW), but higher than that of the SMC, hence the spectral behaviour will not necessarily be the same as either the SMC or MW, however Negueruela & Coe (2002) and McBride et al. (2008) have shown independently that the spectral type distributions of the LMC and SMC BeXBs are consistent with that of the Milky Way BeXBs. To determine the spectral class of the candidates we considered spectral classification of massive O and B stars in the SMC, LMC and the MW. We compared the spectra by eye, using the digital MW spectral atlas provided by Walborn & Fitzpatrick (1990), the criteria identified by Evans et al. (2004) for the SMC, as well as the spectral atlas of the 30 Doradus region in the LMC by Walborn et al. (2014), and the criteria provided by Evans et al. (2015) for the north-eastern region of the LMC. We found that the results were relatively consistent with one another. The distance modulus resulting from the spectral and luminosity classifications was compared to the distance modulus of the LMC (18.48; Walker 2012) using the absolute magnitudes from Zombeck (1990), and direction dependent extinction values from Haschke et al. (2011). Table 3 lists the identified spectral classes, while Figures 3 and 4 shows the spectra grouped by spectral class.
3.3 Timing Analysis
The timing analysis described here is based on the method applied to SMC BeXBs by Bird et al. (2012). The OGLE light curves were detrended with a 51 and 101 day running average routine, acting as a high pass filter to increase the sensitivity of the Lomb-Scargle periodogram at shorter periods. The Lomb-Scargle periodograms of both the raw and detrended light curves were calculated by (van der Plas et al., 2015), a Python based Lomb-Scargle program. Furthermore, the 3 significance levels of the power spectra were determined by running a Monte Carlo simulation with 10 000 iterations, using the raw and detrended light curves as inputs. The simulations were setup such that the time structure was preserved, but the intensities were randomised. Finally, significant aliases, harmonics and beat frequencies were calculated based on the sampling frequency and the annual sampling period to determine which significant peaks in the power spectra were due to variability intrinsic to the source. The timing analysis results are summarised in Table 3.
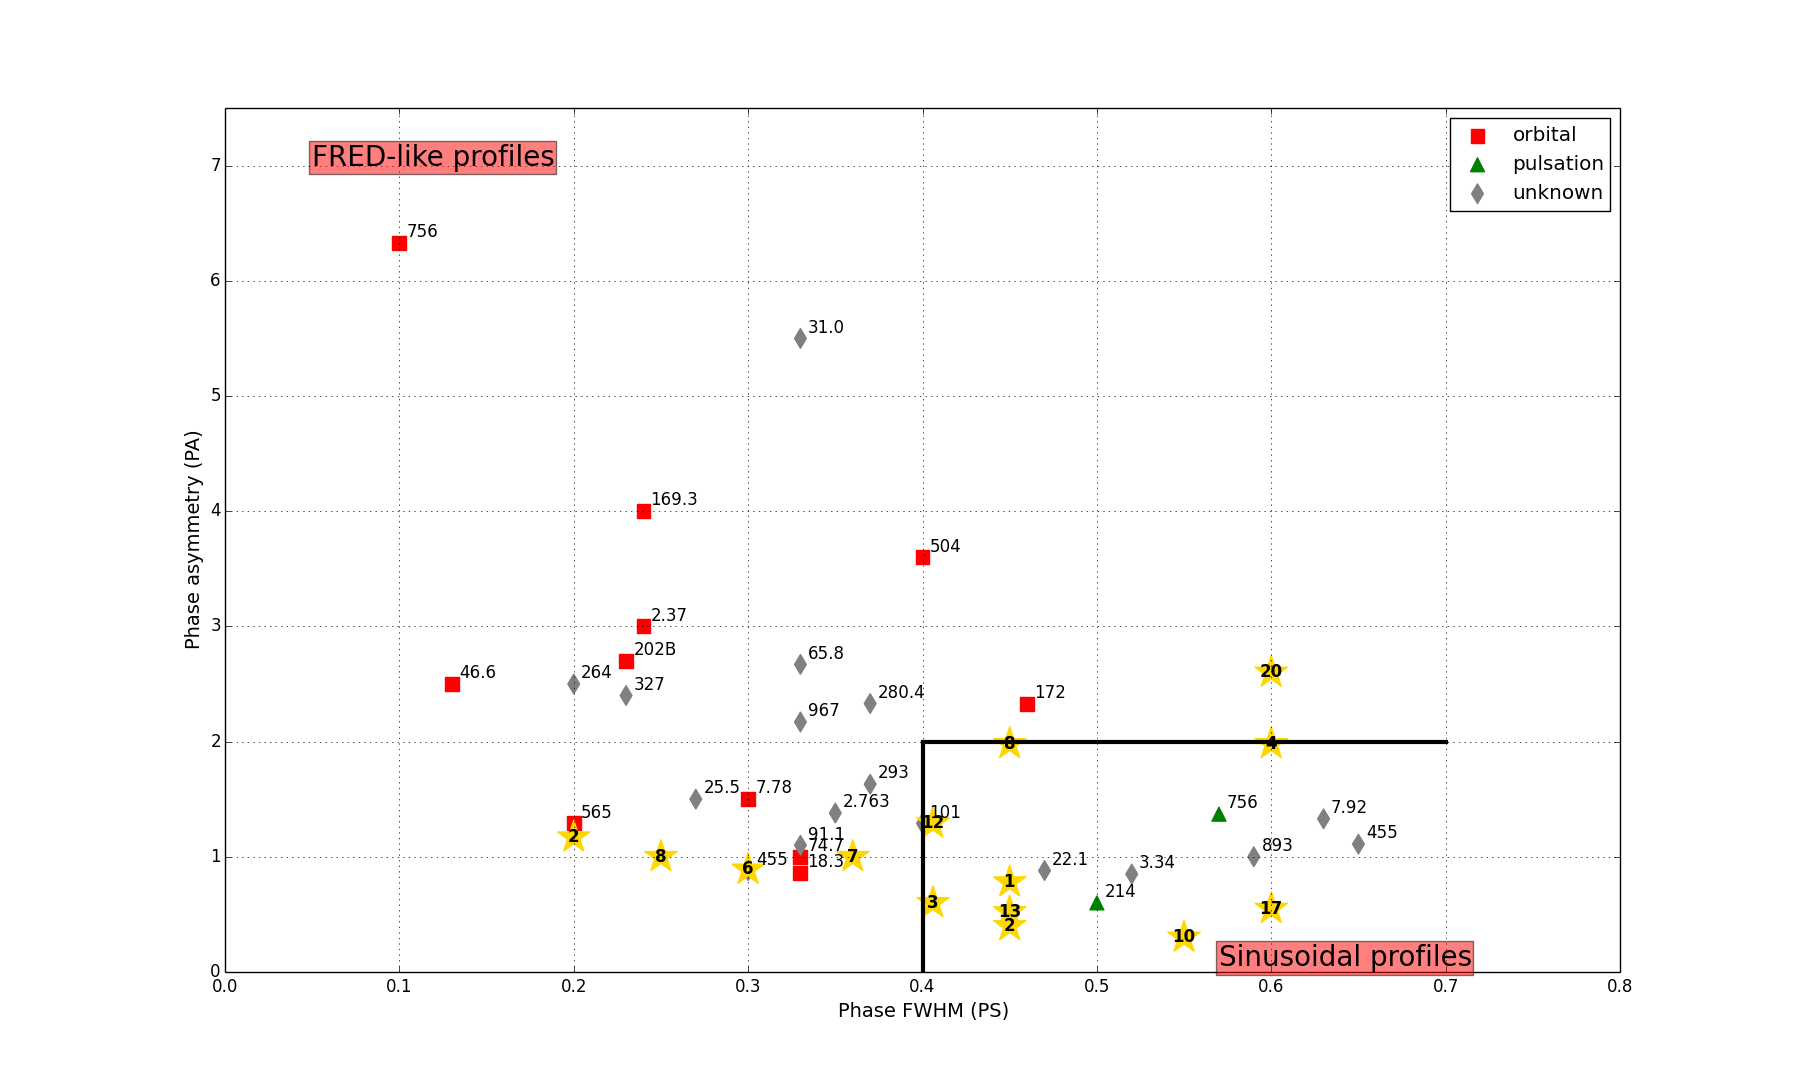
Bird et al. (2012) showed that non-radial pulsations (NRPs) of less than a day can beat with the daily sampling period, resulting in significant longer periods (> 10 days) in the power spectra. It is possible to distinguish between aliased NRPs and orbital modulations by considering two metrics from the shape of the phase folded light curves. Since perturbations associated with orbital modulation are caused by the neutron star’s interaction with the decretion disc, they result in a fast rise and exponential decay (FRED) phase folded light curve. Aliased NRPs, on the other hand, are associated with a more sinusoidal phase folded light curve. The metrics are the phase FWHM (PS), and the phase asymmetry (PA). The PA was given by the fraction of the phase length calculated from the difference between the peak and 10% of the peak value on the left and right hand side of the phase folded light curve (See Table 4). Bird et al. (2012) found that orbital modulation and the aliased NRPs occupy distinct regions in the PA-PS plane (Figure 6). From this we conclude that BeCand-2,6,7,8 and 20 exhibit orbital modulation, while the remaining periodicities appear to be associated with aliased NRPs, except BeCand-1’s light curve which showed a clear 76 2 d modulation with a sinusoidal phase folded light curve.
| BeCand | Period | PS (FWHM) | PA | Type |
|---|---|---|---|---|
| 1 | 76 2 | 0.45 | 0.78 | Sinusoidal |
| 2 | 30.7 0.5 | 0.20 | 1.17 | FRED |
| - | 442 58 | 0.45 | 0.40 | Sinusoidal |
| 3 | 5.27 0.02 | 0.40 | 0.60 | ? |
| 4 | 262 46 | 0.60 | 2.00 | ? |
| 6 | 27.4 0.4 | 0.30 | 0.89 | FRED |
| 7 | 440 43 | 0.35 | 1.00 | FRED |
| 8 | 32.7 0.4 | 0.45 | 2.00 | ? |
| - | 547 190 | 0.25 | 1.00 | FRED |
| 10 | 193 48 | 0.55 | 0.30 | Sinusoidal |
| 12 | 74 2 | 0.40 | 1.29 | ? |
| 13 | 280 44 | 0.45 | 0.45 | Sinusoidal |
| 17 | 560 87 | 0.60 | 0.55 | Sinusoidal |
| 20 | 31.5 0.4 | 0.60 | 2.60 | FRED |
-
•
The ′′?′′ indicates the periods for which the phase folded light curve metrics were located on the periphery of the FRED and Sinusoidal regions of Figure 6.
4 Discussion
From the XMM-Newton survey 19 X-ray sources were identified as potential HMXBs based on their hardness ratio’s and the association with an early type star. In Table 3 we present the spectral properties and timing results of 18 of the optical counterparts that are coincident with the X-ray sources, as well as BeCand-18, which was identified as a likely chance coincidence.
4.1 New BeXBs
We classify 9 of the optical candidates as Be stars with spectral types B3 and earlier, with variable and periodic OGLE light curves. We confirm these 9 sources as new BeXBs, increasing the LMC’s BeXB population to 26, moreover increasing the HMXB population of the LMC by 50%.
4.2 Known XMM BeXBs
BeCand-2 was detected previously with INTEGRAL (IGR J050077047, LXP 38.55) and confirmed as a BeXB with a 38.55 s X-ray pulsar, and a orbital period of 30.776 0.005 d (Vasilopoulos et al., 2016), with a B2 IIIe companion (Masetti et al., 2006). Our OGLE analysis yielded a consistent orbital period of 30.8 0.5 d, although the blue optical spectrum had a HeII absorption line at 4200 Å, which is consistent with a O9e V star.
Early on in the XXM survey BeCand-4 (LXP 169) was classified as a BeXB based on its X-ray pulse period of 168.8 s, as well as long term X-ray variations, and -band OGLE III-IV light curves. Maggi et al. (2013) interpreted the rapid decrease in brightness, appearing at all epochs separated by period of 24.328 d, as a binary transit observed at a high inclination angle. Our Lomb-Scargle analysis revealed a significant period associated with a likely aliased NRP at 262 46 d (See Figure 6).
Swift observed BeCand-6 (Swift J0513.46547, LXP 27.2) in April 2009, and was later classified by Coe et al. (2015) as a BeXB with a 27.2 s pulse period, and a -band OGLE IV orbital period of 27.405 0.008 d, with B1 Ve companion. We determined a orbital period of 27.4 0.4 d from -band OGLE IV light curve, which is consistent with the previous study. In addition we classified the companion star as a B0e-B1 Ve star, also consistent with the previous analysis.
Vasilopoulos et al. (2017) confirmed BeCand-15 (XMMU J053108.3-690923) as a HMXB belonging to the SGXB group, with a B0 II-Ibe optical companion and an X-ray spin period of 2013 s. However, in this work we have classified the companion of BeCand-15 as a B0 IIIe star. This discrepancy is likely due to the lower S/N ratio of the blue spectrum which we used for our classification. BeCand-16 (XMMU J053320.8-684122) was also classified as a SGXB with a B0.5 Ibe companion by Vasilopoulos et al. (2017), with fast flaring X-ray behaviour.
4.3 Published XMM pulsars
X-ray pulsations with a period of 272 s (Haberl et al., 2003) was detected for BeCand-12 (XMMU J053011.2655122). From our study we confirm BeCand-12 as a BeXB with a significant period around 74 2 d, with a B1-B3 III-Ve companion.
Shtykovskiy & Gilfanov (2005) identified BeCand-20 (XMMU J054134.7682550) as a likely HMXB based on its X-ray properties. Subsequently Manousakis et al. (2009) observed BeCand-20 in a flaring state and found a 61.601 0.017 s X-ray pulsation with RXTE. We confirm BeCand-20 as a BeXB with a 31.5 0.4 d orbital period, and a B0-B1 IIIe optical companion.
4.4 Unconfirmed candidates
The nature of 3 of the candidates (BeCand-7, 8, 9) remains unresolved, and require additional optical spectroscopic follow up. BeCand-7 showed definite infilling of the H line with a EW of 0.7 0.2, and exhibited an orbital period of 440 43 d, however we did not obtain blue-end spectra due to unfavourable weather conditions. As a result BeCand-7 is likely a Be star based on the data in hand, but the definite spectral type is unknown. From Figure 2 we observe a narrow H line for BeCand-8, consistent with diffuse interstellar emission, not necessarily intrinsic to the source, and with a orbital period of 547 190 d. The H spectrum of BeCand-9 was too faint to extract reliably, however the OGLE IV light curve showed some variability. A second epoch of H observations will be necessary to determine if these candidates are emission line stars. In addition to the H spectra, blue-end spectra are still required to make a reliable spectral classification. Due to insufficient optical spectroscopy the nature of the optical counterparts remain uncertain for BeCand-7, 8 and 9, however these optical counterparts are coincident with X-ray emission, and in the case for BeCand-7, 8 and 9 were detected multiple times in the XMM data.
4.5 Non-HMXB systems
With no H emission and no variability observed in the OGLE IV light curve, BeCand-14 is likely not at BeXB, while BeCand-18 is peculiar amongst our sample as the H profile has both broad and narrow components. The narrow component originates from a resolved nebula around 10″ in diameter. The emission line ratios of log(H/[N II])=0.9 and log(H/[S II])=0.6 are consistent with extragalactic HII regions (Frew & Parker, 2010). Imaging at mid-infrared wavelengths with Spitzer is also consistent with the nebula being an HII region (Meixner et al., 2006). The broad H component from the B2e IV-V central star suggests a Be star is the ionising source of the HII region. An O-type emission line classification (e.g. Walborn et al. 2014) cannot be associated with the broad H emission given the B2e IV-V classification.
5 Conclusions
Eighteen of the XMM X-ray sources were coincident with optical counterparts, of which 3 (BeCand-2, 4 ,6) have been classified as BeXBs, and 2 (BeCand-15, 16) as SGXB in previous work, while the nature of 3 candidates (BeCand-7,8,9) are still uncertain. The 9 remaining candidates we classify as new BeXBs (see Table 3), raising the population of BeXBs in the LMC to 26, and subsequently the number of HMXBs in the LMC to 32. Moreover, as expected all the BeXBs have spectral classes of B3 and earlier, as well as variable OGLE light curves.
Acknowledgements
The XMM-Newton project is supported by the Bundesministerium für Wirtschaft und Technologie/Deutsches Zentrum für Luft- und Raumfahrt (BMWI/DLR, FKZ 50 OX 0001) and the Max-Planck Society. GV acknowledges support from the BMWI/DLR grant FKZ 50 OR 1208. DAHB and VM acknowledges support of the National Research Foundation of South Africa (grants IFR2010042800093,98969 and 93405). This paper uses observations made at the South African Astronomical Observatory (SAAO) and with the Southern African Large Telescope. The OGLE project has received funding from the National Science Centre, Poland, grant MAESTRO 2014/14/A/ST9/00121 to AU.
References
- Antoniou & Zezas (2016) Antoniou V., Zezas A., 2016, MNRAS, 44, 1
- Bird et al. (2012) Bird A. J., Coe M. J., McBride V. A., Udalski A., 2012, MNRAS, 423, 3663
- Buckley et al. (2006) Buckley D. A. H., Swart G. P., Meiring J. G., 2006, in Stepp L. M., ed., Vol. 6267, SPIE. International Society for Optics and Photonics, p. 62670Z
- Burgh et al. (2003) Burgh E. B., Nordsieck K. H., Kobulnicky H. A., Williams T. B., O’Donoghue D., Smith M. P., Percival J. W., 2003, in Iye M., Moorwood A. F. M., eds, Vol. 4841, SPIE. International Society for Optics and Photonics, p. 1463
- Coe et al. (2005) Coe M. J., Edge W. R. T., Galache J. L., McBride V. A., 2005, MNRAS, 356, 502
- Coe et al. (2015) Coe M. J., Finger M., Bartlett E. S., Udalski A., 2015, MNRAS, 447
- Cole et al. (2005) Cole A. A., Tolstoy E., Gallagher III J. S., Smecker-Hane T. A., 2005, AJ, 129, 1465
- Crause et al. (2016) Crause L. A. et al., 2016, in Evans C. J., Simard L., Takami H., eds, Vol. 9908, SPIE. p. 990827
- Crawford et al. (2010) Crawford S. M. et al., 2010. International Society for Optics and Photonics, p. 773725
- Dray (2006) Dray L. M., 2006, MNRAS, 370, 2079
- Evans et al. (2004) Evans C. J., Howarth I. D., Irwin M. J., Burnley A. W., Harries T. J., 2004, MNRAS, 353, 601
- Evans et al. (2015) Evans C. J., van Loon J. T., Hainich R., Bailey M., 2015, A&A, 584, A5
- Frew & Parker (2010) Frew D. J., Parker Q. A., 2010, PASA, 27, 129
- Grimm et al. (2003) Grimm H.-J., Gilfanov M., Sunyaev R., 2003, MNRAS, 339, 793
- Haberl et al. (2003) Haberl F., Dennerl K., Pietsch W., 2003, A&A, 406, 471
- Haberl & Sturm (2016) Haberl F., Sturm R., 2016, A&A, 586
- Haschke et al. (2011) Haschke R., Grebel E. K., Duffau S., 2011, AJ, 141, 158
- Jansen et al. (2001) Jansen F. et al., 2001, A&A, 365, 1
- Krimm et al. (2009) Krimm H. A. et al., 2009, ATel, 2011
- Liu et al. (2005) Liu Q. Z., van Paradijs J., van den Heuvel E. P. J., 2005, A&A, 442, 1135
- Luck et al. (1998) Luck R. E., Moffett T. J., Barnes III T. G., Gieren W. P., 1998, AJ, 115, 605
- McBride et al. (2008) McBride V. A., Coe M. J., Negueruela I., Schurch M. P. E., McGowan K. E., 2008, MNRAS, 388, 1198
- Maggi et al. (2016) Maggi P. et al., 2016, A&A, 585, A162
- Maggi et al. (2013) Maggi P., Haberl F., Sturm R., Pietsch W., Rau A., Greiner J., Udalski A., Sasaki M., 2013, A&A, 554
- Manousakis et al. (2009) Manousakis A., Walter R., Audard M., Lanz T., 2009, A&A, 498, 217
- Masetti et al. (2006) Masetti N. et al., 2006, A&A, 459, 21
- Meixner et al. (2006) Meixner M. et al., 2006, AJ, 132, 2268
- Negueruela & Coe (2002) Negueruela I., Coe M. J., 2002, A&A, 385, 517
- Porter & Rivinius (2003) Porter J., Rivinius T., 2003, PASP, 115, 1153
- Rivinius et al. (2013) Rivinius T., Carciofi A. C., Martayan C., 2013, A&A, 21
- Shtykovskiy & Gilfanov (2005) Shtykovskiy P., Gilfanov M., 2005, A&A, 431, 597
- Skrutskie et al. (2006) Skrutskie M. F. et al., 2006, AJ, 131, 1163
- Strüder et al. (2001) Strüder L. et al., 2001, A&A, 365, 18
- Sturm et al. (2013) Sturm R. et al., 2013, A&A, 558, A3
- Turner et al. (2001) Turner M. J. L. et al., 2001, A&A, 365, L27
- Udalski et al. (2015) Udalski A., Szymański M. K., Szymański G., 2015, Acta Astronom., 65, 1
- van der Plas et al. (2015) van der Plas G., van den Ancker M. E., Waters L. B. F. M., Dominik C., 2015, A&A, 574, A75
- van Dokkum (2001) van Dokkum P. G., 2001, PASP, 113, 1420
- Vasilopoulos et al. (2016) Vasilopoulos G., Haberl F., Delvaux C., Sturm R., Udalski A., 2016, MNRAS, 461, 1875
- Vasilopoulos et al. (2017) Vasilopoulos G., Maitra C., Haberl F., Hatzidimitriou D., Petropooulou M., 2017, MNRAS
- Walborn & Fitzpatrick (1990) Walborn N. R., Fitzpatrick . L., 1990, PASP, 102, 379
- Walborn et al. (2014) Walborn N. R. et al., 2014, A&A, 564, A40
- Walker (2012) Walker A. R., 2012, Ap&SS, 341, 43
- Walter et al. (2015) Walter R., Lutovinov A. A., Bozzo E., Tsygankov S. S., 2015, A&A Rev., 23, 2
- Zaritsky et al. (2004) Zaritsky D., Harris J., Thompson I. B., Grebel E. K., 2004, AJ, 128, 1606
- Zombeck (1990) Zombeck M., 1990, Handbook of Space Astronomy and Astrophysics. UK: Cambridge University Press