Crystalline phases in Zr9Ni11 and Hf9Ni11 intermetallics; Investigations by perturbed angular correlation spectroscopy and ab initio calculations
Abstract
Crystalline phases formed in stoichiometric Zr9Ni11 and Hf9Ni11 have been studied by perturbed angular correlation (PAC) spectroscopy, XRD and TEM/SAED measurements. In Zr9Ni11, the phases Zr9Ni11 (89%) and Zr8Ni21 (11%) have been found at room temperature from PAC measurements. At 773 K, Zr9Ni11 partially decomposes to Zr7Ni10 and at 973 K, it is completely decomposed to ZrNi and Zr7Ni10. In Hf9Ni11, a predominant phase (81%) due to HfNi is found at room temperature while the phase Hf9Ni11 is produced as a minor phase (19%). No compositional phase change at higher temperature is found in Hf9Ni11. Phase components found from XRD and TEM/SAED measurements are similar to those observed from PAC measurements. Electric field gradients in Zr9Ni11 and Hf9Ni11 have been calculated by density functional theory (DFT) using all electron full potential (linearized) augmented plane wave plus local orbitals [FP-(L)APW+lo] method in order to assign the phase components.
keywords:
A. Intermetallics; B. Hydrogen absorbing materials; C. Perturbed angular correlation; D. Phase stability; E. Site occupancy; F. Density functional theory1 Introduction
The Zr-Ni intermetallic compounds are widely used to synthesize advanced materials [1, 2, 3, 4]. The compounds Zr8Ni21, Zr7Ni10, Zr9Ni11 and ZrNi are, particularly, important due to their potential application as gaseous hydrogen storage materials. The electrochemical properties of these compounds were extensively studied earlier [5, 6, 8, 7]. These alloys absorb gaseous hydrogen in their interstitial sites to form nickel metal hydrides (NiMH). These metal hydrides are used as negative electrode in NiMH rechargeable batteries. It was found that the hydrogen absorption/desorption properties of many Laves phase and quaternary/ternary hydriding alloys are improved due to the presence of non-Laves Zr-Ni binary alloys [9, 10, 11, 13, 12, 14]. The NiMH batteries have high energy density compared to nickel-cadmium batteries and are more environmentally friendly. Recently, hydrogen absorption/desorption properties in ZrNi alloy were investigated [14] by partial substitution of Zr with Ti for different Ti concentration. Also, in case of Zr9Ni11, unusual magnetic properties were reported by Provenzano et al. [15]. Its crystal structure is known to be body-centered tetragonal with space group [16, 17, 18, 19, 14, 8, 21, 20] which is reported to be isostructural to Zr9Pt11 [23, 18, 22]. The lattice parameters of Zr9Ni11 were found to be = 9.88(1) and = 6.61(1) [16]. The Hf9Ni11 was found to be isostructural to Zr9Ni11, with the lattice parameters = 9.79 and = 6.53 [17, 24, 25].
The phase diagram of Zr-Ni system [17, 20, 26, 21, 27] shows at least eight binary compounds. From a recent study [28], all these phases were found through the interdiffusion process by annealing the Zr-Ni interface zone at different temperatures. It is found that the phases Zr2Ni7, Zr2Ni, and ZrNi melt congruently while Zr8Ni21, Zr9Ni11, Zr7Ni10, and ZrNi5 phases form peritectically. The phase ZrNi3 forms by peritectoid reaction. The room temperature formation of these phases are due to nucleation by rapid quenching from the liquid alloy [26, 14]. Stalick et al. [29] found that the Zr9Ni11 sample, prepared by argon arc melting, contained 10% of ZrNi and at 700 ∘C, it transformed to ZrNi (37%), Zr7Ni10 (57%) and Zr9Ni11 (7%). At 1000 ∘C, this sample reformed again to produce 90% Zr9Ni11 and 10% ZrNi. The compounds with Zr or Hf as a constituent element are very suitable for perturbed angular correlation (PAC) measurements using the probe 181Hf. Due to chemical similarity, the probe 181Hf occupies the Zr sites of the compound. Different Zr-Ni and Hf-Ni intermetallic compounds viz., (Zr/Hf)8Ni21 [30], (Zr/Hf)2Ni7 [31, 32], (Zr/Hf)Ni3 [33] were studied earlier by PAC technique. However, any report of PAC measurements in the (Zr/Hf)9Ni11 systems are not available in literature. The technological applications of Zr9Ni11 and absence of PAC measurements, promoted the study of Zr9Ni11 and Hf9Ni11 compounds to determine the electric field gradients (EFG) at the Ta impurity sites, obtained after radioactive decay of 181Hf and also the structural stability of the compounds. The measured EFG and asymmetry parameters can be directly compared to the calculated values obtained from first-principles density functional theory (DFT), which helps assigning the component phases produced in the sample.
The time-diffrential perturbed angular correlation (TDPAC), also called PAC, is a nuclear technique based on the interaction of electromagnetic moments (electric quadrupole or magnetic dipole) of a specific nuclear level with the electric field gradient or the magnetic field generated at the nuclear level by the surrounding environment of the nucleus. Electric field gradient strongly depends upon the lattice parameters and the crystal structure of the lattice. This technique is sensitive to the change of local field environment of the probe nucleus. Production of multiphase components can be identified by this technique from the observation of different quadrupole frequencies. In the present report, phase stability and structural phase transformation in Zr9Ni11 and Hf9Ni11 have been studied by observing the temperature dependence of PAC parameters. Additionally, we have carried out X-ray diffraction (XRD) and transmission electron microscopy (TEM)/selected area electron diffraction (SAED) measurements to determine the phase components in these samples. Calculations of EFG and asymmetry parameter () at 181Ta impurity site have also been carried out in Zr9Ni11 and Hf9Ni11 to compare with the experimental results from PAC measurements and therefrom to assign these phases.
2 Experimental details
The intermetallic compounds Zr9Ni11 and Hf9Ni11 have been prepared in argon arc furnace using the stoichiometric amounts of constituent elements procured from Alfa Aesar. The purity of Zr (excluding Hf), Hf (excluding Zr) and Ni were 99.2%, 99.95% and 99.98%, respectively. The probe 181Hf was produced in Dhruba reactor, Mumbai by irradiating natural Hf metal (30% 180Hf) with thermal neutron for 7 days (flux 1013/cm2/s). For PAC measurements, this active Hf metal was added with 0.3 at% to the compounds and remelted in the arc furnace. It can be considered that addition of this very small impurity concentration will not affect stoichiometry of the samples and the sample properties. Separate inactive samples were produced in similar manners for structural characterization by XRD and TEM/SAED measurements. Barring in Hf9Ni11 PAC sample, no appreciable mass loss of other samples were found during arc melting. In all cases, shiny globule samples were formed. The X-ray diffraction measurements have been carried out using Rigaku X-ray diffractometer TTRAX-III and Cu Kα radiation. Transmission electron microscopy (TEM) measurements were carried out using FEI, Tecnai G2 F30, S-Twin microscope equipped with a high angle annular dark-field (HAADF) detector, a scanning unit and a energy dispersive X-ray spectroscopy (EDX) unit to perform the scanning transmission electron microscopy (STEM-HAADF-EDX).
The 181Hf probe is introduced into the investigated sample (Zr/Hf)9Ni11 which replaces Zr/Hf atoms in the matrix. This probe atom 181Hf decays to 181Ta ( = 42.4 d) and populates the 615 keV excited level of 181Ta. The daughter nucleus 181Ta comes to ground state through the successive gamma rays of 133 and 482 keV passing through the 482 keV intermediate level. The intermediate level has a half-life of 10.8 ns and a spin angular momentum = 5/2 [34]. Since the decay half life of 181Hf is 42.4 d, the PAC measurements are generally performed within 1-2 months of probe activation i.e. before the probe is decayed to a very low activity level. The extra-nuclear electric field gradient (EFG) present in the sample interacts with the quadrupole moment of the probe nucleus and perturbs the - angular correlation. Thus, through the PAC technique, the EFG in a sample is actually measured at the 181Ta impurity atom.
The perturbation function in a polycrystalline sample for I=5/2 is given by [35, 36]
| (1) |
The frequencies denote the transition frequencies between the -sublevels of the intermediate state. These sublevels become non-degenerate in energies due to hyperfine splitting. The damping in PAC spectrum is represented by (Lorentzian distribution) which arises due to lattice imperfections and chemical inhomogeneities of the sample. The three ’s in the perturbation function are related to , the maximum component of EFG in the principle axis system, through the quadrupole frequency given by
| (2) |
In the above Eqn. 2, represents the quadrupole moment of the intermediate level (2.36 b [37]). For an axially symmetric EFG (), the is related to , and by
| (3) |
The principal EFG components obey the relations
| (4) |
The EFG can therefore be designated by two parameters only viz. and . The asymmetry parameter is defined as
| (5) |
For 0, a more general relation between and ’s is found [36].
A slow-fast coincidence set up comprising two LaBr3(Ce) and two BaF2 detectors has been built to acquire data simultaneously at 180∘ and 90∘ in a coplanar arrangement. Crystal sizes were 3825.4 mm2 for LaBr3(Ce) and 50.850.8 mm2 for BaF2 scintillators. The low energy -rays (133 keV) of the probe nucleus were captured in LaBr3(Ce) detectors. A typical prompt time resolution of 800 ps has been observed for the LaBr3(Ce)-BaF2 detector combination selecting the 133-482 keV -rays of 181Hf. The perturbation function is obtained from the four coincidence spectra taken at 180∘ and 90∘ [38].
| Temperature (K) | Component | (Mrad/s) | () | () | Assignment | |
|---|---|---|---|---|---|---|
| 77 | 1 | 41(1) | 0.80(10) | 17(3) | 84(3) | Zr9Ni11 |
| 2 | 76.8(8) | 0.53(3) | 0 | 16(3) | Zr8Ni21 | |
| 298 | 1 | 39.2(5) | 0.64(3) | 15(2) | 89(3) | Zr9Ni11 |
| 2 | 77.5(7) | 0.52(2) | 0 | 11(3) | Zr8Ni21 | |
| 373 | 1 | 39.0(8) | 0.74(5) | 12(3) | 80(3) | Zr9Ni11 |
| 2 | 76.8(7) | 0.51(2) | 0 | 20(3) | Zr8Ni21 | |
| 473 | 1 | 39.4(8) | 0.59(3) | 17(3) | 85(3) | Zr9Ni11 |
| 2 | 75.5(7) | 0.58(3) | 0 | 15(3) | Zr8Ni21 | |
| 573 | 1 | 39.9(5) | 0.58(2) | 12(2) | 82(3) | Zr9Ni11 |
| 2 | 75.9(5) | 0.57(2) | 0 | 18(3) | Zr8Ni21 | |
| 673 | 1 | 37.5(5) | 0.57(3) | 12(2) | 81(3) | Zr9Ni11 |
| 2 | 75.3(6) | 0.51(2) | 0 | 19(3) | Zr8Ni21 | |
| 773 | 1 | 38.4(4) | 0.48(3) | 2(1) | 45(3) | Zr9Ni11 |
| 2 | 73.3(8) | 0.61(3) | 0 | 20(3) | Zr8Ni21 | |
| 3 | 45.8(8) | 0.57(6) | 0 | 27(3) | Zr7Ni10 | |
| 3 | 99(2) | 0 | 0 | 7(3) | ||
| 873 | 1 | 38.5(7) | 0.38(4) | 8(4) | 54(3) | Zr9Ni11 |
| 2 | 76.8(8) | 0.66(2) | 0 | 18(3) | Zr8Ni21 | |
| 3 | 46.0(9) | 0.60(8) | 0 | 16(3) | Zr7Ni10 | |
| 4 | 96(1) | 0 | 0 | 11(3) | ||
| 973 | 1 | 17.9(6) | 0.36(4) | 0 | 55(3) | ZrNi |
| 2 | 38.2(4) | 0.52(5) | 0 | 32(3) | Zr9Ni11 | |
| 3 | 45(1) | 0.72(12) | 0 | 13(3) | Zr7Ni10 | |
| 298a | 1 | 26.2(6) | 0.40(3) | 8(2) | 63(3) | ZrNi |
| 2 | 74.2(4) | 0 | 0 | 17(3) | ZrNi3 | |
| 3 | 77(1) | 0.68(4) | 0 | 11(3) | Zr8Ni21 | |
| 4 | 62(1) | 0.60(8) | 0 | 9(3) | Zr7Ni10 |
a after measurement at 973 K

3 Results and discussion
3.1 Zr9Ni11
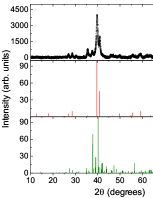
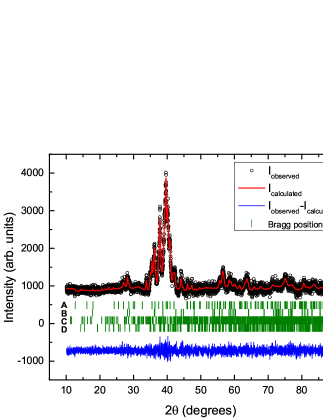
The XRD powder pattern in Zr9Ni11 is shown in Fig. 1. The peaks were identified (Fig. 1) using ICDD database, 2009. Presence of tetragonal Zr9Ni11 [PDF Card No.: 00-033-0963] and orthorhombic Zr7Ni10 [PDF Card No.: 01-072-3501] phases have been found in the XRD spectrum. Analysis of the X-ray powder pattern (Fig. 1) was carried out by FullProf software package [39] using the known crystallographic data of Zr9Ni11 with space group [16] and Zr7Ni10 [40]. The presence of a minor phase Zr7Ni10 in the stoichiometric sample of Zr9Ni11 was also observed from x-ray diffraction measurements by Joubert et al. [8].
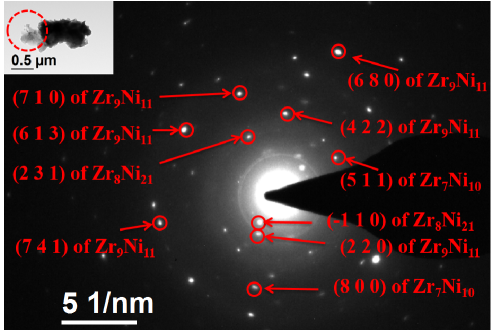
The presence of Zr9Ni11, Zr8Ni21 and Zr7Ni10 phases in this stoichiometric sample of Zr9Ni11 have been observed from TEM/SAED measurement (Fig. 2). The SAED pattern obtained from a region marked by a dotted circle in the stoichiometric sample of Zr9Ni11 is shown in Fig. 2. The interplanar spacing () is obtained by measuring the distance () of a particular spot from the central bright spot using the formula . Some of the measured from the SAED pattern are 1.39 Å, 1.30 Å, 1.21 Å, 3.45 Å, 0.99 Å and 1.84 Å. These measured interplanar spacings are very close to the (710), (613), (741), (220), (680) and (422) interplanar spacings of tetragonal Zr9Ni11 (JCPDS 33-0963), respectively. This further confirms the presence of Zr9Ni11 phase in the sample. Few of the measured from the SAED pattern are 2.29 Å and 4.34 Å which are very close to the (231) and (-110) interplanar spacings of triclinic Zr8Ni21 (ICDD PDF Card No.: 01-071-2622), respectively. The presence of Zr8Ni21 phase in the sample is thus confirmed. Some of the measured interplanar spacings from the SAED pattern, 2.32 Å and 1.55 Å, are found to be very close to the (511) and (800) interplanar spacings of orthorhombic Zr7Ni10 (ICDD PDF card No.:01-072-3501), respectively, which confirms the presence of Zr7Ni10 phase in the stoichiometric sample of Zr9Ni11.
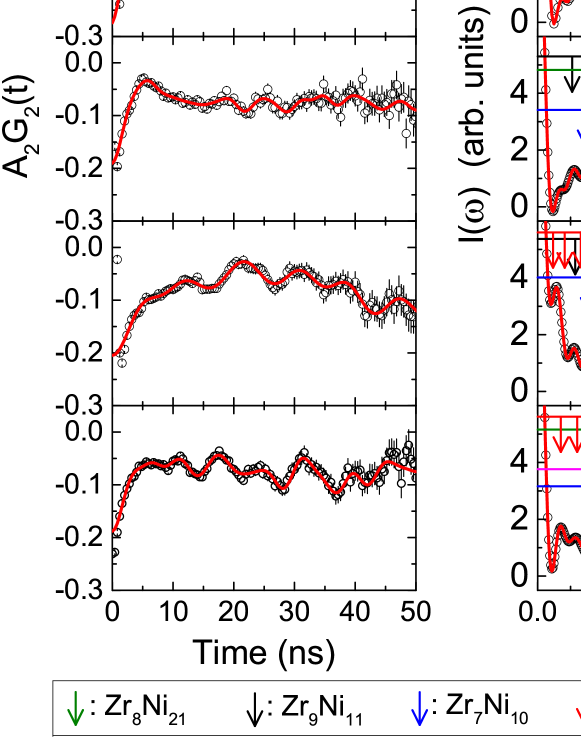
The PAC spectrum found at room temperature in the stoichiometric sample of Zr9Ni11 is shown in Fig. 3. The predominant component (89%) produces values of = 39.2(5) Mrad/s ( = 4.4(1)1021 V/m2), = 0.64(3) with a large frequency distribution width ( = 15%). Apart from this, a minor component is also observed (Table 1). The predominant component has been assigned to Zr9Ni11 by comparing the results with DFT calculations (discussed later). The minor component found can be attributed to Zr8Ni21 by comparing the values of and with the results from our recent investigation [30] for a particular crystallographic site in Zr8Ni21. It was found [20] that the phases Zr2Ni7, Zr2Ni and ZrNi melt congruently. The phase Zr8Ni21 was formed at 1453 K from the liquid by peritectic reaction L+Zr2NiZr8Ni21 [20]. Kirkpatrick and Larson [17] reported that the phase Zr9Ni11 was produced peritectically by the reaction L+ZrNiZr9Ni11 at 1443 K [20] and this phase was found to decompose eutectoidally Zr9Ni ZrNi+Zr7Ni10 at 1248 K [20]. In the process of arc-melting, the production of Zr9Ni11 phase at room temperature is due to rapid solidification from the liquid melt. To find any structural change in this compound or its phase stability with temperature, PAC measurements have been performed in the sample at high temperatures also (up to 973 K). The results show (Table 1) that up to 673 K, the phase due to Zr9Ni11 remains stable and the component fractions do not change appreciably. At 773 K, however, the sample compositions change. At this temperature, a new component (27%) appears at the expense of Zr9Ni11. This has been attributed to Zr7Ni10 by comparing with the previous PAC results in Zr7Ni10 [41]. Kosorukova et al. [21] reported that the phase Zr7Ni10 was produced by peritectic reaction L+Zr9Ni Zr7Ni10 at 1393 K. The component fraction due to Zr8Ni21 at 773 K, however, does not change. Another new component with a small fraction (Table 1) also appears which could not be assigned. At 873 K, the phase due to Zr9Ni11 slightly increases to 54% at the cost of Zr7Ni10 component. At a temperature of 973 K, the sample composition changes drastically. At this temperature, the predominant component (55%) is found to have = 17.9(6) Mrad/s, = 0.36(4), = 0 and this can be attributed to ZrNi by comparing the results found in ZrNi from previous PAC measurements [42]. At this temperature, the Zr8Ni21 phase vanishes and the Zr9Ni11 phase reduces to 32%. It was reported [17, 20] that the the phase ZrNi was formed by the decomposition of Zr9Ni11 phase eutectoidally at 1248 K. We have carried out a re-measurement in the sample at room temperature after the measurement at 973 K to find the change in sample composition before and after heating the sample. In the re-measurement, a new component (17%) with = 74.2(4) Mrad/s, = 0 is found. This new component can be attributed to ZrNi3 by comparing the results reported from our recent PAC investigations in ZrNi3 [33]. It is known that ZrNi3 was formed by the peritectoid reaction (Zr2Ni7+Zr8NiZrNi3) at 1193 K [20] and at 1261 K [21]. The predominant phase due to ZrNi (63%) is found to be produced here which was first observed at 973 K in the sample. Appearance of ZrNi as a secondary phase in the synthesized Zr9Ni11 alloy was also found earlier [29, 8, 19, 9]. The remaining phases in the sample can be identified as Zr8Ni21 (11%) and Zr7Ni10 (9%). Interestingly, no phase due to Zr9Ni11 is found here and the sample is transformed completely.
The Zr9Ni11 compound was studied by Stalick et al. [29] earlier using transmission electron microscopy and powder neutron diffraction in the temperature range 4-1273 K. At room temperature, these authors reported a mass fraction of 90% Zr9Ni11 and 10% ZrNi in Zr9Ni11. From present PAC measurements, however, no ZrNi phase is found at lower temperatures (below 873 K). The ZrNi phase is found only at 973 K. Stalick et al. [29] reported a sharp enhancement of this phase at 973 K and the production of a new phase of Zr7Ni10. The phase fractions were reported to be 37% ZrNi, 57% Zr7Ni10 and 7% Zr9Ni11 at 973 K [29]. We have also found phase components of ZrNi, Zr7Ni10 and Zr9Ni11 at 973 K although the phase fractions are found to be different (Table 1). An agreement between the results of Stalick et al. [29] and present results at high temperature are thus observed. Stalick et al. [29] found also a phase reformation at 1273 K where the sample was again 90% Zr9Ni11 and 10% ZrNi. Production of Zr7Ni10 and ZrNi can also be explained from the Zr-Ni phase diagram due to their proximity to Zr9Ni11 phase and very small homogeneity range of this phase [16, 17, 20, 8].
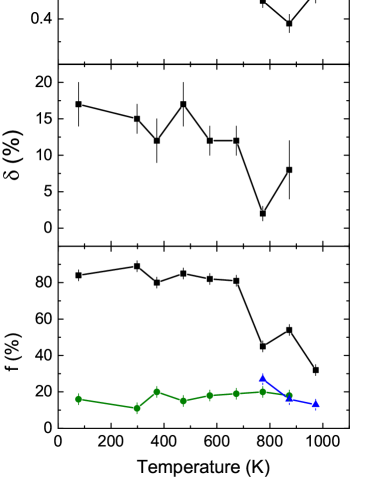
The variations of , , and phase fraction () with temperature for the Zr9Ni11, Zr8Ni21 and Zr7Ni10 phases are shown in Fig. 4. A very weak temperature dependence of quadrupole frequency for the Zr9Ni11 phase is found in this compound. Values of for the Zr9Ni11 phase shows a linear variation with temperature and it is fitted using the following relation
| (6) |
The fitted results are found to be (0) = 40.5(5) Mrad/s ( = 4.5(1)1021 V/m2) and = 0.7(2)10-4 K-1. The quadrupole frequency for the Zr8Ni21 phase follows temperature dependence given by the following formula
| (7) |
The fitting produces values of = 77.1(8) Mrad/s ( = 8.6(2)1021 V/m2) and = 1.2(6) 10-6 K-3/2. In our recent PAC investigation in Zr8Ni21 [30], similar temperature dependence was found.
Temperature evolution of electric quadrupole frequency in metals and intermetallic compounds following a and relation are generally found in literature [43, 35]. In most cases, the EFG decreases with temperature. The coefficient depends on crystal structure and the lattice parameters. A very weak temperature dependence of EFG in Zr9Ni11, probably, indicates that lattice parameters or lattice volume does not change much with temperature.
To closely examine the phase transitions, a remeasurement of X-ray powder diffraction pattern (Fig. 5) has been carried out after heating the sample for two days at 1073 K. Peaks in the XRD spectrum were identified (Fig. 5) using ICDD database, 2009. It is found (Fig. 5) from XRD analysis using FullProf software [39] that the sample after heating gives the phase components Zr9Ni11 ([29], PDF Card No.: 00-033-0963), ZrNi ([44], PDF Card No.: 01-072-6477), Zr8Ni21 ([45], PDF Card No.: 01-071-2622) and Zr7Ni10 ([40], PDF Card No.: 01-072-3501) as the constituent phase fractions. The phase transformation of Zr9Ni11 found at 973 K to ZrNi, therefore, can be supported from XRD measurements also. However, from PAC measurement, no phase due to Zr9Ni11 has been found at remeasured room temperature (Table 1). Possibly, in this case, the phase Zr9Ni11 is completely transformed to ZrNi due to prolonged heating at successive higher temperatures upto 973 K.
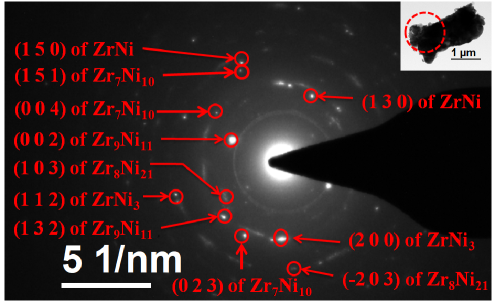
The presence of Zr9Ni11, ZrNi, Zr8Ni21, ZrNi3 and Zr7Ni10 phases in this stoichiometric sample of Zr9Ni11 after annealing the sample at 1073 K for 2 days have been observed from TEM/SAED measurement (Fig. 6). The SAED pattern obtained from a region marked by a dotted circle in the stoichiometric sample of Zr9Ni11 is shown in Fig. 6. Some of the measured interplanar spacings () from the SAED pattern are 3.32 Å and 2.27 Å. These measured are very close to the (002) and (132) interplanar spacings of tetragonal Zr9Ni11 (JCPDS 33-0963), respectively. This further confirms the presence of Zr9Ni11 phase in the sample. Few of the measured from the SAED pattern are found to be 2.33 Å and 1.70 Å which are very close to the (130) and (150) interplanar spacings of orthorhombic ZrNi (JCPDS 65-7465), respectively. The presence of ZrNi phase in the sample is thus confirmed. Some of the measured interplanar spacings from the SAED pattern, 2.75 Å and 1.70 Å, are found to be very close to the (103) and (-203) interplanar spacings of triclinic Zr8Ni21 (ICDD PDF Card No.: 01-071-2622), respectively. This confirms the presence of Zr8Ni21 phase in the sample. Few of the measured interplanar spacings (-spacing) from the SAED pattern are 2.32 Å and 1.67 Å. These measured are very close to the (200) and (112) interplanar spacings of hexagonal ZrNi3 (JCPDS 65-1968), respectively. Hence, the presence ZrNi3 phase in the sample is confirmed. Measured values of some of the interplanar spacings (-spacing) are 1.77 Å, 2.30 Å and 2.26 Å which are found to be very close to the (151), (004) and (023) interplanar spacings of Zr7Ni10 (ICDD PDF Card No.:01-072-3501), respectively. Therefore, the presence of Zr7Ni10 phase in this sample is confirmed.
h
| Temperature (K) | Component | (Mrad/s) | () | () | Assignment | |
|---|---|---|---|---|---|---|
| 298 | 1 | 25.7(3) | 0.37(3) | 12(1) | 81(3) | HfNi |
| 2 | 39.5(5) | 0.64(4) | 0 | 19(3) | Hf9Ni11 | |
| 373 | 1 | 22(1) | 0.39(7) | 0 | 55(3) | HfNi |
| 2 | 40.9(9) | 0.59(7) | 0 | 45(3) | Hf9Ni11 | |
| 473 | 1 | 19.3(9) | 0.26(8) | 0 | 64(3) | HfNi |
| 2 | 40.0(8) | 0.59(6) | 0 | 36(3) | Hf9Ni11 | |
| 573 | 1 | 18(1) | 0.25(fixed) | 0 | 76(3) | HfNi |
| 2 | 41(2) | 0.59(12) | 0 | 24(3) | Hf9Ni11 | |
| 673 | 1 | 18.7(5) | 0.18(7) | 0 | 67(3) | HfNi |
| 2 | 41.7(6) | 0.58(3) | 0 | 33(3) | Hf9Ni11 | |
| 773 | 1 | 18.4(5) | 0.30(4) | 0 | 61(3) | HfNi |
| 2 | 42.6(4) | 0.57(2) | 0 | 39(3) | Hf9Ni11 | |
| 873 | 1 | 17.2(4) | 0.19(5) | 0 | 68(3) | HfNi |
| 2 | 41.9(4) | 0.54(2) | 0 | 32(3) | Hf9Ni11 | |
| 298a | 1 | 24.3(4) | 0.38(2) | 3(1) | 75(3) | HfNi |
| 2 | 42.5(5) | 0.68(3) | 0 | 25(3) | Hf9Ni11 |
a after measurement at 873 K
3.2 Hf9Ni11
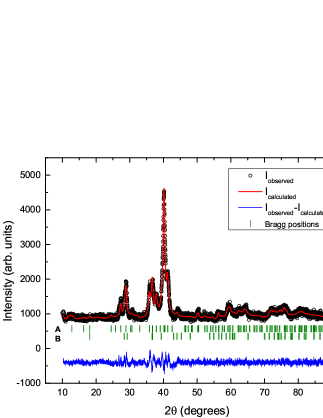
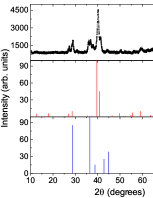
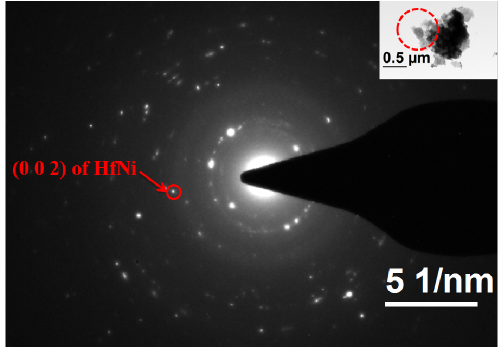
The powder X-ray diffraction pattern in Hf9Ni11 is shown in Fig. 7. Presence of Hf9Ni11 and HfNi phases have been found (Fig. 7) in the XRD spectrum by comparing with the ICDD PDF Card No.: 00-033-0963 of Zr9Ni11 and JCPDS 47-1414 of HfNi, respectively. Analysis of the X-ray powder pattern (Fig. 7) was carried out by FullProf software package [39] using the known crystallographic data of body-centered tetragonal Hf9Ni11 [17, 24, 25] and base-centered orthorhombic HfNi [17, 44, 25] phases. The presence of HfNi phase in this stoichiometric sample of Hf9Ni11 has been observed from TEM/SAED measurement (Fig. 8). Selected area electron diffraction (SAED) pattern obtained from a region marked by a dotted circle in the stoichiometric sample of Hf9Ni11 is shown in Fig. 8. One of the measured interplanar spacing from the SAED pattern is 2.03 Å which is found to be very close to the (002) interplanar spacing of orthorhombic HfNi (JCPDS 47-1414). This further confirms the presence of HfNi phase in the sample. The phase Hf9Ni11 could not be identified from SAED pattern in the stoichiometric sample of Hf9Ni11 due to non-availability of X-ray diffraction data of interplanar spacings () and corresponding crystallographic planes () for Hf9Ni11.
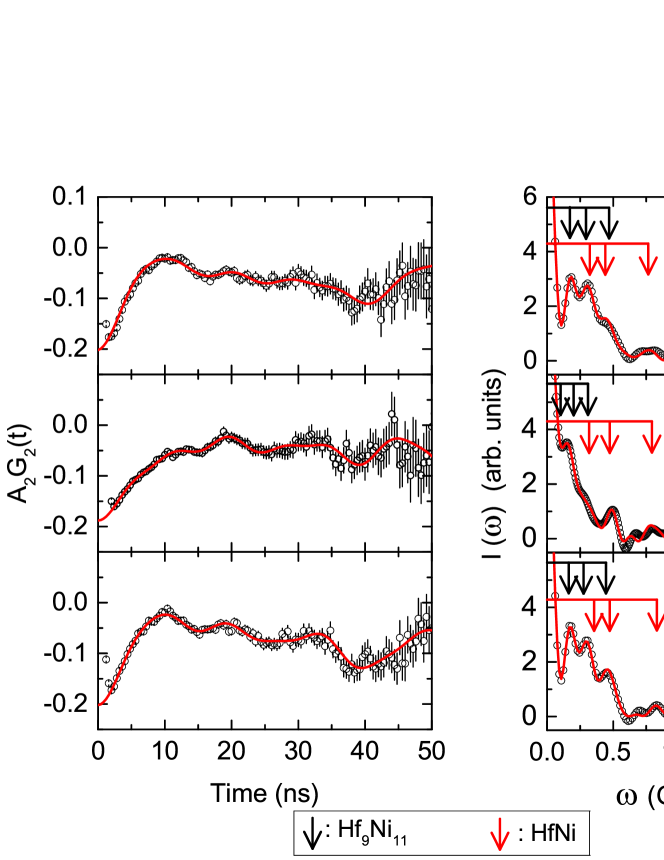
The PAC spectrum at room temperature in Hf9Ni11 is shown in Fig. 9. An analysis of the spectrum produces one predominant component (81%) with values of = 25.7(3) Mrad/s, = 0.37(3) and = 12(1)% and a minor component (19%) with values of = 39.5(5) Mrad/s, = 0.64(4), = 0. Comparing these values with the PAC results in Zr9Ni11 at room temperature (Table 1), the minor component can be assigned to Hf9Ni11. Since the crystal structures of Zr9Ni11 and Hf9Ni11 are the same, similar values of and in the two compounds are expected. The predominant component, however, can be attributed to HfNi by comparing these results with the previous reported results in HfNi [46]. In the Hf-Ni phase diagram [25], nine intermediate phases have been found where the phases Hf2Ni7 and HfNi melt congruently, and seven other phases of Hf-Ni binary system, namely, Hf9Ni11, /-HfNi3, Hf8Ni21, Hf3Ni7, Hf7Ni10, Hf2Ni, HfNi5 are formed peritectically [25]. The Hf9Ni11 phase is formed by peritectic reaction from the liquid melt and HfNi at 1613 K [48, 47]. Kirkpatrick and Larson [17] reported that the Hf-Ni system is analogous to Zr-Ni system. Unlike Zr9Ni11, a predominant component due to HfNi is observed in Hf9Ni11. This is, probably, due to the fact that in Hf9Ni11 PAC sample, a significant mass loss (5.5%) of the sample was observed during its preparation in argon arc furnace. This mass loss can be considered as due to loss of Ni which has a much lower melting and boiling point compared to the other constituent Hf. So, the stoichiometry of the arc melted sample was changed and a Ni deficient compound was produced by melting. Since, the stoichimetry of Hf9Ni11 (Hf/Ni ratio 1:1.22) and HfNi are not very different, the production of HfNi phase in the sample is expected. In this case, the mass loss of the sample was such that its stoichiometry comes closer to HfNi.
The PAC measurements at higher temperatures have also been performed in Hf9Ni11. It is found that at 373 K, the fraction due to Hf9Ni11 enhances to 45% at the expense of HfNi (Table 2). In the temperature range 373-873 K, the component fractions do not change much (Fig. 10).
After heating the sample gradually up to 873 K, a re-measurement at room temperature was carried out. The results are found to be almost the same as found before heating. The frequency distribution width for the predominant component, however, decreases (Table 2) as expected due to annealing of the sample. In this case, the values of quadrupole frequencies for the two components are found to change slightly. In the two cases, there are large changes in frequency distribution widths which probably affect the results. But unlike Zr9Ni11, no change in phases due to heating is observed in Hf9Ni11 and the phases are found to be stable up to 873 K.
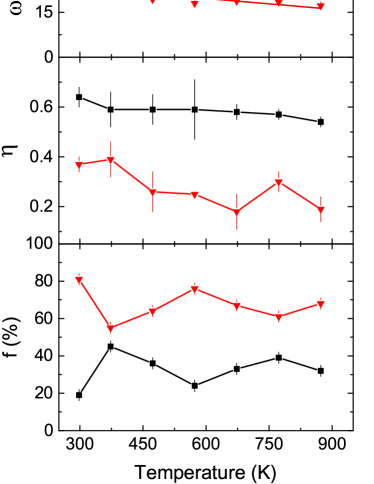
The variations of quadrupole frequency and asymmetry parameters of two phases found in the stoichiometric sample of Hf9Ni11 with temperature are shown in Fig. 10. It is found that the temperature dependence of quadrupole frequency for the Hf9Ni11 phase is very weak which is similar to the temperature dependence of quadrupole frequency in Zr9Ni11. But, unlike Zr9Ni11, for Hf9Ni11 is found to increase with temperature. Although, the for this phase is found to evolve with temperature following a linear temperature dependent relation (Eqn. 6). A fitting to the Eqn. 6 produces values of (0) = 36.9(9) Mrad/s (=4.1(1)1021 V/m2) and = -1.9(3)10-4 K-1. Similar unusual temperature dependence of quadrupole frequency was also found in the literature [49]. Here also, a weak temperature dependence of EFG indicates that crystal parameters do not change much with temperature. The for the predominant HfNi component is also found to vary linearly with temperature following Eqn. 6. The fitted results are found to be (0) = 27(2) Mrad/s ( = 3.0(2)1021 V/m2) and =4(1)10-4 K3/2.
| Compound | Lattice site | Calculated EFG | Calculated | Measured EFG | Measured |
|---|---|---|---|---|---|
| Zr9Ni11 (181Ta probe) | Zr1 2 | 25.9 | 0 | ||
| Zr2 8 | -8.4 | 0.30 | |||
| Zr3 8 | -5.6 | 0.92 | 4.6(1) | 0.80(10) | |
| Hf9Ni11 (181Ta probe) | Hf1 2 | 20.7 | 0 | ||
| Hf2 8 | -8.1 | 0.39 | |||
| Hf3 8 | 5.0 | 0.72 | 4.7(1) | 0.68(3) |
4 Ab initio calculations
The ab initio density functional theory (DFT) calculations were performed to compare with the experimental results by all-electron full potential (linearized) augmented plane waves plus local orbitals [FP-(L)APW+lo] method, as implemented in WIEN2k [50]. The exchange-correlation potential was calculated using the generalized gradient approximation (GGA) with the parameterization of Perdew-Burke-Ernzerhof (PBE) [51]. The cut-off parameter for limiting the number of plane waves, where is the smallest value of all atomic sphere radii and is the largest reciprocal lattice vector used in the plane wave expansion, was set to 7.0. The Brillouin zone integration was achieved via a tetrahedron method [52]. Taking into consideration both the accuracy and the efficiency of the calculations, we have selected a 10 10 10 point mesh to sample the entire Brillouin-zone (BZ), yielding 143 points in the irreducible Brillouin-zone. The structure was relaxed according to Hellmann-Feynman forces calculated at the end of each self-consistent cycle, until the forces acting on all atoms were less than 0.03 eV/ (2 mRy/a.u.). During this relaxation, the cell volume was kept fixed to its experimental value. Then the theoretical equilibrium volume was determined by fixing the atomic positions to their optimized values and further keeping ratio fixed. A series of calculations was carried out, changing the volume within 5% of its experimental value and calculating the total energy as its function. Finally, the ratio was optimized by changing it within 2% of its experimental value while keeping the optimized volume fixed. The convergence criterion for achieving self-consistency was that the integrated charge difference between last two iterations to be smaller than 5 10-5 electron.
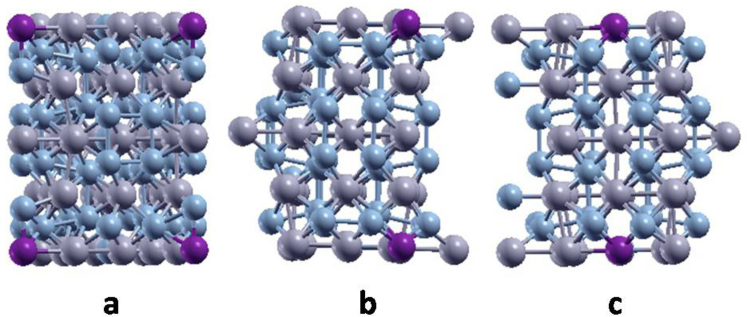
We used the optimal structural parameters to construct 1 1 2 supercell and then replaced each of the Zr (Hf) nonequivalent host sites by a Ta atom successively (Figure 11, [53]). The point group symmetry around the Ta atom remained the same as around the original atom, but the number of non-equivalent positions enlarged to 18-50, which increased the complexity of the calculations. We used 36-64 points in the irreducible wedge of the Brillouin zone for these calculations.
Both Zr9Ni11 and Hf9Ni11 have tetragonal type crystal structure (space group number 87). For Zr9Ni11, structure (space group no 83) was reported by Stalick et al. [29] only, but other authors found structure [16, 14, 21] including two recent results by Matsuyama et al. [14] and Kosorukova et al. [21]. We have found crystal structure from XRD (Table 3, Fig. 1, 5, 7) and TEM/SAED (Figure 2, 6) studies in our samples. So, for DFT calculations, we have considered crystal structure for both Zr9Ni11 and Hf9Ni11. This structure contains 20 atoms in the primitive cell and three nonequivalent Hf (Zr) crystallographic positions. The theoretically optimized structure parameters together with the experimental values obtained from earlier [16, 21] and present X-ray diffraction measurements are shown in Table 3. We can see that lattice constants overestimate the experimental ones for about 1%, while the lattice constants underestimate the measured ones for about 2%. The bulk moduli , obtained by fitting the data to the Murnaghan’s equation of state [54] are also given in Table 3.
The electric field gradient (EFG) tensor was calculated from the obtained charge density using the method developed in reference [55]. The usual convention is to designate the largest component of the EFG tensor as . The asymmetry parameter is then given by , where . The calculated and experimental EFGs at the Ta probe positions in the Hf9Ni11 and Zr9Ni11 compounds, along with the corresponding asymmetry parameter values, are given in Table 4. It can be observed that the EFG values for Ta at 2 position are not very different in Hf9Ni11 and Zr9Ni11. This is the position with largest EFG. The EFGs for Ta at the other two nonequivalent Hf(Zr) positions, 8, are also similar in both compounds. We see that the calculated result for EFG and at the Ta probe replacing Zr3 atom (-5.6 1021 V/m2 and 0.92) is in agreement with the corresponding values measured at 77 K (4.6 1021 V/m2 and 0.80), thus confirming that the mentioned component of the measured PAC spectra originates from Zr9Ni11. The sign of can not be determined by PAC measurements. Therefore, absolute values of have been compared. In the case of Hf9Ni11, the calculated results of EFG (5.0 1021 V/m2) and (0.72) are in better agreement with the measured values of EFG (4.4 1021 V/m2) and (0.64) at room temperature. It is interesting to notice that remeasured values at room temperature after heating (4.7 1021 V/m2 and 0.68) exhibit even better agreement with the calculated ones. Possible explanation is that the heating resulted in the better structure arrangement, which is now closer to the ideal one.
5 Conclusion
We have performed PAC measurements and DFT calculations to address the phase components, and phase stability in Zr9Ni11 and Hf9Ni11. In both these compounds, multiphase components have been found which are assigned by comparing with the results from DFT calculations. Three non-equivalent Zr/Hf sites are found from calculations while only one site occupation (Zr3/Hf3) by the probe is obtained experimentally. In Zr9Ni11 stoichiometric sample, up to 673 K, the phase due to the Zr9Ni11 is found to be predominant, with the minor phase belonging to Zr8Ni21. Above 673 K, the Zr9Ni11 phase becomes unstable and Zr7Ni10 appears. At 973 K, the phase due to ZrNi is produced as a dominating phase. This phase has also been found to be predominant when remeasured at room temperature after measurement at 973 K.
In the stoichiometric Hf9Ni11 sample, the phase due to Hf9Ni11 is produced as a minority phase and the HfNi phase is found to be predominantly produced. From our PAC measurements, isostructurality of Zr9Ni11 and Hf9Ni11 has been found. The phases produced in Hf9Ni11 are found to be stable up to 873 K.
In both Zr9Ni11 and Hf9Ni11, very weak temperature dependence of electric field gradients (EFG) have been observed which indicates that the lattice parameters do not change much with temperature. The calculated results of EFG and asymmetry parameter () at the Ta impurity atom positions, Zr3 8 in Zr9Ni11 and Hf3 8 in Hf9Ni11, are found to be in good agreement with our experimental results, thus confirming the origin of the components of our interest in the PAC spectra.
Acknowledgement
The authors acknowledge with thanks A. Karmahapatra and S. Pakhira of Saha Institute of Nuclear Physics, Kolkata for their helps in XRD measurements and data analysis. The present work is supported by the Department of Atomic Energy, Government of India through the Grant no. 12-R&D-SIN-5.02-0102. J. Beloević-avor acknowledges support by The Ministry of Education, Science and Technological Development of the Republic of Serbia through the project no. 171001.
References
- [1] S.J. Pang, T. Zhang, K. Asami, Mat. Trans. 43, 1771 (2002).
- [2] V. Ivanchenko, T. Kosorukova, M. Samohin, S. Samohin, Yu. Butenko, Patent of Ukraine on useful model 26254 (2007).
- [3] G. Haour, F. Mollard, B. Lux, and I. G. Wright, Z. Metallk. 69, 149 (1978).
- [4] P. Nash, in High-Temperature Ordered Intermetallic Alloys, edited by C. C. Koch, C. T. Liu, and N. S. Stoloff (Mater. Res. Soc. Symp. Proc. 39, Pittsburgh, PA, 1985), p. 423.
- [5] F.C. Ruiz, E.B. Castro, S.G. Real, H.A. Peretti, A. Visintin, W.E. Triaca, Int. J. Hydrogen Energy 33, 3576 (2008).
- [6] F. C. Ruiz, E. B. Castro, H. A. Peretti, A. Visitin, Int. J. Hydrogen Energy 35, 9879 (2010).
- [7] J. Nei, K. Young, R. Regmi, G. Lawes, S.O. Salley, K.Y.S. Ng, Int. J. Hydrogen Energy 37, 16042 (2012).
- [8] J.M. Joubert, M. Latroche, A. Percheron-Guégan, J. Alloys Compd. 231, 494 (1995).
- [9] X.-Y. Song, X.-B. Zhang, Y.-Q. Lei, Z. Zhang, Q.-D. Wang, Int. J. Hydrogen Eng. 24, 455 (1999).
- [10] Kwo Young, Taihei Ouchi, Michael A. Fetcenko, Willy Mays, Benjamin Reichman, Int. J. Hydrogen Energy 34, 8695 (2009).
- [11] Young K, Ouchi T, Liu Y, Reichman B, Mays W, Fetcenko MA., J Alloys Compd. 480, 521 (2009).
- [12] K. Young, J. Nei, T. Ouchi, M.A. Fetcenko, Journal of Alloys and Compounds 509, 2277 (2011).
- [13] Kwo-hsiung Young and Jean Nei, Materials 6, 4574 (2013).
- [14] Akihiro Matsuyama, Hironori Mizutani, Takumi Kozuka, Hiroshi Inoue, J. Alloys Compd. 714, 467 (2017)
- [15] V. Provenzano, R.D. Shull, R.M. Waterstrat, L.H. Bennett, E. Della Torre and H. Seyoum, IEEE Trans. Magnetics 46, 502 (2010).
- [16] J.L. Glimois, C. Becle, G. Develey, J.M. Moreau, J. Less-Common Met. 64, 87 (1979).
- [17] M.E. Kirkpatrick, W.L. Larsen, Trans. Am. Soc. Met. 54, 580 (1961).
- [18] S.K. Shadangi, S.C. Panda and S. Bhan, Acta Crystallogr. B 38, 2092 (1982).
- [19] Xueyan Song, Ze Zhang, Xiaobin Zhang, Yongquan Lei, and Qidong Wang, J. Mater. Res. 14, 1279 (1999).
- [20] P. Nash, C.S. Jayanth, Bulletin of Alloy Phase Diagrams 5, 144 (1984).
- [21] T. Kosorukova, V. Ivanchenko, G. Firstov and H. Noël, Solid State Phenomena 194, 14 (2013).
- [22] S.C. Panda, S. Bhan, J. Less-Common Met. 34, 344 (1974).
- [23] S.C. Panda and S. Bhan, Z. Metallk. 64, 793 (1973) H11.
- [24] J.L. Liu, L.L. Zhu, X.M. Huang, G.M. Cai and Z.P. Jin, CALPHAD: Computer Coupling of Phase Diagrams and Thermochemistry 58, 160 (2017).
- [25] P. Nash, A. Nash, Bulletin of Alloy Phase Diagrams 4, 250 (1983).
- [26] G. Ghosh, J. Mat. Res. 90, 598 (1994).
- [27] Lars Bsenko, J. Less-Common Metals 63, 171 (1979).
- [28] Xiaoma Tao, Pei Yao, Wenwang Wei, Hongmei Chen, Yifang Ouyang, Yong Du, Yuan Yuan, Qing Peng, Journal of Alloys and Compounds 752, 412 (2018).
- [29] J.K. Stalick, L.A. Bendersky and R.M. Waterstrat, J. Phys. Cond. Matt. 20, 285209 (2008).
- [30] S.K. Dey, C.C. Dey, S. Saha, J. Beloević-avor, Intermetallics 84, 112 (2017).
- [31] C. C. Dey and S. K. Srivastava, Physica B 427, 126 (2013).
- [32] M. Marszalek, H. Saitovitch, P.R.J. Silva, Z. Naturforsch. 55a, 49 (2000).
- [33] S.K. Dey, C.C. Dey, S. Saha, J. Beloević-avor, D. Toprek, J. Alloys Compd. 723, 425 (2017).
- [34] R.B. Firestone, V.S. Shirley (Eds.), Table of Isotopes, 8th ed., John Wiley and Sons, New York, 1996.
- [35] G. Schatz, A. Weidinger, Nuclear condensed matter physics, Nuclear Methods and Application, John Wiley and Sons, Chichester, New York, Brisbane, Toronto, Singapore, 1996, p. 63 (chapter 5).
- [36] M. Zacate and H. Jaeger, Defect Diffus. Forum 311, 3 (2011).
- [37] T. Butz, A. Lerf, Phys. Lett. A 97, 217 (1983).
- [38] C.C. Dey, Pramana 70, 835 (2008).
- [39] J. Rodríguez-Carvajal, Physica B 192, 55 (1993).
- [40] J.-M. Joubert, R. Černý, K. Yvon, M. Latroche, A.P. Guégan, Acta Crystallogr. C 53, 1536 (1997).
- [41] S.K. Dey, C.C. Dey, S. Saha, G. Bhattacharjee, D. Banerjee, J. Beloević-avor, D. Toprek (arXiv id: 1809.08114).
- [42] C. C. Dey, Rakesh Das and S. K. Srivastava, J. Phys. Chem. Solids 82, 10 (2015).
- [43] W. Witthuhn and E. Engel, in Hyperfine Interactions of Radioactive Nuclei, Ed. by J. Christiansen (Springer-Verlag Berlin Heidelberg New York Tokyo, 1983) P. 205.
- [44] M.E. Kirkpatrick, D.M. Bailey and J.F. Smith, Acta Cryst. 15, 252 (1962).
- [45] J.M. Joubert, R. cerný, K. Yvon, Z. Kristallogr-New Cryst. Struct. 213 227 (1998).
- [46] I. Yaar, D. Cohen, I. Halevy, S. Kahane, H. Ettedgui, R. Aslanov, Z. Berant, Hyperfine Interact. 159 351 (2004).
- [47] Z. Kejun, J. Zhanpeng, J. Less-Common Met. 166, 21 (1990).
- [48] V. N. Svechnikov, A. K. Shurin and G. P. Dmitriyeva, Russ. Metall. Fuels 6, 95 (1967).
- [49] P. Wodniecki, B. Wodniecka, A. Kulińska, M. Uhrmacher, K.P. Lieb, J. Alloys Compd. 365, 52 (2004).
- [50] P. Blaha, K. Schwarz, G.K.H. Madsen, D. Kvasnicka and J. Luitz, WIEN2k an Augmented Plane Wave Plus Local Orbitals Program for Calculating Crystal Properties, Vienna University of Technology, Vienna, Austria, 2001.
- [51] J.P. Perdew, K. Burke and M. Ernzerhof, Generalized Gradient Approximation Made Simple, Phys. Rew. Lett. 77, 3865 (1996).
- [52] P.E. Blochl, O. Jepsen and O.K. Andersen, Phys. Rev. B 49, 16223 (1994).
- [53] A. Kokalj, J. Mol. Graphics Modeling 17, 176 (1999).
- [54] F.D. Murnaghan, Proc. Natl. Acad. Sci. U.S.A. 30, 244 (1944).
- [55] P. Blaha, K. Schwarz and P. Herzig, Phys. Rev. Lett. 54, 1192 (1985).