Dielectronic recombination of the open -shell of Tungsten: W37+ – W28+
Abstract
Tungsten is an important element for magnetically confined fusion plasmas but has the potential to cool, or even quench the plasma due to it being an efficient radiator. Total and level-resolved dielectronic recombination (DR) rate coefficients, for all ionization stages, are essential to model tungsten. We describe a set calculations performed using the distorted wave code autostructure for the tungsten ions W37+ to W28+. We demonstrate the importance of relativistic configuration mixing in such calculations. In particular, we show that the partial DR rate coefficients calculated in level and configuration resolution can differ by as little as 5%, and up to as much as 75%. Using the new data, we calculate a revised steady-state ionization fraction for tungsten. We find that, relative to the ionization fraction calculated using the recombination rate coefficients of Putterich et al (Plasma Phys. Control. Fusion, 50, 085016), the peak temperatures of W37+ to W28+ ionization states are shifted to lower temperatures spanning 0.9-1.6keV. This temperature range is important for understanding the performance of large tokamaks, such as ITER, because the temperatures in the pedestal, edge, scrape-off-layer and divertor region fall in this range.
-
November 2016
1 Introduction
The experimental thermonuclear tokamak reactor ITER is currently being built in Cadarache, France, with its first plasma projected to be in 2025. Designed to output 10 times as much energy as it consumes, it is posited to be the penultimate step in realising a commercial fusion reactor. The plasma facing component of the the divertor will be coated with tungsten. This metal has been chosen due to its resistance to tritium absorption, its ability to withstand large power loads, and its high melting point. However tungsten will be sputtered into the core, confined, plasma. Tungsten as an impurity in the confined plasma is a problem because it is a very efficient radiator, which will lead to cooling of the plasma, and potentially quenching it. A key method in understanding the impact of tungsten impurities on the tokamak plasma is detailed collisional-radiative modelling [1]. However, such modelling requires the provision of partial, final-state resolved dielectronic/radiative recombination (DR/RR) rate coefficients for the ion being modelled.
High temperatures in the core are required to enable the fusion reaction and maintaining this core temperature necessitates a high temperature at the plasma edge. The pedestal region is characterized by a steep pressure () gradient at the edge which forms a transport barrier; maximizing its height, and inter alia the edge temperature, is the preferred way to achieve high performance [2]. Unfortunately the plasma conditions of this high confinement (H-mode) regime are susceptible to MHD instabilities which collapse the pedestal, thus reducing the temperature and allowing impurities into the core region, resulting in reduced performance or destruction of the conditions needed to sustain the fusion reaction. Radiation from high efficiency radiators such as tungsten will affect the balance between the competing effects. For ITER the pedestal temperature is 14keV depending on model and extrapolations from JET ITER-like wall experiments [2, 3]. The ionization stages of tungsten reported here fall in this region so it is important to be able to model their distribution, particularly in regions like the pedestal, where turbulent transport is strongly suppressed.
Several isonuclear datasets for tungsten have been calculated using a variety of methods. The first was generated by Post et al [4, 5] using an average-ion method with the ADPAK codes. Later, Pütterich et al [6] used these recombination rate coefficients in modelling the tokamak plasmas from ASDEX upgrade, but scaled several ionization stages (W20+–W55+) by empirically determined constants to match observed spectral emission. Next, Foster [7] used a combination of the Burgess General Formula [8] and the Burgess-Bethe General Program [9] to calculate DR rate coefficients for the sequence. The RR rate coefficients were calculated by scaling hydrogenic results. Lastly, there exists a complete set of recombination rate coefficients on the International Atomic Energy Agency website 111https://www-amdis.iaea.org/FLYCHK/ calculated using the FLYCHK code [10], which also uses an average-ion method. Despite the numerous calculations available and the wide range of methods used, poor agreement between the calculated recombination rate coefficients is observed between all three datasets. Examples of this poor agreement can be seen in Kwon et al [11], where multiple comparisons are made between these datasets. Clearly, further theoretical investigation is required to resolve this disagreement.
The demand for partial final-state resolved DR rate coefficients for tungsten has seen a surge in the number of calculations being performed. Typically, these calculations covered ions where the outer valence electron shell is full or nearly full, which are useful for plasma diagnostics. Safronova et al has calculated DR rate coefficients for a wide range of tungsten ions using the Cowan [12] and hullac [13] codes, covering W5+, W6+, W28+, W38+, W45+, W46+, W63+, and W64+ [14, 15, 16, 17, 18, 19, 20, 21]. Behar et al also used the Cowan and hullac codes to calculate DR rate coefficients for W45+, W46+, W56+, and W64+ [22, 23, 24]. The Flexible Atomic Code (fac) can also calculate DR rate coefficients, and was used by Li et al to calculate data for W29+, W39+, W27+, W28+, and W64+ [25, 26, 27]. In addition, Meng et al and Wu et al have also used fac to calculate DR for W47+, and W46+-W46+ respectively. Lastly, Kwon et al used fac to calculate DR rate coefficients for W44+-W46+ [28, 29].
Several works are now exploring ions of tungsten where the valence shell is partially or half full. The most complicated example to date is the work of Spruck et al and Badnell et al [30, 31, 32], where the authors compared experimental storage ring measurements of DR for W18+, W19+, and W20+ (ground configurations , , and respectively) with calculations from the atomic collision package autostructure [33, 34, 35]. Other approaches to dealing with such complex ions include the use of statistical methods such as those employed by Dzuba et al [36, 37], Berengut et al [38], and Harabati et al [39]. An excellent review of the methods used to study -shell ions, both experimentally and theoretically, has been compiled by Krantz et al [40].
The most recent attempt to cover the entire isonuclear sequence is known informally as The Tungsten Project. Using autostructure, Preval et al has calculated DR and RR rate coefficients for W73+–W38+ [41, 42]. Because of the increased activity in calculating data for tungsten, multiple comparisons have been performed with data from The Tungsten Project, confirming the reliability of the calculation methods used. All data from these publications have been published on the OPEN-ADAS website222http://open.adas.ac.uk in the standard adf09 (DR) and adf48 (RR) formats. The definitions of these formats can also be found on the OPEN-ADAS website.
While not as complicated as the open shell, calculating DR rate coefficients for open shell ions still represents a significant jump in complexity to ions considered previously. The rich level structure of these ions also presents interesting physics in its own right. It is for this reason that this paper is dedicated to the () isonuclear sequence of tungsten, covering charge states W37+–W28+. As in Preval et al [41, 42] we use some technical notation when discussing the various ionization stages. Beyond Zn-like, referring to ions by their isoelectronic chemical symbol requires a good memory of the periodic table. It is for this reason that we refer to the various ionization stages by the number of valence electrons instead. For example, H-like () becomes 01-like, and Pd-like () with 46 valence electrons becomes 46-like.
We structure this paper as follows. We first describe the underlying theory for our DR calculations. Next, we present and discuss our results, and compare our DR rate coefficients to those calculated in other works. Finally, we assess the quantitative effect of using our data in calculating the steady state ionization fraction for tungsten, and demonstrate how the ions can be potentially used as a temperature diagnostic. We conclude with a few remarks.
2 Theory
The theory underpinning the calculation of DR rate coefficients has been discussed at length in multiple works, however, we summarise the basic principles here. All DR rate coefficients described in this paper were calculated using the distorted wave code autostructure. It is able to calculate energy levels, radiative/autoionization rates, collision strengths, and many other quantities. The code is able to calculate data in configuration average (CA), term (LS), or level (IC) resolution using relativistic -averaged wavefunctions. autostructure has been benchmarked extensively against experimental DR measurements for various ions such as Fe19+ [43], and F5+ [44].
For an ion with residual charge in an initial state recombining into an ion with final state , the partial DR rate coefficient at a particular electron temperature, , can be written as
| (1) | |||||
where and are the statistical weights of the - and -electron ions respectively, the and are the radiative and Auger rates respectively, and is the total energy of the continuum electron minus its rest energy, which is fixed by the position of the resonances. The sum over is performed over all orbital angular momentum quantum numbers included, and the sum over is over all autoionizing levels. The sums over and give the total radiative and Auger widths respectively. Lastly, is the ionization energy of the hydrogen atom, is the Boltzmann constant, and cm3.
The RR rate coefficients for the ions are now completely overwhelmed by the DR rate cofficients. Therefore, they are calculated for The Tungsten Project for completeness only. RR contributes at most % for 37-like at peak abundance temperature (K), decreasing to % for 46-like at peak abundance temperature (K). The RR rate coefficient can be written in terms of its inverse, photoionization , using detailed balance. Therefore, the partial RR rate coefficient can be written as:
| (2) | |||||
where is the corresponding photon energy, and cm s-1.
At high energies and temperatures, relativistic effects must be factored into the Maxwell-Boltzmann distribution. This results in a correction factor to the distribution giving the Maxwell-Jüttner distribution [45], which can be written as:
| (3) |
where , is the fine-structure constant and is the modified Bessel function of the second kind. As we move along the isonuclear sequence the Jüttner correction becomes less relevant. For the ions considered in the present work, the Jüttner correction causes a change of % at peak abundance for 37-like, and even less for 46-like. However, the high-temperature DR decreases by as much as 50% for 37-like at K, and 35% for 46-like at K.
3 Calculations
3.1 DR
We split our DR rate coefficient calculations into core excitations, which are labelled in terms of the initial and final principal quantum numbers and of the promoted target electron. The largest contributions to the total DR rate coefficient by far come from the outer shell core excitations 4–4 and 4–5. In the case of the inner shell core excitation (3–4), the filling of the shell restricts the number of promotions that can occur from , decreasing its importance. The converse is true for the outer shell core excitation (4–6).
The 3–4 core excitation was calculated in CA due to its small contribution to the recombination rate coefficient total. The -electron configuration set included all possible double excitations of and electrons from the ground configuration of the ion considered. The -electron configurations consisted of all possible triple excitations of and electrons from the ground configuration of the -electron ion.
The 4–6 core excitation was also calculated in CA due to its small contribution to the recombination rate coefficient total. The -electron configuration set was constructed in a similar manner to the 3–4 core excitation, and included all possible double excitations of the electrons from the ground configuration to and . The -electron configurations included all possible triple excitations of the electrons from the ground configuration to .
The 4–4 core excitation was calculated in IC due to its large contribution to the recombination rate coefficient total. The -electron configurations consisted of single promotions from and to from the ground configuration of the ion being considered. Promotions from were omitted due to their small contribution to the DR rate coefficient total. Mixing configurations were included by way of the “one-up one-down” rule as described in Cowan’s book [12]. For example, for a particular configuration the corresponding mixing configurations would be:
-
•
-
•
.
The -electron configurations consisted of the -electron configurations with an additional target electron added. We demonstrate the resulting configuration set for 40-like in Table LABEL:table:configs40like. Given such a set of configurations, AUTOSTRUCTURE calculates all possible autoionization and electric dipole radiative rates between them.
The 4–5 core excitation was also calculated in IC. The -electron configuration set included promotions from and to and . As with 4–4, promotions from were omitted due to their negligible contribution to the total. Mixing configurations were included as described above. The 4–5 core excitation was the most computationally demanding calculation due to the large number of levels. To make the calculations tractable, promotions from were omitted from 40- to 43-like, while “one-up one-down” mixing configurations were omitted from 39- and 45-like. As with 4–4, the -electron configuration set is just the -electron configuration set plus an additional target electron.
For each core excitation, DR from Rydberg electrons were calculated sequentially up to , and then on a quasi-logarithmic grid of values up to . Interpolation was used to obtain the intermediate values. We included sufficiently many values so as to numerically converge the total DR rate coefficient to % over the entire ADAS temperature range, spanning K. The number of values required to achieve numerical convergence varies according to the ionization state, and the core excitation considered. The maximum required was for 41-like 4–4 with .
3.2 RR
RR is most important in the case of highly charged ions. For example, in the case of 02-like tungsten, RR contributes 100% of the recombination rate total at peak abundance temperature (see [41]). In the present work, we have calculated total RR rate coefficients including contributions for dipole radiation only. This is because higher-order multipolar radiation contributions are manifest at high energies, and hence only higher ionization states of tungsten. Omission of these contributions leads to a change in the total recombination rate coefficient of % for 37-like at peak abundance temperature. Our -electron configurations consisted of and (). The -electron configurations were just the -electron configurations plus an additional Rydberg electron. As with DR, RR contributions from Rydberg electrons were calculated sequentially up to , and then quasi-logarithmically up to , with interpolation being used to obtain the intermediate values. The Rydberg RR was calculated for sufficiently many values so as to numerically converge the RR rate coefficient to % over the ADAS temperature range. Given its small importance to the calculations, we will not discuss RR any further in this paper.
4 Results
We have calculated level- and configuration-resolved DR rate coefficients for 37- to 46-like tungsten. We split our discussion with respect to the core-excitations that have been calculated.
4.1 3–4
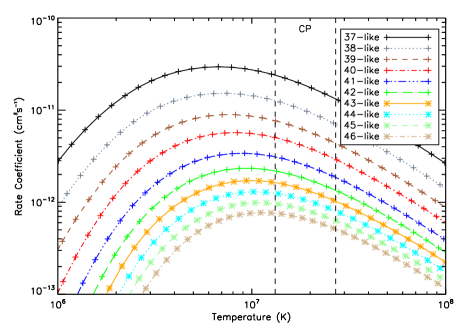
The 3–4 core excitation has been calculated in configuration average, and has been included for completeness. In Figure 1 we have plotted the total 3–4 DR rate coefficients for 37- to 46-like. We have also plotted two vertical lines on this figure labelled “CP” (collisionally ionized plasma). This range is defined as being the range of temperatures going from the peak abundance temperature of 37-like, down to the peak abundance temperature of 46-like. Note that the actual range of temperatures of interest will be wider than this. It can be easily seen that the total DR-rate coefficient decreases steadily as more electrons are added. As the shell is filled, fewer electric dipole transitions can take place, decreasing the overall total. For 37-like 3–4 contributes % to the total for temperatures K, but only % at peak abundance temperature (K). As we move along the isonuclear sequence, this contribution rapidly drops to % of the total recombination rate coefficient by 46-like at peak abundance.
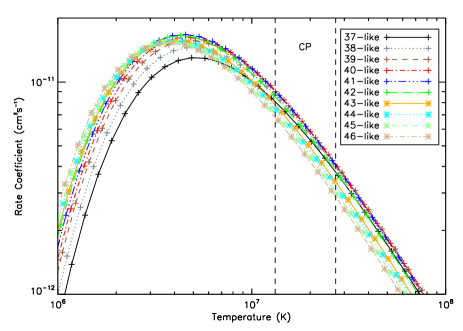
4.2 4–4
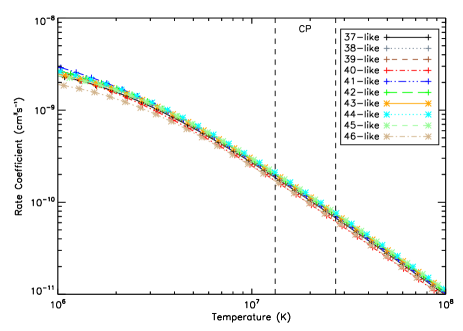
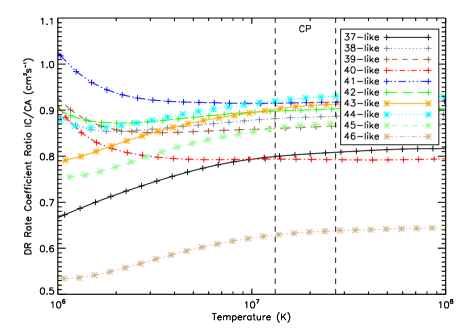
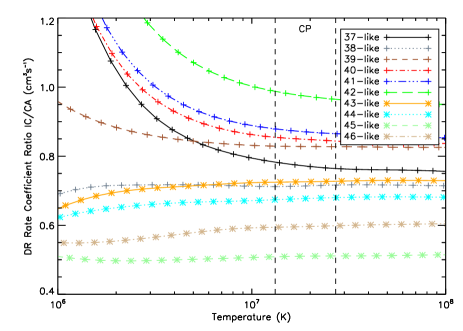
4–4 is the largest contributor to the total recombination rate coefficient, constituting roughly two thirds of the total for all of the ions. An example of the configurations included for the 4–4 core excitation is given for 40-like in Table LABEL:table:configs40like. In Figure 2 we have plotted the total 4–4 DR rate coefficient for 37- to 46-like calculated in IC. As with 3–4, we indicate the range of peak abundances for these ions with the CP region limited by two vertical dashed lines. Very little variation is seen in the DR rate coefficient in the CP region implying insensitivity to the atomic structure of the problem. For 37-like, 4–4 contributes % at peak abundance temperature (K). As the shell fills, the 4–4 contribution increases to 73% at peak abundance temperature (K) for 40-like. By 43-like, 4–4 contributes 76% to the total recombination rate coefficient at peak abundance temperature (K). Lastly, by 46-like, the 4–4 contribution decreases slightly, contributing % at peak abundance temperature (K) to the total. The total CA DR rate coefficients for the 4–4 core excitation are quite similar to their IC counterparts in that they do not change much between different ions. Therefore, instead of plotting the CA totals, we opt to plot the ratio of the IC results to the CA results in Figure 3. It can be seen that the ratio deviates strongly from unity in the CP region for all ions. This deviation becomes even larger towards low temperatures.
4.3 4–5
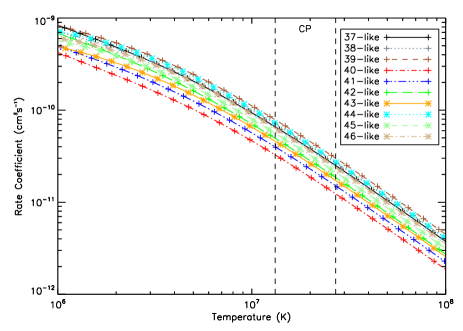
The 4–5 core excitation is the second largest contributor to the total recombination rate coefficient. In Figure 4 we have plotted the total 4–5 DR rate coefficients calculated in IC. As with Figure 1, we have indicated the CP region with two vertical dashed lines. For 37-like, 4–5 contributes % at peak abundance temperature. As we move along the isonuclear sequence, this contribution fluctuates slightly, ranging from a minimum of 15% for 40-like at peak temperature, to a maximum of 30% for 39-like. For 46-like, 4–5 contributes 25% at peak abundance temperature.
As noted previously, 37-, 38-, and 46-like 4–5 were calculated including contributions from and , as well as one-up and one-down configurations, and are hence more “complete” calculations than the other ions. Furthermore, 39-, 44-, and 45-like include contributions from and , but do not include one-up one-down mixing. Upon close inspection of Figure 4 it can be seen that 40-, 41-, 42, and 43-like are separated from the other 4–5 rate coefficient curves. In addition, despite 37-, 38-, and 46-like including one-up one-down mixing, these DR rate coefficients have similar values in the CP region to those excluding these mixing configurations. This implies that the dominant mixing effect on the total 4–5 DR rate coefficient comes from the mixing of single and promotions, rather than the double promotions from one-up one-down mixing.
As with 4–4, the CA DR rate coefficients are quite similar for all of the ions, making comparison with their IC counter parts difficult. In Figure 5 we have plotted the ratio of the IC results to the CA results for the 4–5 core excitation. Again, large deviations are seen towards low temperatures.
4.4 4–6
As with 3–4, the 4–6 core excitation has been calculated in CA only. 4–6 contributes very little to the total recombination rate coefficient, and is just included for completeness. 4–6 constitutes just 3% for 37- and 46-like at peak abundance temperature. We have plotted the total 4–6 DR rate coefficients for 37- to 46-like in Figure 6. Little variation is seen for 37- to 46-like in terms of the peak temperature, which ranges from K.
5 DR threshold sensitivity
The density and positioning of resonances near threshold can have drastic effects on the DR rate coefficient at low temperatures. If the density of resonances is sufficiently large, then the low temperature DR rate coefficient becomes insensitive to shifts around the threshold. To demonstrate this, we considered the case of 41-like for the 4–4 core excitation. We shifted the ground state of 41-like (ionization limit of 42-like) by 0.01, and then by 0.1 Ryd. This lowers all resonance positions. Then we compared the resultant total DR rate coefficients to the unshifted case. We have tabulated these DR rate coefficients in Table LABEL:table:enhance. It can be seen that despite these shifts, the total DR rate coefficients vary only slightly by 6-10% at the lowest temperature considered. While not shown in the present paper, we have checked the sensitivity of the level resolved DR rate coefficient to shifts at low temperature for all ions. For 38-, and 44- to 46-like, we found that under the 0.1 Ryd shift the DR rate coefficient for the lowest temperatures differs from the unshifted value by 33–88%. For 37-, and 39-43-like, the difference under the 0.1 Ryd shift is much smaller, with the lowest temperature DR rate coefficient differing by 0–15% from the unshifted value.
6 Relativistic Configuration Mixing
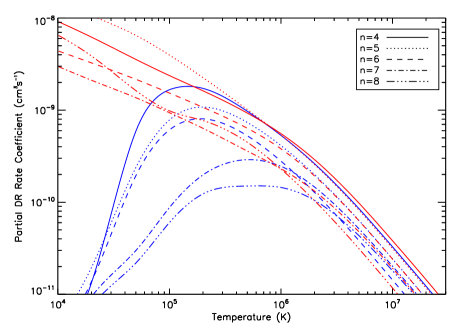
As mentioned in the introduction Badnell et al [46] considered the effect of mixing in -shell ions of tin, presenting the case of Sn10+ as an example. They compared three line strength calculations for Sn10+, calculated including promotions for only, only, and and promotions together. The combined case produced significantly larger line strengths than the individual promotion cases. Mixing is consistent across isoelectronic sequences, meaning that mixing effects observed in tin ions will also be observed in tungsten ions. As seen in Sections 4.2 and 4.3 the ratio of the IC to CA DR rate coefficients for the 4–4 and 4–5 core excitations differed greatly from unity, indicating strong mixing effects. This can be more easily seen through consideration of the partial DR rate coefficients. We consider the case of the 4–4 core excitation for 42-like, and examine recombination into 4, 5, 6, 7, and 8 in both IC and CA. We plot these rate coefficients in Figure 7.
In all cases it can be seen that the IC and CA results diverge at low temperatures. This is simply due to the lack of resonances at threshold in the CA calculation. We focus our discussion on temperatures K. The smallest differences between the IC and CA partials are observed for recombination into and . The IC partial is larger than the CA partial by 18%, while the IC partial is smaller than its CA counterpart by 4%. For recombination into and 6, the IC partial is larger than the CA partial by 30 and 75% respectively. Lastly, for recombination into , the IC partial is smaller than its CA counterpart by 42%.
7 Ionization balance
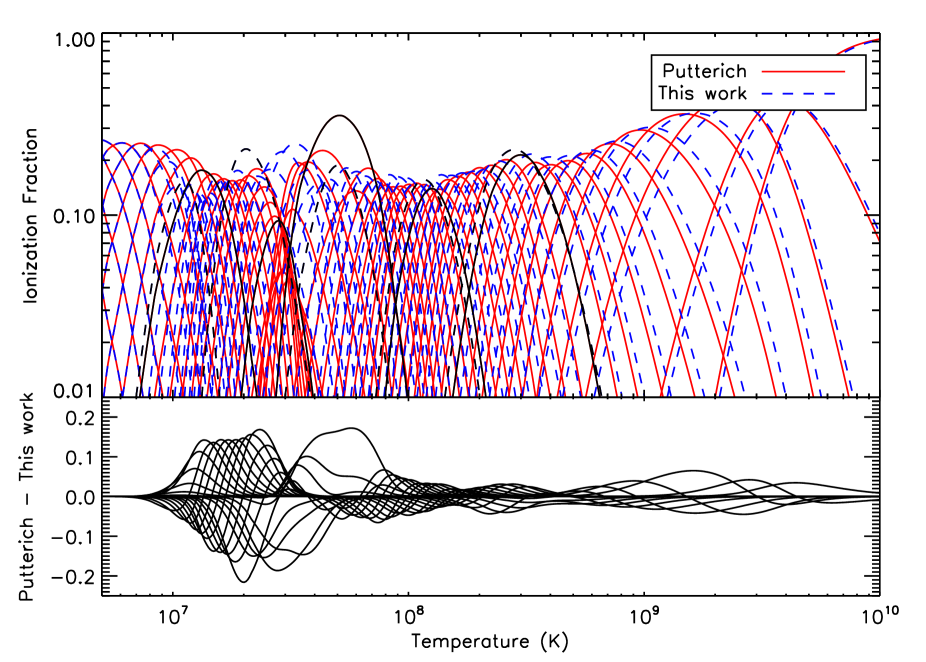
We now consider the impact of our calculations on the coronal-approximation ionization fraction of tungsten. We consider this approximation for simplicity. This is done by first calculating the ionization fraction using the recombination rate coefficients of Pütterich et al [6] and the ionization rate coefficients of Loch et al [47]. We then compare this with a similar calculation, where we replace the DR+RR rate coefficients with the values reported here. We plot the two ionization fractions in Figure 8, along with the arithmetic difference between the Pütterich et al and current ionization fractions. Note that for our discussion of these ionization fractions, we have omitted the Jüttner correction described in Section 2.
The most striking result emerging from this plot is the close grouping of the peak abundance temperatures for the ions. In the present ionization fractional abundance, the envelope of peak temperatures is 0.97-1.6keV for 46- to 37-like, whereas in the Pütterich et al ionization fraction, the same stages peak at higher temperatures and cover a wider range, 1.1-2.3keV. The new rates result in a significant narrowing of the fractional abundances, almost by a factor of 2 at the FWHM value. The stages adjacent to this group, 47-like to 50-like, also show a narrowing effect (at a smaller 20% level) which shows the influence of neighbouring ionization stages.
In addition, the peak fraction using our data ranges from 0.13 to 0.17, whereas the Pütterich et al et al peak fraction ranges from 0.1 to 0.2. The consistency of the peak fraction and the narrow temperature range in which the -shell ions are most abundant can potentially offer an accurate plasma diagnostic. Observation of spectral emission originating from a ion would tightly constrain the temperature of the originating plasma. The temperature region of these ionization stages will be of particular interest to the fusion community as the pedestal temperature at ITER is expected to be in the 1-3keV range.
In Table LABEL:table:peaktemp we give revised peak abundance temperatures and fractions when using our rate coefficients compared to using Pütterich et al ’s data, spanning 01-like to 46-like. The effect on the ionization balance of replacing the ten -shell DR rates, 46-like to 37-like are clearly seen between K. The extent of the effect of the new rates extends beyond those replaced and is present at the level up to 28-like (W46+) and down to 53-like (W21+). This accounts for the numerical difference between Table LABEL:table:peaktemp in the present work, and Table 7 of Preval et al [42] for some of the common ionization stages. Due to the effect on the abundances of adjacent stages because of replacing these rates some caution should be exercised when using the abundances below W28+.
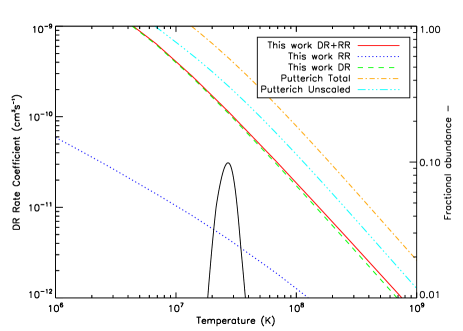
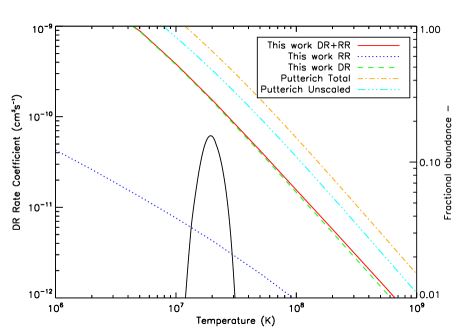
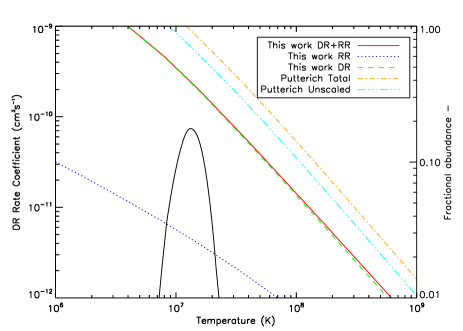
8 Comparison with Pütterich et al
The agreement between our total recombination rate coefficients and Pütterich et al ’s [6] is very poor for all ions, with their rates being consistently higher than the present work. In Figures 9, 10, and 11 we have plotted our total recombination rate coefficients for 37-like, 42-like, and 46-like respectively, along with Pütterich et al ’s scaled and unscaled results. The differences between the present work and Pütterich et al ’s are fairly constant. The scaled results are a factor 3-4 larger than the present work at peak abundance temperature, while the unscaled results are a factor 2-2.5 larger.
9 Comparison with other works
Unlike the ionization states considered in Preval et al [48], very few detailed calculations exist for the -shell ions of tungsten. To date, detailed calculations have been performed for 37-, 39-, 45-, and 46-like. We compare each of these calculations with the present results.
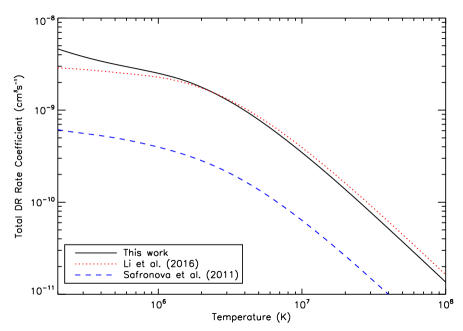
9.1 46-like
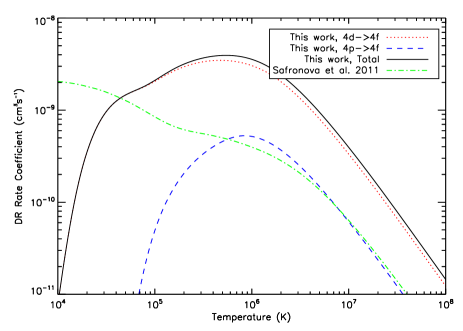
Like other closed shell ions, 46-like is an important ion for plasma diagnostic purposes. As well as the present work, DR rate coefficients for this ion have been calculated by Safronova et al [16] using hullac and Li et al [27] using fac. We have plotted the present total DR rate coefficients, along with those calculated by Safronova et al and Li et al in Figure 12. Our and Li et al ’s DR rate coefficients are in relatively good agreement, differing by between K. This difference gradually increases to 20% by K.
Our total DR rate coefficients are consistently larger than Safronova et al ’s by a factor over all temperatures. We note that the DR rate coefficients calculated by Safronova et al neglects excitations in the - and -electron targets. However, the contribution from alone is not enough to account for the large difference between our and Safronova et al ’s rate coefficients. We demonstrate this in Figure 13, where we have plotted the total DR-rate coefficients calculated in CA and IC for the 4–4 core excitation, along with their respective and contributions. At maximum, contributes 15% to the 4–4 CA total at high temperatures, while the rest is provided by . Because our results are in relatively good agreement with those calculated by Li et al , the large difference between our DR rate coefficients and Safronova et al ’s appears to be due to some systematic problem/omission in the authors’ calculation.
We note that large differences between our results and Safronova et al ’s are not limited to the present work. For example, Preval et al [41] noted a difference of % between their work and that of Safronova et al [21] for 10-like tungsten. However, comparison of Preval et al ’s 10-like results with Behar et al [24] (calculated with hullac)showed differences of %. More recently, a calculation by Li et al [27] for 10-like showed differences of 30-40% with Safronova et al [21] over a wide temperature range while showing good agreement with Preval et al at peak abundance temperature. In addition, Preval et al [42] recently compared their calculated 28- and 29-like DR rate coefficients to those presented by Safronova et al [15, 18]. As in the previous case, large systematic differences were observed of 27% and a factor 11 for 28- and 29-like respectively. Excellent agreement was seen between Preval et al and Behar et al [23] for 28-like with differences of % at peak abundance temperature. For 29-like, good agreement between Preval et al and Kwon et al [28] was seen with differences of 23% at peak abundance temperature. Without repeating Safronova et al ’s calculations (which is beyond the scope of this work), the origin of the aformentioned systematic difference is unknown.
9.2 45-like
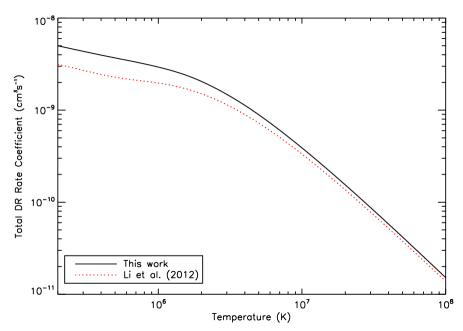
Only one calculation has been done for 45-like tungsten. Li et al [25] used fac to calculate DR rate coefficients for this ion. In Figure 14 we have plotted our DR rate coefficeints for 45-like, along with Li et al ’s results. Good agreement is seen over the entire temperature range, with the best agreement seen at high temperatures. At K our DR rate coefficients are smaller than Li et al ’s results, differing by 9%. As we move towards peak abundance temperature (K), this difference increases slightly to 11%. The maximum difference between our and Li et al ’s DR rate coefficients is 40%, occuring at K. This difference is unlikely to be due to the positioning of resonances at low temperature, as we have previously shown that the DR rate coefficient is insensitive to positioning at threshold.
9.3 39-like
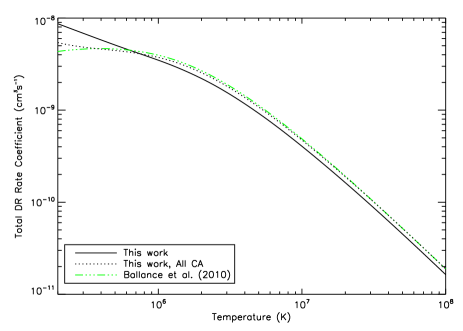
The only calculation available for 39-like was done by Ballance et al [49], who used a CA distorted wave (CADW) code, named dracula (Griffin et al [50]) to calculate DR for processes. In Figure 15 we have plotted Ballance et al ’s calculation, along with our total DR rate coefficient calculated in both IC and CA. The shape of all three curves matches very well from high temperatures down to K. The present CA results are in near perfect agreement with Ballance et al ’s, differing by % for temperatures K. As Ballance et al ’s calculation mirrors ours at high temperature, this shows our result is reliable. The difference between the present IC result and the CADW result is fairly constant between K, differing by 15-16%. Differences between all three curves appear for temperatures K. It has been shown previously that the low temperature DR rate coefficient in IC is insensitive to resonance positioning due to the desity of resonances near threshold. However, in the case of CA, there are far fewer resonances than in IC, meaning that any differences will be dependent upon the quality of the structure calculation.
9.4 37-like
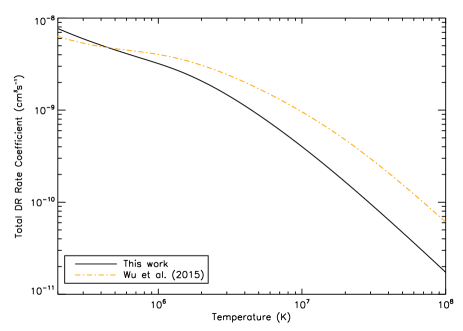
37-like is the simplest -shell ion with only a single electron. Interestingly, this ion has been considered twice by Wu et al [51, 52]. For the purpose of this comparison, we compare with the results of the latest analysis by the authors, where they calculated DR rate coefficients for 37-like using fac. In Figure 16 we have plotted our total DR rate coefficients for 37-like, along with Wu et al ’s [52] results. Large differences can be seen between our results and Wu et al ’s for temperatures K, with the differences gradually getting larger with increasing temperature. At peak abundance temperature, Wu et al ’s DR rate coefficients are larger than ours by a factor . A similar discrepancy was described in Preval et al [48], where other ions considered by Wu et al were also much larger than our own results. It was noted that the discrepancy between the two results could be reduced by removing the core-rearrangement configurations from Preval et al ’s inner shell DR calculations, hence, reducing high temperature Auger suppression. However, as noted earlier, the inner shell DR core excitation 3–4 only contributes 12% at peak abundance, and 14% at higher temperatures, meaning this cannot be the source of the discrepancy. We also note in our calculations that the high temperature DR rate coefficient does not vary much from ion to ion, and we are in close agreement with Ballance et al [49] for 39-like.
10 Conclusions
We have presented a series of DR and RR rate coefficient calculations for the -shell ions of tungsten spanning 37- to 46-like. The present work is the first consideration of the () ions of tungsten. The rich level structure of the ions, particularly for half-open ions, renders the level-resolved DR rate coefficient insensitive to shifts in the ground state energy due to a high density of resonances close to threshold.
Very few detailed calculations were available to compare the present results with. Relatively good agreement was seen between the present work, and the calculations performed by Ballance et al [49] for 39-like, and Li et al [25] for 45- and 46-like at peak abundance temperature. Very poor agreement was seen between the present work, and the calculations performed by Wu et al [51] and Safronova et al [16]. Unfortunately, it has still not been possible to pin down the reason for the difference between our calculations and Safronova et al ’s. We found that the present results were consistently smaller than the scaled ADPAK data of Pütterich et al [6] by a factor 3-4, and a factor 2-2.5 when compared to the unscaled data.
In terms of practical applications, revision of the -shell atomic data has shifted the peak abundance temperatures of these ions to values comparable to the projected pedestal temperature of ITER. This is significant, as it implies the lower ionization state tungsten ions (most notably the -shell ions) may not be as important as the higher ionization states.
With this paper, only 27 ionization stages remain to be calculated for The Tungsten Project. These stages span the -shell, and then continue into the and shells. Given the computational difficulty of the shell, we opt to next explore the lanthanide series of ions from 61-like to singly-ionized tungsten. We will then complete The Tungsten Project with a final paper covering the ions of tungsten, from 47- to 60-like.
References
References
- [1] Summers H P, Dickson W J, O’Mullane M G, Badnell N R, Whiteford A D, Brooks D H, Lang J, Loch S D and Griffin D C 2006 Plasma Phys. Control. Fusion 48 263–999999 URL http://stacks.iop.org/0741-3335/48/i=2/a=007
- [2] Kotschenreuther M, Hatch D R, Mahajan S, Valanju P, Zheng L and Liu X 2017 Nucl. Fusion 57 064001 URL http://dx.doi.org/10.1088/1741-4326/aa6416
- [3] Snyder P B, Groebner R J, Hughes J W, Osborne T H, Beurskens M, Leonard A W, Wilson H R and Xu X Q 2011 Nucl. Fusion 51 103016 URL http://dx.doi.org/10.1088/0029-5515/51/10/103016
- [4] Post D E, Jensen R V, Tarter C B, Grasberger W H and Lokke W A 1977 ADNDT 20 397–439 URL http://www.sciencedirect.com/science/article/pii/0092640X77900262
- [5] Post D, Abdallah J, Clark R E H and Putvinskaya N 1995 Phys. Plasmas 2 2328–2336 URL http://scitation.aip.org/content/aip/journal/pop/2/6/10.1063/1.871257
- [6] Pütterich T, Neu R, Dux R, Whiteford A D, O’Mullane M G and the ASDEX Upgrade Team 2008 Plasma Phys. Control. Fusion 50 085016 URL http://stacks.iop.org/0741-3335/50/i=8/a=085016
- [7] Foster A R 2008 On the Behaviour and Radiating Properties of Heavy Elements in Fusion Plasmas Ph.D. thesis University of Strathclyde http://www.adas.ac.uk/theses/foster_thesis.pdf
- [8] Burgess A 1965 ApJ 141 1588–1590 URL http://dx.doi.org/10.1086/148253
- [9] Badnell N R, O’Mullane M G, Summers H P, Altun Z, Bautista M A, Colgan J, Gorczyca T W, Mitnik D M, Pindzola M S and Zatsarinny O 2003 Astronomy and Astrophysics 406 1151–1165 ISSN 0004-6361 URL http://dx.doi.org/10.1051/0004-6361:20030816
- [10] Chung H K, Chen M H, Morgan W L, Ralchenko Y and Lee R W 2005 High Energy Density Physics 1 3–12 URL http://www.sciencedirect.com/science/article/pii/S1574181805000029
- [11] Kwon D H, Lee W, Preval S, Ballance C P, Behar E, Colgan J, Fontes C J, Nakano T, Li B, Ding X, Dong C Z, Fu Y B, Badnell N R, O’Mullane M, Chung H K and Braams B J 2017 Atomic Data and Nuclear Data Tables URL http://www.sciencedirect.com/science/article/pii/S0092640X17300220
- [12] Cowan R D 1981 The Theory of Atomic Structure and Spectra Los Alamos Series in Basic and Applied Sciences (University of California Press) ISBN 0520038215
- [13] Bar-Shalom A, Klapisch M and Oreg J 2001 JQSRT 71 169–188 URL http://www.sciencedirect.com/science/article/pii/S0022407301000668
- [14] Safronova U I, Safronova A S and Beiersdorfer P 2012 J. Phys. B 45 085001 URL http://stacks.iop.org/0953-4075/45/i=8/a=085001
- [15] Safronova U I and Safronova A S 2012 Phys. Rev. A 85 032507 URL http://link.aps.org/doi/10.1103/PhysRevA.85.032507
- [16] Safronova U I, Safronova A S, Beiersdorfer P and Johnson W R 2011 J. Phys. B 44 035005 URL http://stacks.iop.org/0953-4075/44/i=3/a=035005
- [17] Safronova U I, Safronova A S and Beiersdorfer P 2016 J. Phys. B 49 225002 URL http://stacks.iop.org/0953-4075/49/i=22/a=225002
- [18] Safronova U I, Safronova A S and Beiersdorfer P 2015 Phys. Rev. A 91 062507 URL http://dx.doi.org/10.1103/PhysRevA.91.062507
- [19] Safronova U I, Safronova A S and Beiersdorfer P 2012 Phys. Rev. A 86 042510 URL http://link.aps.org/doi/10.1103/PhysRevA.86.042510
- [20] Safronova U I, Safronova A S and Beiersdorfer P 2009 J. Phys. B 42 165010 URL http://stacks.iop.org/0953-4075/42/i=16/a=165010
- [21] Safronova U I, Safronova A S and Beiersdorfer P 2009 ADNDT 95 751–785 URL http://www.sciencedirect.com/science/article/pii/S0092640X09000278
- [22] Behar E, Peleg A, Doron R, Mandelbaum P and Schwob J L 1997 JQSRT 58 449–469 URL http://www.sciencedirect.com/science/article/pii/S0022407397000526
- [23] Behar E, Mandelbaum P and Schwob J L 1999 Eur. Phys. J. D 7 157–161 URL http://dx.doi.org/10.1007/s100530050361
- [24] Behar E, Mandelbaum P and Schwob J L 1999 Phys. Rev. A 59 2787–999999 URL http://link.aps.org/doi/10.1103/PhysRevA.59.2787
- [25] Li B W, O’Sullivan G, Fu Y B and Dong C Z 2012 Phys. Rev. A 85 052706 URL http://link.aps.org/doi/10.1103/PhysRevA.85.052706
- [26] Li M, Fu Y, Su M, Dong C and Koike F 2014 Plasma Sci. Technol. 16 182–187 URL http://dx.doi.org/10.1088/1009-0630/16/3/02
- [27] Li B, O’Sullivan G, Dong C and Chen X 2016 J. Phys. B 49 155201–999999 URL http://dx.doi.org/10.1088/0953-4075/49/15/155201
- [28] Kwon D H and Lee W 2016 JQSRT 170 182–999999 URL http://dx.doi.org/10.1016/j.jqsrt.2015.11.009
- [29] Kwon D H and Lee W 2016 JQSRT 179 98–104 URL http://dx.doi.org/10.1016/j.jqsrt.2016.03.016
- [30] Spruck K, Badnell N R, Krantz C, Novotný O, Becker A, Bernhardt D, Grieser M, Hahn M, Repnow R, Savin D W, Wolf A, Müller A and Schippers S 2014 Phys. Rev. A 90 032715 URL http://link.aps.org/doi/10.1103/PhysRevA.90.032715
- [31] Badnell N R, Spruck K, Krantz C, Novotný O, Becker A, Bernhardt D, Grieser M, Hahn M, Repnow R, Savin D W, Wolf A, Müller A and Schippers S 2016 Phys. Rev. A 93 052703 URL http://link.aps.org/doi/10.1103/PhysRevA.93.052703
- [32] Badnell N R, Ballance C P, Griffin D C and O’Mullane M 2012 Phys. Rev. A 85 052716 URL http://link.aps.org/doi/10.1103/PhysRevA.85.052716
- [33] Badnell N R 1986 J. Phys. B 19 3827 URL http://stacks.iop.org/0022-3700/19/i=22/a=023
- [34] Badnell N R 1997 J. Phys. B 30 1 URL http://stacks.iop.org/0953-4075/30/i=1/a=005
- [35] Badnell N R 2011 Comput. Phys. Commun. 182 1528 URL http://www.sciencedirect.com/science/article/pii/S0010465511001160
- [36] Dzuba V A, Flambaum V V, Gribakin G F and Harabati C 2012 Phys. Rev. A 86 022714 URL https://link.aps.org/doi/10.1103/PhysRevA.86.022714
- [37] Dzuba V A, Flambaum V V, Gribakin G F, Harabati C and Kozlov M G 2013 Phys. Rev. A 88 062713 URL https://link.aps.org/doi/10.1103/PhysRevA.88.062713
- [38] Berengut J C, Harabati C, Dzuba V A, Flambaum V V and Gribakin G F 2015 Phys. Rev. A 92 062717 URL https://link.aps.org/doi/10.1103/PhysRevA.92.062717
- [39] Harabati C, Berengut J C, Flambaum V V and Dzuba V A 2017 Journal of Physics B: Atomic, Molecular and Optical Physics 50 125004 URL http://stacks.iop.org/0953-4075/50/i=12/a=125004
- [40] Krantz C, Badnell N R, Müller A, Schippers S and Wolf A 2017 Journal of Physics B: Atomic, Molecular and Optical Physics 50 052001 URL http://stacks.iop.org/0953-4075/50/i=5/a=052001
- [41] Preval S P, Badnell N R and O’Mullane M G 2016 Phys. Rev. A 93 042703–999999 URL http://link.aps.org/doi/10.1103/PhysRevA.93.042703
- [42] Preval S P, Badnell N R and O’Mullane M G 2017 J. Phys. B 50 105201 URL http://stacks.iop.org/0953-4075/50/i=10/a=105201
- [43] Savin D W, Behar E, Kahn S M, Gwinner G, Saghiri A A, Schmitt M, Grieser M, Repnow R, Schwalm D, Wolf A, Bartsch T, Müller A, Schippers S, Badnell N R, Chen M H and Gorczyca T W 2002 ApJS 138 337–370 URL http://dx.doi.org/10.1086/323388
- [44] Ali, Orban, Mahmood, Loch and Schuch 2013 A&A 557 URL https://doi.org/10.1051/0004-6361/201220628
- [45] Synge J L 1957 The relativistic gas Series in physics (North-Holland Pub. Co.) URL https://books.google.co.uk/books?id=HM1-AAAAIAAJ
- [46] Badnell N R, Foster A, Griffin D C, Kilbane D, O’Mullane M and Summers H P 2011 Journal of Physics B Atomic Molecular Physics 44 135201 URL http://dx.doi.org/10.1088/0953-4075/44/13/135201
- [47] Loch S D, Ludlow J A, Pindzola M S, Whiteford A D and Griffin D C 2005 Phys. Rev. A 72 052716–999999 URL http://link.aps.org/doi/10.1103/PhysRevA.72.052716
- [48] Preval S P, Barstow M A, Badnell N R, Hubeny I and Holberg J B 2017 MNRAS 465 269–280 URL http://dx.doi.org/10.1093/mnras/stw2800
- [49] Ballance C P, Loch S D, Pindzola M S and Griffin D C 2010 J. Phys. B 43 205201–999999 URL http://dx.doi.org/10.1088/0953-4075/43/20/205201
- [50] Griffin D C, Pindzola M S and Bottcher C 1985 Phys. Rev. A 31 568–575 URL https://link.aps.org/doi/10.1103/PhysRevA.31.568
- [51] Wu Z, Fu Y, Ma X, Li M, Xie L, Jiang J and Dong C 2015 Atoms 3 474 URL http://www.mdpi.com/2218-2004/3/4/474
- [52] Wu Z, Zhang Y, Fu Y, Surzhykov A, Fritzsche S and Dong C 2015 Eur. Phys. J. D 69 140 URL http://dx.doi.org/10.1140/epjd/e2015-50634-6
| N-electron | -electron |
|---|---|
| Ion-like | Charge | Putt | Putt | This work | This work | % | % |
|---|---|---|---|---|---|---|---|
| 01-like | W73+ | 3.88[+9] | 0.440 | 4.06[+9] | 0.426 | 4.72 | -3.04 |
| 02-like | W72+ | 2.29[+9] | 0.442 | 2.46[+9] | 0.405 | 7.66 | -8.39 |
| 03-like | W71+ | 1.48[+9] | 0.360 | 1.64[+9] | 0.363 | 11.2 | 0.94 |
| 04-like | W70+ | 9.66[+8] | 0.294 | 1.06[+9] | 0.304 | 9.70 | 3.41 |
| 05-like | W69+ | 7.17[+8] | 0.247 | 7.67[+8] | 0.255 | 6.97 | 3.30 |
| 06-like | W68+ | 5.72[+8] | 0.218 | 5.97[+8] | 0.228 | 4.37 | 4.35 |
| 07-like | W67+ | 4.76[+8] | 0.199 | 4.84[+8] | 0.213 | 1.64 | 6.70 |
| 08-like | W66+ | 4.03[+8] | 0.189 | 3.98[+8] | 0.209 | -1.34 | 10.3 |
| 09-like | W65+ | 3.46[+8] | 0.195 | 3.32[+8] | 0.216 | -3.79 | 11.1 |
| 10-like | W64+ | 2.99[+8] | 0.214 | 2.82[+8] | 0.229 | -5.88 | 7.03 |
| 11-like | W63+ | 2.60[+8] | 0.202 | 2.43[+8] | 0.198 | -6.58 | -1.75 |
| 12-like | W62+ | 2.25[+8] | 0.188 | 2.11[+8] | 0.179 | -6.09 | -4.99 |
| 13-like | W61+ | 2.01[+8] | 0.182 | 1.89[+8] | 0.174 | -5.83 | -4.33 |
| 14-like | W60+ | 1.80[+8] | 0.172 | 1.70[+8] | 0.171 | -5.89 | -1.00 |
| 15-like | W59+ | 1.62[+8] | 0.163 | 1.52[+8] | 0.166 | -6.10 | 1.36 |
| 16-like | W58+ | 1.47[+8] | 0.157 | 1.38[+8] | 0.167 | -6.31 | 6.41 |
| 17-like | W57+ | 1.36[+8] | 0.139 | 1.27[+8] | 0.154 | -6.56 | 10.5 |
| 18-like | W56+ | 1.26[+8] | 0.140 | 1.16[+8] | 0.157 | -7.40 | 12.1 |
| 19-like | W55+ | 1.17[+8] | 0.147 | 1.07[+8] | 0.150 | -8.22 | 1.76 |
| 20-like | W54+ | 1.08[+8] | 0.150 | 9.83[+7] | 0.160 | -9.28 | 6.65 |
| 21-like | W53+ | 1.01[+8] | 0.148 | 9.01[+7] | 0.162 | -10.4 | 9.89 |
| 22-like | W52+ | 9.29[+7] | 0.144 | 8.33[+7] | 0.167 | -10.4 | 15.7 |
| 23-like | W51+ | 8.60[+7] | 0.143 | 7.73[+7] | 0.153 | -10.2 | 6.79 |
| 24-like | W50+ | 8.01[+7] | 0.146 | 7.14[+7] | 0.156 | -10.9 | 6.37 |
| 25-like | W49+ | 7.41[+7] | 0.159 | 6.57[+7] | 0.164 | -11.3 | 3.05 |
| 26-like | W48+ | 6.74[+7] | 0.181 | 6.02[+7] | 0.174 | -10.8 | -4.09 |
| 27-like | W47+ | 5.97[+7] | 0.136 | 5.47[+7] | 0.182 | -8.38 | 33.6 |
| 28-like | W46+ | 5.10[+7] | 0.353 | 5.03[+7] | 0.188 | -1.43 | -46.8 |
| 29-like | W45+ | 4.32[+7] | 0.227 | 4.62[+7] | 0.157 | 7.16 | -30.5 |
| 30-like | W44+ | 3.74[+7] | 0.196 | 4.21[+7] | 0.150 | 12.6 | -23.5 |
| 31-like | W43+ | 3.40[+7] | 0.194 | 3.79[+7] | 0.177 | 11.3 | -8.90 |
| 32-like | W42+ | 3.22[+7] | 0.108 | 3.30[+7] | 0.248 | 2.45 | 130 |
| 33-like | W41+ | 3.11[+7] | 0.044 | 2.94[+7] | 0.224 | -5.47 | 410 |
| 34-like | W40+ | 3.01[+7] | 0.052 | 2.59[+7] | 0.178 | -13.9 | 245 |
| 35-like | W39+ | 2.91[+7] | 0.049 | 2.29[+7] | 0.164 | -21.5 | 233 |
| 36-like | W38+ | 2.81[+7] | 0.093 | 2.05[+7] | 0.231 | -27.2 | 148 |
| 37-like | W37+ | 2.71[+7] | 0.099 | 1.88[+7] | 0.176 | -30.4 | 78.3 |
| 38-like | W36+ | 2.59[+7] | 0.118 | 1.75[+7] | 0.157 | -32.6 | 33.9 |
| 39-like | W35+ | 2.45[+7] | 0.143 | 1.63[+7] | 0.155 | -33.4 | 8.74 |
| 40-like | W34+ | 2.28[+7] | 0.180 | 1.53[+7] | 0.160 | -32.6 | -11.2 |
| 41-like | W33+ | 2.10[+7] | 0.165 | 1.45[+7] | 0.132 | -31.0 | -19.9 |
| 42-like | W32+ | 1.94[+7] | 0.156 | 1.37[+7] | 0.128 | -29.4 | -18.2 |
| 43-like | W31+ | 1.79[+7] | 0.155 | 1.31[+7] | 0.130 | -26.7 | -15.9 |
| 44-like | W30+ | 1.64[+7] | 0.159 | 1.26[+7] | 0.131 | -23.5 | -17.6 |
| 45-like | W29+ | 1.49[+7] | 0.169 | 1.20[+7] | 0.147 | -19.9 | -12.9 |
| 46-like | W28+ | 1.32[+7] | 0.177 | 1.12[+7] | 0.154 | -14.9 | -13.0 |
| Temp (K) | No Shift | Shift 0.01 | Shift 0.10 |
|---|---|---|---|
| 1.09[4] | 4.15[-8] | 3.78[-8] | 4.41[-8] |
| 2.18[4] | 2.77[-8] | 2.63[-8] | 2.74[-8] |
| 5.45[4] | 1.67[-8] | 1.63[-8] | 1.65[-8] |
| 1.09[5] | 1.20[-8] | 1.19[-8] | 1.20[-8] |
| 2.18[5] | 7.93[-9] | 7.88[-9] | 7.87[-9] |
| 5.44[5] | 4.29[-9] | 4.28[-9] | 4.26[-9] |
| 1.09[6] | 2.81[-9] | 2.80[-9] | 2.80[-9] |
| 2.18[6] | 1.66[-9] | 1.66[-9] | 1.66[-9] |
| 5.44[6] | 6.28[-10] | 6.27[-10] | 6.25[-10] |
| 1.09[7] | 2.57[-10] | 2.57[-10] | 2.56[-10] |
| 2.18[7] | 9.81[-11] | 9.80[-11] | 9.75[-11] |
| 5.44[7] | 2.57[-11] | 2.57[-11] | 2.56[-11] |
| 1.09[8] | 9.09[-12] | 9.09[-12] | 9.05[-12] |
| 2.18[8] | 3.13[-12] | 3.13[-12] | 3.12[-12] |
| 5.44[8] | 7.23[-13] | 7.23[-13] | 7.19[-13] |
| 1.09[9] | 2.20[-13] | 2.20[-13] | 2.19[-13] |
| 2.18[9] | 5.98[-14] | 5.97[-14] | 5.94[-14] |