The metallicity distribution of HI systems in the EAGLE cosmological simulations
Abstract
The metallicity of strong Hi systems, spanning from damped Lyman- absorbers (DLAs) to Lyman-limit systems (LLSs) is explored between using the EAGLE high-resolution cosmological hydrodynamic simulation of galaxy formation. The metallicities of LLSs and DLAs steadily increase with time in agreement with observations. DLAs are more metal rich than LLSs, although the metallicities in the LLS column density range () are relatively flat, evolving from a median Hi-weighted metallicity of at to by . The metal content of Hi systems tracks the increasing stellar content of the Universe, holding of the integrated total metals released from stars at . We also consider partial LLS (pLLS, ) metallicities, and find good agreement with Wotta et al. (2016) for the fraction of systems above (37%) and below (63%) . We also find a large dispersion of pLLS metallicities, although we do not reproduce the observed metallicity bimodality and instead we make the prediction that a larger sample will yield more pLLSs around . We under-predict the median metallicity of strong LLSs, and predict a population of DLAs at that are not observed, which may indicate more widespread early enrichment in the real Universe compared to EAGLE.
keywords:
methods: numerical; galaxies: evolution, formation; intergalactic medium; cosmology: theory; quasars: absorption lines1 introduction
Neutral hydrogen in the Universe is associated with the fundamental processes of galaxy formation, from the accretion of gas onto galaxies, the feeding of star formation within galaxies via neutral atomic reservoirs, and superwind feedback enriching the circumgalactic medium (CGM) and intergalactic medium (IGM). Observations show that the number density of Hi absorbers and their column densities increase closer to galaxies (e.g. , 2003; Chen & Mulchaey, 2009; Prochaska et al., 2017) indicating an intimate link between atomic gas and galaxy growth. Observing techniques rely on quasar absorption line spectroscopy toward a UV-bright background source to measure the column density of Hi absorbers (e.g. Weymann et al., 1998; Lehner et al., 2007; Danforth et al., 2016). Hi absorbers with columns having significant neutral fractions, which correspond roughly to Lyman Limit Systems (LLSs; ), generally have heavy element absorption indicating that this hydrogen is enriched with the products of stellar nucleosynthesis. The metallicity statistics and evolution of Hi provide crucial constraints on theoretical models of the flows of gas in and out of galaxies (e.g. Ocvirk et al., 2008; van de Voort & Schaye, 2012) and the census of cosmic metals produced by stars (e.g. , 2004, 2007; Peeples et al., 2014).
The trend of metallicity with Hi column density has been the subject of a number of observational surveys that focus on specific Hi column density ranges. In general, Lyman Limit Systems refer to absorbers with , but these are sub-divided into normal LLSs with and super LLSs (SLLSs) with , where damping wings begin to appear111SLLSs are sometimes referred to as sub-DLAs. Damped Lyman- absorbers (DLAs), defined by their damping wings, have column densities in excess of . Finally, partial LLSs (pLLSs) cover column densities . Metallicities are significantly sub-solar and in general increase with Hi column density (Lehner et al., 2013, 2016; Wotta et al., 2016), although this increase can be relatively mild or even flat as observed by Fumagalli et al. (2016) for LLSs and SLLSs with typical .
The evolution of Hi metallicities across the history of the Universe is the subject of Rafelski et al. (2014), who determines that DLA metallicities rise for at to at . SLLSs show a clear increase in from at to below (Fumagalli et al., 2016). LLSs and pLLSs also show an increase from at (Lehner et al., 2016) to having median metallicities of at (Wotta et al., 2016). This latter observation and the earlier study (Lehner et al., 2013) show intriguing metallicity bimodality for pLLSs with two distinct peaks at and . Increasing metallicity with time is the expectation of stellar nucleosynthesis enriching gas that initially holds the primordial abundances of Big Bang nucleosynthesis.
Simulation show DLAs are more often associated with gaseous reservoirs within galaxies (e.g. Fumagalli et al., 2011; van de Voort et al., 2012; Bird et al., 2014), and their evolution is likely related to the enrichment of the atomic interstellar medium (ISM) by the release of heavy elements at stellar death. Other previous simulations that have predicted DLA metallicities include Davé & Oppenheimer (2007), Pontzen et al. (2008), Tescari et al. (2009), and Cen (2012). LLSs, on the other hand, have been shown to trace lower density gas associated with the CGM outside of galaxies (e.g. Katz et al., 1996; Faucher-Giguère & Kereš, 2011; Rahmati & Schaye, 2014) and likely indicate energetic stellar and supermassive black hole feedback driving materials out of galaxies. The large spread of LLS metallicities suggests the tantalizing possibility that metal content is linked to physical processes regulating galaxy growth. For example, the pLLS metallicity bimodality could indicate the accretion of low- gas and the violent ejection of high- gas. The FIRE cosmological hydrodynamic zoom simulations do find this general trend in Hafen et al. (2017), although clear bimodality is not reproduced and instead a large spread of intermediate metallicities do not clearly distinguish inflows from outflows.
This work presents Hi metallicities across column density from pLLSs through DLAs and redshift from using the EAGLE (Evolution and Assembly of GaLaxies and their Environments) cosmological hydrodynamical simulation project (Schaye et al., 2015; Crain et al., 2015; McAlpine et al., 2016). These simulations have been shown to successfully reproduce a variety of galaxy observables (e.g. Schaye et al., 2015; Furlong et al., 2015; Trayford et al., 2015; Segers et al., 2016; Crain et al., 2017). Although, EAGLE was not calibrated based on observations of the IGM/CGM, the simulations show broad agreement with absorption line statistics probing Hi (Rahmati et al., 2015) and good agreement with metal ions in the IGM (Rahmati et al., 2016) and around star-forming galaxies (Turner et al., 2017). However, some metal ion statistics are under-predicted by EAGLE, including the IGM (Turner et al., 2016) and the higher column density metal absorbers in the IGM (Rahmati et al., 2016) when using the main Mpc “Reference” simulation. We use the Recal-L025N0752 high-resolution (HiRes) volume for our exploration here, which has higher resolution than the Reference EAGLE simulation, although less volume. This resolution was also used in the exploration of metal absorption in the CGM by Oppenheimer et al. (2016, 2018) using zooms including non-equilibrium effects. The HiRes suite of simulations, including these zooms that were shown to produce results consistent with the HiRes volume, indicates better agreement for observed high column density metal absorbers than the main EAGLE simulation. We therefore further explore this volume for the metallicity distribution of strong Hi absorbers across the cosmic history of our Universe in this paper.
The structure of this paper is as follows. We introduce the EAGLE HiRes simulation in §2 and discuss our method to calculate Hi metallicities. We present main results in §3 focusing first on the metallicity distribution of Hi systems §3.1 and then modelling the pLLS and LLS metallicity distributions observed by Wotta et al. (2016) in §3.2. We summarize the paper in 4. Solar metallicity is set to (Asplund et al., 2009).
2 Methodology
2.1 Simulations
We use the Recal-L025N0752 EAGLE HiRes cosmological hydrodynamical simulation of galaxy formation, which uses a heavily modified version of GADGET-3 last described in (2005). We invite the interested reader to find a detailed description of the code in Schaye et al. (2015) and Crain et al. (2015). Briefly, subgrid prescriptions for radiative cooling (, 2009a), star formation (Schaye & Dalla Vecchia, 2008), stellar evolution and chemical enrichment (, 2009b), as well as superwind feedback associated with star formation (Dalla Vecchia & Schaye, 2012) and black hole (BH) growth (Rosas-Guevara et al., 2015) are included. The metallicity dependent density threshold for star formation calculated by Schaye (2004) is used, which can alter DLA metallicities by affecting the transition between warm, atomic and cold, molecular ISM. EAGLE uses the “Anarchy” formulation of smooth particle hydrodynamics (SPH) (, 2015), which was shown to reduce the amount of Hi-traced clumps in a hot medium relative to standard SPH. Planck Collaboration (2014) cosmological parameters are assumed.
2.2 Hi and metallicity calculation
For calculating the simulated Hi column densities we account for the main ionizing processes that shape the distribution of neutral hydrogen. Those include collisional ionization, which is dominant at high temperatures, and photoionization by the metagalactic ultraviolet background (UVB) radiation, which contributes to the bulk of hydrogen ionization on cosmic scales, particularly at (e.g., Rahmati et al., 2013a). On smaller scales and close to sources, local radiation could be the dominant source of photoionization. However, including the impact of local radiation even with detailed radiative transfer simulations is hindered by other uncertainties such as the ISM physics on small scales (Rahmati et al., 2013b), and is beyond the scope of this study.
We use the UVB model of Haardt & Madau (2001) to account for the mean ionizing radiation field from quasars and galaxies. The same UVB model was also used for calculating radiative heating/cooling rates in the hydrodynamical simulations. Moreover, this UVB model has been shown to reproduce results consistent with the observed column density distribution function of Hi and highly ionized ions (Rahmati et al., 2013a, 2015, 2016).
To account for the self-shielding of gas at , we use the fitting function presented in Rahmati et al. (2013a) for calculating the photoionization rate and hence the ionization state of hydrogen atoms. This fitting function accurately reproduces the result from radiative transfer simulations of the UVB and recombination radiation in cosmological density fields using TRAPHIC (Pawlik & Schaye, 2008, 2011; Raičevic̀ et al., 2013). Moreover, because the temperature of star-forming gas in our simulations is defined by a polytropic equation of state that is used to limit the Jeans mass, and therefore is not physical, for calculating collisional ionization and photoionization rates we set the temperature of the ISM particles to , which is the typical temperature of the warm-neutral ISM.
Furthermore, to account for the conversion of atomic hydrogen to molecular hydrogen, H2, we us the empirical pressure law based on the Blitz & Rosolowsky (2006) relation. However, we note that this procedure only affects HI column densities higher than (Rahmati et al., 2013a) and therefore not very relevant for our results in this work.
To calculate Hi column densities we use SPH interpolation and project the Hi content of the full simulation onto a 2-D grid. We use the same projection technique to calculate the Hi-weighted metallicity in each cell, using SPH smoothed metallicities of SPH particles along the projection direction. We found that using a grid with pixels for projecting the full box of the Recal-L025N0752 simulation results in converged metallicities and Hi column densities for , which is the range of Hi column densities we study in this work. We use 8 slices with equal widths for calculating the Hi column densities in the full simulation box. This enables us to calculate Hi column densities as low as without being affected by projection effects. Rahmati et al. (2013a) checked that the projection technique does not commonly lead to multiple overlapping Hi absorbers being combined into a single, stronger absorber, and using multiple slices further prevents overlap affecting statistics.
3 Results
3.1 Metallicity distribution of Hi systems
Using the projection technique described in §2.2, we produce pairs of Hi column densities and their associated metallicities for each snapshot of the Recal-L025N0752 simulation. We use this data to explore the metallicity distribution of Hi systems and its evolution.
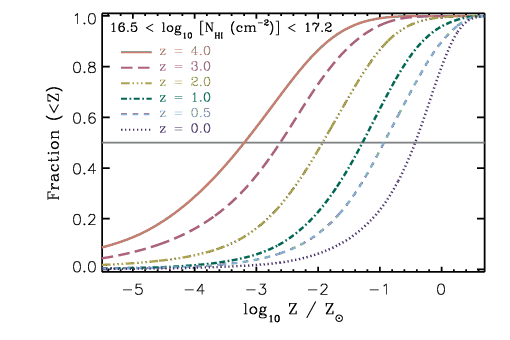
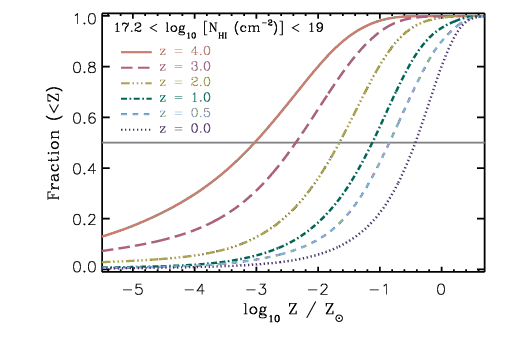
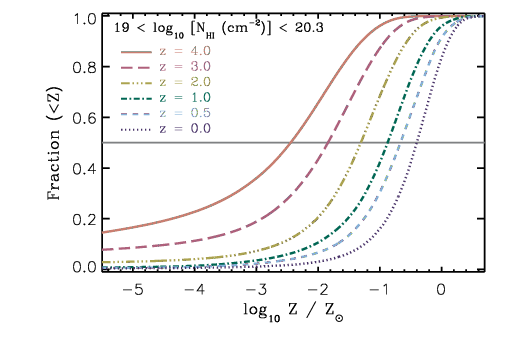
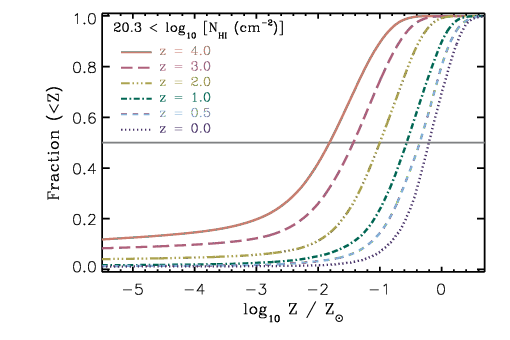
The cumulative metallicity distribution functions (CMDFs) of Hi systems at different redshifts are shown in Figure 1. Panels in this figure from top-left to bottom-right correspond to absorbers with different Hi column densities: pLLSs with , LLSs with , SLLSs with and DLAs with . The evolution of the CMDFs of each group of Hi systems are shown using curves with different line-styles in each panel. As the panels illustrate, the CMDFs of all considered Hi systems evolves strongly and the typical metallicity of all systems increases with decreasing redshift. Another conclusion one can draw from this figure is that the metallicity evolution is stronger for systems with lower Hi column densities, which also have lower typical metallicities. The CMDFs are not symmetric in logarithmic space and have long tails towards very low metallicities for all Hi column densities, which become greater with increasing redshift for all Hi column densities.
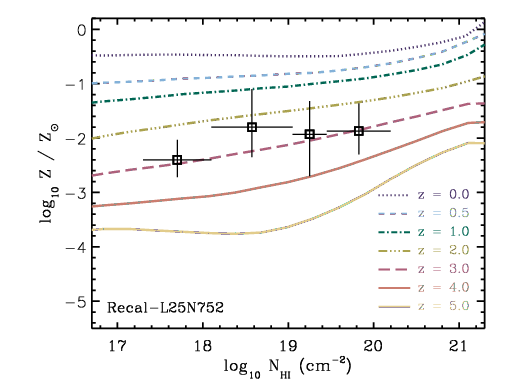
To compare our predictions against existing observational constraints in Figure 2, we show the median metallicity of Hi systems as a function of their Hi column densities at different redshifts. The result shows that the median metallicity of Hi systems increases mildly with at all redshifts but evolves much more strongly with redshift at fixed column density. Moreover, our predictions are in good agreement with observational data at shown using squares with error bars taken from Fumagalli et al. (2016, their Fig. 15) for a redshift range .
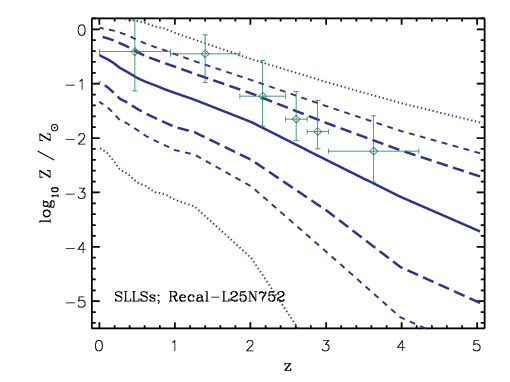
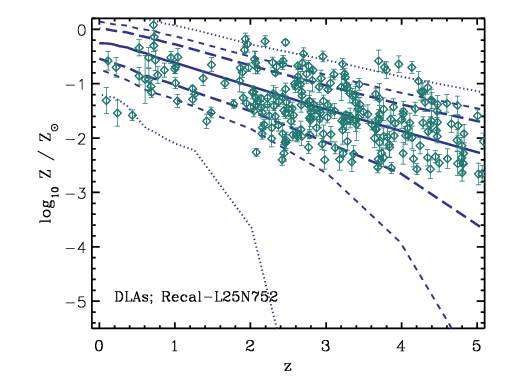
The comparison between the metallicity distributions of DLAs and SLLSs at different redshifts is shown in Figure 3. The left and right panels respectively show metallicities of SLLSs and DLAs as a function of redshifts. In each panel, the solid curve shows the median metallicity of absorbers as a function of redshift while long-dashed, dashed and dotted curves show the 25th-75th, 15th-85th and 5th-95th percentiles. The data points on the left panels show the observational constraints on the metallicity of SLLSs from Fumagalli et al. (2016). The data points on the right panel are a compilation of available observational constraints from Rafelski et al. (2014). The simulation results show overlap with observations, particularly for DLAs at while the observed metallicity of SLLSs are slightly underproduced in the simulations. Interestingly, it appears from the right panel of Fig. 3 that the very low-metallicity DLAs in our predictions are missing from the observed sample, particularly at .
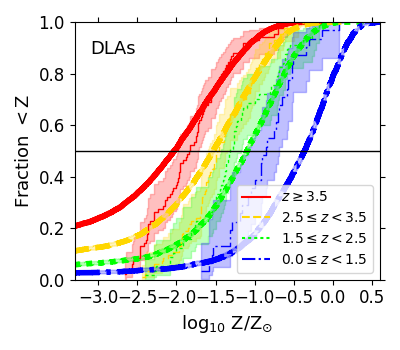
To better compare the simulation to observation for DLAs, we use the python module Simulation Mocker Of Hubble Absorption-Line Observational Surveys (SMOHALOS) described in Oppenheimer et al. (2016) to simulate the CMDFs of the Rafelski et al. (2014) sample by matching the column density and redshift to the observed sample in Figure 4. Random selection of column density (within dex) and redshift (using the 7 redshifts plotted in Fig. 2) is performed by selecting absorbers from the entire Recal-L025N0752 volume. We plot CMDFs of the observations split into 4 redshift bins with thin lines and shading corresponding to 95% confidence limits. The simulated CMDF predictions are shown in thick lines without confidence limits, and better illuminate the deviations from observed relations. The simulations predict more low-metallicity DLAs than observed at , but they also predict more high-metallicity DLAs than observed, especially at super-solar levels. The bin is the least populated with observations, and it will be interesting to see if further observations show the slower evolution in DLA metallicities than our model predicts.
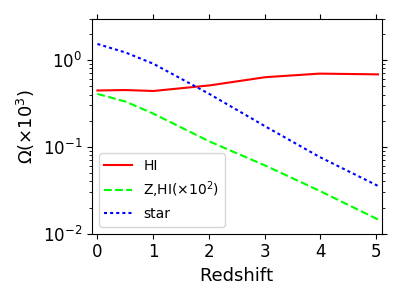
We also sum the cosmic density of Hi, integrated across the Hi column density distribution in Figure 5 (solid line) and compare it to the cosmic density of metals in Hi (dashed line, multiplied by ). Both these sums are dominated by DLAs. The increase in contrasts to the relative invariance in , and better reflects the evolving cosmic density of stars (dotted line) in the Recal-L025N0752 volume. 3.2% of all baryons are in stars by , which compares to 0.9% for cosmic Hi mass. The Hi metallicity is at , and the total cosmic metal budget traced in Hi gas is . Far more metals remain trapped in stars and injected into other phases of the CGM and IGM.
3.2 Simulations of the Wotta et al. (2016) absorbers
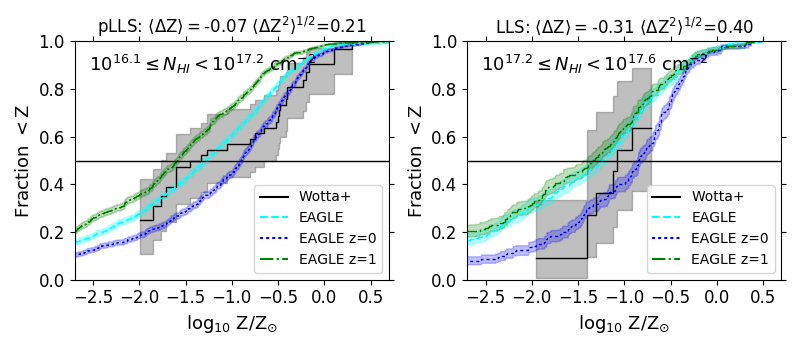
We use SMOHALOS to simulate the CMDFs of observed pLLSs and LLSs of Wotta et al. (2016) by matching the column density and redshift of simulated absorbers. The CMDFs of 100 SMOHALOS realizations are shown in the left panels of Figure 6 for their pLLSs (left) and LLSs (right). Random selection of column density (within dex) and redshift (within using 10 snapshots between ) is performed by selecting absorbers from the entire Recal-L025N0752 volume. Metallicities are calculated using Hi-weighted metallicities in mock spectra generated using SpecWizard, described in (2003), and produce statistically consistent results with the pixel method described in §2.2 and used throughout §3.1. CMDFs have shading corresponding to the confidence limits, which are small for the 100 SMOHALOS realizations in these panels, but larger for the Wotta et al. (2016) observed distributions. The two-sided Kaplan-Meier estimator described in Oppenheimer et al. (2018) is applied to observations to account for both upper limits due to non-detections of metal lines and lower limits due to saturated metal lines. These censored measurements hardly affect the CMDFs other than truncating the pLLSs before they reach zero at low metallicity due to upper limits and the LLSs before they reach one at high metallicity due to lower limits.
The simulations do not reproduce the observed pLLS bimodality, which appears in the Wotta et al. (2016) CMDF as a flattening around , where very few absorbers exist. We plot the CMDF with confidence limits as opposed to the histogram of metallicities to show the - dispersion expected in observations. The simulated pLLS CMDF has a median metallicity of . The fraction of our pLLS sample below (above) is 63% (37%), and the 16th (84th) percentiles of the pLLS metallicities are () . Our median metallicities are lower than Hafen et al. (2017) ( in their Fig. 9), although we do find a larger dispersion of metallicities than the FIRE simulations. Like us, Hafen et al. (2017) finds a shallow metallicity dependence between .
The average offset of our metallicities from Wotta et al. (2016), , is logarithmic dex for pLLSs and dex for LLSs indicating great agreement for the former and a slight under-estimate in simulations for the latter. We also quote the typical rms dispersion in between these two samples at and dex. Like Wotta et al. (2016), we perform statistical tests relating to bimodality on the SMOHALOS pLLS realizations. They found the Gaussian Mixture Model (GMM; Muratov & Gnedin, 2010) rejected a unimodal distribution at a confidence level and the dip statistic (Hartigan & Hartigan, 1985) predicts a chance that the observed distribution is bimodal or multimodal. We find the GMM rejects a unimodal distribution at a confidence level 41% of the time. Interestingly, the highest dip statistic in 100 SMOHALOS realization is 91.2% and the median is 20.2%. In fact, upon running 1000 realizations, we find only one as high as Wotta et al. (2016). Therefore, we conclude that while our realizations often reject unimodal distributions according to the GMM, they almost never reproduce the same degree of multimodality from the dip statistic.
We argue that a larger sample size for pLLSs (44) is necessary before a bimodal metal distribution can be statistically confirmed. For example, a CMDF with a uniform distribution between would also fall within the 95% confidence limits of the observations. However, we also note that the degree of bimodality in Wotta et al. (2016) is not exactly reproduced by any of our realizations, which makes expanding the observed sample important.
Figure 6 also shows SMOHALOS realizations using a fixed redshift of and but the same distribution of column densities to demonstrate that redshift evolution is a significant factor in our simulated distribution. We predict a increase in median pLLS metallicity from at to at . We find a smaller evolution (0.2 dex) when we simulate the Wotta et al. (2016) pLLS CMDFs in two equally sized redshift bins split at ; however the Wotta et al. (2016) data has higher metallicities in the high- sample with 10 of 14 pLLSs at arising at . Our simulated metallicity evolution that differs from observations is a central reason why we fail to simulate pLLS bimodality, and we argue sampling the metallicity evolution of shielded and partially shielded Hi absorbers over the last 8 Gyrs of cosmic history should continue to be an observational priority.
4 Summary and conclusions
We have explored the metallicities of Hi gas in the EAGLE HiRes volume across cosmic time from . Our results indicate a steady increase in the metallicities of LLSs and DLAs over the nearly 13 Gyrs of cosmic time spanned by our study reflecting the growing stellar content of the Universe. DLAs are more metal rich than LLSs in general, although there exists a relatively flat dependence of metallicity across the range of column densities spanning from pLLSs to SLLSs. We predict that on the order of 5% of metals nucleosynthesized in and released from stars end up in Hi-traced gas at .
Comparisons with observations show some encouraging agreement when considering the metallicity of LLSs (Fumagalli et al., 2016), as well as the evolution of the median metallicity of DLAs (Rafelski et al., 2014) and LLSs (Lehner et al., 2016; Wotta et al., 2016). We predict a significant population of low-metallicity, DLAs that are not observed, which could indicate widespread, early enrichment that is not properly simulated in EAGLE. More observations of high- DLAs could provide crucial constraints on the enrichment by primordial galaxies and stars. We show adequate matches with the median metallicity and the spread of the pLLS distribution, although we do not reproduce the bimodal metallicity distribution observed by Wotta et al. (2016). We predict more observations will yield more pLLSs and higher pLLS metallicities as evolution proceeds from . SLLS metallicity appears to be under-predicted by our simulations, while DLA metallicity is over-predicted.
This work represents a first step in using the EAGLE model to understand the enriched content of the Hi-traced Universe. We will be working to link these metals to their source galaxies using our self-consistent, evolutionary model contained within EAGLE. We create a URL, http://www.colorado.edu/casa/h1metals, for users to access the simulation data and data from these plots.
Acknowledgments
We thank the EAGLE consortium for making the simulations available. The authors acknowledge Zachary Hafen, Nicolas Lehner, and Joop Schaye for reading this manuscript and offering helpful suggestions. We also wish to thank Chris Wotta for providing us the software and expertise to run statistical tests on our simulated datasets. BDO’s contribution to this work was supported by the Hubble Theory grant HST-AR-13262.
References
- (1) Adelberger, K. L., Steidel, C. C., Shapley, A. E., & Pettini, M. 2003, ApJ, 584, 45
- Asplund et al. (2009) Asplund, M., Grevesse, N., Sauval, A. J., Scott, P. 2009, ARA&A, 47, 481
- Bird et al. (2014) Bird, S., Vogelsberger, M., Haehnelt, M., et al. 2014, MNRAS, 445, 2313
- Blitz & Rosolowsky (2006) Blitz, L., & Rosolowsky, E. 2006, ApJ, 650, 933
- (5) Bouché, N., Lehnert, M. D., Aguirre, A., et al. 2007, MNRAS, 378, 525
- Cen (2012) Cen, R. 2012, ApJ, 748, 121
- Chen & Mulchaey (2009) Chen, H.-W., & Mulchaey, J. S. 2009, ApJ, 701, 1219
- Crain et al. (2015) Crain, R. A., Schaye, J., Bower, R. G., et al. 2015, MNRAS, 450, 1937
- Crain et al. (2017) Crain, R. A., Bahé, Y. M., Lagos, C. d. P., et al. 2017, MNRAS, 464, 4204
- Dalla Vecchia & Schaye (2012) Dalla Vecchia, C., & Schaye, J. 2012, MNRAS, 426, 140
- Danforth et al. (2016) Danforth, C. W., Keeney, B. A., Tilton, E. M., et al. 2016, ApJ, 817, 111
- Davé & Oppenheimer (2007) Davé, R., & Oppenheimer, B. D. 2007, MNRAS, 374, 427
- Faucher-Giguère & Kereš (2011) Faucher-Giguère, C.-A., & Kereš, D. 2011, MNRAS, 412, L118
- (14) Fukigita, M. & Peebles, P. J. E. 2004, ApJ, 616, 643
- Fumagalli et al. (2011) Fumagalli, M., Prochaska, J. X., Kasen, D., et al. 2011, MNRAS, 418, 1796
- Fumagalli et al. (2016) Fumagalli, M., O’Meara, J. M., & Prochaska, J. X. 2016, MNRAS, 455, 4100
- Furlong et al. (2015) Furlong, M., Bower, R. G., Theuns, T., et al. 2015, MNRAS, 450, 4486
- Haardt & Madau (2001) Haardt F., Madau P., 2001, in Clusters of Galaxies and the High Redshift Universe Observed in X-rays, Neumann D. M., Tran J. T. V., eds.
- Hartigan & Hartigan (1985) Hartigan, J. A., & Hartigan, P. M. 1985, AnSta, 13, 70
- Hafen et al. (2017) Hafen, Z., Faucher-Giguère, C.-A., Anglés-Alcázar, D., et al. 2017, MNRAS, 469, 2292
- Katz et al. (1996) Katz, N., Weinberg, D. H., Hernquist, L., & Miralda-Escude, J. 1996, ApJ, 457, L57
- Lehner et al. (2007) Lehner, N., Savage, B. D., Richter, P., et al. 2007, ApJ, 658, 680
- Lehner et al. (2013) Lehner, N., Howk, J. C., Tripp, T. M., et al. 2013, ApJ, 770, 138
- Lehner et al. (2016) Lehner, N., O’Meara, J. M., Howk, J. C., Prochaska, J. X., & Fumagalli, M. 2016, ApJ, 833, 283
- McAlpine et al. (2016) McAlpine, S., Helly, J. C., Schaller, M., et al. 2016, Astronomy and Computing, 15, 72
- Muratov & Gnedin (2010) Muratov, A. L., & Gnedin, O. Y. 2010, ApJ, 718, 1266
- Ocvirk et al. (2008) Ocvirk, P., Pichon, C., & Teyssier, R. 2008, MNRAS, 390, 1326
- Oppenheimer et al. (2016) Oppenheimer, B. D., Crain, R. A., Schaye, J., et al. 2016, MNRAS, 460, 2157
- Oppenheimer et al. (2018) Oppenheimer, B. D., Schaye, J., Crain, R., et al. 2017, submitted
- Pawlik & Schaye (2008) Pawlik, A. H., & Schaye, J. 2008, MNRAS, 389, 651
- Pawlik & Schaye (2011) Pawlik, A. H., & Schaye, J. 2011, MNRAS, 412, 1943
- Peeples et al. (2014) Peeples, M. S., Werk, J. K., Tumlinson, J., et al. 2014, ApJ, 786, 54
- Planck Collaboration (2014) Planck Collaboration, 2014, A&A, 571, A1
- Pontzen et al. (2008) Pontzen, A., Governato, F., Pettini, M., et al. 2008, MNRAS, 390, 1349
- Prochaska et al. (2017) Prochaska, J. X., Werk, J. K., Worseck, G., et al. 2017, ApJ, 837, 169
- Rafelski et al. (2014) Rafelski, M., Neeleman, M., Fumagalli, M., Wolfe, A. M., & Prochaska, J. X. 2014, ApJ, 782, L29
- Rahmati et al. (2013a) Rahmati, A., Pawlik, A. H., Raičevic̀, M., & Schaye, J. 2013a, MNRAS, 430, 2427
- Rahmati et al. (2013b) Rahmati, A., Schaye, J., Pawlik, A. H., & Raičevic̀, M. 2013b, MNRAS, 431, 2261
- Rahmati & Schaye (2014) Rahmati, A., & Schaye, J. 2014, MNRAS, 438, 529
- Rahmati et al. (2015) Rahmati, A., Schaye, J., Bower, R. G., et al. 2015, MNRAS, 452, 2034
- Rahmati et al. (2016) Rahmati, A., Schaye, J, Crain, R. A., et al. 2016, MNRAS, 459, 310
- Raičevic̀ et al. (2013) Raičevic̀, M., Pawlik, A. H., Schaye, J. & Rahmati, A. 2014, MNRAS, 437, 2816
- Rosas-Guevara et al. (2015) Rosas-Guevara, Y. M., Bower, R. G., Schaye, J., et al. 2015, MNRAS, 454, 1038
- (44) Schaller, M., Dalla Vecchia, C., Schaye, J., et al. 2015, MNRAS, 454, 2277
- (45) Schaye, J., Aguirre, A., Kim, T.-S., Theuns, T., Rauch, M., & Sargent, W.L.W. 2003, ApJ, 596, 768
- Schaye (2004) Schaye, J. 2004, ApJ, 609, 667
- Schaye & Dalla Vecchia (2008) Schaye, J., & Dalla Vecchia, C. 2008, MNRAS, 383, 1210
- Schaye et al. (2015) Schaye, J., Crain, R. A., Bower, R. G., et al. 2015, MNRAS, 446, 521
- Segers et al. (2016) Segers, M. C., Crain, R. A., Schaye, J., et al. 2016, MNRAS, 456, 1235
- (50) Springel, V. 2005, MNRAS, 364, 1105
- Tescari et al. (2009) Tescari, E., Viel, M., Tornatore, L., & Borgani, S. 2009, MNRAS, 397, 411
- Trayford et al. (2015) Trayford, J. W., Theuns, T., Bower, R. G., et al. 2015, MNRAS, 452, 2879
- Turner et al. (2016) Turner, M. L., Schaye, J., Crain, R. A., Theuns, T., & Wendt, M. 2016, MNRAS, 462, 2440
- Turner et al. (2017) Turner, M. L., Schaye, J., Crain, R. A., et al. 2017, MNRAS, 471, 690
- van de Voort & Schaye (2012) van de Voort, F., & Schaye, J. 2012, MNRAS, 423, 2991
- van de Voort et al. (2012) van de Voort, F., Schaye, J., Altay, G., & Theuns, T. 2012, MNRAS, 421, 2809
- Weymann et al. (1998) Weymann, R. J., Jannuzi, B. T., Lu, L., et al. 1998, ApJ, 506, 1
- (58) Wiersma, R. P. C., Schaye, J., & Smith, B. D. 2009, MNRAS, 393, 99
- (59) Wiersma, R. P. C., Schaye, J., Theuns, T., Dalla Vecchia, C., & Tornatore, L. 2009, 399, 574
- Wotta et al. (2016) Wotta, C. B., Lehner, N., Howk, J. C., O’Meara, J. M., & Prochaska, J. X. 2016, ApJ, 831, 95