The origin of the diverse morphologies and kinematics of Milky Way-mass galaxies in the FIRE-2 simulations
Abstract
We use hydrodynamic cosmological zoom-in simulations from the FIRE project to explore the morphologies and kinematics of fifteen Milky Way (MW)-mass galaxies. Our sample ranges from compact, bulge-dominated systems with 90% of their stellar mass within to well-ordered disks that reach . The gas in our galaxies always forms a thin, rotation-supported disk at , with sizes primarily determined by the gas mass. For stars, we quantify kinematics and morphology both via the fraction of stars on disk-like orbits and with the radial extent of the stellar disk. In this mass range, stellar morphology and kinematics are poorly correlated with the properties of the halo available from dark matter-only simulations (halo merger history, spin, or formation time). They more strongly correlate with the gaseous histories of the galaxies: those that maintain a high gas mass in the disk after develop well-ordered stellar disks. The best predictor of morphology we identify is the spin of the gas in the halo at the time the galaxy formed of its stars (i.e. the gas that builds the galaxy). High- mergers, before a hot halo emerges, produce some of the most massive bulges in the sample (from compact disks in gas-rich mergers), while later-forming bulges typically originate from internal processes, as satellites are stripped of gas before the galaxies merge. Moreover, most stars in MW-mass galaxies (even bulge stars) form in a disk: of stars begin their lives rotationally supported.
keywords:
galaxies: structure – galaxies: formation – galaxies: evolution – galaxies: bulges – galaxies: spiral – cosmology: theory1 Introduction
Galactic morphologies vary widely. Broadly speaking, galaxies range from elliptical, dispersion-supported systems to disk-dominated structures where the majority of stars are on well-ordered circular orbits (e.g. Hubble, 1926; Huertas-Company et al., 2011). The former dominate at both the high-mass end (e.g. Bamford et al., 2009) and at the low-mass end (e.g. Wheeler et al., 2017), with disky galaxies emerging primarily at intermediate stellar masses of (e.g. Simons et al., 2015). The preponderance of ellipticals at the high-mass end is typically associated with these galaxies growing primarily through dry mergers (van Dokkum, 2005; van Dokkum et al., 2010; Rodríguez-Puebla et al., 2017), which scramble stellar orbits and promote bulge formation (e.g. White & Rees, 1978; Hopkins et al., 2009a; Stewart et al., 2009; Hopkins et al., 2010). At the low-mass end, stars are both born out of gas with a high degree of pressure support (rather than rotational support), and they are then dynamically heated by the repeated cycles of gas blowouts that continue to in halos (Kaufmann et al., 2007; Pontzen & Governato, 2012; Governato et al., 2012; Di Cintio et al., 2014a, b; Oñorbe et al., 2015; Chan et al., 2015; Wheeler et al., 2017; El-Badry et al., 2016, 2017; Anglés-Alcázar et al., 2017; Sparre et al., 2017; Faucher-Giguère, 2018).
At intermediate masses, however, the exact properties of a galaxy and/or halo that drive the morphology of that system remain relatively poorly understood. Mo, Mao & White (1998, hereafter MMW98) reproduced both the population of disk galaxies and the properties of damped Ly systems in semi-analytic models by assuming (1) galaxy sizes are determined by their angular momentum, (2) the baryons in a galaxy acquire their angular momentum from the host dark matter (DM) halo, (3) DM halos respond adiabatically to the growth of galaxies, and (4) baryons initially have the same density profile as DM (also see Fall & Efstathiou, 1980; Fall, 1983; Romanowsky & Fall, 2012; Fall & Romanowsky, 2013). This model therefore predicts that the size of a galactic disk (relative to the radius of the halo) depends primarily on the spin of the host DM halo, such that elliptical galaxies reside in low angular momentum halos.
Though the MMW98 paradigm broadly reproduces the galactic population, it has not been possible to directly test it against hydrodynamic simulations that include star formation and feedback, the latter of which appears to be particularly important for regulating the angular momentum (and therefore shapes) of galaxies. Such simulations typically fall into two categories: large-volumes simulations such as Illustris (Vogelsberger et al., 2014b, a), Illustris-TNG (Weinberger et al., 2017; Pillepich et al., 2017), and EAGLE (Schaye et al., 2015); and “zoom-in” simulations (Katz & White, 1993; Oñorbe et al., 2014) that focus on individual systems. While the former contain huge populations of galaxies in a given mass bin (), each galaxy typically contains resolution elements, with spatial resolutions , such that it is impossible to fully resolve the vertical scale lengths of MW-like disks. However, recent work with this style of simulations have managed to broadly reproduce the observed Hubble sequence of galaxy types (e.g. Pedrosa et al., 2014; Pedrosa & Tissera, 2015; Genel et al., 2015; Teklu et al., 2015; Zavala et al., 2016; Genel et al., 2017). In particular, Rodriguez-Gomez et al. (2017) found that the morphologies of massive systems () in the Illustris simulation are determined by their merger histories, while the morphologies of low mass galaxies () correlate with their host halo spin. However, they found that neither spin nor merger history could individually explain morphologies at the intermediate mass scale occupied by the MW.
Conversely, zoom-in simulations excel at resolving the structure of the galaxy (or galaxies) that they target, but each additional galaxy incurs a significant CPU cost, such that many suites of zoom-in simulations only include a few galaxies at a given mass simulated with a given physical model. There are thus only a few suites of hydrodynamic zoom-in runs (e.g. GIMIC, Crain et al., 2009; MAGICC, Stinson et al., 2012; NIHAO, Wang et al., 2015; Auriga, Grand et al., 2017) that have the sample size to test and explore even basic correlations between morphology and halo properties (such as the MMW98 model). However, some trends have emerged across a number of analyses of various zoom-in simulations, which have generally become successful in recent years at producing realistic disk galaxies (Governato et al., 2007, 2009; Scannapieco et al., 2009; Guedes et al., 2011; Aumer et al., 2013; Marinacci et al., 2014; Fiacconi et al., 2015; Murante et al., 2015; Colín et al., 2016). A wide variety of authors using different simulation codes agree that stellar feedback is crucial for regulating star formation in low angular momentum material, which otherwise quickly collapses to form overly-massive bulge components (Okamoto et al., 2005; Scannapieco et al., 2008; Agertz et al., 2011; Roškar et al., 2014; Agertz & Kravtsov, 2016; Brooks & Christensen, 2016).
Some of these authors have examined the conditions that lead to disk formation. For example, Springel & Hernquist (2005) and Robertson et al. (2006) found that mergers of gas-rich galaxies can result in an extended star-forming disk, rather than a bulge-dominated system (also see Robertson & Bullock, 2008). Similarly, Governato et al. (2007) found that a substantial disk formed following a gas-rich major merger in a cosmological simulation. Governato et al. (2009) also examined the distribution of light at in a galaxy that experienced a major merger at , and found that this violent merger primarily grows the disk, rather the bulge. Combined with the passive evolution of the older stars in the bulge, this fresh star formation results in a bright, blue stellar disk. Together, these results suggest that gas-rich major mergers can lead to extended stellar disks (Hopkins et al., 2009b), particularly if they occur at late times when the potential is deep enough to prevent the burst-quench cycles that occur at higher redshift (Muratov et al., 2015; Sparre et al., 2017; Faucher-Giguère, 2018), which heat stellar orbits and generally inhibit disk formation.
Other works have used suites (of varying sizes) of zoom-in simulations to attempt to uncover the underlying drivers of stellar morphology. Scannapieco et al. (2009), for example, argued that the fraction of mass in the disk does not depend on the spin parameter of the halo, but instead that the individual formation history of each galaxy is crucial to predicting its morphology. They also showed that spheroidal (bulge) components typically form earlier, while disks tend to form at later times from the inside-out (also see Aumer et al., 2013; Sokołowska et al., 2017), in general agreement with observations tracing the evolution of the kinematics of gas in galaxies (Simons et al., 2017). Using a set of 100 MW-mass halos in high-resolution regions embedded within the Millennium (Springel et al., 2005) simulation volume, Sales et al. (2012) similarly found that galaxy morphology was not correlated with the spin of the halo. They then further showed that it also does not monotonically depend on either the halo formation time (which scales with the concentration of a halo; e.g. Ludlow et al., 2014) or the merger history: even halos that grow significantly through major mergers can host either a disk-dominated or a bulge-dominated system at . Instead, they argued that the star formation history is key: disks tend to form gradually and at late times, while spheroidal components assemble in episodic bursts of star formation that occur following the accretion of gas that is misaligned from the existing galaxy. More recently, Grand et al. (2017) used 30 galaxies from the Auriga Project to argue (1) that disk size does correlate with halo spin (though the kinematic disk fraction, which we define below, does not) and (2) that well-aligned mergers of gas-rich satellites promote disk growth.
Collectively, the results from large-volume and zoom-in simulations suggest that a picture where stellar morphology is regulated by angular momentum is not necessarily wrong, but that it is likely incomplete. However, the majority of these studies have focused on simulations that adopt a stiff equation of state for the interstellar medium, which could plausibly introduce artifacts into, e.g., the behavior of the gas during galactic mergers, motivating a study with an more physical description of the interstellar medium. Here, we use a sample of fifteen MW-mass galaxies, seven of which are isolated and eight of which are in Local Group-like pairs, from high resolution zoom-in simulations, run with physically-motivated and identical models and parameters for star formation and feedback, to explore correlations and drivers of (primarily) stellar morphology. We first test the MMW98 predictions against the sizes of our galaxies, then search for physically meaningful correlations between stellar morphology at and various properties of the host halo, including their evolutionary histories. We then explore the evolution of the stellar morphologies and the fraction of stars born in a disk at any given time to better understand the impact of dynamical interactions and the instantaneous state of the star-forming gas at any given time. Finally, we examine the morphology of the gas at to understand the morphologies of stars being born today.
Throughout this work, we assume flat CDM cosmologies, with – , – , – , and (e.g. Larson et al., 2011; Planck Collaboration et al., 2016).111The differences in average halo properties due to variances in the cosmological parameters are smaller than the typical halo-to-halo variance within a given cosmology, and, moreover, any systematic variations would be automatically included in the physical parameters we explore here. We adopt the Bryan & Norman (1998) definition of and throughout, except when computing the MMW98 predictions, which depend on the properties of the halo within , the radius at which the density is times the critical density. For all stellar images and properties presented herein, we use a coordinate system where the -axis is aligned with the shortest principal axis of the moment of inertia tensor of all star particles within . For the gas, we align our coordinate system with the shortest principal axis of the gas within ; we select a smaller radius for the gas because the gas moment of inertia tensor at is occasionally dominated by gas outside the galaxy. We sometimes refer to halo properties in the corresponding dark matter-only simulation; such properties will be indicated as “DMO.”
We explicitly opt not to make comparisons with observations in this work because our goal is not to demonstrate the “reasonableness” of our galactic disks, but rather to understand why and how they came to have their morphologies. However, we note that the FIRE/FIRE-2 physics are broadly successful at reproducing observed galactic properties over a range of galaxy masses, including the stellar mass vs halo mass relation (Hopkins et al., 2014, 2017), the normalization and scatter of the star formation rate vs stellar mass relationship (Sparre et al., 2017), the Kennicutt-Schmidt law (Orr et al., 2017), the mass-metallicity relationship (Ma et al., 2016), and even the vertical and radial structure (including stellar ages and metallicities) of the MW disk (Ma et al., 2017b). Sanderson et al. (in prep) also show that the masses of the stellar halos around the FIRE-2 MW-mass galaxies are in relative agreement with those measured by Merritt et al. (2016). Moreover, proper comparisons to observations requires a careful conversion from the stellar mass to observed light to make a fair comparison with observables, including the effects of dust attenuation and stellar evolution (e.g. radial variations in the mass-to-light ratio; Wuyts et al., 2010). Scannapieco et al. (2010), for example, used mock observations to show that photometric bulge/disk decompositions typically overestimate the true disk fractions by at least a factor of two. A detailed comparison of observer-space disk indicators will be the focus of subsequent work(s).
This paper is organized as follows. In § 2, we describe the simulations and briefly review the star formation and feedback models. § 3 presents our measures of morphology, and , and compares them to other (primarily theoretical) quantifiers. § 4 compares the actual morphologies to those predicted by the MMW98 model, then presents correlations between morphologies and various properties of the galaxy and their host halos, while § 5 explores the evolution of the stellar morphologies and the birth properties of stars. § 6 presents the morphologies of the gas disks in our sample. We summarize our results and conclusions in § 7.
2 Simulations
We analyze hydrodynamic, cosmological zoom-in (Katz & White, 1993; Oñorbe et al., 2014) simulations from the Feedback in Realistic Environments (FIRE)222http://fire.northwestern.edu project, specifically with the improved “FIRE-2” version of the code from Hopkins et al. (2017). In order to maximize our sample size, we include simulations with varying resolutions, which we discuss below, but the numerical methods and primary physical models are identical across all of the simulations. All of the simulations were run using GIZMO (Hopkins, 2015),333http://www.tapir.caltech.edu/~phopkins/Site/GIZMO.html a multi-method gravity plus hydrodynamics code, in meshless finite-mass (“MFM”) mode. This is a mesh-free Lagrangian finite-volume Godunov method which automatically provides adaptive spatial resolution while maintaining conservation of mass, energy, and momentum (for extensive tests, see Hopkins 2015). Gravity is solved with an improved version of the Tree-PM solver from GADGET-3 (Springel, 2005), with fully-adaptive (and fully-conservative) gravitational force softenings for gas (so hydrodynamic and force softenings are always self-consistently matched), following Price & Monaghan (2007).
The FIRE physics and source code are exactly identical to those in previous FIRE-2 simulations; these are described in detail in the papers above but we briefly review them here. Radiative heating and cooling is treated (from K), including free-free, photo-ionization/recombination, Compton, photoelectric & dust collisional, cosmic ray, molecular, and metal-line & fine-structure processes (following each of 11 tracked species independently), and accounting for photo-heating both by a UV background (Faucher-Giguère et al., 2009) and an approximate model for local sources, and self-shielding. Star formation occurs only in gas identified as self-gravitating according to the Hopkins et al. (2013) criterion, which is also molecular and self-shielding (following Krumholz & Gnedin 2011), Jeans unstable, and exceeds a minimum density threshold . Once a star particle forms, the simulations explicitly follow several different stellar feedback mechanisms, including (1) local and long-range momentum flux from radiation pressure (in the initial UV/optical single-scattering, and re-radiated light in the IR), (2) energy, momentum, mass and metal injection from SNe (Types Ia and II) and stellar mass loss (both OB and AGB), and (3) photo-ionization and photo-electric heating. Every star particle is treated as a single stellar population with known mass, age, and metallicity, and then all feedback event rates, luminosities and energies, mass-loss rates, and all other quantities are tabulated directly from stellar evolution models (starburst99; Leitherer et al. 1999), assuming a Kroupa (2001) IMF. We emphasize that the FIRE physics were not tuned to reproduce galaxy sizes or morphologies. One of the pairs, Romulus & Remus, was simulated with subgrid turbulent metal diffusion (Hopkins, 2017; Escala et al., 2017); however, Su et al. (2016) showed metal diffusion has a small impact on the morphology of a MW-mass galaxy.
| Galaxy | Reference | ||||||||||
|---|---|---|---|---|---|---|---|---|---|---|---|
| [] | [] | [] | [kpc] | [kpc] | [kpc] | [] | [] | ||||
| Romeo | 1.28 | 6.98 | 3.45 | 0.79 | 17.4 | 1.95 | 30.5 | 0.65 | 28 | 15 | A |
| Juliet | 1.06 | 5.26 | 3.16 | 0.76 | 13.7 | 1.67 | 20.8 | 0.59 | 28 | 15 | A |
| Louise | 1.10 | 6.39 | 3.23 | 0.69 | 12.2 | 1.5 | 24.2 | 0.56 | 32 | 16 | A |
| Robin | 1.56 | 5.99 | 2.90 | 0.66 | 9.5 | 1.65 | 20.8 | 0.51 | 57 | 31 | A |
| Thelma | 1.44 | 11.58 | 2.56 | 0.65 | 11.6 | 2.13 | 11.2 | 0.5 | 32 | 16 | A |
| m12f | 1.58 | 7.53 | 2.85 | 0.64 | 11.1 | 2.39 | 20.8 | 0.48 | 7.1 | 3.5 | B |
| Romulus | 1.95 | 13.46 | 3.55 | 0.61 | 11.6 | 2.55 | 22.4 | 0.48 | 32 | 16 | E |
| m12i | 1.14 | 6.16 | 2.23 | 0.58 | 9.9 | 2.07 | 17.8 | 0.44 | 7.1 | 3.5 | C |
| m12z | 0.86 | 3.5 | 1.82 | 0.57 | 11.4 | 3.23 | 8.3 | 0.4 | 33 | 17 | D |
| m12c | 1.27 | 8.09 | 0.92 | 0.56 | 4.3 | 1.08 | 3.6 | 0.42 | 57 | 28 | A |
| Remus | 1.23 | 10.05 | 0.90 | 0.53 | 7.7 | 1.71 | 8.3 | 0.45 | 32 | 16 | E |
| m12m | 1.47 | 10.88 | 1.41 | 0.53 | 13.3 | 2.75 | 12.1 | 0.34 | 7.1 | 3.5 | A |
| m12b | 1.36 | 9.13 | 2.32 | 0.33 | 5.2 | 1.16 | 12.1 | 0.27 | 57 | 28 | A |
| m12q | 1.61 | 11.23 | 0.56 | 0.21 | 5.4 | 1.57 | 0.9 | 0.11 | 57 | 28 | A |
| Batman | 1.89 | 10.21 | 1.96 | 0.20 | 2.4 | 0.98 | 11.2 | 0.08 | 57 | 31 | A |
We focus on the roughly MW-mass galaxies simulated with FIRE-2. Therefore, we combine the Latte halo (here referred to as m12i) from Wetzel et al. (2016); five additional isolated halos simulated with an identical pipeline, two at the same resolution and three with a factor of higher mass particles; one isolated halo from Hafen et al. (2017); three pairs of halos in Local Group-like configurations (first reported in Hopkins et al., 2017, but analyzed in detail here for the first time), and one additional pair that has not yet been reported elsewhere. Hosts in Local Group-like pairs were selected with the same criteria as Garrison-Kimmel et al. (2014): isolated pairs with that are approaching one another. All other hosts were selected purely on the basis of their mass and isolation from other massive halos. The mass resolution of each galaxy is listed in Table 1.444We list the initial mass of a gas particle in each simulation, but note that due to deposition onto gas particles from stellar mass loss, baryonic particle masses fluctuate slightly about their initial value. Softening lengths for the gas are fully adaptive, typically down to , with fixed stellar and DM softening lengths set according to the typical inter-particle spacing. Hopkins et al. (2017) list the exact values for our runs, but all are sufficient to resolve the disk heights. For each galaxy, we analyze the highest resolution simulation available that has been completed to . We demonstrate the stability of our morphologies and sizes with numerical resolution in Appendix A: the general trends are robust to resolution, but we caution that quantitative values do change slightly with resolution.
Movies showing the formation and evolution of each galaxy in our sample, created using identical pipelines, may be found at http://www.tapir.caltech.edu/~sheagk/firemovies.html.
3 Quantifying morphology of the FIRE-2 galaxies
There are a wide variety of reasonable definitions for galactic morphology that one can adopt. Broadly speaking, they range from kinematic distinctions (e.g. the fraction of stars on circular orbits) to visual quantifiers (e.g. photometric bulge-to-disk ratios, Sérsic, 1963 indices, and half-light radii). Though the former are straightforward to measure in simulations, they are difficult to determine with observations. The latter, however, are relatively straightforward to extract with photometry, but can only be measured for simulated galaxies if one assumes models for stellar evolution and dust attenuation. Though the relationship between observable morphological measures and kinematic quantifiers is extremely interesting, a full study requires “mock observations” of the simulated galaxies (including radiative transfer) and subsequent fitting of those images with the tools typically used by observers. We consider these steps to be beyond the scope of this paper, which instead focuses on the physical drivers of those morphologies, but plan to investigate this question in greater detail in future work.
3.1 Definitions
Here, we focus primarily on morphological measures that do not rely on specific profiles or on assumptions regarding the luminosities/colors of individual star particles. We primarily adopt two independent measures of galactic morphology, and . The latter, , is the radial extent of the disk. It is defined together with , the height of each galaxy, such that 90% of the stellar mass within of the galactic center is contained within a 2D radius and a height above/below the disk when the stars are aligned with their principal axes. We then define as the stellar mass within a radial distance and a height above/below the disk .555We note that this definition differs from the stellar masses listed in Hopkins et al. (2017), who quoted total stellar masses within .. For the purposes of comparing with semi-analytic models (§4.2), we identically define , the 2D radius that encloses 50% of the stellar mass. We similarly define 3D stellar radii and as the radii that contain 90% and 50% of the stellar mass within . Though the same process typically yields accurate results for the gas, it artificially inflates the sizes of extremely gas-poor galaxies (e.g. m12c and m12q; see Figure 13). Therefore, we define the radial and vertical extents of the gas disk by first taking the peak of the face-on mass profile, , as , then defining as the break in the vertical 1D mass profile of all the gas with a projected radius . is then defined as the total gas mass within (). typically changes by only between this method and the approach we adopt for the stars, with the technique we adopt for the gas yielding a slightly lower in all but two cases. All properties are based on centers calculated via a shrinking spheres approach (Power et al., 2003).
Our kinematic morphological definition, , measures the fraction of stars on circular orbits that are aligned with the angular momentum of the galaxy as a whole. Specifically, for each particle within , we compute the circularity following the method of Abadi et al. (2003) and described in detail in El-Badry et al. (2017). For a given mass element, the circularity relates the component of the specific angular momentum that is aligned with the average angular momentum vector of the galaxy, , to the specific angular momentum of a circular orbit with the same energy, . Stars (or gas) with are therefore on perfectly circular orbits in the plane of the galaxy, those with have orbits that are exactly perpendicular to the galaxy, and those with are perfectly counter-rotating. We adopt a cut of to distinguish disk stars, and define as the mass fraction of stars that meet this cut within . We find nearly identical disk fractions if we consider all stars within : the fractional difference is typically .
3.2 Simulation Properties
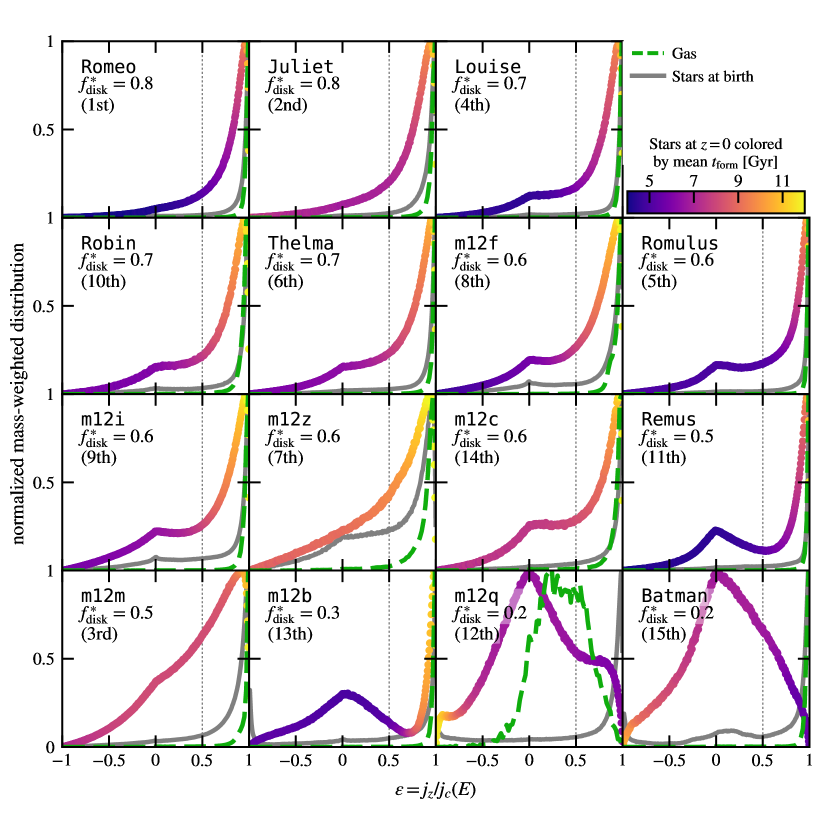
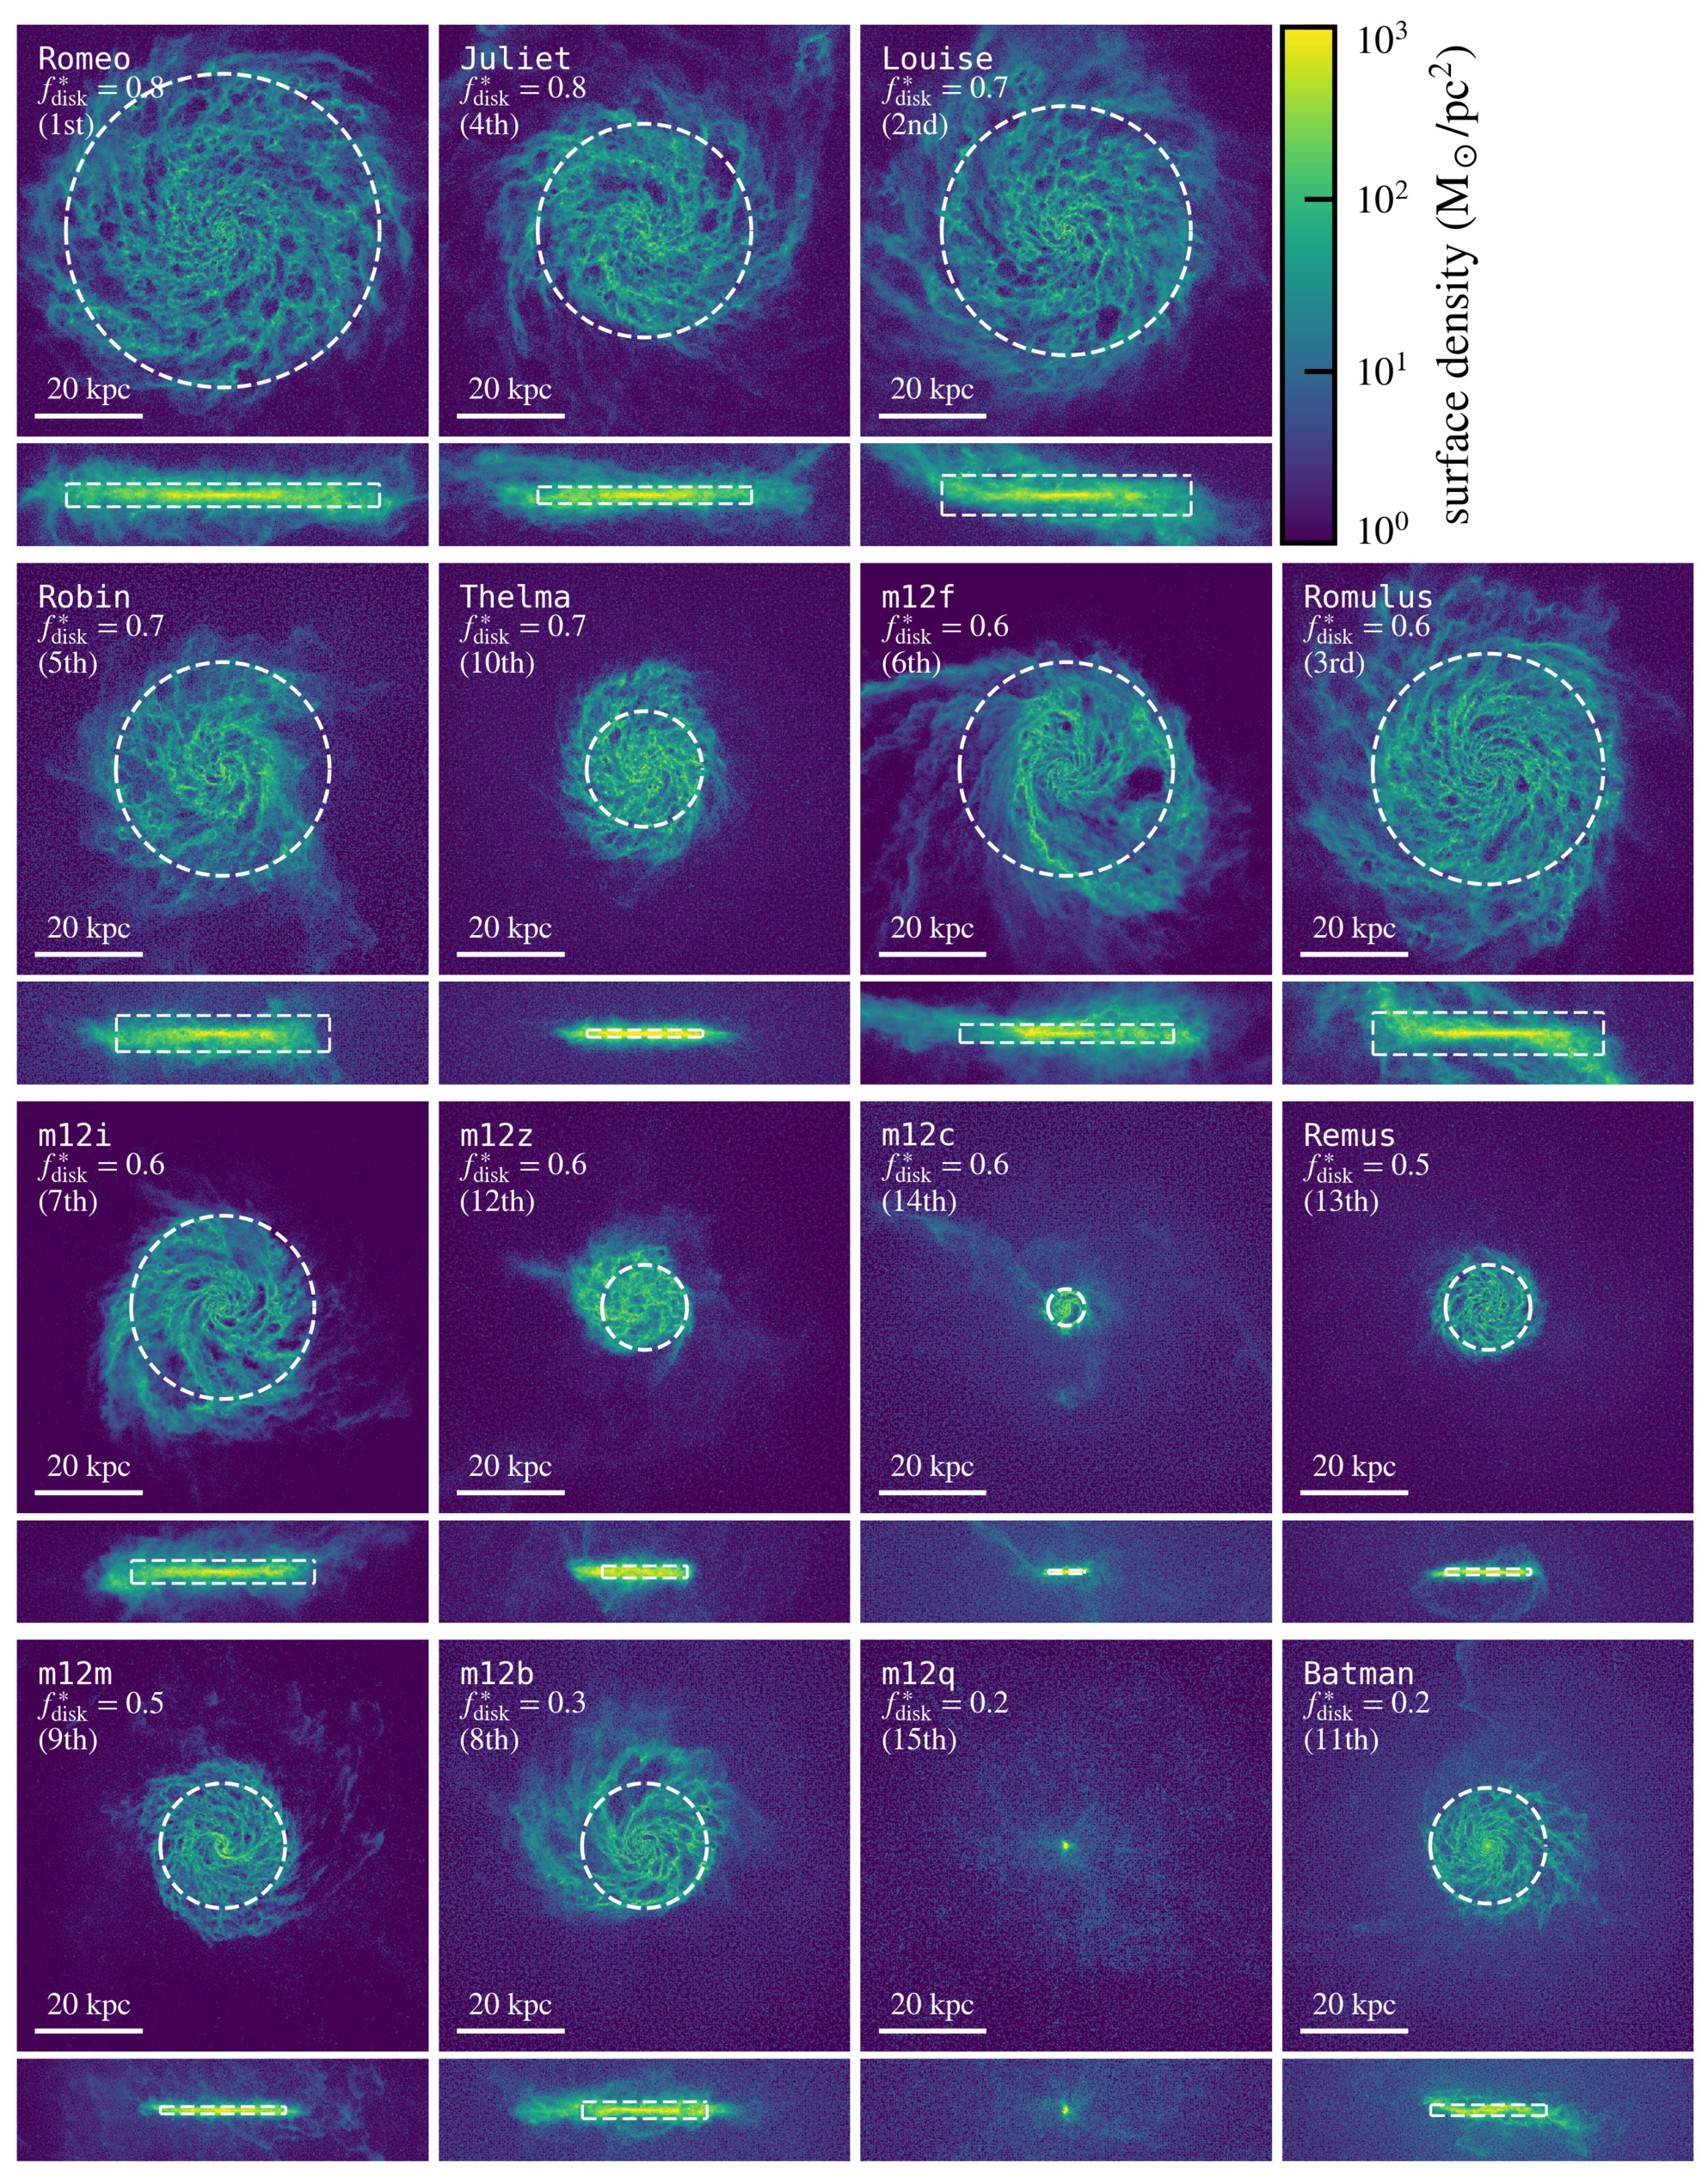
The distributions of for both the stars and gas in each MW-mass FIRE-2 galaxy (i.e. within ) are shown in Figure 1. Each panel represents an individual galaxy; they are ordered by decreasing , which is indicated for each galaxy. The number in parentheses below indicates the rank that each galaxy would have if they were instead ordered by decreasing ; we compare and explicitly in Figure 3. We will retain this sorting by in other figures to ease comparison.
The stellar distributions, which are plotted as the colored histograms in Figure 1, vary widely even in our relatively small sample. Without pre-selecting for expected morphology, the MW-mass FIRE-2 sample includes nearly bulge-less disk galaxies (e.g. Romeo and Juliet), galaxies with clear bulge and disk components (e.g. Remus and m12b), and almost entirely dispersion-supported galaxies (Batman and m12q).666We note that Batman and m12q are very compact, with and respectively, and may be outliers in observations (e.g. Shen et al., 2003). As noted, though, we caution against direct comparisons with observations without mock-observing the sample. The color of each curve at a given indicates the average formation time of stars with that . Other than Batman and m12q, which have formed roughly counter-rotating disks at late times, the disk () is almost always composed of younger stars on average, in agreement with previous results that disks in MW-mass galaxies begin to appear at (e.g. Ma et al., 2017b, a). In some cases, such as m12b and Remus, the average ages of the bulge and disk components differ dramatically, while the transition is much smoother in other systems (e.g. m12m and m12z).
In contrast with the diversity in the kinematics of the stars, the gas distributions (green dashed curves) are almost uniform across this mass-selected sample. Specifically, every galaxy except m12q, (which has not experienced any significant gas accretion since ) hosts a thin, primarily rotation-supported gas disk. The gray curves in Figure 1, which show the circularity distributions of the stars formed in the galaxy at birth (i.e. stacking over all snapshots) are similarly uniform, with the vast majority of stars forming with . We will discuss the kinematics of stars at birth along with the evolution of those kinematics in § 5, and we will explore the characteristics of the gas disks in greater detail in § 6, but we first focus on the stellar morphologies.
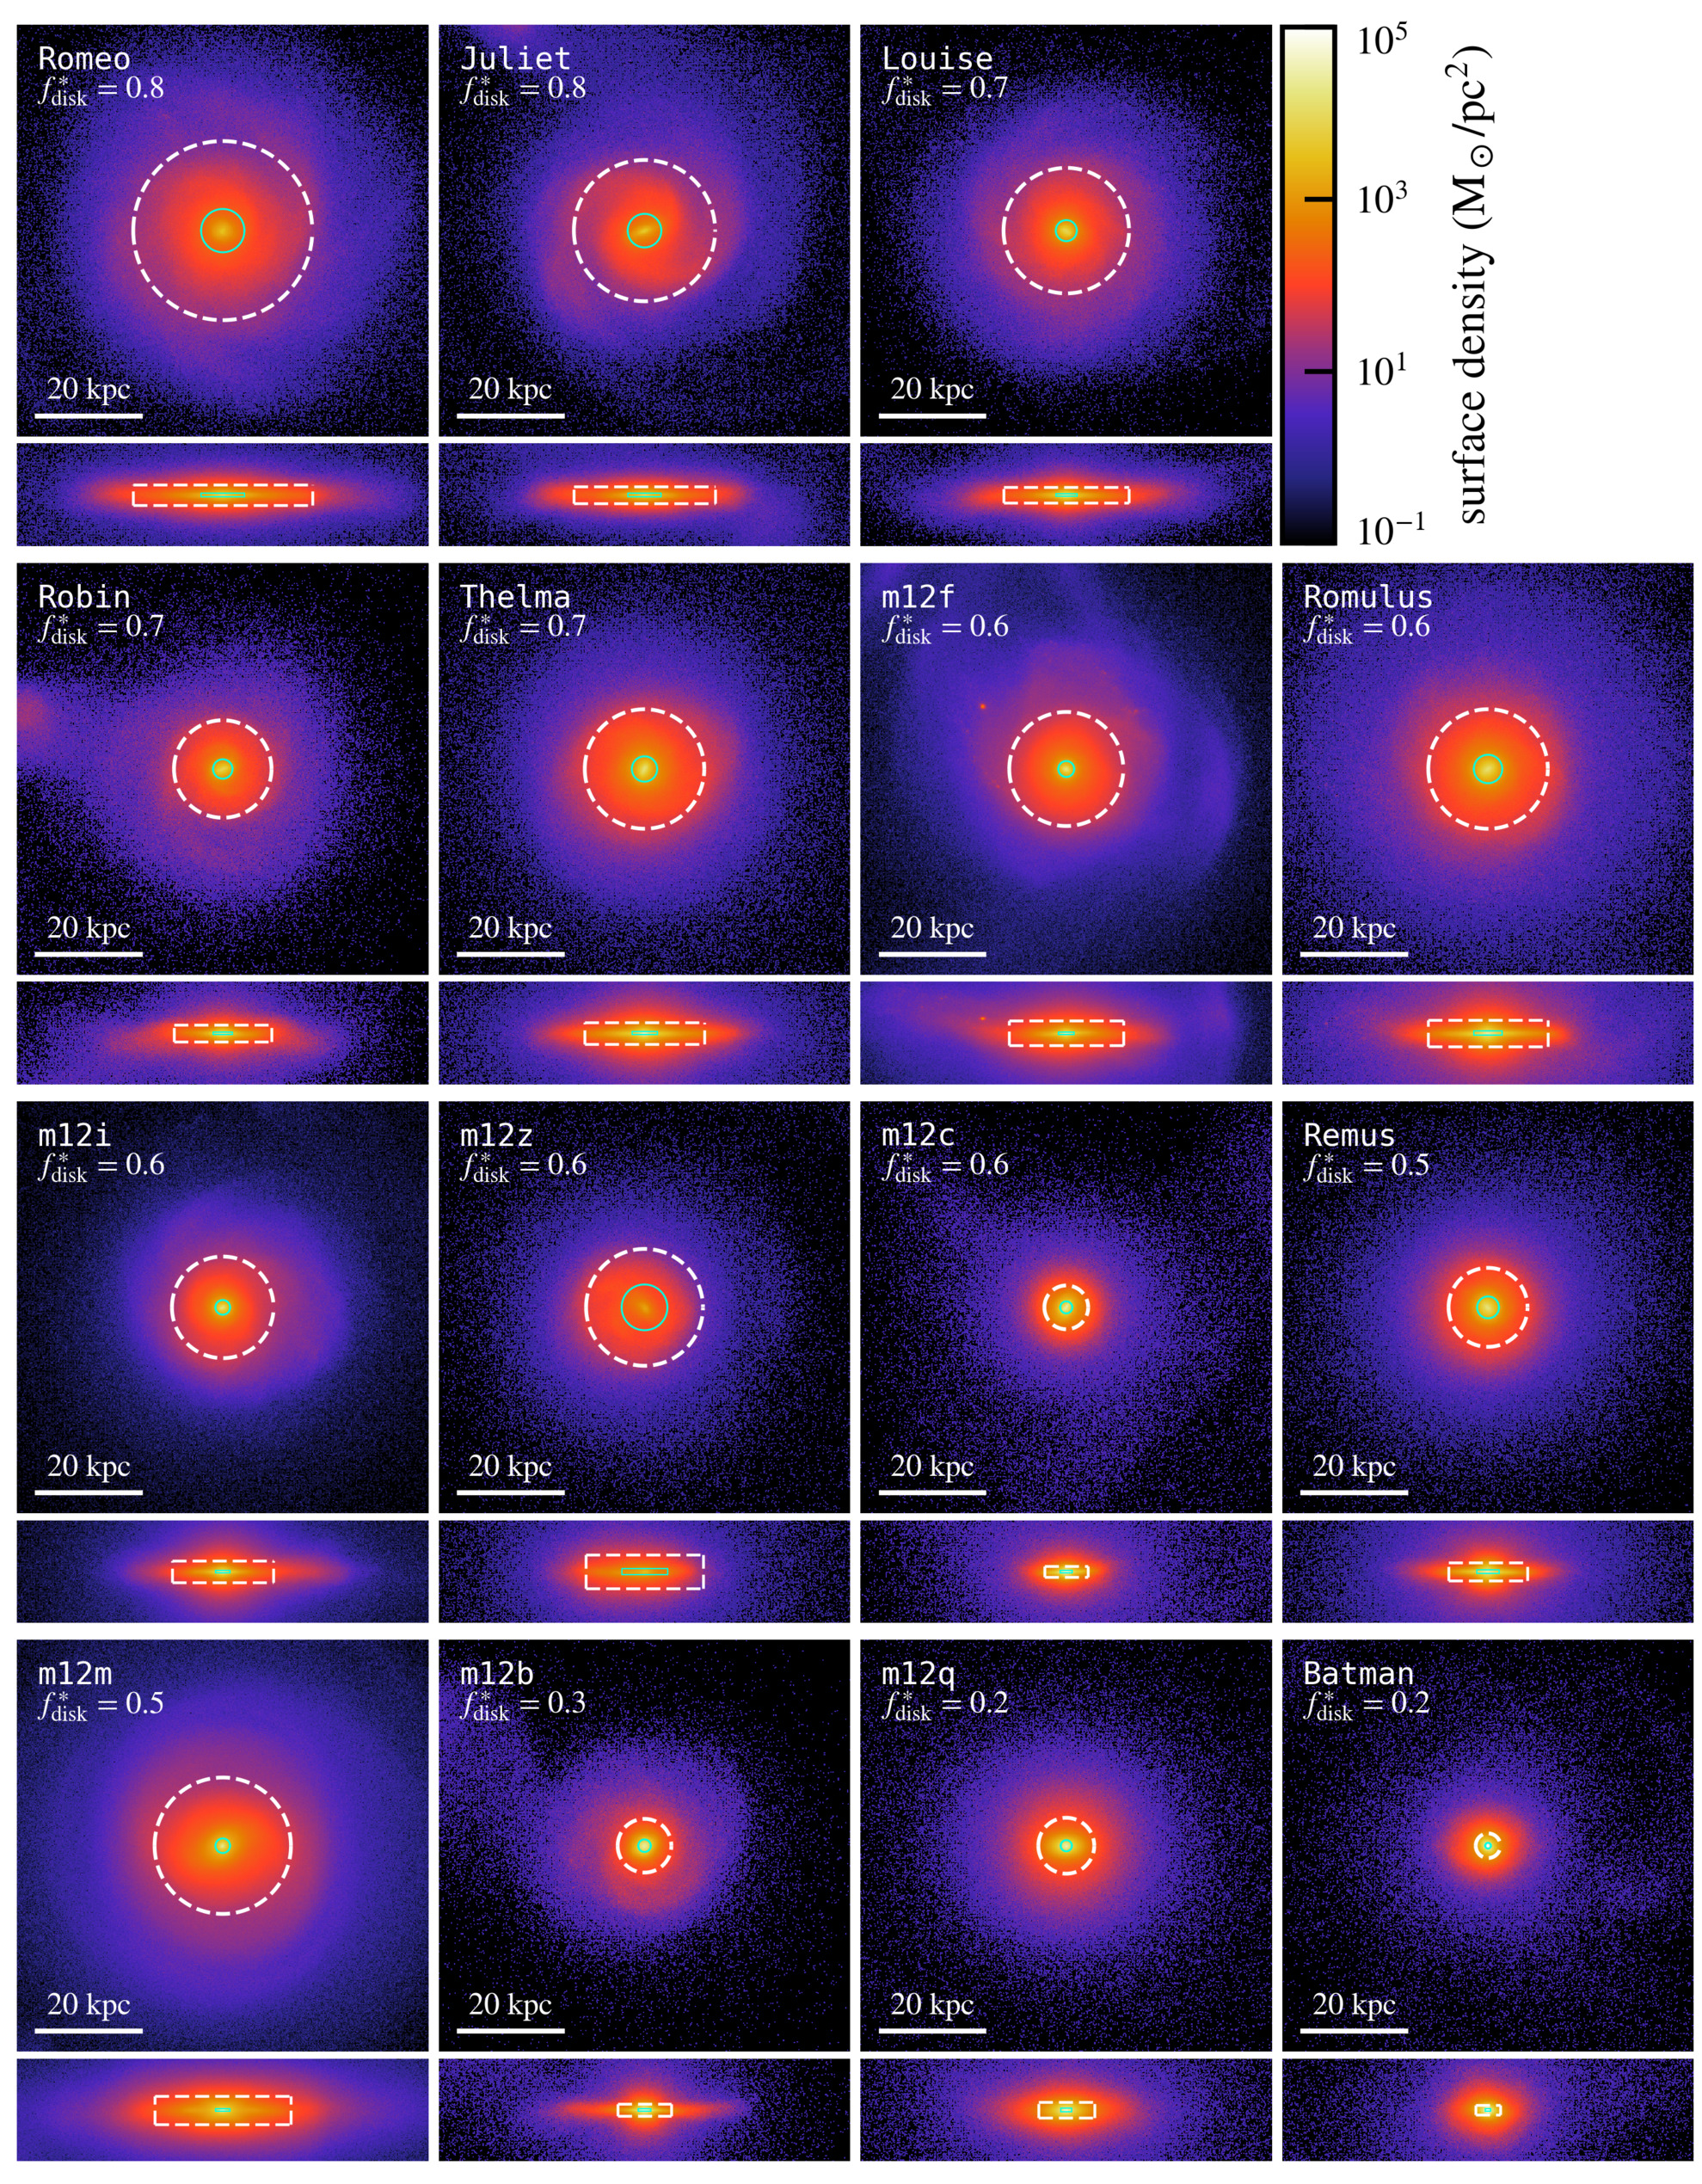
Visualizations of the stars in all fifteen galaxies are shown in Figure 2, again sorted by . The top panels show face-on views of each galaxy, while the lower panels visualize the galaxy edge-on. There is a clear trend for galaxies to become more elliptical, less disky, and typically more spatially compact as decreases. The thick dashed and thin solid circles (rectangles) in the upper (lower) panels of Figure 2 indicate (, ) and (, ), respectively. As intended, the former captures roughly the full extent of the stellar populations. We also plot circular velocity profiles for the full sample in Appendix B: galaxies with higher disk fractions tend to have flatter, more extended circular velocity curves and, conversely, the bulge-dominated systems have rotation curves that peak at small radii, but there is some scatter about that trend.
We summarize several basic properties of each galaxy in Table 1, including the host virial mass , the galaxy stellar mass , and the mass in gas within the galaxy , along with the fraction of stars in the galaxy on circular orbits and the radial extent of the stars and gas in each galaxy, and . To give an indication of how sensitive our results are to our definition of “disk” stars having , we also list the fraction of stellar mass with .
While the FIRE-2 physics successfully reproduce observed relationships over a wide range of masses (see Hopkins et al., 2017, and §1), our mass-selected sample does face some tension with observations. First, our galaxies are overly massive for their halo masses: our stellar mass definition places our sample between – dex above the Behroozi et al. (2013c) stellar mass vs halo mass relation. Second, at these stellar masses, a non-negligible fraction of observed galaxies are quenched, with strongly suppressed star formation rates (e.g. Salim et al., 2007). However, none of the galaxies in our sample fall into this category: our lowest 100 Myr averaged specific star formation rate at is yr-1 (possibly because these simulations do not include AGN feedback; Bower et al., 2006; Cattaneo et al., 2006; Croton et al., 2006; Somerville et al., 2008). Though our sample includes only fifteen galaxies, we caution that we may overproduce (or at least over-represent) late-type galaxies, which could potentially alter the correlations we present herein. Furthermore, if quenching correlates with properties of either the galaxy or the halo (e.g. the mass of the DM halo at fixed stellar mass; Woo et al., 2013) in a way not captured by the FIRE-2 models, then our analysis will miss those relationships.
3.3 Comparing morphological measures
Before examining correlations between various halo/galaxy properties, , and the radial extents of our galaxies, we briefly explore the relationship between our morphological measures ( and ) and other potential measures of morphology. As discussed in §1 and 3.1, we do not explicitly compare with observational measures, as that lies beyond the scope of this work. However, we do note that the stellar radii that we adopt in this paper scale closely with the half-mass radii derived from fitting two-component Sérsic profiles to these same galaxies (Sanderson et al., in prep), though the bulge-to-disk ratios of those profiles do not correlate particularly well with the true kinematic disk fraction .
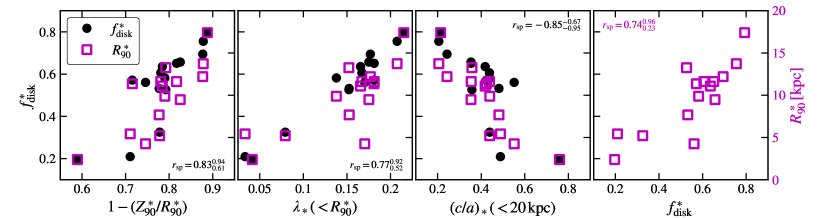
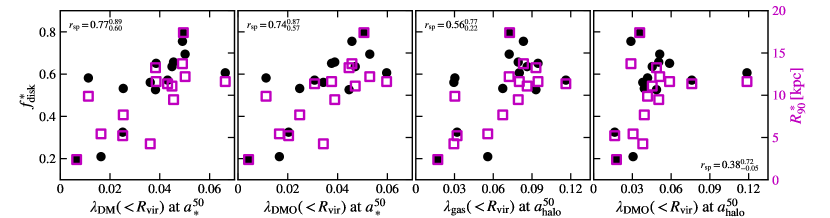
In addition to the properties we discuss above, there are a number of viable morphological definitions we could adopt, such as the angular momentum of the stars, the thickness of the stellar disk, or the shape of the stellar mass distribution. We examine how these properties correlate with and in Figure 3. In the first three panels, the filled black circles plot each quantity against (left axis), while the open magenta squares correspond to the right axis and indicate . The final panel shows and against one another and therefore omits the black points.
Any of these properties shown in Figure 3 (along with other measures that we do not plot here, such as the stellar radius scaled by the virial radius, the specific angular momentum of the stars, the radius where the log-slope of the stellar density profile equals , or the kinematic bulge-to-disk ratio) are viable alternatives to and . The correlations are unsurprising: at roughly fixed mass, galaxies that are radially extended are also flatter, have larger stellar spin parameters, and have a greater fraction of rotation support. The final panel in Figure 3 indicates the relationship between and . As suggested by the visualizations in Figure 2, the radial extent of the stars correlates with the degree of order in the disk, but with non-trivial scatter, motivating our analysis of both properties throughout.
The text in each panel (and in similar Figures below) indicates the Spearman -coefficient, , which quantifies the monotonicity of each relationship. We compute on the joint relationship with and : we assign each galaxy a rank based on and a rank based on , then combine those ranked datasets and compute against two copies of the ranked values of each plot. Our qualitative conclusions are unchanged if we compute against and independently. For each relationship, we perform 100,000 bootstrapping trials (randomly drawing points, with replacement). We report the median of those trials, and the values in superscripts and subscripts indicate the full 95% confidence interval for those trials. We provide identical statistics throughout the remainder of this work. Based on the correlations reported in Figure 3, which plots correlations between morphological properties that we expect to be reasonably well correlated, we adopt a rough criterion of , with a lower 95% bound on the confidence interval of , as a “tight” correlation.
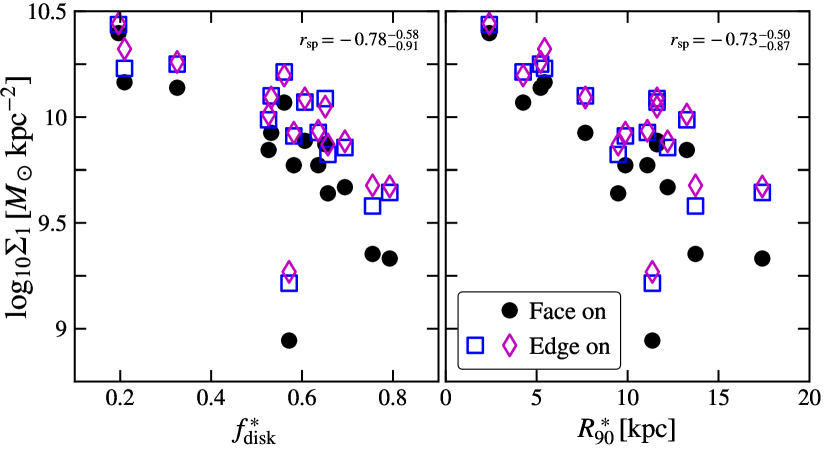
Before turning to the drivers of stellar morphology, we briefly examine one non-parametric morphological measure that is relatively easy to measure in both simulations and observations: , the stellar surface density within the central (e.g. Cheung et al., 2012; Bell et al., 2012; Fang et al., 2013). For this mass-selected sample, we find a tight relationship between and morphology at : Figure 4 shows as measured edge-on in open symbols and face-on in black circles. The viewing angle has a small impact, though edge-on projections are always higher, as expected. The anti-correlation between and the true morphology of a galaxy is striking, though somewhat unsurprising: for a roughly fixed stellar mass, galaxies with high central densities must be more compact, and Figure 3 demonstrated that radial extent and degree of order in the stellar orbits are well correlated, again at fixed galaxy mass. We therefore conclude that is a reliable morphological measure, at least for roughly MW-mass galaxies. However, we caution that the low-lying outlier from the trend is m12z, our lowest mass galaxy, suggesting the possible emergence of a mass trend. Moreover, while some analyses have associated high with galactic quenching (e.g. Woo et al., 2015; Woo et al., 2017), all of our galaxies show some level of continued star formation to (as noted above).
4 Drivers of Stellar Morphology
We now turn to correlations between stellar morphology, quantified primarily by and , and various properties of the galaxy and the host halo, both in the hydrodynamic simulation and in the analogous dark matter-only (DMO) run. In short, we search for physical drivers of and explanations for the morphologies of each of the galaxies in our sample.
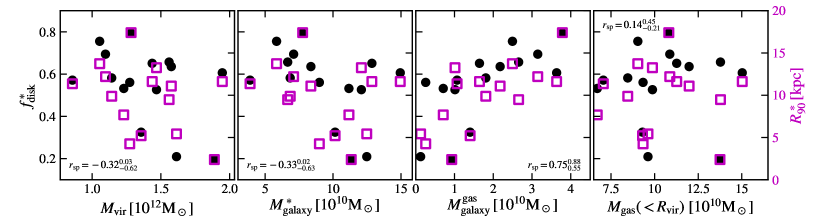
4.1 Mass (around MW masses)
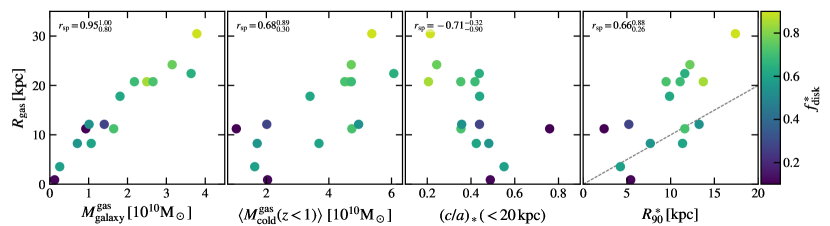
We begin by checking whether the morphologies of the FIRE-2 MW-mass galaxies are driven by either the halo or galaxy mass. Figure 5 indicates the virial mass , the stellar mass , the gas mass , and the total gas mass within , all at . As in Figure 3, black points correspond to the left axis and plot , while magenta squares indicate (right axis). Of the masses shown in Figure 5, only displays evidence for a correlation with the stellar morphology. Though we do not plot it, we also find no correlation between the total baryonic mass within and kinematics/morphology ( – 0.06). There is evidence for a correlation with the total mass in cold gas (defined as K) within (–), but because the cold gas is predominantly in the galaxy, this correlation is driven by . We will return to the correlation with below, but here we emphasize that the morphologies of the MW-mass FIRE-2 galaxies do not correlate with either the halo mass, the stellar mass of the galaxy, or the total baryonic mass within . Note that over a large dynamic range, however, there is a strong mass dependence (e.g. El-Badry et al. 2017 showed that the FIRE-2 dwarfs are spherical and dispersion dominated).
4.2 Spin (and other DM properties)
As discussed in §1, many authors have pointed out that, if baryons acquire their angular momentum from their dark matter halos and begin with the same density profile as those halos, then the size of the stellar disk should be predicted by a combination of the Peebles (1969) spin parameter , the size of the host halo, the fraction of angular momentum in the halo that resides in the disk , and the fraction of halo mass that resides in the disk . In the simpler model of MMW98, wherein the galaxy is hosted by a static isothermal sphere,
| (1) |
In their more complete model, where the disk grows adiabatically within an initially NFW (Navarro et al., 1996) halo, the disk radius is modified by two multiplicative functions; the first arises from the change in the total energy of the NFW profile relative to an isothermal sphere and the second from the (assumed) adiabatic contraction of the halo in response to the growth of the disk. If such a relationship is borne out by the FIRE-2 simulations, and if , the ratio of the specific angular momentum of the disk to the halo, is roughly constant (i.e. if the baryons acquire their angular momentum from the halo, as assumed in MMW98), then one can accurately populate halos in DMO simulations with galaxies of the proper size and, by virtue of the correlation between and , roughly the proper disk fraction. Moreover, validation of the model would provide evidence for the overall theory of angular momentum-regulated disk growth.
Figure 6 tests this picture by comparing the half-mass radius predicted by the models of MMW98 to the half-mass radius of each simulated galaxy. Circles show the results of the isothermal model (Equation 1), and squares plot the full model assuming an adiabatically contracted NFW halo (Equation 28 of MMW98). In order to test the assumption that galaxies acquire their angular momentum from the dark matter, the left panel uses properties available from the DMO simulations and fixes .777We adopt , but our overall results are insensitive to the chosen value. Given the relatively small variations in within our sample, the left panel implicitly tests whether disk size is driven by the spin of the halo at . Neither model is able to reproduce the actual size of our galaxies, in line with the general results of zoom-in simulations discussed in § 1. The bracketed numbers in the legends indicate the average fractional error of each set of points relative to the simulations: the isothermal MMW98 model dramatically over-predicts the size of the galaxies when assuming . The contracted-NFW halo model produces a reasonable order-of-magnitude estimate of , but the actual predictive value is quite poor.
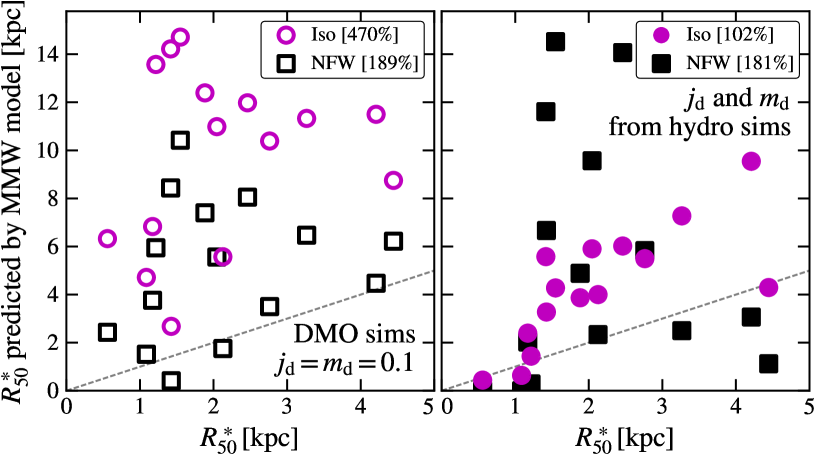
The right panel frees the assumption that the angular momentum of the galaxy is correlated with the spin of the halo and instead fits the galactic angular momentum independently by adopting and (along with the remainder of the halo properties) from the hydrodynamic simulations. We calculate () from the simulations as the ratio of the stellar angular momentum (mass) within to the total angular momentum (mass) within . By doing so, we measure the true angular momentum of the galaxy (i.e., independent of the spin of the halo) and therefore test the assumption that a rotationally supported disk in a fixed gravitational potential (determined by a simple NFW or isothermal model) provides a reasonable approximation. Even under this assumption, the predictions are only moderately accurate, though we do find order-of-magnitude agreement across this mass range, in line with observational results that show a correlation between virial radius (i.e. halo mass) and galaxy size (e.g. Kravtsov, 2013). The relative success of the isothermal model (compared to the NFW model) may suggest that the density profiles are closer to isothermal spheres at their centers, but we see no strong evidence in the actual profiles (though see Chan et al., 2015, who found that the total density profiles at the centers of MW-mass FIRE-1 galaxies are well-fit by an isothermal sphere).
Though we adopt all of the halo parameters in the hydrodynamic simulation in the right panel (, , , and ), the majority of the changes are driven by allowing and to vary freely and independently: even for our sample of fifteen galaxies, , , and their ratio vary by nearly an order of magnitude: , , and . Galaxies acquire a broad range of the specific angular momentum available in their hosts, and one must know the true and in order to even roughly predict the radial extent of a given galaxy with the MMW98 model. We are unable to recover a tight correlation with a single value of and for all galaxies (even when ). There is some evidence for a correlation between and the environment: the median of the galaxies in Local Group-like pairs is twice that of the isolated sample. Accordingly, six of the seven diskiest galaxies in our sample are in Local Groups. However, our sample size is too small to make definitive statements.
In our parameter exploration, we have generally found that, of the properties of the DMO halo, (or ) correlates most tightly with morphology ( – 0.7 for the latter) though the correlation is weak with a large degree of scatter about the average relationship: our largest, most ordered galaxy has an average spin parameter. While is relatively stable between the DMO and baryonic simulations,888The average fractional difference in our sample is . alone is insufficient to predict morphologies without alleviating the scatter by multiplying by the true values of and . Given the difficulty of predicting the morphology of a galaxy with only the information available about the host halo in a DMO simulation, we therefore turn our attention to identifying physical drivers of the morphology in the hydrodynamic simulations. That is, we do not attempt to predict morphologies, but rather to explain them through galactic/halo properties at all redshifts.
4.3 Gas fraction and accretion history
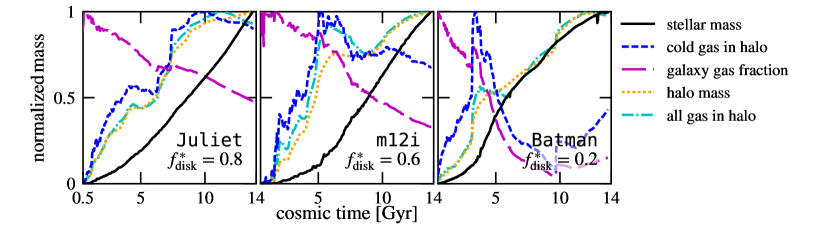
Figures 7 and 8 represent the culmination of these searches. The former, Figure 7, shows the normalized mass accretion histories of three representative galaxies, Batman, m12i, and Juliet (growth histories for the full sample are plotted in Appendix C). The black curves indicate the stellar mass within , the blue curves show the total cold gas within (where “cold” is again defined as K), and the magenta curves indicate the ratio of the cold gas mass to the stellar mass of the galaxy (i.e. the ratio of the black and blue curves without normalizing). Finally, the cyan and orange curves indicate the total gas mass within and the total halo mass, respectively. Each curve is normalized to its maximum value. We find qualitatively identical results measuring the total gas mass near the galactic center via the same iterative process we adopt for the stars: the vast majority of the cold gas in the halo at any given time is in the galactic disk. However, we opt to use the total cold gas mass within the virial radius, , because this iterative process can falsely capture hot gas in the halo, as discussed earlier.
Of course, every galaxy has a unique evolutionary history, and our results suggest that history is instrumental in shaping the galaxy. However, there are trends that hold generically across our sample, which are exemplified by the three panels in Figure 7. First, while the total gas in the halo closely tracks the total halo mass for all galaxies, the behavior of the cold gas in the halo, i.e. the fuel for star formation, varies strongly with . Galaxies similar to Batman with low tend to reach their maximum cold gas mass at early times (both in absolute terms and in comparison to the growth of their dark matter halos) when star formation is chaotic and bursty, and quickly exhaust (or heat) that gas. They therefore form more stars with bulge-like configurations, and stars that are formed in a disk are subject to greater dynamical disruption from the powerful feedback events. Galaxies that reach their maximum cold gas mass at early times but maintain a relatively large reservoir for star formation until late times, either through mergers or accretion from the circumgalactic medium (CGM), form a similar fractions of stars during the bursty period and at late times (), when the star-forming gas has settled into a rotation-supported disk, as is the case with m12i. Finally, galaxies such as Juliet that are disk-dominated tend to have relatively little gas and form relatively few stars during the bursty phase. These trends are also evident in the gas fractions: bulge-dominated systems tend to reach gas fractions at or before , while disk dominated systems maintain high gas fractions until late times.
4.4 Galaxy mergers
Second, comparing the evolution of Batman and Juliet reveals the varying impacts of mergers on the morphologies. Batman, which experiences a double merger at (; revealed by the sharp up-tick in ) when the halo mass is relatively low, has a large amount of cold gas dumped into the halo. That gas then forms nearly half of the stellar mass over the next , the majority of which ends up as a compact, dispersion supported system. Other bulge-dominated galaxies in our sample typically experience similarly large mergers at early times (when the systems have and therefore no extended “hot halos” of gas; see, e.g., Kereš et al., 2005). Those mergers then tend to funnel their gas into the center of the galaxy relatively rapidly (Barnes & Hernquist, 1991; Bournaud et al., 2011; Zolotov et al., 2015). Mergers that occur later (when the hot halo is in place), however, tend to have their gas gradually stripped off and incorporated into the central galaxy more gradually. Juliet, for example, has a gas-rich halo fall inside the virial radius at , but the gas in that subhalo is slowly stripped off and accreted onto the central disk over the course of several pericentric passages, feeding an extended star forming disk.
Overall, visual inspection of the movies indicates that large galactic mergers do typically lead to bulges in our sample. This is particularly true those mergers occur on first infall (i.e. with low angular momentum), before the gas in the merging system can be gradually stripped and mixed with the halo, then more gently added on to the host (in agreement with the results of Sales et al., 2012 regarding morphology as a function of the dominant gas accretion mode). The prominent bulges of Batman, m12q, m12b, and Remus, for example, were all created by such events. However, the sizes of the bulges built by these events varies: Robin experiences such a merger at , but the overall masses were low at that time, leading to a small bulge relative to the disk that grows later.
Because a small fraction of the stellar mass in the central galaxy is formed ex situ (i.e. brought in by mergers; typically less than 5%), they do not significantly contribute directly to (also see Anglés-Alcázar et al., 2017). The actual ex situ fraction is also not correlated with morphology (–0.55), and in the majority of our sample, the deposited ex situ stars are typically dispersion supported. However, a few galaxies in our sample have accreted stars that contribute to the disk: three galaxies have their ex situ circularity distributions peak at , and in particular, our two diskiest galaxies have even their accreted stars on disky orbits with peaking at and .
4.5 Secular evolution and bulges
Not all bulges are built by mergers, however: neither m12m, m12i, nor Louise experience a major head-on galactic merger, but all host dispersion-supported stars today. The bulge in m12m is built by a secular bar-buckling event (Sanderson et al., in prep.). Meanwhile, m12i hosts a compact gas disk that initially loses angular momentum in a series of mergers, but then slowly builds up a larger disk at late times. Therefore, systems that have undergone direct galactic mergers are more likely to host a bulge than compared to those evolving just under secular evolution (internal effects), but the exact morphology depends on the interplay between the merger history, star formation history, and angular momentum of the gas that builds the disk.
4.6 Clump sinking/migration
Both observations (e.g. Förster Schreiber et al., 2011, and references therein) and simulations (e.g. Mandelker et al., 2017) of star-forming, disky galaxies at have found evidence for large (–) gas clumps that may migrate to the centers of their host disks to form secular bulges. However, the galaxies we study here are low enough mass at that we simply do not expect or see this channel of bulge formation. Moreover, we note that Oklopčić et al. (2017) showed that while giant clumps do form in massive galaxies at in the FIRE simulations, there was no evidence that these clumps have a net inward migration inwards that build a bulge, even at higher masses than we study here.
4.7 Misalignments and counter-rotating disks
By examining the angular momentum of the material that end up in the galaxy and halo at turn-around (), Sales et al. (2012) argued that disk-dominated galaxies are typically formed out of well-aligned material, while bulge-dominated systems are more likely to experience misaligned accretion events. We see some evidence for this picture in our sample: m12q, in particular, is formed out of the merger of two counter-rotating disks at , and Batman and m12b also experience large, misaligned galactic mergers.
However, in our sample, this effect manifests primarily through mergers, and it therefore has either a dramatic impact or a nearly negligible one: the fraction of counter-rotating stellar mass () at is less than in the remaining twelve galaxies and, as we show in §5.2, the fraction that forms counter-rotating is even smaller. Moreover, §5.2 demonstrates that the fraction of stars that form in a bulgy configuration () is relatively smooth across our sample, suggesting a minor (or relatively constant) contribution from misaligned gas that forms stars before integrating with the disk. However, our results do not preclude the possibility of misaligned accretion contributing to torquing the disk and shifting stars to lower circularities. Together with the large scatter in the trend identified by Sales et al. (2012), we conclude that our results are in overall agreement with theirs.
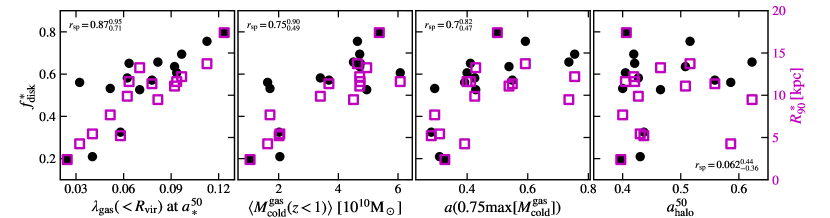
4.8 Summary: the evolution of the gas mass and spin
We quantify these trends in Figure 8. As in Figure 3 and 5, the black circles show and the magenta squares indicate . From left to right, the -axes plot the spin parameter of the gas in the halo at the scale factor when half of the stellar mass had formed, the average cold gas mass within the halo after , the scale factor when first reaches 75% of its peak, and the scale factor when the halo mass reaches half of the value, . The first three are positively, and relatively strongly, correlated with morphology: the spin parameter of the gas at is actually the tightest (non-morphological) correlation we have identified, and displays the tightest relationship outside of other related spin parameters. In fact, is even more tightly correlated with morphology than the spin parameter of the gas in the halo at , which has – . We find similar correlations for other descriptions of the gas accretion history of the halo, such as the scale factor when the total gas mass within first reaches 75% of its maximum.
Together, Figures 7 and 8 suggest that disk-dominated galaxies are formed in systems that maximize their star forming reservoir at late times (often via fresh gas delivered by infalling subhalos), and where the gas that will turn into stars at late times has a high spin. These conditions often coincide – gas that infalls at late times, whether through mergers or smooth accretion, tends to have a higher impact parameter and therefore more angular momentum than similar interactions at early times (White, 1984; Peirani et al., 2004; Kereš & Hernquist, 2009; Stewart et al., 2011; Pichon et al., 2011; Stewart et al., 2013; Lagos et al., 2017; Stewart et al., 2017). This picture is also largely consistent with the results of previous theoretical and observational works, which have generally found that stellar disks form inside-out and are composed of young stars, while the oldest stars reside in the galactic bulge (Kepner, 1999; Pilkington et al., 2012; Howes et al., 2015). It is also relatively unsurprising based on the coloring in Figure 1, which indicates that the youngest stars in each galaxy have disk-like kinematics. Unfortunately, it further reinforces the discussion above that it is difficult to accurately predict the morphology of a galaxy that will form in a given halo based on a DMO simulation, as the morphology is primarily driven by the gas dynamics. The ubiquity of galactic winds and gas recycling in the FIRE simulations further complicates efforts to connect DMO simulations to the galactic morphology/kinematics (Anglés-Alcázar et al., 2014; Muratov et al., 2015; Anglés-Alcázar et al., 2017).
Any individual bulge, meanwhile, can be sourced by either mergers or secular processes, and both contribute significantly. However, the former are more important at early times, while the latter typically lead to later bulge formation. In fact, when mergers happen at later times in our sample, they tend to be smaller, gas-rich galaxies merging onto the central host and depositing more gas at larger radii, enhancing the chance of disk survival (consistent with Hopkins et al., 2009b). In our limited sample, however, there is no obvious way to attribute all morphological trends to “merger history” or to “bar formation.”
4.9 Predicting morphology from DM-only properties
To emphasize the difficulty of using a DMO simulation to a priori estimate the morphology of a galaxy in light of the tight correlation between at (which suggests that a similarly tight correlation might exist for at some ), Figure 9 shows galactic morphology against various spin parameters at two scale factors: and , the half-mass time of the total halo mass; only the latter is available in a DMO simulation. The first panel shows the spin parameter of the dark matter in the baryonic simulation at . While it is less tightly correlated with morphology than the spin parameter of the gas in the halo at the same scale factor (Figure 8), the relationship remains relatively tight. The second panel demonstrates that the correlation between the DM spin (at ) and morphology is not driven by interactions between the baryons and the DM – the spin parameter in the DMO simulation at the same scale factor also correlates with morphology, though again less strongly.999Though we have not identified any direct correlations between DMO halo properties and , the relationship in the second panel suggests that, if one could predict the galaxy half-mass time from a DMO simulation alone, there may be a path from the properties of the halo in the DMO simulation to the galactic morphology. However, those correlations have not yet appeared at the (earlier) : the third panel shows that the spin parameter of the gas at is only weakly correlated with morphology, and the final panel illustrates that the spin parameter in the DMO simulation contains little information at this time (as it does at ). We also note that is typically – times the spin of the dark matter (both at high and at ; first pointed out by Stewart et al., 2011), emphasizing the disconnect between the angular momentum of the baryons (particularly those that eventually form the galaxy) and the halo. Moreover, while there is a reasonably tight correlation between and (–0.92), a direct route from DMO halo properties to galaxy morphology would require a similar correlation between ) and , which we see no strong evidence for (–0.85).
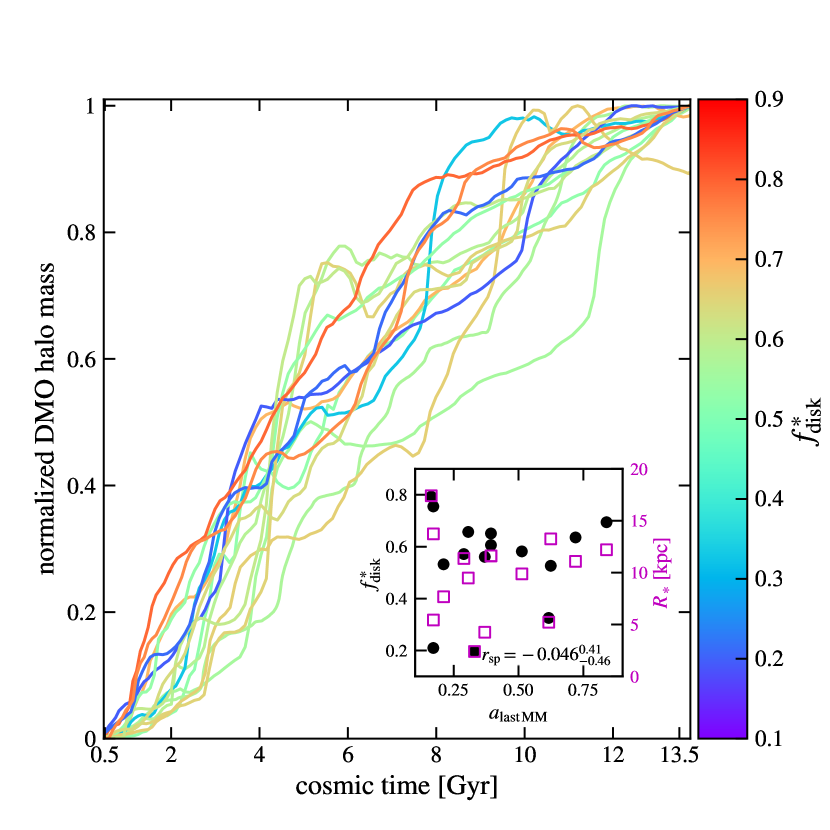
We also explore trends with the accretion history of the main branch of the DMO halo in Figure 10. The inset panel shows the scale factor of the last major merger in the DMO run against the galactic morphology.101010Merger times and mass accretion histories are drawn from merger trees built with consistent-trees (Behroozi et al., 2013b) using rockstar (Behroozi et al., 2013a) halo catalogs. The curves are colored by ; the most bulge-dominated galaxies tend to have higher masses at early times, but the halos that host the galaxies with the highest disk fractions in our sample typically have even higher (normalized) masses at any . This is similar to the result in Figure 8: the evolution (and spin parameter) of the halo contains relatively little information about the galactic morphology compared to the evolution (and spin parameter) of the galaxy itself.
4.10 Other
In addition to the properties shown in Figures 5, 8, 9, and 10 and discussed above, we have also checked for correlations with numerous other parameters of the galaxy, halo, or DMO halo both at and at higher redshifts, including their growth histories. Examples of those that correlate with the morphology, but less strongly than those we present above, include properties associated with the star formation history, such as the amount of time that the galaxy maintains a (200 Myr averaged) star formation rate (SFR) of at least 50% of its peak value and the fraction of stars formed during that time. Similarly, the actual peak SFR shows a weak anti-correlation: relatively constant, extended star formation is more likely to create a well-ordered disk (as discussed in Muratov et al., 2015). However, the scale factor when the galaxy reaches its peak SFR is uncorrelated with morphology today ( – 0.54). The fraction of specific angular momentum in the disk, , is also weakly correlated with morphology, as is the spin of the gas/halo at .
Finally, a non-exhaustive list of properties that show no statistically significant signs of correlation with or include (along with their associated bootstrapped 95% CI on ) includes:
-
•
( – ),
-
•
the total angular momentum in the DMO halo at ( – ),
-
•
the NFW scale radius of the DMO halo at ( – ),
-
•
the shape of the DMO halo at various radii ( – at 10 kpc and – at 300 kpc),
-
•
the fraction of in bound subhalos at ( – ),
-
•
the scale factor at which the SFR peaks ( – ),
-
•
the , 100-Myr-averaged SFR ( – ) and specific SFR ( – ),
-
•
the fraction of stellar mass formed after ( – ),
-
•
the fraction of halo mass accreted after ( – ),
-
•
the fraction of in-situ stars within 30 kpc ( – ),
-
•
the mass of the stellar halo, whether selected by distance ( – ) or formation distance ( – ),
-
•
the maximum gas mass within over cosmic time ( – )
-
•
the mean stellar age ( – ).
The final point appears contradictory to the picture that we describe above at first glance: if disks form late, then one would naively expect the mean stellar age, or , to correlate with morphology. However, by close inspection of Figure 1 (and as we will show further in Section 5), one can see that while the disk of a given galaxy is (almost) always younger than the bulge of that galaxy, disks emerge at different times in different galaxies. For example, the disk of Romeo is composed of stars with an average age of , while m12f, which hosts a disk and a bulge, formed its disk much more recently.
5 The evolution of the stellar morphology
5.1 Overview
As the previous section showed, the morphology is driven primarily by a combination of the accretion histories, the degree of rotation support in the halo at the half-mass time of the galaxy, and the relative amount of mass and angular momentum from the halo that end up in the disk. However, the morphology is also the culmination of star formation in the galaxy, stars being deposited onto the galaxy through mergers, and dynamical interactions altering the orbits of existing stars. In this section, we explore the birth morphologies of stars and the extent to which their orbits are shifted to lower circularities over time, and we demonstrate that while the morphologies do correlate with the spin of the gas that they are born out of, the full picture depends on the mutual evolution of the gas kinematics and star formation rate, and the impact of dynamical heating on the galactic disk. We do not explicitly investigate the radial or vertical structure of the disk as a function of time, but we refer the reader to Ma et al. (2017b) for a detailed discussion of the evolution of the disk of m12i simulated with FIRE-1.
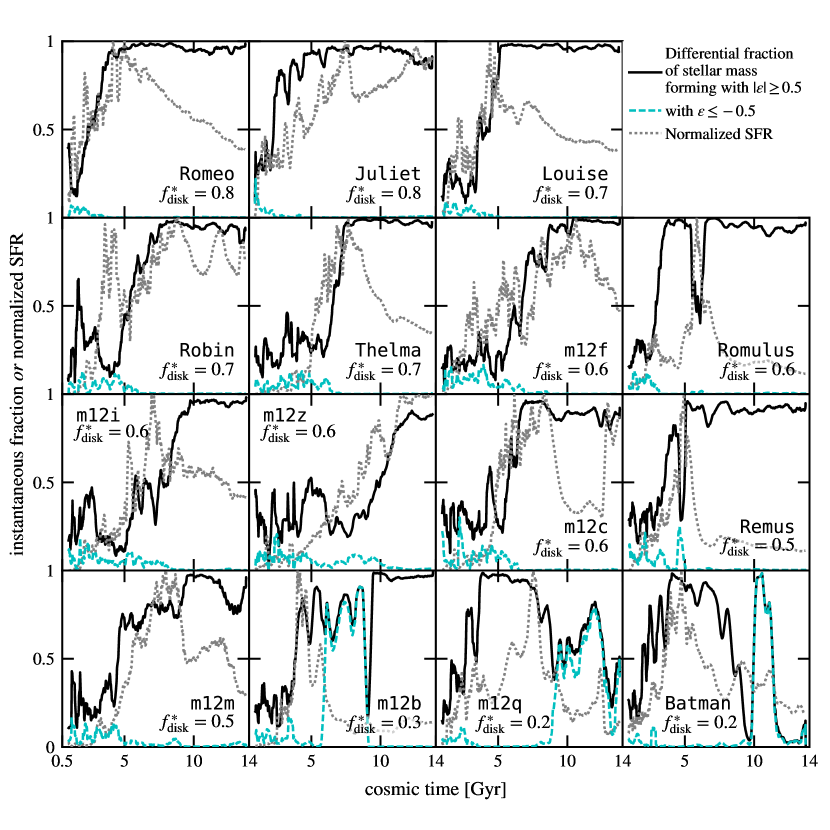
Figure 11 shows, as a function of time, the instantaneous fraction of stars forming with circularities (measured at the time of formation) and with , i.e. in a disk that is counter-rotating relative to the overall angular momentum axis of the existing stars in the galaxy, and the normalized star formation rate (SFR). We define the instantaneous birth disk fraction from the first snapshot that each particle appears in, capturing the kinematics of stars that are at most old. Circularities, and therefore disk fractions, are defined relative to the evolving axis of the angular momenta of all the stars in the galaxy at a given time. The curves indicate running averages smoothed over , but the qualitative conclusions are insensitive to the size of this window. We count stars within , but we find similar results using all stars within a fixed cut of physical kpc.
5.2 Most stars form in disky configurations
Figure 11 illustrates several points about the evolution of the disk morphology. First, at late times, most stars forming in MW-mass galaxies (black curves) do so with disk-like kinematics. This does not preclude them from forming in bulges, however, since they can be compact, rotationally-supported pseudo-bulge components. Even in our most bulge-dominated system (), the “birth disk fraction” is high at late times – only m12q does not have at some point after Gyr. The three galaxies with the lowest at are also the only three to experience a significant fraction of counter-rotating star formation. In m12b, that star formation eventually builds enough of a disk to flip the overall angular momentum axis of the galaxy (which occurs at Gyr when the cyan curve goes to zero), but in Batman and m12q it only decreases the disk fraction by adding stars opposite to the predominant . Therefore, even though SFRs typically peak around , and dynamical interactions shift stars to lower circularity as time passes, MW-mass galaxies usually increase their disk fractions at late times through fresh star formation. Though it is not shown here, the disk size also tends to grow smoothly after .
The remainder of the sample demonstrates that the interplay between the SFR and the fraction of stars forming in the disk as a function of time is also instrumental to the morphology. During the very early of stages of their growth ( Gyr), the hosts are dwarf-size systems and experience chaotic, bursty star formation in clumpy, gas-rich dIrr-type progenitor galaxies. As the gray curves show, though, star formation rates are typically relatively low at these early times. The transition to ordered star formation (which is strongly correlated with the emergence of an ordered gas disk; Ma et al., 2017b; Simons et al., 2017; Ceverino et al., 2017) occurs at different times and at a different rate in each system, but it often coincides with a peak in the star formation.
Both the timing of the transition and the behavior of the SFR following it strongly influences the morphology: galaxies with shift to ordered star formation relatively early and maintain a relatively high SFR until . Lower galaxies either change over later (e.g. m12z) or have a relatively low SFR following the switch (e.g. Remus).
5.3 Disruption and disordering of stellar disks
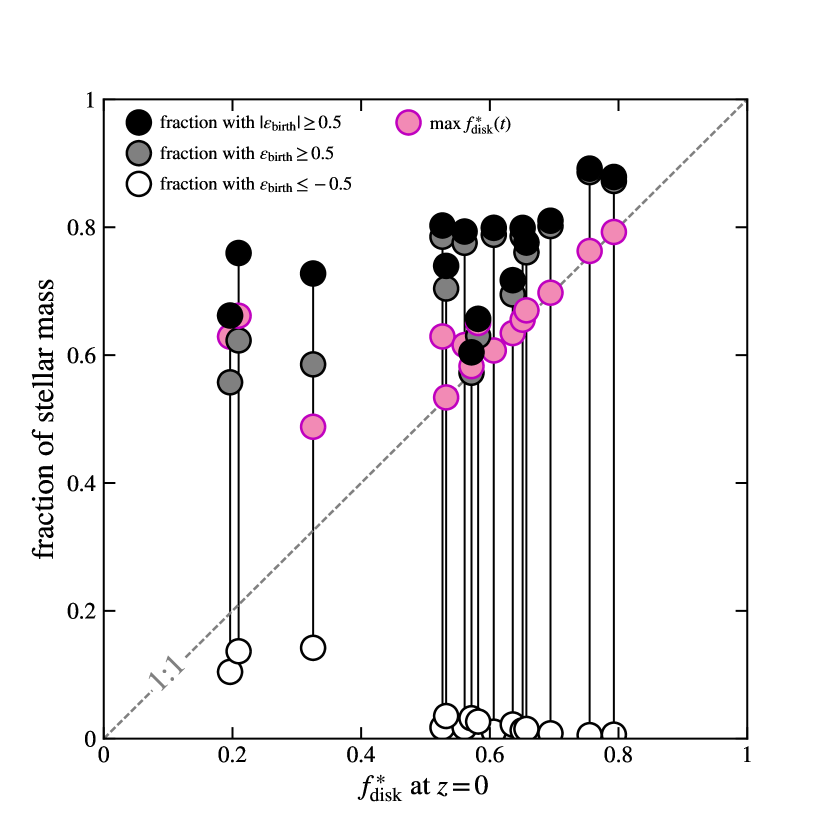
Disks built by ordered star formation can also be heated and destroyed. Figure 12 plots the disk fraction at against both the cumulative fraction of stellar mass born in the galaxy with high and the maximum instantaneous fraction of stellar mass in the galaxy at any given time with high circularities. The scatter in is relatively small: all of the galaxies in our sample have . Accounting for counter-rotating star formation, all of our systems form of their stars in a disk. In other words, most stars form in disky configurations, as argued above. Furthermore, counter-rotating young stars (which would be formed out of retrograde star-forming gas) are typically too rare to have a significant impact on the galaxy (§4.7). Though we do not show it here, we also note that the fraction of counter-rotating () stellar mass at is extremely small in all but the most bulge-dominated systems. Moreover, while the maximum counter-rotating fraction at any given time is – across our sample, these maxima occur at very early times (–) when the galaxies were at the dwarf mass scale. The exception is m12b, which builds a disk that is initially counter-rotating relative to the existing bulge but becomes large enough to dominate the angular momentum of the galaxy and flip the overall vector; m12b therefore maximizes its counter-rotating fraction immediately before this transition at .
Because the galaxy masses and the degree of order in the galaxy build up over time, most of our galaxies have , i.e., the majority of our sample is at its “most disk-dominated” today.
However, even bulge-dominated galaxies tended to have relatively strong disks at earlier times before having them destroyed by mergers and diluted by misaligned star formation. At , all of Batman, m12q, and m12b had disks that comprised 50–70% of their stellar mass at that time. That is, while bulge-dominated systems arise from a combination of both nature and nurture, those in our sample were primarily differentiated from disky systems by the latter. Even though they do have more than twice as much retrograde star formation (relative to their total stellar mass) as any of the diskier galaxies in our sample, the difference between their maximum and their is much larger, indicating that they were generally subject to more disk scrambling than the disk-dominated galaxies.
Stars may also be shifted to lower circularities, while remaining on disk-like orbits, if the overall angular momentum axis of the galaxy shifts over time. Most of our sample is only marginally impacted by this effect: the angular momentum axis of our galaxies changes by after in all but one of our galaxies. The exception, moreover, is m12b, which, as described above, builds a large enough young disk around the existing compact, bulgy core at late times to flip the overall angular momentum axis of the galaxy.
As discussed above, however, the morphology is a very weak function of mean stellar age: the most bulge-dominated systems do tend to be the oldest, but the youngest systems are not necessarily disk-dominated. Thus, the length of time over which stellar orbits can be perturbed is not a primary driver of morphology. In other words, while the bulge-dominated systems in our sample do have their pre-existing stellar disks destroyed by mergers or counter-rotating star formation, this can happen early or late in cosmic time.
6 Gas morphologies in MW-mass FIRE-2 galaxies
As reflected in §5 via the stellar circularities at birth, the star-forming gas in MW-mass galaxies is typically in a well-ordered disk with the majority of star formation occurring with . That is, regardless of the instantaneous state of the stars in the galaxy, the short dynamical memory of the gas leads to thin disks at nearly all times in massive galaxies. For a detailed investigation of gas morphologies across a larger range of host masses in the FIRE-2 simulations, we refer the reader to El-Badry et al. (2017), who examined gas angular momentum and HI morphology as a function of galaxy mass from the dwarf scale to the MW scale, and showed that in dwarfs the degree of rotation support can be much lower.
6.1 MW-mass galaxies have rotationally supported gas disks
As demonstrated in Figure 1, almost all of the gas in the galaxies is on circular, disk-like orbits at (with the exception of m12q). Even without accounting for elliptical orbits, gas rotation curves are consistent with almost complete rotation support out to roughly in all the galaxies except Batman and m12q. In fact, with the exception of m12q, all of the galaxies have , with nine of the fifteen exceeding . This is not particularly surprising at these masses, where pressure support for K gas is very weak.
6.2 Visual morphologies of gas disks
Figure 13 shows face-on and edge-on projections of the gas in the FIRE-2 galaxies, again sorted by increasing . As in Figure 2, the circles and rectangles indicate and . Even with (almost) all of the galaxies having , there exists some diversity in the shape of the disks, and even more diversity in the radial extent. For example, m12f very recently interacted with a gas-rich subhalo, leaving a marginally disturbed gas disk at . m12q has effectively no gas remaining at , having consumed the last of its gas disk at . Batman has a clear warp near the center of the disk, likely created because the gas disk is formed out of an ongoing accretion event. Romulus and Louise display similar warps near the edges of their disks. Batman is also the only galaxy with a gas disk misaligned from the stellar disk by more than . This misalignment presumably survives because the gas is being continually replenished at (van de Voort et al., 2015), and likely also because Batman has a relatively spherical stellar distribution: the ratio of the shortest to longest principal axes, , of the stars within is .111111The remainder of the sample all have .
6.3 Sizes of gas disks
Figure 14 explores the radial extent of the gas disks. The radius of the gas disk is closely tied to the amount of gas in the galaxy, in broad agreement with the observed relationship between the size of gas disks and the amount of gas in those disks (e.g. Wang et al., 2016), and potentially in agreement with arguments based on the Toomre (1964) stability parameter (Schmitz et al., in prep.).
is also correlated with the morphology of the stellar component: the points in Figure 14 are colored by and are generally correlated with , though the gas disks are typically more extended. To the extent that this is causal, it appears primarily to owe to the fact that higher late-time gas masses are associated both with larger and diskier galaxies.
Though our sample size is small, and we have yet to identify any underlying physical drivers, we note galaxies in our paired sample tend to have higher overall. This is apparent even by eye in Figure 13: the numbers in parentheses, which indicate the rank of for each galaxy, show that the five largest gas disks are all in halos that reside in a Local Group-like environment. However, with such a small sample size, it is impossible to reject the null hypothesis that they are drawn from the same distribution and, without tying to a property of the DMO halo, we cannot directly test this hypothesis with a larger sample. Neither nor the residuals about a power-law fit of strongly correlate with any of the DMO halo properties that we have checked, including the spin of the DMO halo (–). We have also tested whether the MMW98 accurately predicts the sizes of gas disks at based on the DMO halo, and find relatively poor correlations between the model predictions and the actual radial extents (– for the isothermal potential and – for the NFW model).
7 Conclusions
In this work, we examined the kinematics and morphologies of MW-mass galaxies () simulated with the FIRE-2 physics. Our sample includes fifteen galaxies with effective stellar radii ranging from – , and kinematic disk fractions varying from – . We first demonstrated that these morphological measures broadly correlate with each other (though there is appreciable scatter), and that both also correlate with a variety of other morphological measures. In particular, is a reasonably accurate descriptor of the overall morphology over this narrow mass range at .
We then showed that the Mo et al. (1998) model, wherein the baryons that form the disk are assumed to have the same specific angular momentum of their host DM halos, produces an estimate for galaxy sizes (and how they correlate with mass over a large dynamic range) that is accurate that the order-of-magnitude level, but fails to recover the actual half-mass radii of our galaxies. This is due primarily to the scatter in the amount of specific angular momentum that each galaxy acquires: has nearly an order of magnitude spread overall. Moreover, there are no obvious trends between the morphology of a galaxy and either the mass accretion history or the merger history of the host halo in the DMO simulation: both our most bulge-dominated and our most disk-dominated galaxies experience their last major merger at –. It therefore remains difficult to predict the morphology of a galaxy that would form in a given halo based purely on the information available from a DMO simulation.
Instead, accurate predictors of morphology within this narrow mass range are related to the gas accretion and galaxy merger histories. Systems that maintain high gas fractions to late times tend to be disk-dominated at (generally growing inside-out, with increasing over time), while those that maximize their star forming reservoir early tend to be bulge-dominated at . Based primarily on visual inspection of the movies, the amount of gas in the galaxy over time appears to be driven by a combination of the impact parameter and timing of galactic mergers, along with the amount of gas in the halo that cools and accretes onto the galaxy at late times. We reiterate that our results apply only at this specific mass, however: lower mass galaxies that cannot maintain an ordered gas disk at late times (e.g. El-Badry et al., 2017) would not necessarily follow the trends identified here.
We find good correlations between morphology and the spin of the gas in the halo when the galaxy had formed half of its stellar mass, along with the average amount of gas available to form stars at late times. These quantities also correlate (though less strongly) with one another: gas that infalls at later times tends to have more angular momentum. However, we find no clear route from the host properties available only from a DMO simulation to galactic morphology: neither the DMO mass accretion history, the half-mass formation time of the halo nor the spin of the dark matter at the halo half-mass formation time (either in the hydrodynamic or DMO simulation) correlate significantly with morphology, emphasizing the difficulty of using DMO simulations to predict morphology. Nonetheless, our analysis does not preclude a multivariate relationship between morphology and DMO properties. In fact, given the correlation between at and the morphology at , there are hints that such a relationship may exist, but we lack the sample size to test for those.
The prediction that the spin of the gas in the halo at the stellar half-mass formation time (i.e. the angular momentum support of the gas that contributes to building the galaxy) drives the late-time morphologies of MW-mass galaxies may eventually be observationally falsifiable. Wide-field observations with integral field spectroscopy (e.g. with instruments similar to the Keck Cosmic Web Imager; Morrissey & KCWI Team, 2013) could potentially map out the angular momentum in the cold CGM gas and ultimately measure the distribution of that angular momentum across halos. If the picture laid out here is correct, then the shapes of that distribution and the distribution of the morphologies of MW-mass galaxies should broadly agree.
The morphologies can also be viewed as the summation of a Hubble time of star formation and subsequent heating of those stars (either from mergers, e.g. Toomre & Toomre, 1972; Hernquist, 1992; Quinn et al., 1993; Sanders & Mirabel, 1996, or from internal interactions, e.g. Minchev & Quillen, 2006; Saha et al., 2010). We showed that most stars in MW-mass galaxies formed from gas that was disky at the time of star formation (i.e. with circularity ). The most bulge-dominated galaxies at tend to have the lowest fraction of stars born in a prograde disk (and the highest fraction born in a retrograde one), but they also show the largest differences between their birth and kinematics. Therefore, while dispersion supported galaxies arise from a combination of birth stellar kinematics and subsequent stellar heating that destroys ordered rotation, our results suggest the latter effect is far more important.
At late times (), nearly all of the stars born in MW-mass galaxies have disk-like kinematics, such that always grows after . We do see two exceptions, which actually lower their disk fractions (slightly) at by forming stars in a counter-rotating disk, but this is only possible because those galaxies are already dispersion supported when cold gas is added to the central galaxy at low redshift. Moreover, we emphasize that the counter-rotating disks do not determine the bulginess of the galaxy. We do not expect “clump sinking” to play a significant role in bulge formation for systems that are MW-mass at (whose progenitors were dwarfs at high redshift).
The gas in the MW-mass FIRE-2 galaxies, meanwhile, always settles into a largely rotation-supported disk at late times. All but one of our galaxies maintain that disk to , either though fresh accretion from merging satellites or condensation out of the CGM. The size of the gas disk is primarily driven by its mass.
Our results generally agree with the results of some previous work on the formation of galactic disks in hydrodynamic simulations of MW-mass galaxies, which have found that star formation is chaotic and bursty at high redshift, with well-ordered gas disks only appearing after for galaxies with MW-masses at (for more/less massive galaxies, the transition occurs earlier/later; see Muratov et al., 2015; Feldmann & Mayer, 2015; Simons et al., 2017; Hayward & Hopkins, 2017; Sparre et al., 2017; Faucher-Giguère, 2018.) The supply of the gas available to form that disk, therefore, determines the amount of stars that form with tangential orbits relative to radial orbits. In agreement with several authors (e.g. Scannapieco et al., 2009; Sales et al., 2012; Rodriguez-Gomez et al., 2017), we find no strong morphological trends with the spin of the DM halo at the MW-mass scale.
While our qualitative results are robust to the mass resolution of the simulations (Appendix A), the quantitative morphology of a given galaxy does change slightly with resolution. However, these changes can typically be understood in terms of the trends that we identify here (e.g. because a slightly different merger history arises at different resolutions). We also caution that half of our sample is in Local Group-like pairs. While these are more directly comparable to the MW and Andromeda galaxies than simulations of isolated MW-mass hosts, there may be environmental effects that bias our results. However, because these effects should enter via properties of the halo or galaxy, such as the halo spin or mass accretion history, our analysis will automatically include any changes caused by the 1 Mpc environment.
This work has investigated potential relationships between theoretical measures of morphology and (potentially unobservable) physical properties of the simulated galaxies in an attempt to understand the physical driver(s) of morphology in the simulations, not to compare with observations. We plan to probe the relationship between theoretical morphological measures of the FIRE-2 galaxies, like those presented here, and estimates extracted from mock observations, including the kinematic distributions (e.g. Zhu et al., 2018), in future work.
Acknowledgments
The authors thank Astrid Lamberts, Coral Wheeler, Evan Kirby, Laura Sales, and Virginia Kilborn for valuable discussions. We also thank the Santa Cruz Galaxy Formation Workshop, the Galaxy Formation and Evolution in Southern California (GalFRESCA) workshop, and the Swinburne-Caltech workshop for spawning useful discussions that significantly improved the quality of the manuscript, and we thank Alexander Knebe, Peter Behroozi, and Oliver Hahn, respectively, for making AHF, rockstar and consistent-trees, and MUSIC publicly available.
Support for SGK was provided by NASA through Einstein Postdoctoral Fellowship grant number PF5-160136 awarded by the Chandra X-ray Center, which is operated by the Smithsonian Astrophysical Observatory for NASA under contract NAS8-03060. Support for PFH was provided by an Alfred P. Sloan Research Fellowship, NSF Collaborative Research Grant #1715847 and CAREER grant #1455342. AW was supported by a Caltech-Carnegie Fellowship, in part through the Moore Center for Theoretical Cosmology and Physics at Caltech, and by NASA through grants HST-GO-14734 and HST-AR-15057 from STScI. RES is supported by an NSF Astronomy & Astrophysics Postdoctoral Fellowship under grant AST-1400989. KEB was supported by a Berkeley graduate fellowship, a Hellman award for graduate study, and an NSF Graduate Research Fellowship. EQ was supported in part by NSF grant AST-1715070 and a Simons Investigator Award from the Simons Foundation. JSB was supported by NSF grant AST-1518291 and by NASA through HST theory grants (programs AR-13921, AR-13888, and AR-14282.001) awarded by STScI, which is operated by the Association of Universities for Research in Astronomy (AURA), Inc., under NASA contract NAS5-26555. ZH and CAFG were supported by NSF through grants AST-1412836, AST-1517491, AST-1715216, and CAREER award AST-1652522, and by NASA through grant NNX15AB22G, and ZH additionally acknowledges support from support from Northwestern University through the “Reach for the Stars” program. FvdV acknowledges support from the Klaus Tschira Foundation. The Flatiron Institute is supported by the Simons Foundation. DK acknowledges support from NSF grant AST-1412153, NSF grant AST-1715101 and the Cottrell Scholar Award from the Research Corporation for Science Advancement. MBK acknowledges support from NSF grant AST-1517226 and from NASA grants NNX17AG29G and HST-AR-13896, HST-AR-14282, HST-AR-14554, HST-GO-12914, and HST-GO-14191 from STScI.
Numerical calculations were run on the Caltech compute cluster “Wheeler,” allocations from XSEDE TG-AST130039 and PRAC NSF.1713353 supported by the NSF, NASA HEC SMD-16-7223 and SMD-16-7592, and High Performance Computing at Los Alamos National Labs. This work also made use of Astropy, a community-developed core Python package for Astronomy (Astropy Collaboration et al., 2013), matplotlib (Hunter, 2007), numpy (van der Walt et al., 2011), scipy (Jones et al., 01), ipython (Perez & Granger, 2007), and NASA’s Astrophysics Data System.
References
- Abadi et al. (2003) Abadi M. G., Navarro J. F., Steinmetz M., Eke V. R., 2003, ApJ, 597, 21
- Agertz & Kravtsov (2016) Agertz O., Kravtsov A. V., 2016, ApJ, 824, 79
- Agertz et al. (2011) Agertz O., Teyssier R., Moore B., 2011, MNRAS, 410, 1391
- Anglés-Alcázar et al. (2014) Anglés-Alcázar D., Davé R., Özel F., Oppenheimer B. D., 2014, ApJ, 782, 84
- Anglés-Alcázar et al. (2017) Anglés-Alcázar D., Faucher-Giguère C.-A., Kereš D., Hopkins P. F., Quataert E., Murray N., 2017, MNRAS, 470, 4698
- Astropy Collaboration et al. (2013) Astropy Collaboration et al., 2013, A&A, 558, A33
- Aumer et al. (2013) Aumer M., White S. D. M., Naab T., Scannapieco C., 2013, MNRAS, 434, 3142
- Bamford et al. (2009) Bamford S. P., et al., 2009, MNRAS, 393, 1324
- Barnes & Hernquist (1991) Barnes J. E., Hernquist L. E., 1991, ApJ, 370, L65
- Behroozi et al. (2013a) Behroozi P. S., Wechsler R. H., Wu H.-Y., 2013a, ApJ, 762, 109
- Behroozi et al. (2013b) Behroozi P. S., Wechsler R. H., Wu H.-Y., Busha M. T., Klypin A. A., Primack J. R., 2013b, ApJ, 763, 18
- Behroozi et al. (2013c) Behroozi P. S., Wechsler R. H., Conroy C., 2013c, ApJ, 770, 57
- Bell et al. (2012) Bell E. F., et al., 2012, ApJ, 753, 167
- Bournaud et al. (2011) Bournaud F., et al., 2011, ApJ, 730, 4
- Bower et al. (2006) Bower R. G., Benson A. J., Malbon R., Helly J. C., Frenk C. S., Baugh C. M., Cole S., Lacey C. G., 2006, MNRAS, 370, 645
- Brooks & Christensen (2016) Brooks A., Christensen C., 2016, Galactic Bulges, 418, 317
- Bryan & Norman (1998) Bryan G. L., Norman M. L., 1998, ApJ, 495, 80
- Bullock et al. (2001) Bullock J. S., Kravtsov A. V., Weinberg D. H., 2001, ApJ, 548, 33
- Cattaneo et al. (2006) Cattaneo A., Dekel A., Devriendt J., Guiderdoni B., Blaizot J., 2006, MNRAS, 370, 1651
- Ceverino et al. (2017) Ceverino D., Primack J., Dekel A., Kassin S. A., 2017, MNRAS, 467, 2664
- Chan et al. (2015) Chan T. K., Kereš D., Oñorbe J., Hopkins P. F., Muratov A. L., Faucher-Giguère C.-A., Quataert E., 2015, MNRAS, 454, 2981
- Cheung et al. (2012) Cheung E., et al., 2012, ApJ, 760, 131
- Colín et al. (2016) Colín P., Avila-Reese V., Roca-Fàbrega S., Valenzuela O., 2016, ApJ, 829, 98
- Crain et al. (2009) Crain R. A., et al., 2009, MNRAS, 399, 1773
- Croton et al. (2006) Croton D. J., et al., 2006, MNRAS, 365, 11
- Di Cintio et al. (2014a) Di Cintio A., Brook C. B., Macciò A. V., Stinson G. S., Knebe A., Dutton A. A., Wadsley J., 2014a, MNRAS, 437, 415
- Di Cintio et al. (2014b) Di Cintio A., Brook C. B., Dutton A. A., Macciò A. V., Stinson G. S., Knebe A., 2014b, MNRAS, 441, 2986
- El-Badry et al. (2016) El-Badry K., Wetzel A., Geha M., Hopkins P. F., Kereš D., Chan T. K., Faucher-Giguère C.-A., 2016, ApJ, 820, 131
- El-Badry et al. (2017) El-Badry K., et al., 2017, preprint, (arXiv:1705.10321)
- Escala et al. (2017) Escala I., et al., 2017, preprint, (arXiv:1710.06533)
- Fall (1983) Fall S. M., 1983, in Athanassoula E., ed., IAU Symposium Vol. 100, Internal Kinematics and Dynamics of Galaxies. pp 391–398
- Fall & Efstathiou (1980) Fall S. M., Efstathiou G., 1980, MNRAS, 193, 189
- Fall & Romanowsky (2013) Fall S. M., Romanowsky A. J., 2013, ApJ, 769, L26
- Fang et al. (2013) Fang J. J., Faber S. M., Koo D. C., Dekel A., 2013, ApJ, 776, 63
- Faucher-Giguère (2018) Faucher-Giguère C.-A., 2018, MNRAS, 473, 3717
- Faucher-Giguère et al. (2009) Faucher-Giguère C.-A., Lidz A., Zaldarriaga M., Hernquist L., 2009, ApJ, 703, 1416
- Feldmann & Mayer (2015) Feldmann R., Mayer L., 2015, MNRAS, 446, 1939
- Fiacconi et al. (2015) Fiacconi D., Feldmann R., Mayer L., 2015, MNRAS, 446, 1957
- Förster Schreiber et al. (2011) Förster Schreiber N. M., et al., 2011, ApJ, 739, 45
- Garrison-Kimmel et al. (2014) Garrison-Kimmel S., Boylan-Kolchin M., Bullock J. S., Lee K., 2014, MNRAS, 438, 2578
- Garrison-Kimmel et al. (2017) Garrison-Kimmel S., et al., 2017, preprint, (arXiv:1701.03792)
- Genel et al. (2015) Genel S., Fall S. M., Hernquist L., Vogelsberger M., Snyder G. F., Rodriguez-Gomez V., Sijacki D., Springel V., 2015, ApJ, 804, L40
- Genel et al. (2017) Genel S., et al., 2017, preprint, (arXiv:1707.05327)
- Governato et al. (2007) Governato F., Willman B., Mayer L., Brooks A., Stinson G., Valenzuela O., Wadsley J., Quinn T., 2007, MNRAS, 374, 1479
- Governato et al. (2009) Governato F., et al., 2009, MNRAS, 398, 312
- Governato et al. (2012) Governato F., et al., 2012, MNRAS, 422, 1231
- Grand et al. (2017) Grand R. J. J., et al., 2017, MNRAS, 467, 179
- Guedes et al. (2011) Guedes J., Callegari S., Madau P., Mayer L., 2011, ApJ, 742, 76
- Hafen et al. (2017) Hafen Z., et al., 2017, MNRAS, 469, 2292
- Hayward & Hopkins (2017) Hayward C. C., Hopkins P. F., 2017, MNRAS, 465, 1682
- Hernquist (1992) Hernquist L., 1992, ApJ, 400, 460
- Hopkins (2015) Hopkins P. F., 2015, MNRAS, 450, 53
- Hopkins (2017) Hopkins P. F., 2017, MNRAS, 466, 3387
- Hopkins et al. (2009a) Hopkins P. F., et al., 2009a, MNRAS, 397, 802
- Hopkins et al. (2009b) Hopkins P. F., Cox T. J., Younger J. D., Hernquist L., 2009b, ApJ, 691, 1168
- Hopkins et al. (2010) Hopkins P. F., et al., 2010, ApJ, 715, 202
- Hopkins et al. (2013) Hopkins P. F., Narayanan D., Murray N., 2013, MNRAS, 432, 2647
- Hopkins et al. (2014) Hopkins P. F., Kereš D., Oñorbe J., Faucher-Giguère C.-A., Quataert E., Murray N., Bullock J. S., 2014, MNRAS, 445, 581
- Hopkins et al. (2017) Hopkins P. F., et al., 2017, preprint, (arXiv:1702.06148)
- Howes et al. (2015) Howes L. M., et al., 2015, Nature, 527, 484
- Hubble (1926) Hubble E. P., 1926, ApJ, 64
- Huertas-Company et al. (2011) Huertas-Company M., Aguerri J. A. L., Bernardi M., Mei S., Sánchez Almeida J., 2011, A&A, 525, A157
- Hunter (2007) Hunter J. D., 2007, Computing In Science & Engineering, 9, 90
- Jones et al. (01 ) Jones E., Oliphant T., Peterson P., et al., 2001–, SciPy: Open source scientific tools for Python, http://www.scipy.org/
- Katz & White (1993) Katz N., White S. D. M., 1993, ApJ, 412, 455
- Kaufmann et al. (2007) Kaufmann T., Wheeler C., Bullock J. S., 2007, MNRAS, 382, 1187
- Kepner (1999) Kepner J. V., 1999, ApJ, 520, 59
- Kereš & Hernquist (2009) Kereš D., Hernquist L., 2009, ApJ, 700, L1
- Kereš et al. (2005) Kereš D., Katz N., Weinberg D. H., Davé R., 2005, MNRAS, 363, 2
- Kravtsov (2013) Kravtsov A. V., 2013, ApJ, 764, L31
- Kroupa (2001) Kroupa P., 2001, MNRAS, 322, 231
- Krumholz & Gnedin (2011) Krumholz M. R., Gnedin N. Y., 2011, ApJ, 729, 36
- Lagos et al. (2017) Lagos C. d. P., Theuns T., Stevens A. R. H., Cortese L., Padilla N. D., Davis T. A., Contreras S., Croton D., 2017, MNRAS, 464, 3850
- Larson et al. (2011) Larson D., et al., 2011, ApJS, 192, 16
- Leitherer et al. (1999) Leitherer C., et al., 1999, ApJS, 123, 3
- Ludlow et al. (2014) Ludlow A. D., Navarro J. F., Angulo R. E., Boylan-Kolchin M., Springel V., Frenk C., White S. D. M., 2014, MNRAS, 441, 378
- Ma et al. (2016) Ma X., Hopkins P. F., Faucher-Giguère C.-A., Zolman N., Muratov A. L., Kereš D., Quataert E., 2016, MNRAS, 456, 2140
- Ma et al. (2017a) Ma X., Hopkins P. F., Feldmann R., Torrey P., Faucher-Giguère C.-A., Kereš D., 2017a, MNRAS, 466, 4780
- Ma et al. (2017b) Ma X., Hopkins P. F., Wetzel A. R., Kirby E. N., Anglés-Alcázar D., Faucher-Giguère C.-A., Kereš D., Quataert E., 2017b, MNRAS, 467, 2430
- Mandelker et al. (2017) Mandelker N., Dekel A., Ceverino D., DeGraf C., Guo Y., Primack J., 2017, MNRAS, 464, 635
- Marinacci et al. (2014) Marinacci F., Pakmor R., Springel V., 2014, MNRAS, 437, 1750
- Merritt et al. (2016) Merritt A., van Dokkum P., Abraham R., Zhang J., 2016, ApJ, 830, 62
- Minchev & Quillen (2006) Minchev I., Quillen A. C., 2006, MNRAS, 368, 623
- Mo et al. (1998) Mo H. J., Mao S., White S. D. M., 1998, MNRAS, 295, 319
- Morrissey & KCWI Team (2013) Morrissey P., KCWI Team 2013, in American Astronomical Society Meeting Abstracts #221. p. 345.05
- Murante et al. (2015) Murante G., Monaco P., Borgani S., Tornatore L., Dolag K., Goz D., 2015, MNRAS, 447, 178
- Muratov et al. (2015) Muratov A. L., Kereš D., Faucher-Giguère C.-A., Hopkins P. F., Quataert E., Murray N., 2015, MNRAS, 454, 2691
- Navarro et al. (1996) Navarro J. F., Frenk C. S., White S. D. M., 1996, ApJ, 462, 563
- Oñorbe et al. (2014) Oñorbe J., Garrison-Kimmel S., Maller A. H., Bullock J. S., Rocha M., Hahn O., 2014, MNRAS, 437, 1894
- Oñorbe et al. (2015) Oñorbe J., Boylan-Kolchin M., Bullock J. S., Hopkins P. F., Kereš D., Faucher-Giguère C.-A., Quataert E., Murray N., 2015, MNRAS, 454, 2092
- Okamoto et al. (2005) Okamoto T., Eke V. R., Frenk C. S., Jenkins A., 2005, MNRAS, 363, 1299
- Oklopčić et al. (2017) Oklopčić A., Hopkins P. F., Feldmann R., Kereš D., Faucher-Giguère C.-A., Murray N., 2017, MNRAS, 465, 952
- Orr et al. (2017) Orr M. E., et al., 2017, preprint, (arXiv:1701.01788)
- Pedrosa & Tissera (2015) Pedrosa S. E., Tissera P. B., 2015, A&A, 584, A43
- Pedrosa et al. (2014) Pedrosa S. E., Tissera P. B., De Rossi M. E., 2014, A&A, 567, A47
- Peebles (1969) Peebles P. J. E., 1969, ApJ, 155, 393
- Peirani et al. (2004) Peirani S., Mohayaee R., de Freitas Pacheco J. A., 2004, MNRAS, 348, 921
- Perez & Granger (2007) Perez F., Granger B. E., 2007, Computing in Science Engineering, 9, 21
- Pichon et al. (2011) Pichon C., Pogosyan D., Kimm T., Slyz A., Devriendt J., Dubois Y., 2011, MNRAS, 418, 2493
- Pilkington et al. (2012) Pilkington K., et al., 2012, A&A, 540, A56
- Pillepich et al. (2017) Pillepich A., et al., 2017, preprint, (arXiv:1703.02970)
- Planck Collaboration et al. (2016) Planck Collaboration et al., 2016, A&A, 594, A13
- Pontzen & Governato (2012) Pontzen A., Governato F., 2012, MNRAS, 421, 3464
- Power et al. (2003) Power C., Navarro J. F., Jenkins A., Frenk C. S., White S. D. M., Springel V., Stadel J., Quinn T., 2003, MNRAS, 338, 14
- Price & Monaghan (2007) Price D. J., Monaghan J. J., 2007, MNRAS, 374, 1347
- Quinn et al. (1993) Quinn P. J., Hernquist L., Fullagar D. P., 1993, ApJ, 403, 74
- Robertson & Bullock (2008) Robertson B. E., Bullock J. S., 2008, ApJ, 685, L27
- Robertson et al. (2006) Robertson B., Bullock J. S., Cox T. J., Di Matteo T., Hernquist L., Springel V., Yoshida N., 2006, ApJ, 645, 986
- Rodriguez-Gomez et al. (2017) Rodriguez-Gomez V., et al., 2017, MNRAS, 467, 3083
- Rodríguez-Puebla et al. (2017) Rodríguez-Puebla A., Primack J. R., Avila-Reese V., Faber S. M., 2017, MNRAS, 470, 651
- Romanowsky & Fall (2012) Romanowsky A. J., Fall S. M., 2012, ApJS, 203, 17
- Roškar et al. (2014) Roškar R., Teyssier R., Agertz O., Wetzstein M., Moore B., 2014, MNRAS, 444, 2837
- Saha et al. (2010) Saha K., Tseng Y.-H., Taam R. E., 2010, ApJ, 721, 1878
- Sales et al. (2012) Sales L. V., Navarro J. F., Theuns T., Schaye J., White S. D. M., Frenk C. S., Crain R. A., Dalla Vecchia C., 2012, MNRAS, 423, 1544
- Salim et al. (2007) Salim S., et al., 2007, ApJS, 173, 267
- Sanders & Mirabel (1996) Sanders D. B., Mirabel I. F., 1996, ARA&A, 34, 749
- Scannapieco et al. (2008) Scannapieco C., Tissera P. B., White S. D. M., Springel V., 2008, MNRAS, 389, 1137
- Scannapieco et al. (2009) Scannapieco C., White S. D. M., Springel V., Tissera P. B., 2009, MNRAS, 396, 696
- Scannapieco et al. (2010) Scannapieco C., Gadotti D. A., Jonsson P., White S. D. M., 2010, MNRAS, 407, L41
- Schaye et al. (2015) Schaye J., et al., 2015, MNRAS, 446, 521
- Sérsic (1963) Sérsic J. L., 1963, Boletin de la Asociacion Argentina de Astronomia La Plata Argentina, 6, 41
- Shen et al. (2003) Shen S., Mo H. J., White S. D. M., Blanton M. R., Kauffmann G., Voges W., Brinkmann J., Csabai I., 2003, MNRAS, 343, 978
- Simons et al. (2015) Simons R. C., Kassin S. A., Weiner B. J., Heckman T. M., Lee J. C., Lotz J. M., Peth M., Tchernyshyov K., 2015, MNRAS, 452, 986
- Simons et al. (2017) Simons R. C., et al., 2017, ApJ, 843, 46
- Sokołowska et al. (2017) Sokołowska A., Capelo P. R., Fall S. M., Mayer L., Shen S., Bonoli S., 2017, ApJ, 835, 289
- Somerville et al. (2008) Somerville R. S., Hopkins P. F., Cox T. J., Robertson B. E., Hernquist L., 2008, MNRAS, 391, 481
- Sparre et al. (2017) Sparre M., Hayward C. C., Feldmann R., Faucher-Giguère C.-A., Muratov A. L., Kereš D., Hopkins P. F., 2017, MNRAS, 466, 88
- Springel (2005) Springel V., 2005, MNRAS, 364, 1105
- Springel & Hernquist (2005) Springel V., Hernquist L., 2005, ApJ, 622, L9
- Springel et al. (2005) Springel V., et al., 2005, Nature, 435, 629
- Stewart et al. (2009) Stewart K. R., Bullock J. S., Wechsler R. H., Maller A. H., 2009, ApJ, 702, 307
- Stewart et al. (2011) Stewart K. R., Kaufmann T., Bullock J. S., Barton E. J., Maller A. H., Diemand J., Wadsley J., 2011, ApJ, 738, 39
- Stewart et al. (2013) Stewart K. R., Brooks A. M., Bullock J. S., Maller A. H., Diemand J., Wadsley J., Moustakas L. A., 2013, ApJ, 769, 74
- Stewart et al. (2017) Stewart K. R., et al., 2017, ApJ, 843, 47
- Stinson et al. (2012) Stinson G. S., et al., 2012, MNRAS, 425, 1270
- Su et al. (2016) Su K.-Y., Hopkins P. F., Hayward C. C., Faucher-Giguere C.-A., Keres D., Ma X., Robles V. H., 2016, preprint, (arXiv:1607.05274)
- Teklu et al. (2015) Teklu A. F., Remus R.-S., Dolag K., Beck A. M., Burkert A., Schmidt A. S., Schulze F., Steinborn L. K., 2015, ApJ, 812, 29
- Toomre (1964) Toomre A., 1964, ApJ, 139, 1217
- Toomre & Toomre (1972) Toomre A., Toomre J., 1972, ApJ, 178, 623
- Vogelsberger et al. (2014a) Vogelsberger M., et al., 2014a, MNRAS, 444, 1518
- Vogelsberger et al. (2014b) Vogelsberger M., et al., 2014b, Nature, 509, 177
- Wang et al. (2015) Wang L., Dutton A. A., Stinson G. S., Macciò A. V., Penzo C., Kang X., Keller B. W., Wadsley J., 2015, MNRAS, 454, 83
- Wang et al. (2016) Wang J., Koribalski B. S., Serra P., van der Hulst T., Roychowdhury S., Kamphuis P., N. Chengalur J., 2016, Monthly Notices of the Royal Astronomical Society, 460, 2143
- Weinberger et al. (2017) Weinberger R., et al., 2017, MNRAS, 465, 3291
- Wetzel et al. (2016) Wetzel A. R., Hopkins P. F., Kim J.-h., Faucher-Giguère C.-A., Kereš D., Quataert E., 2016, ApJ, 827, L23
- Wheeler et al. (2017) Wheeler C., et al., 2017, MNRAS, 465, 2420
- White (1984) White S. D. M., 1984, ApJ, 286, 38
- White & Rees (1978) White S. D. M., Rees M. J., 1978, MNRAS, 183, 341
- Woo et al. (2013) Woo J., et al., 2013, MNRAS, 428, 3306
- Woo et al. (2015) Woo J., Dekel A., Faber S. M., Koo D. C., 2015, MNRAS, 448, 237
- Woo et al. (2017) Woo J., Carollo C. M., Faber S. M., Dekel A., Tacchella S., 2017, MNRAS, 464, 1077
- Wuyts et al. (2010) Wuyts S., Cox T. J., Hayward C. C., Franx M., Hernquist L., Hopkins P. F., Jonsson P., van Dokkum P. G., 2010, ApJ, 722, 1666
- Zavala et al. (2016) Zavala J., et al., 2016, MNRAS, 460, 4466
- Zhu et al. (2018) Zhu L., et al., 2018, MNRAS, 473, 3000
- Zolotov et al. (2015) Zolotov A., et al., 2015, MNRAS, 450, 2327
- van Dokkum (2005) van Dokkum P. G., 2005, AJ, 130, 2647
- van Dokkum et al. (2010) van Dokkum P. G., et al., 2010, ApJ, 709, 1018
- van de Voort et al. (2015) van de Voort F., Davis T. A., Kereš D., Quataert E., Faucher-Giguère C.-A., Hopkins P. F., 2015, MNRAS, 451, 3269
- van der Walt et al. (2011) van der Walt S., Colbert S. C., Varoquaux G., 2011, Computing in Science Engineering, 13, 22
Appendix A Robustness to resolution
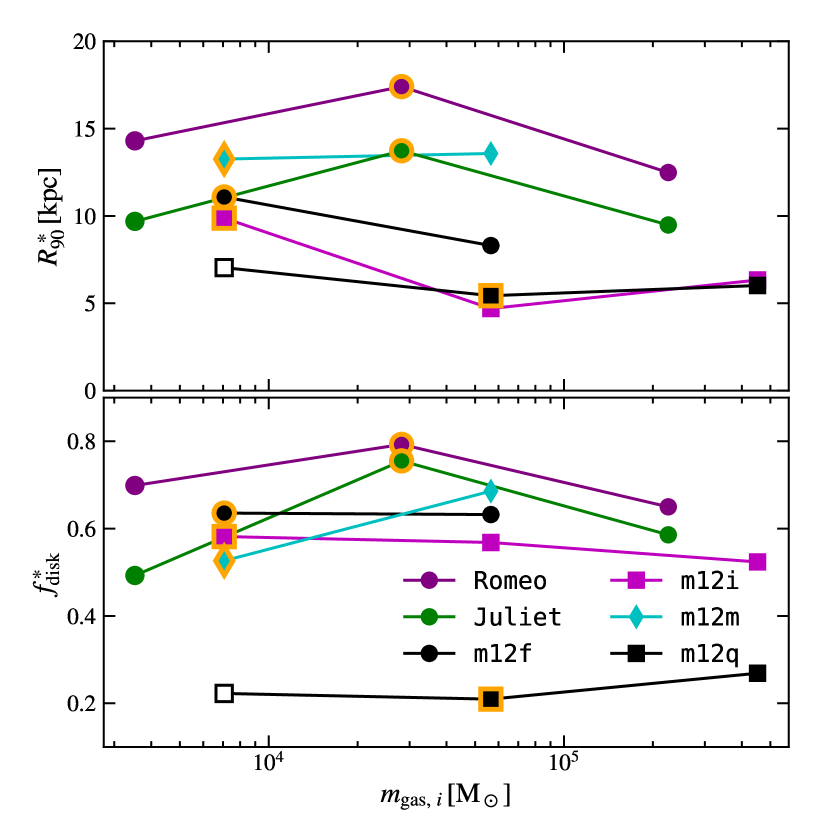
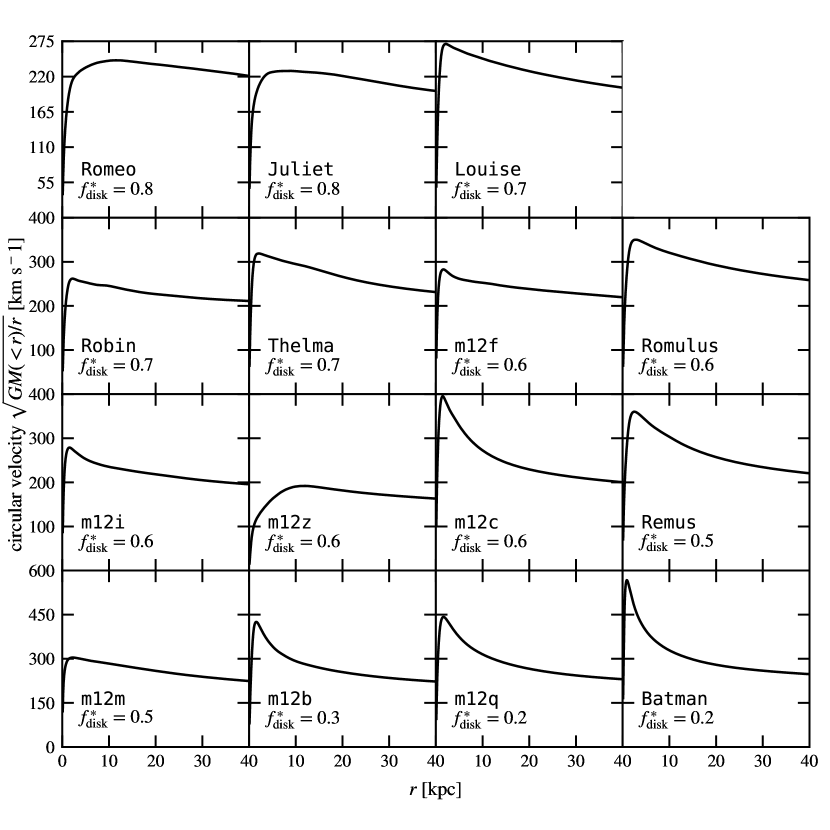
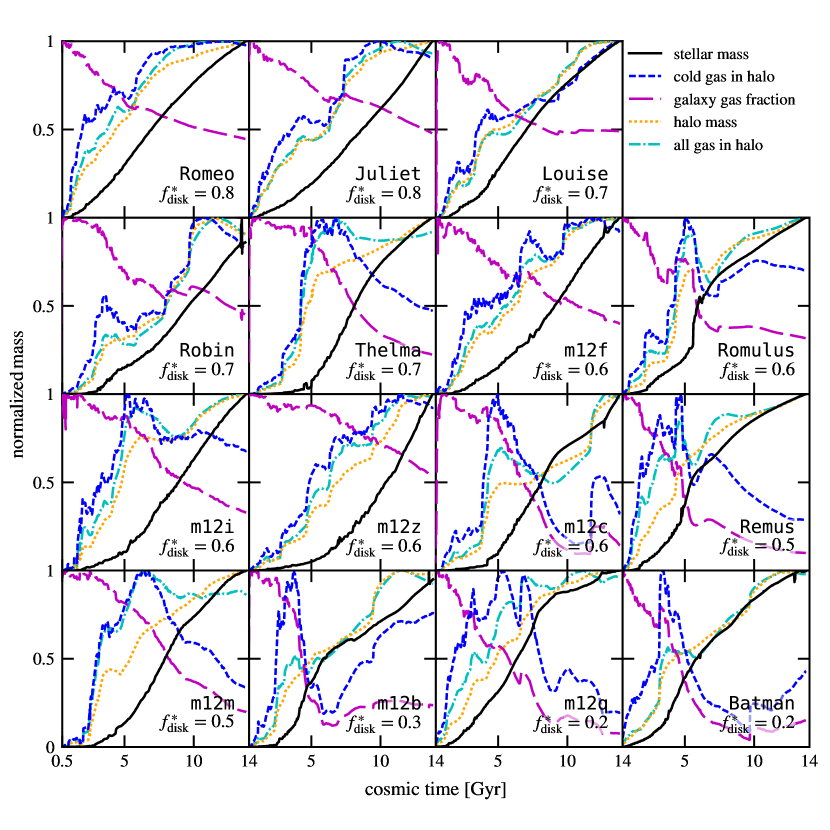
As with any numerical work, it is important to establish that our results are not driven by the resolution of the simulations, which we quantify here by the initial baryonic particle mass . As we demonstrate here, the morphological parameters of a single galaxy are relatively stable to changes in the resolution, indicating that the morphology is driven by fundamental properties of either the galaxy or halo, not the resolution at which that galaxy is simulated.
Figure 15 plots and explicitly as a function of the resolution of the simulation for several of our galaxies that have been simulated at a variety of resolutions. Lines connect runs of the same galaxy at different resolutions; the runs analyzed in the main text are highlighted in orange. Though there are changes with resolution (in particular, galaxies typically tend to be marginally more radially extended and diskier at higher resolution), the relative ordering of the simulations stays generally constant and the morphological parameters are generally resolved. Moreover, our results indicate that the FIRE-2 physics can yield roughly flat stellar rotation curves even with initial gas particle masses (Robin).
The largest outlier from this trend is Juliet. At the resolution we analyze here, Juliet experiences an extended prograde encounter with a gas-rich satellite that both torques up the existing disk and deposits substantial fuel for additional disky star formation. Though analysis is still ongoing, preliminary investigations of the high resolution version of this simulation suggest that the satellite punches directly through the main galaxy at , partially disrupting the galaxy and in line with the trends that we discuss above. We plot an incomplete run of m12q from as the open point; because the disk that m12q does build (Figure 12) does not appear until (after which is it quickly destroyed), the higher resolution version of this galaxy is remarkably similar to the fiducial version, even at this time.
Therefore, we assert that the relative morphologies of several systems may be fairly compared, even if the exact values vary slightly as a function of resolution. That is, there are fundamental, underlying properties of a given host that determine the morphology of that galaxy. We demonstrated above that these properties are most strongly related to the formation histories of galaxies and their spin at high redshift.
Appendix B Rotation curves
Figure B1 plots the circular velocity curves of our galaxies, defined as . Generally speaking, galaxies with higher kinematic disk fractions also have flatter, less centrally-peaked rotation curves. The exceptions are m12z, the least massive galaxy in our sample, and m12m, which recently underwent a bar-buckling event as noted in the main text.
Appendix C Growth histories
Figure 7 plots the growth of the halo mass, total gas mass, cold gas mass in the halo, stellar mass, and gas fractions for three representative galaxies, Juliet, m12i, and Batman. For completeness, we plot the entirety of our sample in Figure C1. The trends that we identify regarding the relative amount of star-forming gas using the three representative galaxies in Figure 7 are robust – at higher disk fractions, the galaxies almost uniformly reach their peak at later times and typically maintain that level of star forming gas for several gigayears.