Early soft X-ray to UV emission from double neutron star mergers: implications from the long-term radio and x-ray emissions of GW 170817
Abstract
Recent long-term radio follow-up observations of GW 170817 reveals a simple power-law rising light curve, with a slope of , up to 93 days after the merger. The latest X-ray detection at 109 days is also consistent with such a temporal slope. Such a shallow rise behavior requires a mildly relativistic outflow with a steep velocity gradient profile, so that slower material with larger energy catches up with the decelerating ejecta and re-energizes it. It has been suggested that this mildly relativistic outflow may represent a cocoon of material. We suggest that the velocity gradient profile may form during the stage that the cocoon is breaking out of the merger ejecta, resulted from shock propagation down a density gradient. The cooling of the hot relativistic cocoon material immediately after it breaks out should have produced soft X-ray to UV radiation at tens of seconds to hours after the merger. The soft X-ray emission has a luminosity of over a period of tens of seconds for a merger event like GW 170817. The UV emission shows a rise initially and peaks at about a few hours with a luminosity of . The soft X-ray transients could be detected by future wide-angle X-ray detectors, such as the Chinese mission Einstein Probe. This soft X-ray/UV emission would serve as one of the earliest electromagnetic counterparts of gravitation waves from double neutron star mergers and could provide the earliest localization of the sources.
Subject headings:
gravitational waves – gamma-ray bursts1. Introduction
The recent detection of gravitation waves (GW) from a double neutron star (DNS) merger, known as GW 170817 (Abbott et al., 2017a), and the following detection of an electromagnetic counterpart marks a new era for studying DNS mergers (Abbott et al., 2017b). The -ray satellite Fermi detected a sub-energetic short gamma-ray burst (GRB 170817A) about 2 seconds after the GW event (Goldstein et al., 2017). A macronova/kilonova was detected in the IR to UV bands since about 10 hours after the merger (e.g. (Coulter et al., 2017; Drout et al., 2017; Evans et al., 2017)). Swift began searching for a counterpart to GW 170817 with its X-ray Telescope (XRT) from about 0.04 days after the merger (Evans et al. 2017), but no new X-ray source was found. The Chandra X-ray satellite detected X-ray counterparts at about 9 and 15.1 days after the merger (Troja et al., 2017a; Margutti et al., 2017a). Later on, radio emission was detected by VLA at about 16, 19 and 39 days after the merger (Hallinan et al., 2017; Alexander et al., 2017). The X-ray and radio emissions are thought to arise from the synchrotron emission of an expanding blast wave, which is powered by some ejecta from the DNS merger (e.g., Kasliwal et al. (2017); Murguia-Berthier (2017)).
Very recently, long-term radio observations find that the radio flux continue to rise with a simple power-law in time, (Mooley et al., 2017). The spectrum is consistent with optically-thin synchrotron emission, with . The latest X-ray detection with Chandra of the source find that the X-ray emission is also brightening (Troja et al., 2017b; Margutti et al., 2017b; Haggard et al., 2017). The X-ray brightening suggests a temporal slope consistent with the radio light curve. Such a temporal slope can not be produced by a single-velocity ejecta, which would produce a rising light curve or a decreasing light curve for the observe frequency locating between the two break frequencies (i.e., , Sari et al. (1998)), as the ejecta is coasting or decelerating in a constant density ISM (e.g. Xiao et al. (2017)). Depending on the density of the circum-burst medium, two velocity profiles of the outflow have been suggested to fit the radio data (Mooley et al., 2017). For a density of , the distribution of the kinetic energy is , with a maximum velocity of . While for a lower density of , with a maximum Lorentz factor of . Such velocity profile suggests that the energy in the blast wave is increasing with time, which may be due to that slower material with larger energy catches up with the decelerating ejecta and re-energizes it (see also Pooley et al. (2017)). To explain the emission of GRB 170817A in the meantime, a relativistic outflow with may be necessary (Gottlieb et al., 2017), so the low-density case is favored. The outflow then may represent the cocoon material (Gottlieb et al., 2017), which forms as the jet is propagating through the DNS merger ejecta (Nagakura et al., 2014; Nakar & Piran, 2017; Lazzati et al., 2017a, b)
This velocity profile may form at the stage when the cocoon breaks out of the merger ejecta. This profile reflects the structure of the outflow immediately after it break out, since after that the outflow matter simply undergoes free expansion. Such a self-similar velocity gradient profile is common in core collapse supernovae. The supernova shock experiences acceleration in the steep density gradients of the progenitor envelope and the velocity gradient profile forms after the shock breaks out of the envelope (Matzner & McKee, 1999). We suggest that the velocity gradient profile in the case of GW 170817 forms when the cocoon breaks out of the DNS merger ejecta, resulted from shock propagation down a density gradient.
The cocoon is hot as it consists of mainly shock heated material from the merger ejecta. After the DNS merger ejecta has been shocked, its thermal and kinetic energies are approximately equal. The next phase of evolution is postshock acceleration, in which heat is converted into outward motion and the cocoon material approaches a state of free expansion. The internal energy will be released once the cocoon expands to a radius where it becomes transparent to radiation (Nakar & Piran, 2017). The physics is similar to that of a cooling envelope after the supernova shock breaks out. Recently, Piro & Kollmeier (2017) show that early day optical/infrared emission of GW 170817 can be explained by shock cooling emission of the non-relativistic merger ejecta. Kisaka et al. (2015) shows that the early macronova/kilonova emission of GRB 130603B could be due to shock cooling emission powered by a central engine. In this paper, we calculate the cooling emission from the mildly-relativistic shocked materials (i.e. the cocoon), taking into account the velocity gradient profile of the expanding materials. Due to that the cocoon material has a much higher velocity, compared with the bulk ejecta of the DNS merger, it becomes transparent much earlier and thus the cooling emission constitutes the earliest electromagnetic counterpart of the DNS merger (only after the prompt -ray burst emission). In §2, we discuss the constraints on the cocoon properties placed by recent long-term radio and X-ray observations. Then in §3, we calculate the light curves of the cocoon cooling emission and study the detectability by future wide-angle X-ray and UV missions. Finally we give discussions and conclusions.
2. Constraining the cocoon properties with long-term radio and X-ray observations
The radio follow-up observations of GW170817 reveals a steady rise in the light curve with a slope (Mooley et al., 2017). Following the ”refreshed” shock scenario of GRB afterglows (Rees & Mészáros, 1998; Sari & Mészáros, 2000), we study the velocity gradient of the outflow with this radio light curve. We assume that the source ejects shells of a range of Lorentz factors, with a mass profile of in the range of , where and are, respectively, the minimum and maximum Lorentz factors of the ejected shells. For an observational frequency locating between the injection break frequency and the cooling frequency, i.e., (Sari et al., 1998), the light curve of the forward shock emission should be (Sari & Mészáros, 2000)
| (1) |
where is the spectral index (). With an observed temporal slope of and a spectral slope of , we obtain . This value is in roughly agreement with obtained by Mooley et al. (2017), who use numerical codes to calculate the light curve. The radio flux can be used to place constraints on the energy of the ejecta. The flux at 3 GHz is at days after the merger (Hallinan et al., 2017). We then obtain the kinetic energy of the blast wave
| (2) |
where and are the electron energy and magnetic energy equipartition factors in the shock, and is the number density of the surrounding medium. Here we use the notations , and .
Chandra re-observed the source at about 109 days after the merger (Troja et al., 2017b; Margutti et al., 2017b; Haggard et al., 2017). The X-ray flux indicates a spectral slope from radio to X-ray, which is consistent with the radio spectral slope (Margutti et al., 2017a). The spectrum of the X-ray emission alone is found to be , in agreement with the global spectrum from radio to X-ray. This indicates that the cooling break frequency is above the X-ray band at . Using the condition and the energy in the blast wave given by Eq.(2), we get
| (3) |
A low density of for the surrounding medium has also been inferred from the limit on the mass of neutral hydrogen (Hallinan et al., 2017). Note that the inverse Compton (IC) cooling is not taken into account in our estimate of . IC cooling can become important if and depends on the ratio between and . Since the observations of GW170817 suggest that is below the radio band and is above the X-ray, the Compton parameter is for reasonable values of and (Wang et al., 2010; Beniamini et al., 2015). Thus, the IC cooling does not introduce a significant change to our equation 3. Then we find a lower limit on the blast wave kinetic energy at ,
| (4) |
The single power-law temporal behavior since days after the merger requires that the fastest shell has been decelerated before this time. From this, we obtain
| (5) |
In the above, we have assumed that the forward shock dominates the flux from the possible reverse shock in the refreshed shock scenario. This assumption is valid in our case since the injection break frequency of the reverse shock emission is much lower than that of the forward shock and the observe frequency is above of the forward shock emission (Sari & Mészáros, 2000). Kumar & Piran (2000) have shown that the Lorentz factor of the inner shell with respect to decelerating outer shell is about 1.25 when the collision takes place111The values of 1.25 corresponds to a the case that the outer, decelerating shell has a constant energy. For the case of re-energized, decelerating outer shell, the relative Lorentz factor is even lower (see Eq.3 in Rees & Mészáros (1998)).. So the Lorentz factor of the reverse shock is expected to be . Then we expect that the ratio of thermal Lorentz factors of electrons in the reverse shock and forward shock is , where is the Lorentz factor of the forward shock. Although the number of electrons in the reverse shock is larger than that of the forward shock by a factor of (Sari & Mészáros, 2000), the synchrotron flux of the forward shock at the frequency dominates over that of the reverse shock.
Mooley et al. (2017) obtain with a maximum Lorentz factor of by fitting the radio data. Our simple analytic result is well consistent with their result. In the following calculations, we assume that the fastest shell has a Lorentz factor of and an energy of , and assume that the shells has a velocity gradient profile of in the velocity range of .
3. Soft X-ray and UV emission from the cooling cocoon
This velocity profile reflects the structure of the cocoon material immediately after it breaks out of the merger ejecta, since after that the cocoon material simply undergoes free expansion. When the cocoon material becomes transparent, the cooling of the cocoon material will produce an electromagnetic signal.
Assuming a cocoon has a self-similar mass distribution . For and , the mass of the maximum velocity ejecta is . The highest velocity shell in the outmost region becomes transparent at the earliest time. The shell with mass becomes transparent when its optical depth satisfies the condition
| (6) |
With , we can obtain the mass and Lorentz factor of the shell that becomes transparent at a given time , i.e.,
| (7) |
and
| (8) |
where
| (9) |
is the characteristic timescale, corresponding the time when the fastest shell becomes transparent. Here we use the notations that , and .
The initial internal energy within each shell is roughly half of the final kinetic energy of the shell for mildly-relativistic shocks (Tan et al., 2001), so we assume . The internal energy decreases due to adiabatic expansion. Since and the comoving volume is , so , where is the comoving energy density. As the energy density scales as , where is the comoving baryon number density, we have . Thus at a given time , the internal energy is
| (10) |
where is the initial radius of the cocoon at which it breaks out of the merger ejecta. The value of is not well-known. A breakout radius of is estimated from the duration and lag of the prompt GRB (Gottlieb et al., 2017). Kasliwal et al. (2017) find a breakout radius of in their numerical simulations of the DNS merger. The bolometric luminosity is roughly
| (11) |
The photosphere radius is
| (12) |
Then, we obtain the effective photosphere temperature
| (13) |
where is the Stephan-Boltzmann constant. Assuming a blackbody spectrum for the cooling emission, the observed luminosity at a given frequency is
| (14) |
where is the Doppler factor (Gao et al., 2017). The cooling emission of relativistic matter lasts until the low velocity shell with becomes transparent, which is
| (15) |
where we have taken in the last step. Note that the lowest value of is not known, as the radio and X-ray flux are still rising up to the present. However, should be , otherwise the energy in cocoon would be too large. After the time , macronova/kilonova emission from sub-relativistic material of the bulk merger ejecta becomes dominated. The bulk merger ejecta may also have some velocity gradient profile, as has been suggested in Piro & Kollmeier (2017) andWaxman et al. (2017).
.
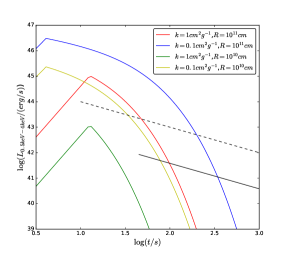
Using the above formulas, we calculate the light curves of the soft X-ray emission in the energy range of KeV and UV light curves in 200-240nm. The energy ranges are selected according to the future wide-angle X-ray and UV missions respectively, such as Einstein Probe (EP) and ULTRASAT (Yuan et al., 2015; Sagiv et al., 2014). The mostly poorly-known parameters in the calculation are the opacity and the break-out radius , thus we consider various combinations of these two parameters. The light curves of the soft X-ray emission are shown in Figure 1. To study the detectability of this emission, we also plot the sensitivity curve of EP telescope in the figure. For a wide range of the parameter space of and , the soft X-ray emission lasts at least tens of seconds above the sensitivity of EP telescope if a similar event to GW 170817 occurs in the future. As this emission lags only a few seconds behind the merger, this would represent the earliest electromagnetic counterpart of gravitation waves from DNS mergers (only after the prompt GRB signal). If Swift BAT is triggered by the prompt GRB (which is not the case for GRB 170817A), Swift X-ray Telescope (XRT) could slew to the target in 20-70 s. The sensitivity curve of XRT is also shown in Figure 1, which indicates that the soft X-ray transient from cooling cocoon could be detected by XRT.
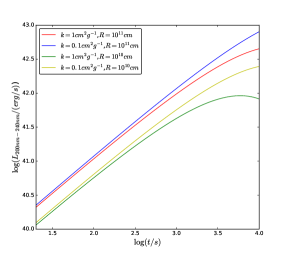
The UV light curves for the same parameter values are shown in Figure 2. The flux shows a monotonic rise in time because the peak frequency of the blackbody spectrum is above the UV frequency range at such early time. The luminosity in 200-240nm at the peak is above even for the conservative parameter values. The UV emission from the cocoon could be detected to distances above by ULTRASAT, considering that the limit magnitude of ULTRASAT is (Sagiv et al., 2014). Such early UV emission could also be detected by Swift UVOT, if UVOT slews quickly enough to the target. At later time, the UV emission will transit to the phase where the bulk ejecta of macronova/kilonova becomes dominated (Metzger et al., 2017; Piro & Kollmeier, 2017; Yu & Dai, 2017; Waxman et al., 2017).
4. Summary and Discussions
We have suggested that soft X-ray to UV emission may be produced by cocoons in DNS mergers at very early times after the merger, arising from the cooling of the hot cocoon, similar to the cooling envelope emission in core collapse supernovae. As cocoons have wide angles, these soft X-ray and UV transients also have wide angles and thus they have much better chance to be detected than the jet emission. Such soft X-ray and UV transients, if detected, would serve as very early electromagnetic counterparts to the GW sources. As X-ray and UV detectors have much better localization ability than the -ray detectors, they could provide accurate spatial position of GW events within minutes to hours. This will be important for further follow-up observations of the GW source.
We have assumed that the outflow powering the long-term radio and X-ray emission are relativistic with a maximum Lorentz factor of , consistent with the cocoon scenario. It has been pointed out that a semi-relativistic outflow with a maximum velocity (Mooley et al., 2017), arising from the dynamic ejecta of the DNS merger, can also explain the long-term radio and X-ray emission. In this case, we would not expect soft X-ray emission at early time, because the effective photosphere temperature decreases as the maximum velocity decreases. However, we would still expect bright UV radiation from the cooling of this semi-relativistic ejecta on a timescale hours after the merger.
The prompt emission of GRB 170817A has a main pulse, followed by a weak and soft component with a low signal to noise ratio (Goldstein et al., 2017; Zhang et al., 2017; Lu et al., 2017). The soft component has a luminosity of lasting for s. The spectrum of this soft component can be fit by a blackbody with a temperature of (Goldstein et al., 2017; Zhang et al., 2017), had. It was suggested that this thermal component could be due to the photosphere emission from a cocoon (Goldstein et al. 2017). However, a straightforward calculation of the photosphere radius gives , which is too small for a cocoon with a mildly-relativistic Lorentz factor of .
The spectrum of the soft X-ray emission in our case should be thermal in the absence of dissipation below the photosphere, which can be distinguished from non-thermal X-ray emission predicted in some models. For example, Zhang (2013) suggests that if the post-merger product of DNS is a highly magnetized, rapidly rotating neutron star, the dissipation of a proto-magnetar wind after the merger could produce non-thermal X-ray emission (see also Sun et al. (2017)).
References
- Abbott et al. (2017a) Abbott, B. P. et al., 2017, Phys. Rev. Lett., 119, 161101
- Abbott et al. (2017b) Abbott, B. P. et al., 2017, ApJ, 848, L13
- Alexander et al. (2017) Alexander, K. D.; Berger, E.; Fong, W. et al., 2017, The Astrophysical Journal Letters, 848, L21
- Beniamini et al. (2015) Beniamini, P.; Nava, L.; Duran, R.; Piran, T., 2015, MNRAS, 454,1073
- Coulter et al. (2017) Coulter D. A., Foley, R. J., Kilpatrick, C. D., et al. 2017, Science, doi:10.1126/science.aap9811, (arXiv:1710.05452)
- Drout et al. (2017) Drout, M. R., Piro, A. L., Shappee, B. J., et al. 2017, Science, doi:10.1126/science.aaq0049, (arXiv:1710.05443)
- Evans et al. (2017) Evans, P., Cenko, S., Kennea, J. A., et al. 2017, Science, doi:10.1126/science.aap9580 (arXiv:1710.05437)
- Gao et al. (2017) Gao, H., Cao, Z., Zhang, B., 2017, arXiv:1711.08577
- Goldstein et al. (2017) Goldstein, A., Veres P., Burns, E., et al. 2017, ApJL in press
- Gottlieb et al. (2017) Gottlieb, O., Nakar, E., Piran, T., Hotokezaka, 2017, arXiv:1710.05896
- Haggard et al. (2017) Haggard, D., et al., 2017, GCN CIRCULAR 2220
- Hallinan et al. (2017) Hallinan, G., Corsi, A., Mooley, K. P., et al. 2017, Science, doi:10.1126/science.aap9855 (arXiv:1710.05435)
- Kasliwal et al. (2017) Kasliwal, M. M., Nakar, E., Singer, L. P., et al. 2017, Science, doi:10.1126/science.aap9455 (arXiv:1710.05436)
- Kisaka et al. (2015) Kisaka, S.; Ioka, K.; Takami, H., 2015, The Astrophysical Journal, 802, 119
- Kumar & Piran (2000) Kumar, P., Piran, T., 2000, ApJ, 532, 286
- Lazzati et al. (2017a) Lazzati, D., Deich, A., et al., 2017a, MNRAS, 471, 1652
- Lazzati et al. (2017b) Lazzati, D., et al., 2017b, arXiv:1709.01468
- Lu et al. (2017) Lu, R. J. et al., 2017, arXiv:1710.06979
- Margutti et al. (2017a) Margutti, R.; Berger, E, et al., 2017a, The Astrophysical Journal Letters, 848, L20
- Margutti et al. (2017b) Margutti, R., et al. 2017b, GCN CIRCULAR 22203
- Matzner & McKee (1999) Matzner, C. D. & McKee, C. F., 1999, ApJ, 510, 379
- Metzger et al. (2017) Metzger, B. D., 2017, arXiv:1710.05931
- Mooley et al. (2017) Mooley, K. P., et al, 2017, arXiv:1711.11573
- Murguia-Berthier (2017) Murguia-Berthier, A.; Ramirez-Ruiz, E., et al., 2017, The Astrophysical Journal Letters, 848, L34
- Nagakura et al. (2014) Nagakura, H. et al., 2014, The Astrophysical Journal Letters, 784, L28
- Nakar & Piran (2017) Nakar, E., & Piran, T., 2017 The Astrophysical Journal, 834, 28
- Piro & Kollmeier (2017) Piro, A. L., Kollmeier, J. A., 2017, arXiv:1710.05822
- Pooley et al. (2017) Pooley, D.; Kumar, P.; Wheeler, J. C., 2017, arXiv:1712.03240
- Rees & Mészáros (1998) Rees, M. J., & Mészáros , P., 1998, ApJ, 496, L1
- Sagiv et al. (2014) Sagiv, I., et al., AJ, 147, 79
- Sari & Mészáros (2000) Sari, R., & Mészáros , P., 2000, The Astrophysical Journal, 535, L33
- Sari et al. (1998) Sari, R., Piran, T., Narayan, R. 1998, ApJL, 497, L17
- Sun et al. (2017) Sun, H., et al., 2017, The Astrophysical Journal, 835, 7
- Tan et al. (2001) Tan, J. C.; Matzner, . D.; McKee, C. F., 2001, The Astrophysical Journal, 551, 946
- Troja et al. (2017a) Troja, E., Piro, L., van Eerten, H. et al., 2017, Nature, 551, 71
- Troja et al. (2017b) Troja, E. et al. 2017b, GCN CIRCULAR 22201
- Wang et al. (2010) Wang, X. Y., et al., 2010, ApJ, 712, 1232
- Waxman et al. (2017) Waxman, E., et al., 2017, arXiv:1711.09638
- Xiao et al. (2017) Xiao, D., Liu, L. D., Dai, Z. G., Wu, X. F., 2017, The Astrophysical Journal Letters, 850, L41
- Yu & Dai (2017) Yu, Y. W., Dai, Z. G., 2017, arXiv:1711.01898
- Yuan et al. (2015) Yuan, W, et al., 2015, arXiv:1506.07735
- Zhang (2013) Zhang, B., 2013, The Astrophysical Journal Letters, 763, L22
- Zhang et al. (2017) Zhang, B.-B., et al., 2017, arXiv:1710.05851