Disorder quenching of the Charge Density Wave in ZrTe3
Abstract
The charge density wave (CDW) in ZrTe3 is quenched in samples with small amount of Te isoelectronically substituted by Se. Using angle-resolved photoemission spectroscopy we observe subtle changes in the electronic band dispersions and Fermi surfaces on Se substitution. The scattering rates are substantially increased, in particular for the large three-dimensional Fermi surface sheet. The quasi-one-dimensional band is unaffected by the substitution and still shows a gap at low temperature, which starts to open from room temperature. The detailed temperature dependence reveals that the long-range order is absent in the electronic states as in the periodic lattice distortion. The competition between superconductivity and CDW is thus linked to the suppression of long-range order of the CDW.
The charge density wave (CDW) is a much studied self-organisation of metallic electrons in a crystalline solid Grüner (1994); Monceau (2012). Besides electronic signatures it manifests itself as periodic lattice distortion (PLD) with a periodicity given by the CDW modulation. In the last decade the competition between CDWs and superconductivity (SC) has gained renewed attention, due to experiments that include observations of incommensurate PLDs in the copper oxide family of superconductors Ghiringhelli et al. (2012); Chang et al. (2012); Le Tacon et al. (2014). In a very simple picture a competition between CDW and SC may arise due to the removal of spectral weight from the Density of States at the Fermi level (DOS at ) if an energy gap is formed by the CDW transition. Quenching the CDW restores DOS at , which is required for SC. If the quenching arises due to static disorder this will affect the superconducting properties as well, but these have been shown theoretically to be more robust, especially in the presence of electron corralations Anderson (1959); Tang et al. (2016). In the extreme case of Josephson-linked networks of 1-dimensional chain segments, superconductivity is even found to be enhanced by disorder Petrovic et al. (2016).
Besides the complex oxides cited above, competition between CDW and SC exists in rather simple binary materials. For example quenching of a CDW state under pressure and concomitant emergence of superconductivity has been found widely in stoichiometric transition-metal trichalcogenides Nunez-Regueiro et al. (1993); Yomo et al. (2005) and rare-earth trichalcogenides Sacchetti et al. (2009); Hamlin et al. (2009); Zocco et al. (2015) as well as layered transition-metal dichalcogenides Li et al. (2016). The specific arrangement of electronic bands that form the CDW as well as the PLD vary widely between these materials thus establishing the competition as a fundamental principle of solid state physics. The closest proximity of two transition temperatures at ambient pressure is found in 2H-NbSe2 ( K Revolinsky et al. (1965), K Wilson et al. (1975)).
The uniaxial material ZrTe3 shows (filamentary) SC below about K at ambient pressure Takahashi et al. (1983); Tsuchiya et al. (2017). The CDW is seen as a resistivity anomaly around K Takahashi et al. (1983) with an incommensurate PLD modulation Eaglesham et al. (1984). The resistivity continues to drop in a metallic fashion below . The two main FS sheets are a hole-like sheet in the -plane (3D) and a pair of electron-like and very flat sheets from quasi-one dimensional (q1D) bands Felser et al. (1998); Stöwe and Wagner (1998); Yokoya et al. (2005). The latter are formed by Te 5-electrons of the Te(2) and Te(3) sites being adjacent to the van-der-Waals gap of the crystal structure (inset in Fig. 1), while the 3D sheet has a dominant Zr 4 character. Bulk superconductivity emerges in ZrTe3 when the CDW is quenched, e.g. at hydrostatic pressures above GPa Yomo et al. (2005) or in disordered samples grown at high temperatures Zhu et al. (2013). For the quenching of the CDW under pressure two potential mechanisms have been discussed: disorder Gleason et al. (2015); Kwang-Hua (2012), or a re-arrangement of band fillings in the multi-sheet Fermi surface (FS) leading to the loss of the CDW stability Hoesch et al. (2016). In either scenario it is reasonable to assume that the SC involves electrons in the quasi-one-dimensional (q1D) sheets of the FS that have been identified as driving the CDW Felser et al. (1998); Stöwe and Wagner (1998); Yokoya et al. (2005) and which show strong electron-phonon coupling to low-energy vibrational modes Hoesch et al. (2009a); Hu et al. (2015). This electron-lattice interaction probably contributes to stabilising the long wavelength (small ) CDW.
In this letter we access the regime of low disorder by light chemical substitution of Te with Se, ZrTe3-xSex. A suppression of the CDW both in transition temperature and magnitude of the resistivity anomaly was reported Zhu et al. (2016). Above the CDW anomaly is removed and bulk superconductivity with up to 4.5 K emerges. With the isoelectronic substitution only a slight rearrangement of carriers between FS sheets is expected. From the data presented below we clarify these subtle changes and find that even the slight disorder in a sample of , exchanging less than 1.5% of Te, leads to strong and sheet-dependent decreases in electron scattering length and a shift of the van-Hove-singularity (vHS) in the q1D band to occupied states. The signatures of charge density wave gaps in ZrTe3 and effects of fluctuating CDW in the substituted samples are observed.
Single-crystals of ZrTe3 and ZrTe2.96Se0.04 have been grown by chemical vapour transport and characterised as described before Zhu et al. (2016). For ARPES measurements, the samples were cleaved in ultrahigh vacuum at temperature K and a vacuum of 10-10 mbar, exposing (001) surfaces as the samples cleave in the van-der-Waals gap between layers formed by Te(2)-Te(3) atoms (inset in Fig. 1). ARPES data were acquired at beamline I05-ARPES at Diamond Light Source Hoesch et al. (2017) at between 7 K and 290 K. The photon energy was set to eV and the energy resolution was chosen as meV with an angular resolution of less than . The polarisation vector was kept in the -plane of the crystal lattice (-polarised).
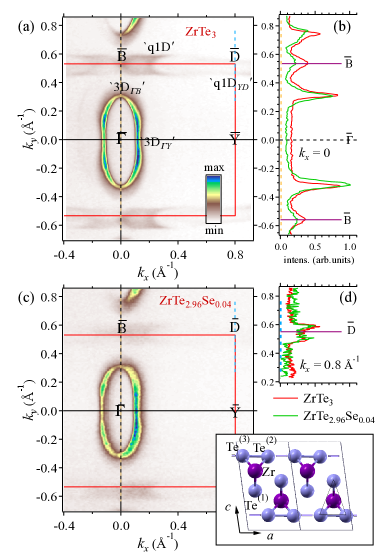
Fig. 1 shows two FS maps for samples of pure ZrTe3 and ZrTe2.96Se0.04. The labelling of high symmetry points acknowledges the effectively 2-dimensional electronic state observed in ARPES, which is assigned to a surface relaxation Hoesch et al. (2009b). This relaxation also leads to a splitting of observed bands, thus complicating the analysis. We selected eV, at which one component of the split bands dominates the spectra. At different the same features are seen Hoesch et al. (2009b), but strong contributions from both components would complicate the peak fitting analysis. Band dispersions are observed by step-wise rotating the sample around for and by the angle-parallel detection of the hemispherical electron analyser for .
The key features of the FS are found to be nearly identical between the two samples, namely the almond shaped central feature, labelled 3D. The manifold of q1D sheets is barely visible, close to due to suppression of spectral weight at the chemical potential () at low in both samples. Close to at Å two closing contours of this sheet are nevertheless clearly discernible. In ZrTe2.96Se0.04 the visibility of this manifold is reduced but key dispersion features are seen near identical.
The data are analysed by slicing into momentum distribution curves (MDCs) at constant along a straight line in momentum space such as shown in Fig. 1(b, d) for . Peaks in these curves correspond to band dispersion positions, their width corresponds to the inverse scattering lengths Baumberger et al. (2004). Numerical analyses are performed by recording the position, width and intensity from successive MDCs with increasing up to . When two equivalent bands are included in the fit the width is forced to be identical for both, while positions and intensities are allowed to converge freely.
We first keep our focus on the FS shapes and anisotropies. Most remarkably, the Fermi wave vectors of the q1D band close to are found to be identical within the error bars between both samples [Fig. 1(d)]. Similarly, the Fermi wave vectors along - are nearly unchanged, though close analysis reveals an increase by 2%. The Fermi wave vectors of the same sheet along - on the other hand are reduced by about 4%, which is easily visible in Fig. 1(b).The Fermi wave vectors are summarise in Tab. 1. The anisotropy of the 3D sheet is thus slightly reduced and the FS volume is decreased in ZrTe2.96Se0.04 when compared to ZrTe3. From this reduction of FS volume we can estimate a reduction of hole-type carrier numbers in the 3D band of about 2%.
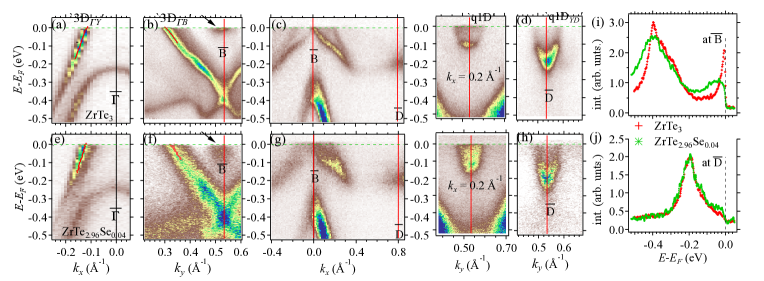
Fig. 2 shows the ARPES dispersion cuts (energy-momentum maps) for both samples. The 3D bands [panels (a, b, e, f)] show near identical dispersions, apart from a momentum shift corresponding to the change of noted above. The biggest change is seen at precisely the point at eV [Fig. 2(b and f), marked by an arrow]. This peak derives from a vHS within eV in ZrTe3 Yokoya et al. (2005), which is shifted to occupied states in ZrTe2.96Se0.04. By tracing the small dispersion of the q1D band along [Fig. 2(g)] we find eV at in ZrTe2.96Se0.04. The spectra at are also reproduced in Fig. 2(i) showing the sharp peak of the vHS much broader in ZrTe2.96Se0.04.
At the intensity distributions from either sample are remarkably similar with near identical spectra shown in Fig. 2(j), which are integrated over a small range Å-1. Data from both samples show a peak at eV with a characteristic reduction of intensity towards . Close inspection shows a higher intensity at for ZrTe2.96Se0.04 when compared to ZrTe3. The dependence of this intensity will be analysed below to gain further insight on its relation to CDW formation.
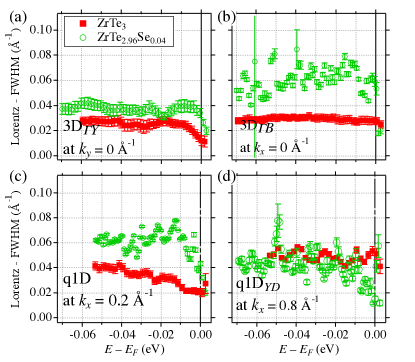
The results of MDC peak widths as a function of are shown in Fig. 3. These widths can be considered as being composed of two main contributions: a constant width due to impurity scattering and an energy-dependent width due to electron-phonon coupling (EPC), which is zero at Jiang et al. (2011). The width due to EPC increases and saturates with decreasing , in our data around eV, which matches the range of phonons with strong EPC in ZrTe3 Hoesch et al. (2009a); Hu et al. (2015). For example a pronounced width increase by 0.012 Å-1 from 0.013 Å-1 (0.025 Å-1) is observed at position ‘3DΓY’ for ZrTe3(ZrTe2.96Se0.04) [Fig. 3(a)]. Thus the effect of phonon scattering is similar, while the defect scattering length is decreased by a factor two in ZrTe2.96Se0.04 when compared to ZrTe3. Along , at ‘3DΓB’ as well as ‘q1D’ (at Å) the data for ZrTe2.96Se0.04 show significantly higher widths throughout when compared to ZrTe3 [Fig. 3(b,c)]. Near the point ‘q1DYD’ we find basically identical data for both samples, as seen already from the match of MDCs [Fig. 1(d)]. The thus extrapolated widths at due to defect scattering are summarised in Tab. 1. When multiplied with the Fermi velocity they can give an estimate of the scattering rate due to disorder. The scattering rate is enhanced upon Se substitution except for position ‘q1DYD’ of the strongly nested CDW band 111We note that also in ZrTe3 no linewidth broadening due to CDW formation is obseved near , as seen by the smooth evolution across in supplemental Figures S2 and S3 sup (2017).
| band | () | () | (eV) | (eV) |
|---|---|---|---|---|
| ZrTe3 | ||||
| ‘3DΓY’ | 0.633(3) | 0.013(3) | 4.0(2) | 0.05(1) |
| ‘3DΓB’ | 0.232(2) | 0.026(4) | 1.8(2) | 0.05(1) |
| ‘q1D’ | 0.12(2) | 0.02(1) | 4.8(9) | 0.10(5) |
| ‘q1DYD’ | 0.086(1) | 0.05(2) | 8.9(5) | 0.44(20) |
| ZrTe2.96Se0.04 | ||||
| ‘3DΓY’ | 0.622(5) | 0.025(5) | 4.5(2) | 0.11(2) |
| ‘3DΓB’ | 0.244(3) | 0.050(9) | 2.1(2) | 0.10(2) |
| ‘q1D’ | 0.13(2) | 0.04(1) | 6.4(9) | 0.26(7) |
| ‘q1DYD’ | 0.085(1) | 0.03(2) | 9.2(5) | 0.28(18) |
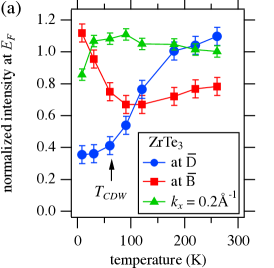
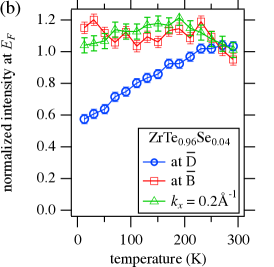
Analysing the intensity at as a function of (Fig. 4) we find near constant values for the 3D band (not shown) as well as for q1D near Å-1 (apart from a spurious lower intensity data point in ZrTe2.96Se0.04 at the lowest ). This is regular behaviour of the Fermi-Dirac distribution function without any modification of the bands or spectral weight. The previously reported changes of intensity near and at are again found in our data form ZrTe3 Yokoya et al. (2005). However, ZrTe2.96Se0.04 does not show the increase at low at thus confirming the relation of this effect to the vHS. Near the drop of intensity sets in at room temperature (RT) far above the structural transition in both samples.
From the data presented above a quenching of the CDW due to a rearrangement of bands in ZrTe2.96Se0.04 is highly unlikely as the q1D band shows only minor changes. A slight increase of carrier numbers in this band is manifest from the lowering of binding energies near which was also observed theoretically at elevated pressures Starowicz et al. (2007); Hoesch et al. (2016). Considering the strong increase in scattering rates throughout we can conclude that the CDW in ZrTe2.96Se0.04 is quenched by effects of static disorder.
A fluctuating CDW is still inferred from the depletion of spectral weight near . In ZrTe2.96Se0.04 this follows a near linear trend with [Fig. 4(b)]. In ZrTe3 the depletion is stronger, removing 2/3 of spectral weight at from the RT value, and the long-range ordering is manifest as a kink in the curve at [Fig. 4(a)]. This region of the Brillouin zone was shown to couple strongly to phonons with large and -dependent width in Raman spectra Hu et al. (2015). As the Fermi surface topography is basically unchanged here, we may speculate that a contribution to the CDW quenching comes from the chemical disorder disturbing the phonons that help to stabilise the PLD. No long-range order is observed down to K in x-ray diffraction sup (2017).
In conclusion, we find that the quenching of long-range CDW order with light isoelectronic substitution in ZrTe2.96Se0.04 is driven by a decrease in the static scattering length. Our measurements thus confirm the structural disorder as the primary tuning parameter which dictates the phase diagram of ZrTe3-xSex. The effects of disorder in the electronic spectral function are found to be sheet-dependent, detected as a significant increase in the linewidths of the 3D band and the q1D bands near , while no measurable additional broadening was found near . In addition, more subtle band shifts are observed, including a shift of the vHS at away from the Fermi level to occupied states. A continuous partial loss of DOS around as a function of is interpreted as a signature of a fluctuating CDW as in previous work Yokoya et al. (2005). This is expected to weaken the SC and the shift of the vHS will also reduce the DOS at when compared to ZrTe3. The reduction of DOS from the region around is less strong in ZrTe2.96Se0.04 than in ZrTe3 and lacks the kink signature of long-range order that is observed in ZrTe3. Thus SC can emerge despite CDW fluctuations.
I Acknowledgments
We are grateful to F. Baumberger for use of his ARPES data analysis software and to Diamond Light Source, where access to beamline I05 (NT11039, SI13797, and NT17065) and beamline I19 (MT8776) contributed to the results presented here. We acknowledge technical assistance for the ARPES experiments by Z. K. Liu and L. C. Rhodes and help with x-ray diffraction experiments was provided by S. Barnes, H. Novell, F. Fabrizi and D. Allen. Work at Brookhaven National Laboratory was supported by the U.S. Department of Energy, Office of Science, Office of Basic Energy Sciences, under Contract No. DE-SC0012704.
II Supplemental Material
II.1 Diffuse x-ray scattering
The absence of a Charge Density Wave (CDW) signature was previously observed in electrical resistivity measurements Zhu et al. (2016). Here, we report data of X-ray diffraction experiments at a temperature of K that are sensitive to the periodic lattice distortion (PLD), which shows up as incommensurate superlattice reflextions at positions with in reciprocal lattice units (r.l.u.), where is a main lattice Bragg spot position. The superlattice scattering intensity is weak compared to the main lattice scattering and the CCD detector was deliberately over-exposed for these measurements, leading to large, slightly blurred intensity around the main lattice Bragg spots due to sample mosaic imperfections and residual thermal diffuse scattering (TDS). The experiments were performed at beamline I19 of Diamond Light Source.
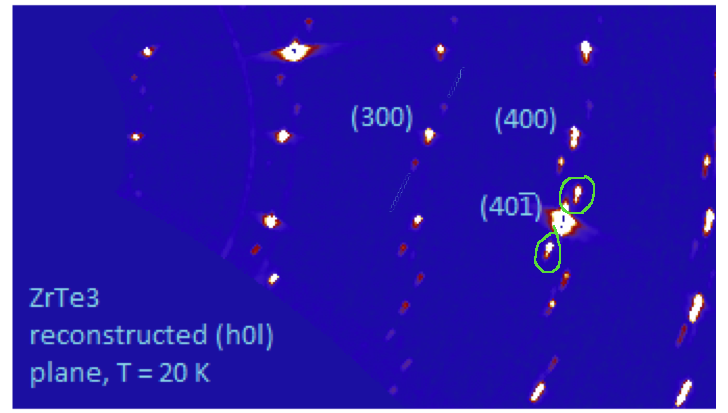
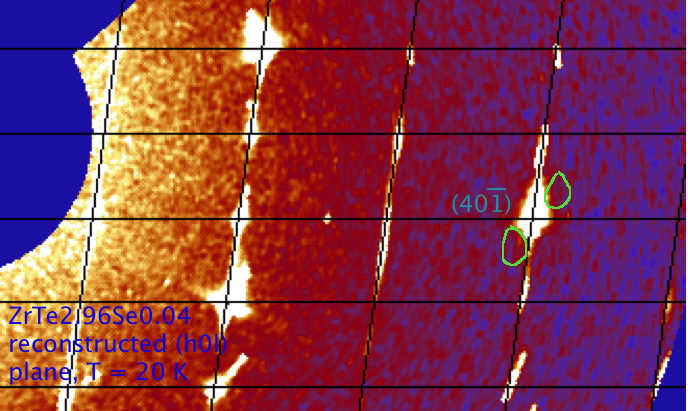
Figure S5 shows the x-ray scattering intensity in the plane and spanned by (increasing to the right) and (increasing upward). The image has been reconstructed from a few dozen of detector exposures at varying sample angle. Data in panel (a) are for pure ZrTe3 and show clear superstructure spots close to several main lattice positions, in particular close to , where they are marked by green circles. Similar data have been reported in Ref. [Hoesch et al., 2016], where the PLD was reliably observed up to the quenching pressure of 5 GPa and absent above this pressure. Data from ZrTe2.96Se0.04 shown in panel (b) show a smooth nearly constant level of background intensity around these superstructure positions. Therefore no long-range ordered PLD was observed in ZrTe2.96Se0.04 in agreement with the transport results Zhu et al. (2016).
II.2 Temperature-dependent ARPES
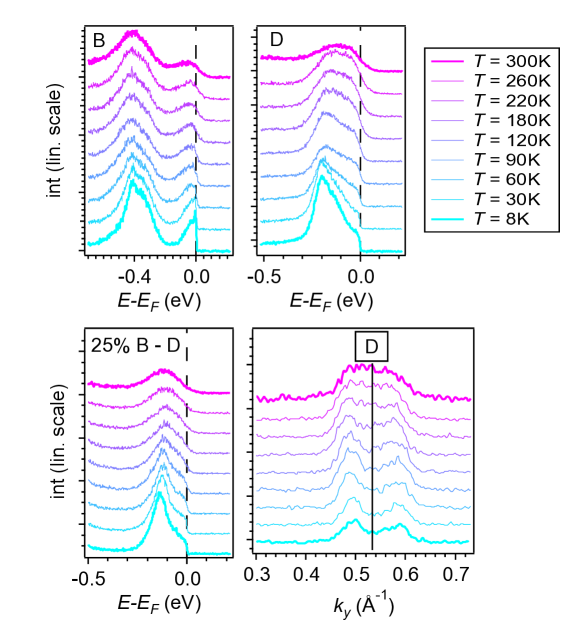
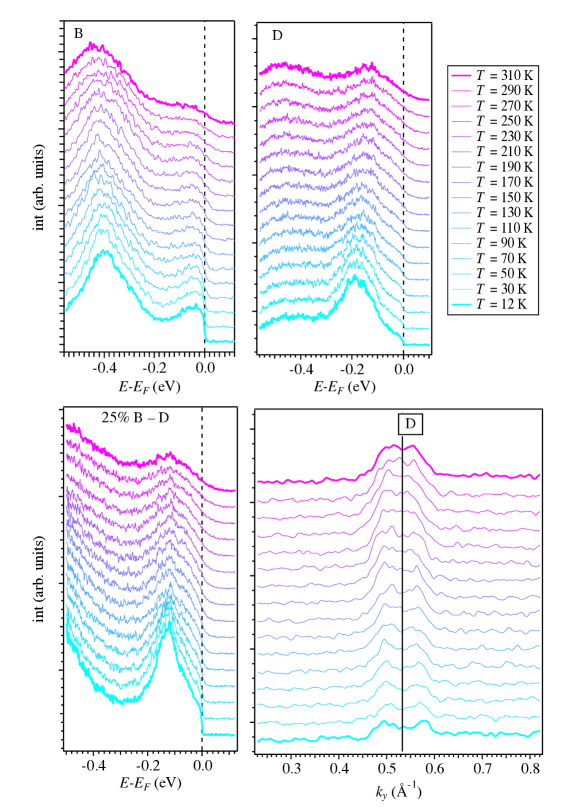
The CDW was previously associated with a temperature-dependent suppression of intensity of part of the ’q1D’ Fermi surface sheet in angle-resolved photoemission spectroscopy (ARPES) experiments Yokoya et al. (2005). Here, we report data from ZrTe3 aimed to reproduce the results of Ref. [Yokoya et al., 2005] as well as data from ZrTe2.96Se0.04. The data from ZrTe3 shown in Fig. S6 reproduce the main features of Ref. [Yokoya et al., 2005], namely at B the emergence of a strong sharp peak at on lowering the temperature as well as the development of an intensity depletion at D in a range of approx eV. Even at the lowest temperature K a finite Fermi step at is still observed. Close to B at Å-1, which is 1/4 distance towards D a sharpening of features but no intensity variation at on lowering the temperature is observed.
The data from ZrTe2.96Se0.04 in Fig. S7 show qualitatively similar behaviour to ZrTe3. The largest difference is observed at B, where the low energy peak is located at eV and no sharpening at low temperature is observed, thus leading to nearly constant intensity at . A slight sharpening of the peak is still observed. At D an intensity depletion in the low energy region is observed, and a finite Fermi step height at the lowest temperature remains, similar to ZrTe3. The implications of this observation of spectral weight depletion are discussed in the main text. Near B, both for the band of the 3D Fermi surface sheet as well as for the q1D band regular behaviour without changes to the spectral weight at is found.
II.3 Discussion of Room Temperature Resistivity Anisotropy
A remarkable feature of ZrTe3 is the (accidental) in-plane near isotropy of resistivity at room temperature (RT) Takahashi et al. (1983). This isotropy is lifted with an increase of and decrease of Zhu et al. (2016). Our Fermi surface data, taken at low temperature, fail to rationalise this effect. In a simple Drude model, the resistivity can be estimated as
| (1) |
where is the carrier number, and are the electron mass and charge and is the scattering rate. Considering only the defect scattering, the observed increase of scattering rate as well as the decrease of FS volume in Se substituted samples would reduce the relative contribution of the 3D band to conductivity. The q1D band with its pronounced directionality contributes to conductivity along and less to conductivity along , as manifest from the observation of a resistivity anomaly near in with no anomaly in Takahashi et al. (1983). At RT, however, the phonon scattering as well as electron-electron scattering dominate over the defect scattering Jiang et al. (2011) and our low temperature results thus do not contribute any insight beyond the careful magneto-resistance analysis of Ref. Zhu et al. (2016).
References
- Grüner (1994) G. Grüner, Density Waves in Solids, vol. 89 of Frontiers in Physics (Perseus publishing, Cambridge MA, 1994).
- Monceau (2012) P. Monceau, Advances in Physics 61, 325 (2012).
- Ghiringhelli et al. (2012) G. Ghiringhelli, M. Le Tacon, M. Minola, S. Blanco-Canosa, C. Mazzoli, N. B. Brookes, G. M. De Luca, A. Frano, D. G. Hawthorn, F. He, et al., Science 337, 821 (2012).
- Chang et al. (2012) J. Chang, E. Blackburn, A. T. Holmes, N. B. Christensen, J. Larsen, J. Mesot, R. Liang, D. A. Bonn, W. N. Hardy, A. Watenphul, et al., Nat Phys 8, 871 (2012), URL http://dx.doi.org/10.1038/nphys2456.
- Le Tacon et al. (2014) M. Le Tacon, A. Bosak, S. M. Souliou, G. Dellea, T. Loew, R. Heid, K.-P. Bohnen, G. Ghiringhelli, M. Krisch, and B. Keimer, Nat Phys 10, 52 (2014), URL http://dx.doi.org/10.1038/nphys2805.
- Anderson (1959) P. Anderson, Journal of Physics and Chemistry of Solids 11, 26 (1959), ISSN 0022-3697, URL http://www.sciencedirect.com/science/article/pii/0022369759900368.
- Tang et al. (2016) S. Tang, V. Dobrosavljević, , and E. Miranda, Phys. Rev. B 93, 195109 (2016).
- Petrovic et al. (2016) A. Petrovic, D. Ansermet, D. Chernyshov, M. Hoesch, D. Salloum, P. Gougeon, M. Potel, L. Boeri, and C. Panagopoulos, Nature Communications 7 (2016).
- Nunez-Regueiro et al. (1993) M. Nunez-Regueiro, J.-M. Mignot, M. Jaime, D. Castello, and P. Monceau, Synthetic Metals 56, 2653 (1993), ISSN 0379-6779, proceedings of the International Conference on Science and Technology of Synthetic Metals, URL http://www.sciencedirect.com/science/article/pii/037967799390013M.
- Yomo et al. (2005) R. Yomo, K. Yamaya, M. Abliz, M. Hedo, and Y. Uwatoko, Phys. Rev. B 71, 132508 (2005).
- Sacchetti et al. (2009) A. Sacchetti, C. L. Condron, S. N. Gvasaliya, F. Pfuner, M. Lavagnini, M. Baldini, M. F. Toney, M. Merlini, M. Hanfland, J. Mesot, et al., Phys. Rev. B 79, 201101 (2009), URL https://link.aps.org/doi/10.1103/PhysRevB.79.201101.
- Hamlin et al. (2009) J. J. Hamlin, D. A. Zocco, T. A. Sayles, M. B. Maple, J. H. Chu, and I. R. Fisher, Phys. Rev. Lett. 102, 177002 (2009), URL https://link.aps.org/doi/10.1103/PhysRevLett.102.177002.
- Zocco et al. (2015) D. A. Zocco, J. J. Hamlin, K. Grube, J.-H. Chu, H.-H. Kuo, I. R. Fisher, and M. B. Maple, Phys. Rev. B 91, 205114 (2015), URL https://link.aps.org/doi/10.1103/PhysRevB.91.205114.
- Li et al. (2016) L. J. Li, T. O. O’Farrell, K. P. Loh, G. Eda, B. Özyilmaz, and A. H. C. Neto, nature 529, 185 (2016).
- Revolinsky et al. (1965) E. Revolinsky, G. A. Spiering, and D. J. Beerntsen, Journal of Physics and Chemistry of Solids 26 (6), 1029 (1965).
- Wilson et al. (1975) J. A. Wilson, F. J. D. Salvo, and S. Mahajan, Advances in Physics 24 (2), 117 (1975).
- Takahashi et al. (1983) S. Takahashi, S. Sambongi, and S. Okada, J. Phys. (Paris) Colloq. 44, C3 (1983).
- Tsuchiya et al. (2017) S. Tsuchiya, K. Matsubayashi, K. Yamaya, S. Takayanagi, S. Tanda, and Y. Uwatoko, New Journal of Physics 19, 063004 (2017), URL http://stacks.iop.org/1367-2630/19/i=6/a=063004.
- Eaglesham et al. (1984) D. J. Eaglesham, J. W. Steeds, and J. A. Wilson, J. Phys. C 17, L697 (1984).
- Felser et al. (1998) C. Felser, E. Finckh, H. Kleinke, and W. Tremel, J. Mater. Chem. 8, 1787 (1998).
- Stöwe and Wagner (1998) K. Stöwe and F. Wagner, J. Solid State Chem. 138, 160 (1998).
- Yokoya et al. (2005) T. Yokoya, T. Kiss, A. Chainani, S. Shin, , and K. Yamaya, Phys. Rev. B 71, 140504(R) (2005).
- Zhu et al. (2013) X. Zhu, B. Lv, F. Wei, Y. Xue, B. Lorenz, L. Deng, Y. Sun, and C.-W. Chu, Phys. Rev. B 87, 024508 (2013), URL http://link.aps.org/doi/10.1103/PhysRevB.87.024508.
- Gleason et al. (2015) S. L. Gleason, Y. Gim, T. Byrum, A. Kogar, P. Abbamonte, E. Fradkin, G. J. MacDougall, D. J. Van Harlingen, X. Zhu, C. Petrovic, et al., Phys. Rev. B 91, 155124 (2015), URL http://link.aps.org/doi/10.1103/PhysRevB.91.155124.
- Kwang-Hua (2012) C. W. Kwang-Hua, Chemical Physics 409, 37 (2012), ISSN 0301-0104, URL http://www.sciencedirect.com/science/article/pii/S0301010412003680.
- Hoesch et al. (2016) M. Hoesch, G. Garbarino, C. Battaglia, P. Aebi, and H. Berger, Phys. Rev. B 93, 125102 (2016), URL https://link.aps.org/doi/10.1103/PhysRevB.93.125102.
- Hoesch et al. (2009a) M. Hoesch, A. Bosak, D. Chernyshov, H. Berger, and M. Krisch, Phys. Rev. Lett. 102, 086402 (2009a), URL http://link.aps.org/doi/10.1103/PhysRevLett.102.086402.
- Hu et al. (2015) Y. Hu, F. Zheng, X. Ren, J. Feng, and Y. Li, Phys. Rev. B 91, 144502 (2015), URL https://link.aps.org/doi/10.1103/PhysRevB.91.144502.
- Zhu et al. (2016) X. Zhu, W. Ning, L. Li, L. Ling, R. Zhang, J. Zhang, K. Wang, Y. Liu, L. Pi, Y. Ma, et al., Scientific Reports 6, 26974 (2016).
- Hoesch et al. (2017) M. Hoesch, T. K. Kim, P. Dudin, H. Wang, S. Scott, P. Harris, S. Patel, M. Matthews, D. Hawkins, S. G. Alcock, et al., Review of Scientific Instruments 88, 013106 (2017), URL http://dx.doi.org/10.1063/1.4973562.
- Hoesch et al. (2009b) M. Hoesch, X. Cui, K. Shimada, C. Battaglia, S.-i. Fujimori, and H. Berger, Phys. Rev. B 80, 075423 (2009b).
- Baumberger et al. (2004) F. Baumberger, W. Auwärter, T. Greber, and J. Osterwalder, Science 306, 2221 (2004), ISSN 0036-8075, eprint http://science.sciencemag.org/content/306/5705/2221.full.pdf, URL http://science.sciencemag.org/content/306/5705/2221.
- Jiang et al. (2011) J. Jiang, K. Shimada, H. Hayashi, H. Iwasawa, Y. Aiura, H. Namatame, and M. Taniguchi, Phys. Rev. B 84, 155124 (2011), URL https://link.aps.org/doi/10.1103/PhysRevB.84.155124.
- Starowicz et al. (2007) P. Starowicz, C. Battaglia, F. Clerc, L. Despont, A. Prodan, H. van Midden, U. Szerer, A. Szytula, M. Garnier, and P. Aebi, J. Alloys and Compounds 442, 268 (2007).
- sup (2017) Supplemental material (2017), uRL to be inserted by editor.