reception date \Acceptedacception date \Publishedpublication date
5-10-1 Fuchinobe, Chuo-ku, Sagamihara, Kanagawa 252-5258, Japan${}^{2}$${}^{2}$affiliationtext: MAXI team, RIKEN, 2-1 Hirosawa, Wako, Saitama 351-0198, Japan${}^{3}$${}^{3}$affiliationtext: Institute for Space-Earth Environmental Research (ISEE), Nagoya University,
Furo-cho, Chikusa-ku, Nagoya, Aichi 464-8601, Japan${}^{4}$${}^{4}$affiliationtext: Department of Physical Sciences, College of Science and Engineering, Ritsumeikan University, 1-1-1 Noji-higashi, Kusatsu, Shiga 525-8577, Japan${}^{5}$${}^{5}$affiliationtext: Center for Earth Information Science and Technology, Japan Agency for Marine-Earth Science and Technology, 3173-25 Showa-machi, Kanazawa-ku, Yokohama, Kanagawa 236-0001, Japan${}^{6}$${}^{6}$affiliationtext: Institute of Applied Physics (IFAC), National Research Council (NRC), Via Madonna del Piano, 10, 50019 Sesto, Fiorentino, Italy${}^{7}$${}^{7}$affiliationtext: Department of Physical Science, Earth and Environment, University of Siena, via Roma 56, 53100, Siena, Italy${}^{8}$${}^{8}$affiliationtext: ASI Science Data Center (ASDC), Via del Politecnico snc, 00133 Rome, Italy${}^{9}$${}^{9}$affiliationtext: Research Institute for Science and Engineering, Waseda University, 3-4-1 Okubo, Shinjuku, Tokyo 169-8555, Japan${}^{10}$${}^{10}$affiliationtext: Department of Physics and Astronomy, Louisiana State University, 202 Nicholson Hall, Baton Rouge, LA 70803, USA
Radiation mechanisms: non-thermal — Radiation mechanisms: thermal — (Stars:) gamma-ray burst: general — (Stars:) gamma-ray burst: individual (GRB 160107A)
Detection of the thermal component
in GRB 160107A
Abstract
We present the detection of a blackbody component in GRB 160107A emission by using the combined spectral data of the CALET Gamma-ray Burst Monitor (CGBM) and the MAXI Gas Slit Camera (GSC). The MAXI/GSC detected the emission 45 s prior to the main burst episode observed by the CGBM. The MAXI/GSC and the CGBM spectrum of this prior emission period is well fit by a blackbody with the temperature of keV plus a power-law with the photon index of . We discuss the radius to the photospheric emission and the main burst emission based on the observational properties. We stress the importance of the coordinated observations via various instruments collecting the high quality data over a broad energy coverage in order to understand the GRB prompt emission mechanism.
1 Introduction
Gamma-ray Bursts (GRBs) are short (from a few ms up to 100 seconds) and intense flashes of gamma-rays. GRBs are classified into short GRBs and long GRBs depending on whether their durations are shorter or longer than 2 s (Kouveliotou et al., 1993). It is widely accepted that these two GRB populations originate from different progenitors. The long GRBs are the result of explosions of massive stars (e.g., Woosley & Bloom (2006)), while the short GRBs are due to mergers of two neutron stars or a neutron star – black hole binaries (Eichler et al., 1989; Paczynski, 1991; Narayan et al., 1992). Merger events have been shown to be gravitational wave sources detectable by the current generation detectors such as the Laser Interferometer Gravitational-Wave Observatory (LIGO) and the Virgo (Abbott et al., 2016, 2017).
The radiation processes for the prompt GRB emission are still far from being understood. Most of the GRB prompt emission spectra are well represented by a smoothly connected broken power-law function – Band function (Band et al., 1993). The break energies, (the peak energy in the spectrum), are broadly distributed from a few keV up to a few MeV range (Sakamoto et al., 2005). This broad distribution reflects the intrinsic properties of GRB spectra (e.g., Amati et al. (2002)); its origin is not clear. Although the observed spectrum is due to the Synchrotron radiation from the relativistic electrons (e.g., Tavani (1996)), the low-energy photon indices of some of the observed spectra show a harder index than expected from the Synchrotron radiation (e.g., Preece et al. (1998)). A unique observation is needed to break through the current situation.
One interesting characteristic seen in some GRBs is the emergence of thermal emission in the prompt GRB spectra (e.g., Frontera et al. (2001)). The spectrum of the prompt emission of GRB 041006 shows blackbody components superimposed on the non-thermal spectrum (Shirasaki et al., 2008) with time-averaged temperatures 0.2 and 0.4 keV. Starling et al. (2012) identified a blackbody component with the temperature between 0.1 and 1 keV in the Swift data for nine GRBs. Identifications of the blackbody component with temperatures of several 10 keV up to 100 keV are claimed by the BATSE and the Fermi/GBM data (Ryde, 2005, 2010; Guiriec et al., 2013). Although thermal emission from the photosphere is expected in the standard fireball model (Goodman, 1986; Paczynski, 1986), the wide dynamic range of the claimed blackbody temperature distribution in the spectra observed in prompt GRB is difficult to understand in a simple way.
The CALorimetric Electron Telescope (CALET) was attached to the Exposed Facility of the Japanese Experimental Module (JEM) on the International Space Station (ISS) in August 2015 (Torii et al., 2011). The main scientific goals of CALET are the observations of high energy cosmic electrons and high energy GeV-TeV gamma-rays thanks to its thick calorimeter. To support the gamma-ray observations, CALET includes CALET Gamma-ray Burst Monitor (CGBM) to observe the prompt emissions of GRBs (Yamaoka et al., 2013). After a month of initial checkout, CGBM began its scientific observation on October 2015. CGBM consists of two kinds of scintillation detectors to cover a wide energy range from 7 keV up to 20 MeV: 1) The Hard X-ray Monitor (HXM) consists of a LaBr3(Ce) crystal (61 mm diameter and 1.27 mm thickness) with 410 m thickness Be window and a photomultiplier tube (PMT) covering the energy range from 7 keV to 1 MeV. There are two identical HXM units (HXM1 and HXM2) facing at the same direction roughly 10∘ tilted from the zenith direction. 2) The other scintillator is the Soft Gamma-ray Monitor (SGM), utilizing a BGO crystal (102 mm in diameter and 76 mm in thickness) and a PMT to cover the energy range from 40 keV to 20 MeV. The SGM points to the zenith direction. The field of views of HXM and SGM are 120∘ and 2 sr. The GRB detection rate of CGBM is 4 GRBs per month.
The Monitor of All-sky X-ray Image (MAXI) is also mounted on the Exposed Facility of the JEM-ISS (Matsuoka et al., 2009). MAXI consists of two different slit cameras: Gas Slit Camera (GSC) and Solid-state Slit Camera (SSC) consisting of 1 dimensional position-sensitive proportional counters and X-ray CCDs respectively. GSC covers the energy range of 2 – 30 keV and the two instantaneous fields of view of 160∘ at the zenith and the horizontal direction of the ISS. Because CALET and MAXI sit on the same platform, most of the MAXI/GSC and CGBM fields of view overlap.
In this paper, we report on the prompt emission properties of GRB 160107A. In subsection 2.1, the temporal results from the CGBM and the MAXI/GSC data, and also the localization by the MAXI/GSC and the Interplanetary network, are shown. We present the CGBM and the MAXI/GSC spectral properties in subsection 2.2. We discuss our result in section 3. The quoted errors are at the 90% confidence level unless stated otherwise.
2 Observation and Data analysis
2.1 Temporal Properties and Localization
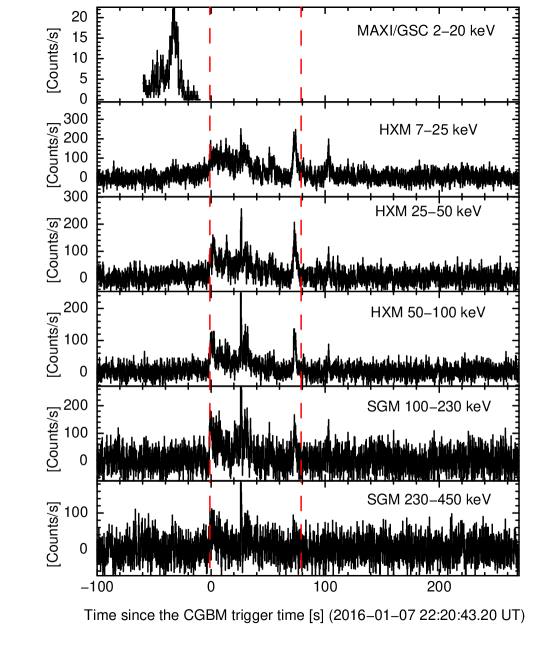
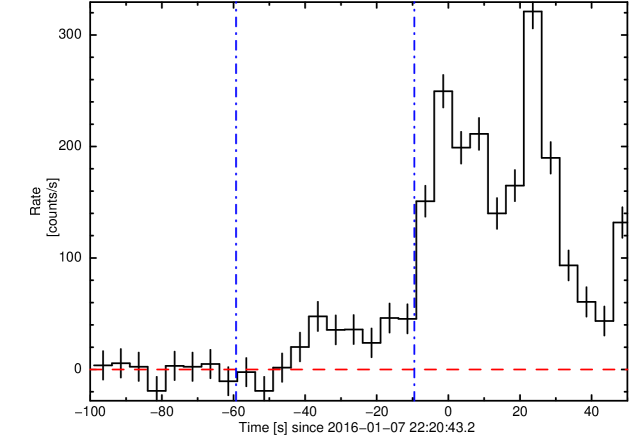
GRB 160107A was detected by CGBM on 2016 January 7 at 22:20:43.20 (UT) (Nakahira et al., 2016). The burst was also detected by MAXI/GSC (Nakagawa et al., 2016), Fermi/GBM (Veres et al., 2016), INTEGRAL (SPI-ACS) and Wind/KONUS (Golenetskii et al., 2016). Figure 1 shows the light curve of GRB 160107A based on the CGBM and MAXI/GSC data. The CGBM light curve shows a complex structure with multiple overlapping pulses. We use the Swift analysis tool, battblocks, to measure the of the SGM data. The no-background subtracted light curve in 0.125 s binning over the 40–1000 keV band is used. The measured by the SGM is 73.5 19.0 s (1 ). Thus, GRB 160107A is classified as a long GRB. Interestingly, as seen in figure 1, the emission seen in the MAXI/GSC was 45 s earlier than the CGBM trigger time. At the time of the MAXI detection, a faint emission is visible in the HXM light curve (figure 2). The significance of this weak emission in the HXM is 5.5 in the 7 - 100 keV band. Note that the field of view of the MAXI/GSC camera moved outside the location of GRB 160107A around 20 s before the CGBM trigger time. Therefore, the main part of the emission was not detected by the MAXI/GSC.
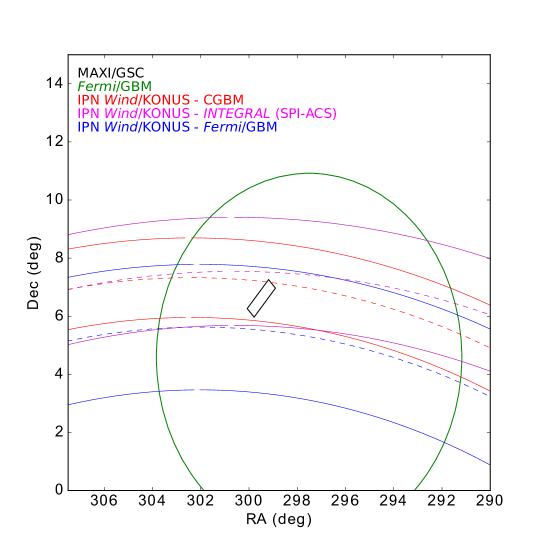
The best fit 90% error region based on the MAXI/GSC data is described by a rectangular region with the following four corners: (R.A., Dec. ) = (298905, 6966), (299190, 7260), (300∘.076, 6∘.261) and (299∘.789, 5∘.968) (J2000.0). The Fermi/GBM ground localization is (R.A., Dec.) = (297∘.510, +4∘.590) (J2000.0) with error radius (1 ) plus systematic error of (Connaughton et al., 2015) which is consistent with the MAXI/GSC error region. We further performed the localization analysis using the Interplanetary Network (IPN). We cross-correlated the light curve data of the /GBM and the /Konus, and the SGM and the /Konus, the INTEGRAL (SPI-ACS) and the /Konus. Figure 3 shows the IPN position annuli overlaid with the MAXI/GSC and the /GBM best positions. The IPN location is consistent with the MAXI/GSC error region, but the MAXI/GSC error region provides the best localization of this GRB. Based on the temporal and the positional coincidence, we concluded that the MAXI/GSC emission is clearly associated to GRB 160107A.
2.2 Spectrum
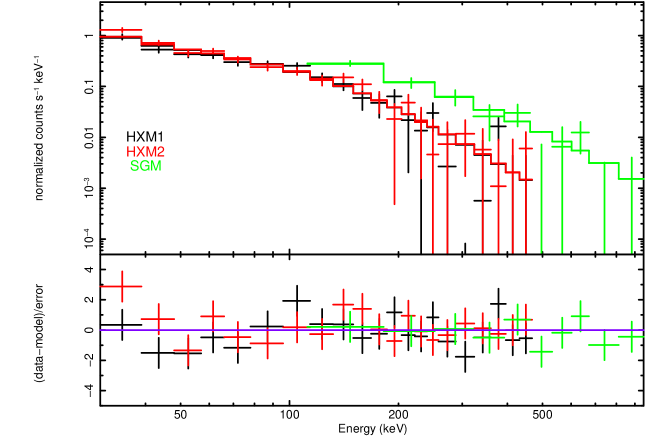
First, we investigated the spectral properties of the main part of the emission using the CGBM data. The spectral files extracting the data between 1.1 s and 78.9 s are created for HXM1, HXM2 and SGM, where is the trigger time of CGBM (January 7 at 22:20:43.20). The background files are generated for each spectral channel by fitting the channel separately with a second order polynomial function before the burst ( s to s) and after the burst ( s to s). The gain-correction is applied to those spectral files by fitting the background lines at 1.47 MeV due to 138La in the LaBr3 (Ce) crystal for the HXM data (Quarati et al., 2012) and 2.2 MeV due to activation of the BGO crystal for the SGM data. We examined the gain-corrected spectra using the background lines at 35.5 keV and 511 keV, and found the energy of those lines to be accurate within 5%. The detector response matrices (DRMs) of CGBM are developed using a Monte-Carlo simulator based on the GEANT4 software package (Agostinelli et al., 2003). Since the DRMs are sensitive to the incident angle of the event, we run the simulator using the best burst position from MAXI, (R.A., Dec.) = (299∘.670, 6∘.413) (J2000.0). The incident angles of GRB 160107A at the detector plane of HXM and SGM are (, ) = (23∘.2, 174∘.6) and (13∘.3, 170∘.6) where and are zenith and azimuth angles. The zenith direction of CALET corresponds to . The front direction of CALET corresponds to . Since the variation in the incident angle during the burst interval ( s) is less than , we used the DRM for the fixed position. Details about the CGBM DRMs, the calibration status and the results of the cross spectral calibrations using the simultaneously detected bright GRBs with the Swift/BAT data are described in appendices 1 and 2. Since there is uncertainty due to absorption by structures around detectors in the low energy region, we only used the data above 30 keV for HXM and above 100 keV for SGM. XSPEC version 12.9.1 is used in the spectral analysis.
Table 2.2 presents the results of the time-integrated spectral analysis of the burst. The spectrum is best fitted by a power-law times an exponential cutoff (CPL) function. The improvement in a CPL over a simple power-law (PL) fit is 8.42 in 1 degree of freedom. A Band function results in no better than CPL. We simulated 10,000 spectra inputting the best fit parameters of a CPL model using the same background spectrum generated in the analysis. We fit the simulated spectra by both PL and CPL models, and calculate the number of the simulated spectra which exceed of 8.42. We found that 4,459 simulated spectra exceed of 8.42. This corresponds to the significance of the improvement of 44.6%. Therefore, the improvement of a CPL over a PL in the observed spectrum is not highly significant based on the simulation study. However, the best fit photon index of and of keV in a CPL model are consistent with Wind/KONUS and Fermi/GBM (Golenetskii et al. (2016); Gruber et al. (2014); von Kienlin et al. (2014); Bhat et al. (2016)), with steeper than typical values of the low energy photon index for long GRBs (Kaneko et al., 2006). The fluence and the 1-second peak flux calculated in the best fit CPL are erg cm-2 () and erg cm-2 s-1 () at the 30 - 500 keV band. The 1-second peak flux was measured between s and s.
Next, we examined the MAXI/GSC spectrum at the time of the MAXI detection. We used the MAXI standard software for creating the spectrum. The calibrated MAXI/GSC event data were downloaded from the Data Archive Transmission System (DARTS).111http://darts.isas.jaxa.jp/pub/maxi The MAXI/GSC camera ID 4 and 5 detected the photons from the GRB. After the observation information files were generated by mxscancur, the exposure maps (WMAP files) for individual camera were created by mxgtiwmap. The source and the background spectral files were extracted by xselect from the calibrated MAXI/GSC event file. The source region is selected as a circle of a radius of 1∘.6 at (R.A., Dec.) = (299∘.670, 6∘.413) (J2000.0) as a center. The background region is an annulus of an outer radius of 3∘ and an inner radius of 1∘.6 at (R.A., Dec.) = (299∘.670, 6∘.413) (J2000.0) as a center. There is 10 % uncertainty in the exposure time due to the position uncertainty. The source spectrum is extracted when the effective area to the source position is 0.05 cm2 which corresponds from s to s. The detector response files were generated by mxgrmfgen. The energy range used in the spectral analysis of the MAXI/GSC spectrum is from 2 keV to 30 keV. There is no issue of the dead-time in the MAXI/GSC data in the count rate level of GRB 170107A.
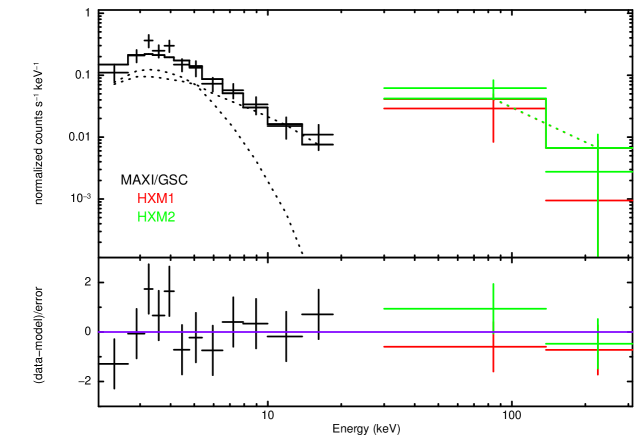
Table 2.2 shows the results of the spectral analysis of the MAXI prior emission. We fit the spectrum by a power-law, a blackbody, a cutoff power-law, Band function and a power-law plus blackbody model with the interstellar absorption, , which is the model “wabs” in xspec. The best fit spectral model of the MAXI/GSC data is the highly absorbed power-law model with = cm-2. However, we believe this best fit model is unphysical because of the unrealistically large . This GRB is located at the galactic latitude of and the calculated Galactic by Dickey & Lockman (1990) at this direction is cm-2. Furthermore, according to Willingale et al. (2013), the mean observed of X-ray afterglow spectra observed by Swift XRT is cm-2. Our derived of cm-2 corresponds to percentile of the distribution of Willingale et al. (2013). Therefore, we concluded that the absorption-like-feature apparently seen at low energy in the MAXI/GSC spectrum is not due to the real absorption by the interstellar medium and the host galaxy of GRB 160107A. On the other hand, although a residual is seen at high energies, the spectrum can be also well fitted by a blackbody with the temperature of 1.2 keV. It is possible to reduce this residual in the blackbody fit by adding a power-law component. No significant improvement in is seen by the Band function over a simple power-law fit.
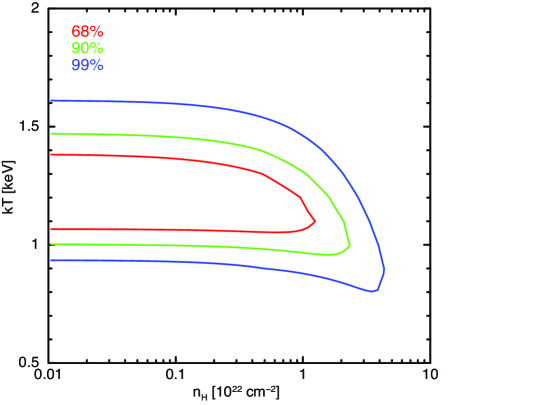
We also performed joint fitting analysis including the HXM data. The time interval of the HXM spectrum is between s and s. The results of the joint fitting are shown in table 2.2. We found that the best fit spectral model is a blackbody plus a power-law model in the joint fit analysis. The photon index of and a temperature keV are consistent with the results from the MAXI/GSC data alone. The improvement of an absorbed blackbody plus a power-law model over an absorbed power-law model is 5.10 in 2 degrees of freedom. We simulated 10,000 spectra inputting the best fit parameters of an absorbed blackbody plus a power-law model. We fit the simulated spectra by both an absorbed blackbody plus a power-law model and an absorbed power-law model, and calculate the number of the simulated spectra which exceed of 5.10. We found that 3,056 simulated spectra exceeding of 5.10. The significance of the improvement is 30.6%. Addition to the discussion regarding in the previous paragraph, the best representative model of the prior emission spectrum is a blackbody plus a power-law model, with the thermal emission superimposed on the non-thermal component at 45 seconds before the main burst episode. As shown in Figure 6, our derived blackbody temperature is not sensitive to the value of .
Time-averaged spectral parameters of the CGBM spectrum.
Model
A∗*∗*footnotemark:
SGM constant factor
d.o.f.
[keV]
[ph cm-2 s-1 keV-1]
PL††\dagger††\daggerfootnotemark:
67
1.33
54.04 / 49
CPL‡‡\ddagger‡‡\ddaggerfootnotemark:
102
19
1.42
45.62 / 48
BAND§§\S§§\Sfootnotemark:
(fixed)
6.0
1.35
48.92 / 48
{tabnote}
∗*∗*footnotemark: The normalization of a power-law and a cutoff power-law model is calculated at 1 keV. Whereas, the
normalization of a Band function is calculated at 100 keV.
††\dagger††\daggerfootnotemark: A power-law model.
‡‡\ddagger‡‡\ddaggerfootnotemark: A power-law times exponential cutoff model.
§§\S§§\Sfootnotemark: Band function.
Fit parameters for the MAXI prior emission spectrum.
Instruments
Model
nH
APL∗*∗*footnotemark:
kT
ABB††\dagger††\daggerfootnotemark:
d.o.f.
[ cm-2 ]
[keV]
[ph cm-2 s-1 keV-1]
[keV]
MAXI
PL§§\S§§\Sfootnotemark:
3.7
12
9.18 / 9
MAXI
PL
0.14 (fixed)
2.8
14.64 / 10
MAXI
BB∥∥\|∥∥\|footnotemark:
0.14 (fixed)
0.11
21.21 / 10
MAXI
CPL##\###\#footnotemark:
0.14 (fixed)
1.9
13.03 / 9
MAXI
BAND∗∗**∗∗**footnotemark:
0.14 (fixed)
8.49/8
MAXI
PL+BB
0.14 (fixed)
0.09
1.0
0.08
8.45 / 8
MAXI
PL+BB
0.14 (fixed)
(fixed)
0.2
0.9
0.07
8.57 / 9
MAXI & HXM
PL
0.14 (fixed)
2.6
16.83 / 14
MAXI & HXM
BB
0.14 (fixed)
1.2
0.11
31.83 / 14
MAXI & HXM
CPL
0.14 (fixed)
‡‡\ddagger‡‡\ddaggerfootnotemark:
not determined
2.6‡‡\ddagger‡‡\ddaggerfootnotemark:
16.84 / 13
MAXI & HXM
BAND
0.14 (fixed)
13.47/12
MAXI & HXM
PL+BB
0.14 (fixed)
0.9
1.0
0.05
11.73 / 12
{tabnote}
∗*∗*footnotemark: A normalization of either a power-law or a power-law times exponential cutoff model at 1 keV. Whereas, the
normalization of a Band function is calculated at 10 keV.
††\dagger††\daggerfootnotemark: A normalization of a blackbody in the unit of where
is the source luminosity in units of erg s-1 and is the distance of the source in
units of 10 kpc
‡‡\ddagger‡‡\ddaggerfootnotemark: An error is not available.
§§\S§§\Sfootnotemark: A power-law model.
∥∥\|∥∥\|footnotemark: A blackbody.
##\###\#footnotemark: A power-law times exponential cutoff model.
∗∗**∗∗**footnotemark: Band function.
3 Discussion
The MAXI/GSC detection prior to the main burst episode is achieved in coordination with the high sensitity soft X-ray survey data of the MAXI/GSC and the wide field hard X-ray survey data of the CGBM, both of which are physically located on the same platform. The CGBM provides the data from 7 keV up to 20 MeV for a bright transient source whereas MAXI/GSC data provides simultaneous data from 2 keV up to 30 keV. The field of view of the MAXI/GSC cameras always overlap with that of the CGBM. Therefore, we would expect to have GRBs observed simultaneously by CGBM and MAXI/GSC. We estimate the number of simultaneously observed GRBs as follows: The instantaneous field of views of the SGM and the MAXI/GSC are 20000 deg2 (2 ) and 480 deg2 ( in two directions). The observation efficiencies are 40% for the MAXI/GSC (Sugizaki et al., 2011) and 60% for the CGBM. Since the CGBM detects 50 GRBs per year, we expect 1 GRB per year to be detected simultaneously. However, as we show here for GRB 160107A, the timing is not necessary matched between two instruments. Furthermore, to confirm this fact, the MAXI/GSC also detected the emission at 320 s after the main burst episode for GRB 160509A (Ono et al., 2016). So far, we have four simultaneously detected GRBs between the CGBM and the MAXI/GSC in one year of the overlapping operation.
Following the argument of Pe’er (2007), we estimate the photospheric radius from the observed parameters of the blackbody component. The photospheric radius can be estimated by the following equation: where is a bulk Lorentz factor, is a luminosity distance, is a geometric factor of order of unity (we assume ), is a redshift and () is the ratio between the blackbody flux and where is the Stefan-Boltzmann constant and is the blackbody temperature. From the observed blackbody component, we derive . Assuming a bulk Lorentz factor of 100 and a redshift of 1, together with the cosmological parameters of , and km s-1 Mpc-1, the photospheric radius is calculated as
| (1) |
The radius of the main burst emission site is estimated by the 45 s delay which we observed between the MAXI/GSC and the CGBM data. The difference of the arrival time of the photons emitted between and () to the observers can be expressed as the radial time scale (Piran, 1999), where is a bulk Lorentz factor at and is a speed of light. Substituting as the observed delay time of 45 s () and as the derived photospheric radius of cm, the parameter is estimated as
| (2) |
Since the radius to the main burst episode site is , its radius is estimated to be cm. This estimated radius is consistent with the radius between internal shocks in the case of (Piran, 1999). Note, however, that our discussion relies on the assumption of a redshift. Unfortunately, the sky location of GRB 160107A at the time of the trigger was too close to the Sun to perform the follow-up observations from the ground facilities. As shown here for GRB 160107A, the soft X-ray data of MAXI can provide an important clue in understanding the prompt emission from GRBs. Therefore, we strongly encourage the follow-up to MAXI detected GRBs to identify an afterglow and a host galaxy in order to have a secure redshift measurement.
A possible origin of a thermal component is an emission from a mildly relativistic cocoon around a jet (Ramirez-Ruis, Celotti & Rees, 2002; Nakar & Piran, 2017). According to the calculation of Lazzati et al. (2017), X-ray flux expected from a cocoon is erg cm-2 s-1 at a typical distance of 1 Gpc for long GRBs. Our detected thermal X-ray emission is erg cm-2 s-1 which is two order of magnitude brighter than the calculation. Another interesting possibility is a supernova shock breakout emission. The onset X-ray emission of a shock breakout is detected by Swift XRT for SN 2008D (Soderberg et al., 2008). The peak X-ray luminosity of this shock breakout is erg s-1 which corresponds to erg cm-2 s-1 at 1 Gpc. This estimated flux is three order of magnitude weaker than the thermal emission of GRB 160107A. Therefore, either a cocoon or a shock breakout emission is expected to be below the detection sensitivity of MAXI/GSC at the typical distance of long GRBs, and is difficult to be the origin of the thermal emission of GRB 160107A.
The blackbody temperature of 1 keV which we see in the GRB 160107A spectrum is one or two order of magnitudes smaller than the reported blackbody temperature in the BATSE (e.g., Ryde (2005)) and the Fermi-GBM (e.g., Ryde (2010); Guiriec et al. (2013)) GRB spectra. Our temperature is more consistent with the identified blackbody components reported by HETE-2 (Shirasaki et al., 2008) and Swift (Starling et al., 2012). However, our understanding of the thermal emission in the prompt GRB spectrum is limited by a small number of incomplete (e.g, no redshift measurement) samples. As we demonstrated here for GRB 160107A, the coordination of the scientific instruments on-board ISS becomes important to enhance the science outcome. Joint observation by on-going X-ray missions like MAXI and NICER, and a future mission like TAO-ISS along with the hard X-ray survey instrument like CGBM will be crucial to collect high quality broad-band data related to the GRB emission.
We would like to thank the anonymous referee for comments and suggestions that materially improved the paper. We would also like to thank D. Svinkin for providing the analysis of the IPN localization, and also useful comments and discussions. We gratefully acknowledge JAXA’s contributions for CALET development and on-orbit operations. We express our sincere thanks to all of the CALET members for allowing us to use the CGBM data. The CALET data used in this analysis are provided by the Waseda CALET Operation Center (WCOC) located at the Waseda University. This work is supported by MEXT KAKENHI Grant Numbers 17H06357, 17H06362 (T.S.), and 24684015 (K.Y.). This research was also supported by a grant from the Hayakawa Satio Fund awarded by the Astronomical Society of Japan (Y.K.).
Appendix A Energy response function of CGBM
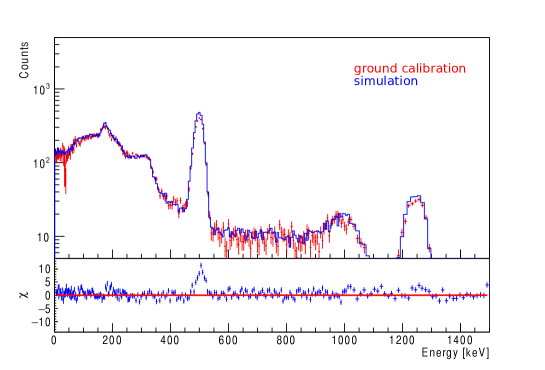
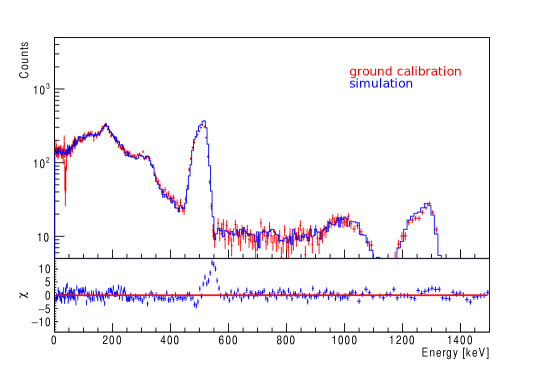
The CGBM energy response function has been built by the simulator based on the GEANT4 simulation package (Agostinelli et al., 2003). All the materials of the flight CGBM detectors are modeled in the simulator. The entire CALET structure is included in the simulator, although, a simplified structure is used for the CAL (only precisely modeling the heavy elements which are responsible for the absorption and the scattering) in order to reduce the calculation speed (Yamada et al., 2017). The detailed instrumental characteristics of HXM and SGM, based on the results of the pre-flight ground testing (Nakahira., 2017), are also included in the simulator.
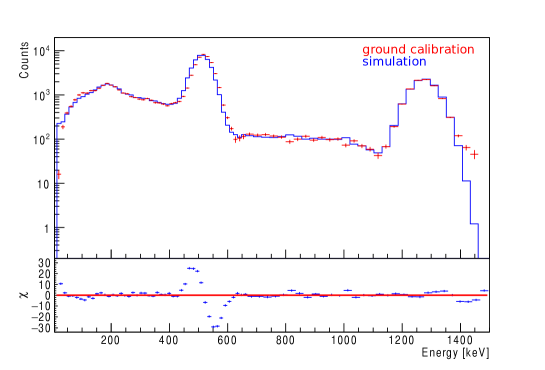
Ground testing data were collected by irradiating the flight instruments with radioactive sources and soft X-rays from an X-ray generator. Figure 7 shows the comparison between the data and the simulated 22Na spectra for HXM1, HXM2 and SGM using the CGBM simulator. As can be seen in the figure, both the energies and the normalizations of the 511 keV and the 1275 keV lines agree quite well. The difference in the line shape of the 511 keV line between HXM1 and HXM2 is also well modeled in the simulator. Despite a clear residual in the 511 keV line in the SGM, the overall shape of the spectrum shows a good agreement. The net counts in the 511 keV peak in the simulated spectra are 20 % and 3 % larger than the calibration data of HXM and SGM. The energy resolution of the simulated spectra agrees with the measured value to within 5% for all detectors. Therefore, the CGBM simulator has been demonstrated to reproduce the ground testing data accurately.
Appendix B Spectral cross-calibration between CGBM and Swift/BAT using the simultaneously detected bright GRBs
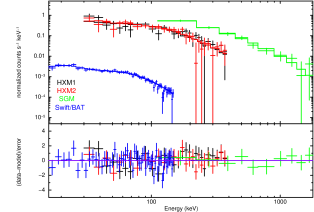
We use the bright GRBs simultaneously detected by the Swift/BAT since the systematic error in the energy response function has been studied in detail among the Wind/KONUS and the Suzaku/WAM using the GRB data (Sakamoto et al., 2011). We identified two GRBs, GRB 161218A and GRB 170330A, for this investigation. The incident angles to the HXM and the SGM boresights are 37∘ and 30∘ for GRB 161218A, and 32∘ and 35∘ for GRB 170330A. We extracted the time-averaged spectra for both the CGBM and the BAT using the exactly the same time interval. The BAT spectrum is extracted from the event data using the standard procedure.222https://swift.gsfc.nasa.gov/analysis/threads/batspectrumthread.html As was done in the spectral analysis of GRB 160107A, the XSPEC (v12.9.1) is used in this joint spectral analysis.
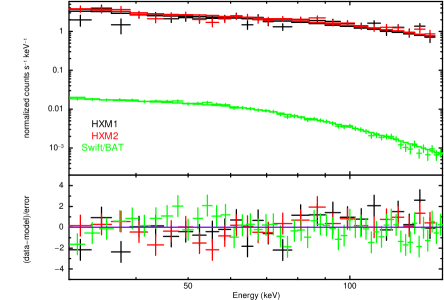
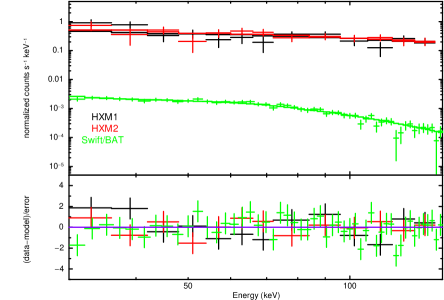
First, we performed the joint spectral analysis only using the HXM data to focus on the investigation of the low energy response of the HXM. The HXM spectrum is fitted between 30 and 150 keV. Figure 8 shows the joint fit spectra and table B summarizes the best fit parameters. Both the photon indices and the normalizations measured by the HXM are consistent with those of measured by Swift/BAT. Also, no significant residual is seen in both joint fitted spectra of GRB 161218A and GRB 170330A. Therefore, we concluded that the systematic error in the low energy part of the HXM data (30–150 keV) is 10–20% as is discussed in Sakamoto et al. (2011) as the systematic uncertainty in the Swift BAT data.
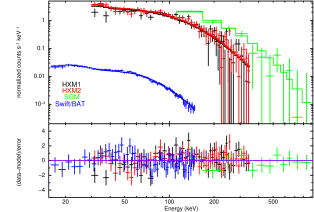
Second, we included the SGM data in the fit. In this three-instrument joint fit, we multiplied the model by a constant factor. We fixed the constant factor of BAT to unity. Figure 9 shows the joint fit spectra and table B summarizes the joint fits by different spectral models. In the joint fitted spectra of GRB 161218A and GRB 170330A, the constant factors of HXM1 and HXM2 were consistent with unity, as is the case without the SGM data. The centroids of the SGM constant factors of GRB161218A and GRB 170330A were 1.3 and 1.8, probably due to the incomplete modeling of the CALET in the simulator. Furthermore, the time-dependent background variation due to charged particles makes it difficult to model the background spectrum accurately. Since we are still working on understanding the influence of the structures around the detector and the uncertainty in the background modeling, we decided to multiply the model by a constant factor as a free parameter in the GRB 160107A data to take into account the currently unknown systematic uncertainty in the SGM data.
Fit parameters of GRB 161218A and GRB 170330A with HXM and Swift/BAT.
GRB name
instrument
models
C(HXM1)∗*∗*footnotemark:
C(HXM2)††\dagger††\daggerfootnotemark:
norm
degree of freedom
[keV]
[ph cm-2 s-1 keV-1]
GRB161218A
CGBM
CPL‡‡\ddagger‡‡\ddaggerfootnotemark:
not determined
3.6
44.75/49
Swift/BAT
CPL
127
2.1
33.95/48
joint
CPL
1.01
0.98
193
5.4
106.15/98
GRB170330A
CGBM
PL§§\S§§\Sfootnotemark:
1.5
22.97/24
Swift/BAT
PL
1.16
42.11/49
joint
PL
0.95
1.04
1.18
64.52/73
{tabnote}
∗*∗*footnotemark: A constant factor of HXM1.
††\dagger††\daggerfootnotemark: A constant factor of HXM2.
‡‡\ddagger‡‡\ddaggerfootnotemark: A power-law times exponential cutoff model.
§§\S§§\Sfootnotemark: A power-law model.
Fit parameters of GRB 161218A and GRB 170330A from joint fit with HXM, SGM and Swift/BAT
GRB name
models
C(HXM1)∗*∗*footnotemark:
C(HXM2)††\dagger††\daggerfootnotemark:
C(SGM)‡‡\ddagger‡‡\ddaggerfootnotemark:
norm
degree of freedom
[keV]
[ph cm-2 s-1 keV-1]
GRB161218A
PL§§\S§§\Sfootnotemark:
0.37
556.90/171
CPL||||||footnotemark:
164.92/170
BAND##\###\#footnotemark:
(fixed)
194.67/170
GRB170330A
PL
169.79/119
CPL
93.03/118
BAND
(fixed)
6.9
93.07/118
{tabnote}
∗*∗*footnotemark: A constant factor of HXM1.
††\dagger††\daggerfootnotemark: A constant factor of HXM2.
‡‡\ddagger‡‡\ddaggerfootnotemark: A constant factor of SGM.
§§\S§§\Sfootnotemark: A power-law model.
∥∥\|∥∥\|footnotemark: A power-law times exponential cutoff model.
##\###\#footnotemark: Band function.
References
- Abbott et al. (2016) Abbott, B. P. et al. 2016, PhRvL, 116, 061102
- Abbott et al. (2017) Abbott, B.P. et al. 2017, ApJL, 848, 12
- Agostinelli et al. (2003) Agostinelli, S., et al. 2003, NIM A, 506, 250
- Amati et al. (2002) Amati, L. et al. 2002, A&A, 390, 81
- Band et al. (1993) Band, D. et al. 1993, ApJ, 413, 281
- Bhat et al. (2016) Bhat, P. N. et al.. 2016, ApJS, 223, 28
- Connaughton et al. (2015) Connaughton, V. et al., 2015, ApJS 216, 32
- Dickey & Lockman (1990) Dickey, J. M., & Lockman, F. J. 1990, ARA&A, 28, 215
- Eichler et al. (1989) Eichler, D., Livio, M., Piran, T., & Schramm, D. N., 1989, Nature, 340, 126
- Frontera et al. (2001) Frontera, F. et al. 2001, ApJ, 550, L47
- Golenetskii et al. (2016) Golenetskii, S. et al. 2016, Gamma-Ray Coordinates Network, 18857
- Goodman (1986) Goodman, J., 1986, ApJ, 308, L47
- Gruber et al. (2014) Gruber, D. et al. 2014, ApJS, 211, 12
- Guiriec et al. (2013) Guiriec, S. et al. 2013, ApJ, 770, 32
- Kaneko et al. (2006) Kaneko, Y., Preece, R. D., Briggs, M. S., Paciesas, W. S., Meegan, C. A., & Band, D. L., 2006, ApJS, 166, 298
- Kouveliotou et al. (1993) Kouveliotou, C., Meegan, C. A., Fishman, G. J., Bhat, N. P., Briggs, M. S., Koshut, T. M., Paciesas, W. S., & Pendleton, G. N., 1993, ApJ, 413, L101
- Lazzati et al. (2017) Lazzati, D., Deich, A., Morsony, B.J., Workman, J.C., 2017, MNRAS, 471, 1652
- Matsuoka et al. (2009) Matsuoka, M. et al. 2009, PASJ, 61, 999
- Nakagawa et al. (2016) Nakagawa, E. Y. et al. 2016, Gamma-Ray Coordinates Network, 18839
- Nakahira et al. (2016) Nakahira, S. et al. 2016, Gamma-Ray Coordinates Network, 18845
- Nakahira. (2017) Nakahira, S., 2017, 7 years of MAXI: monitoring X-ray Transients proceedings, p.261
- Nakar & Piran (2017) Nakar, E., Piran, T., 2017, ApJ, 834, 28
- Narayan et al. (1992) Narayan, R., Paczyński, B., & Piran, T., 1992, ApJ, 395, L83
- Ono et al. (2016) Ono, Y. et al. 2016, Gamma-Ray Coordinates Network, 19405
- Paczynski (1986) Paczyński, B., 1986, ApJ, 308, L43
- Paczynski (1991) Paczyński, B. 1991, ACTA ASTRONOMICA., 41, 257
- Pe’er (2007) Pe’er, A., Ryde, F., Wijers, R. A. M. J., Mészáros, P., & Rees, M. J. 2007, ApJ, 664, L1
- Piran (1999) Piran, T. 1999, Physics Reports, 314, 575
- Preece et al. (1998) Preece, R.D., Briggs, M. S., Mallozzi, R. S., Pendelton, G. N., Paciesas, W. S., & Band, D. L. 1998, ApJ, 506, L23
- Quarati et al. (2012) Quarati, F.G.A., Khodyuk, I. V., van Eijk, C.W.E., Quarati, P., & Dorenbos, P. et al. 2012, NIM A, 2012, 683, 46
- Ramirez-Ruis, Celotti & Rees (2002) Ramirez-Ruiz, E., Celotti, Al, Rees, M.J., 2002, MNRAS, 337, 1349
- Ryde (2005) Ryde, F. 2005, ApJ, 625, L95
- Ryde (2010) Ryde, F. et al. 2010, ApJL, 709, L172
- Sakamoto et al. (2005) Sakamoto, T. et al. 2005, ApJ, 629, 311
- Sakamoto et al. (2011) Sakamoto, T., et al. 2011, PASJ, 63, 215
- Shirasaki et al. (2008) Shirasaki, Y. et al. 2008, PASJ, 60, 919
- Soderberg et al. (2008) Soderberg, A.M. et al. 2008, 453, 7194
- Starling et al. (2012) Starling, R.L.C., Page, K.L., Pe’er, A., Beardmore, A.P., & Osborne, J.P., 2012, MNRAS, 427, 2950
- Sugizaki et al. (2011) Sugizaki, M. et al. 2011, PASJ, 63, 635
- Tavani (1996) Tavani, M. 1996, ApJ, 466, 768
- Torii et al. (2011) Torii, S. 2011 NIM A, 2011, 630, 55
- Veres et al. (2016) Veres, P & Meegan, C. 2016, Gamma-Ray Coordinates Network, 18844
- von Kienlin et al. (2014) von Kienlin, A. et al, 2014, ApJS, 211, 13
- Willingale et al. (2013) Willingale, R., Starling, R. L. C., Beardmore, A. P., Tanvir, N. R., & O’Brien, P. T. 2013, MNRAS, 431, 394
- Woosley & Bloom (2006) Woosley, S. E., & Bloom, J. S. 2006, ARA&A, 44, 507
- Yamada et al. (2017) Yamada, Y., Sakamoto, T., Yoshida, A. 2017, 7 years of MAXI: monitoring X-ray Transients proceedings, p.271
- Yamaoka et al. (2013) Yamaoka, K., et al. 2013, 7th Huntsville Gamma-Ray Burst Symposium, GRB 2013: paper 41 in eConf Proceedings C1304143