[Queens,RMC]
[RMC]
[Bishops]
Queens]Dept. of Physics, Queen’s University
Kingston, ON, Canada
RMC]Dept. of Physics, Royal Military College of Canada
Kingston, ON, Canada
Bishops]Dept. of Physics and Astronomy, Bishop’s University
Sherbrooke, QC, Canada
Deciphering the Surprising Variability of A-type Stars Revealed by Kepler
Abstract
A recent analysis of high precision photometry obtained using the Kepler spacecraft has revealed two surprising discoveries: (1) over 860 main sequence A-type stars – approximately of those identified in the Kepler field – exhibit periodic variability that may be attributable to rotational modulation by spots and (2) many of their light curves indicate the presence of a mysterious and characteristic power spectral feature. We have been carrying out an ongoing analysis designed to expand upon these discoveries and to provide a possible explanation for the unusual power spectral features. In the following, we will put these recent discoveries into context as well as discuss the preliminary findings yielded by our analysis of the Kepler light curves.
1 Introduction
In general, main sequence (MS) A-type stars are not known to be significantly active. They do not exhibit the high-energy, X-ray emitting flares and coronal mass ejections that are produced by low-mass MS stars. Nor are they hot enough to emit dense, high-velocity line-driven winds such as those associated with early B- and O-type MS stars. As such, they are often defined by their intermediate mass or “tepid" surface temperatures (e.g. Landstreet, 2003) in part as a way of distinguishing them from their more active low- and high- mass counterparts. However, with the availability of space-based photometric observations such as those obtained by Kepler, it has become evident that a significant fraction of MS A-type stars do exhibit low-amplitude variability; in many cases, this phenomena currently defies an explanation.
There are various mechanisms which can induce periodic brightness variations in MS A-type stars. Pulsations are one example, which can occur for stars located within well-studied instability strips on the Hertzsprung-Russell diagram. This kind of photometric variability occurs at both low frequencies (, e.g. Dor stars) and high frequencies (, e.g. Scuti stars) with amplitudes . The presence of surface structures (e.g. chemical spots) may also result in brightness variations as a consequence of flux redistribution in combination with a star’s rotation. These so-called CVn variable stars exhibit photometric amplitudes with frequencies where the upper limit is based on the critical rotational frequency of a typical MS A-type star.
It has long since been established that the origin of the spots associated with CVn stars is related to the presence of strong (), stable, and organized magnetic fields and that these objects are in fact equivalent to the class of chemically peculiar magnetic Ap/Bp stars. More recently, a new class of magnetic MS A-type star has emerged following the detection of ultra-weak fields () on the surfaces of Vega and Sirius A (Lignières et al., 2009; Petit et al., 2011a). Given the essentially one-to-one correlation between CVn variables and magnetic Ap/Bp stars, it is perhaps unsurprising that the detection of a magnetic field on Vega was soon followed by the detection of spots on its surface (Böhm et al., 2015). These findings may well suggest that a large fraction of MS A-type stars – much larger than the incidence rate of Ap/Bp stars (e.g. Wolff, 1968; Aurière et al., 2007) – host ultra-weak fields on their surfaces and exhibit low-amplitude photometric variability (Petit et al., 2011b).
In 2011, Balona carried out an analysis of Kepler light curves associated with A-type stars and reported that a large fraction of them exhibit sharp, low-frequency peaks in their periodograms that are consistent with rotational modulation with periods of a few days (Balona, 2011). This study was expanded upon with the release of additional Kepler data (Balona, 2013) culminating in the identification of 887 rotationally modulated A star light curves – of those found within the original Kepler field. It has been suggested that this variability may be produced by spots similar to those detected on Vega (Böhm et al., 2015; Blazère et al., 2016).
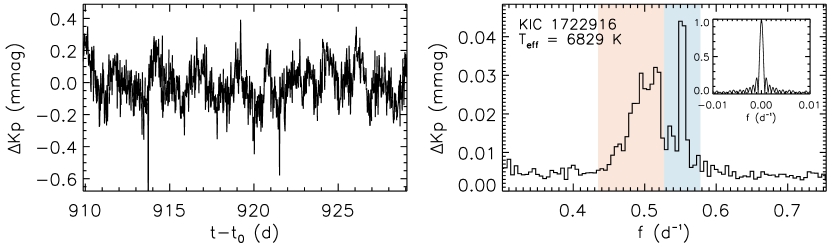
In addition to this discovery, Balona (2013) reported the widespread detection of characteristic peculiar features in the periodograms. These “peculiar periodogram features" consist of a diffuse peak accompanied by a narrow peak at slightly higher frequency (Fig. 1). Balona (2013, 2014) speculated that the peculiar periodogram features are caused by the combination of two phenomena: (1) the diffuse peaks are produced by the presence of spots in the photospheres of each A star, where the broadening is a consequence of differential rotation; (2) the narrow peaks are produced by a hot Jupiter orbiting the A star with a period only slightly shorter than the star’s rotational period (). In the following, we propose an alternative explanation for the origin of these peculiar periodogram features and summarize some of the preliminary findings of our ongoing study.
2 Sub-surface Structures
Consider a light curve having variability that can be attributed to the presence of inhomogeneous structures on the rotating star’s surface. In the case of light curves obtained by Kepler, the measurements span long timescales such that any broadening of the periodogram peaks occuring at the star’s rotational period can be interpreted in two ways: (1) it is caused by structures having relatively short lifetimes (in comparison to the observing timescale) or (2) it is caused by differential rotation in which the rotational frequencies of the structures depend on their latitudes. Narrow peaks having widths comparable to the periodogram’s frequency resolution are indicative of surface structures that are stable (both in brightness and in frequency) over the observing timescale. Given that the peculiar periodogram features consist of both broad and narrow peaks that are correlated in frequency, it is difficult to attribute their origin to any currently understood surface structures.
We propose that the broad and narrow peaks defining the peculiar periodogram features are produced by inhomogeneous structures localized within two distinct regions. In this scenario, the narrow periodogram peaks are produced on or near the (presumably) rigidly rotating stellar surface. On the other hand, the broad peaks are produced by similar structures forming at lower depths near a sub-surface convective-radiative boundary. This hypothesis immediately yields two predictions: we expect that, as the depth of this convective-radiative boundary decreases with decreasing effective temperature, both (1) the incidence rate of the peculiar periodogram feature and (2) the amplitude of the broad peaks will decrease in stars with lower .
At this point, our hypothesis has not been fully developed and has several aspects that are not constrained. For instance, it may be the case that it is the layers closer to the surface that are undergoing differential rotation while the sub-surface structures are rotating rigidly, rather than the other way around. It is also possible that, assuming that the broadening is produced by differential rotation and not by short structure lifetimes, the differential rotation is radial rather than latitudinal. One important question that has yet to be answered is to what depth we should expect the hypothesized sub-surface structures to be visible. This requires a number of assumptions regarding the nature of the structures themselves. Specifically, it is unknown how the brightness of each structure might vary relative to the surrounding material or how far they might extend – both horizontally and radially.
3 Incidence of the Peculiar Periodogram Features
Balona (2013) identified 129 MS A-type stars which exhibit the peculiar feature in the periodograms calculated from their Kepler light curves. Using the Kepler Input Catalogue (Brown et al., 2011), it was concluded that the occurence of the feature did not correlate with any of the stars’ derived fundamental parameters. In particular, no significant trend was found in relation to their effective temperatures. Although these findings are inconsistent with the first prediction discussed in Section 2, it is possible that the predicted changes in sub-surface convection zones in stars with are subtle and require larger sample sizes to be discerned. Moreover, since Balona (2013) published their results, additional Kepler data has been made available, which may allow for previously unidentified peculiar periodogram features to be found within the sample of MS A-type stars.
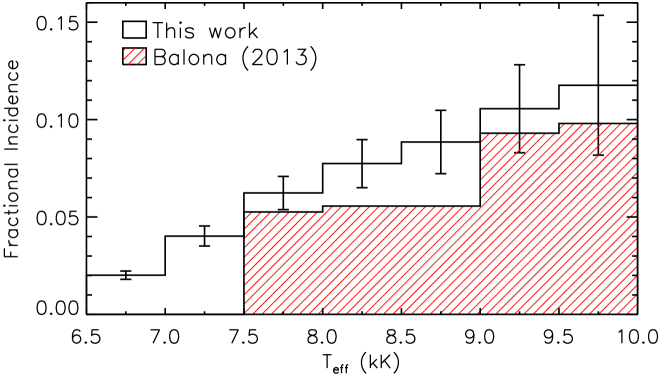
We endeavoured to carry out an expanded analysis of the Kepler light curves associated with the observed MS A-type stars in order to confirm whether any correlations in the incidence rate of the peculiar periodogram feature with (and other parameters) could be found. We extended the effective temperature range used by Balona (2013) to , thereby including cooler stars, which resulted in a total sample size of 8,377 stars – an increase of more than 6,000 stars from the original sample. In order to analyze this much larger sample, we opted to employ a convolution neural network (CNN). These machine learning algorithms have been applied to a wide range of signal-processing problems in which specific features in time-series data need to be efficiently and accurately classified (e.g. George & Huerta, 2017). We generated simulated periodograms containing isolated sharp peaks, isolated broad peaks, and combined sharp and broad peaks characteristic of the peculiar periodogram features (Fig. 1). This data set was then used to train our CNN to classify each of these features with an accuracy ; the Kepler periodograms associated with the F- and A-type stars were then applied to the trained CNN. The resulting incidence rate of these features as a function of is shown in Fig. 2.
4 Conclusions
Based on our preliminary findings, it is evident that the peculiar periodogram features first identified by Balona (2013) do appear more frequently in early A-type MS stars () compared to cooler mid F-type stars (). This is broadly consistent with the hypothesis that the features are associated with sub-surface convection zones, which tend to increase in depth with decreasing effective temperature; however, a more comprehensive comparison with the predictions of stellar structure models needs to be carried out.
References
- Aurière et al. (2007) Aurière, M., et al., Weak magnetic fields in Ap/Bp stars, A&A 475, 1053 (2007)
- Balona (2011) Balona, L. A., Rotational light variations in Kepler observations of A-type stars, MNRAS 415, 2, 1691 (2011)
- Balona (2013) Balona, L. A., Activity in A-type stars, MNRAS 431, 3, 2240 (2013)
- Balona (2014) Balona, L. A., Variability of Kepler A- and B-type stars Starspots on A-type stars, in G. Mathys, E. Griffin, O. Kochukhov, R. Monier, G. Wahlgren (eds.) Putt. A Stars into Context Evol. Environ. Relat. Stars, 415–424, Pero, Moscow, Russia (2014)
- Blazère et al. (2016) Blazère, A., et al., Detection of ultra-weak magnetic fields in Am stars : Ursae Majoris and Leonis, A&A 586, 1 (2016)
- Böhm et al. (2015) Böhm, T., et al., Discovery of starspots on Vega, A&A 577, A64 (2015), 1411.7789
- Brown et al. (2011) Brown, T. M., Latham, D. W., Everett, M. E., Esquerdo, G. A., Kepler Input Catalog: Photometric calibration and stellar classification, AJ 142, 112 (2011)
- George & Huerta (2017) George, D., Huerta, E. A., Deep Neural Networks to Enable Real-time Multimessenger Astrophysics, ArXiv e-prints (2017), 1701.00008
- Landstreet (2003) Landstreet, J. D., Modelling Observed Velocity Fields in Tepid Star Atmospheres, in N. Piskunov, W. W. Weiss, D. F. Gray (eds.) Modelling of Stellar Atmospheres, IAU Symposium, volume 210, E35 (2003)
- Lignières et al. (2009) Lignières, F., Petit, P., Böhm, T., Aurière, M., First evidence of a magnetic field on Vega, A&A 500, L41 (2009)
- Petit et al. (2011a) Petit, P., et al., Detection of a weak surface magnetic field on Sirius A: are all tepid stars magnetic ?, A&A 532, 1 (2011a)
- Petit et al. (2011b) Petit, P., et al., Weak magnetic fields of intermediate-mass stars, Astron. Nachrichten 332, 943 (2011b)
- Wolff (1968) Wolff, S. C., The Incidence of Ap Stars, PASP 80, 281 (1968)