The glass transition of soft colloids
Abstract
We explore the glassy dynamics of soft colloids using microgels and charged particles interacting by steric and screened Coulomb interactions, respectively. In the supercooled regime, the structural relaxation time of both systems grows steeply with volume fraction, reminiscent of the behavior of colloidal hard spheres. Computer simulations confirm that the growth of on approaching the glass transition is independent of particle softness. By contrast, softness becomes relevant at very large packing fractions when the system falls out of equilibrium. In this non-equilibrium regime, depends surprisingly weakly on packing fraction and time correlation functions exhibit a compressed exponential decay consistent with stress-driven relaxation. The transition to this novel regime coincides with the onset of an anomalous decrease of local order with increasing density typical of ultrasoft systems. We propose that these peculiar dynamics results from the combination of the non-equilibrium aging dynamics expected in the glassy state and the tendency of colloids interacting through soft potentials to refluidize at high packing fractions.
The dramatic slowing down of the structural relaxation time upon modest variations of a control parameter is a general phenomenon observed in a wide range of glass-formers, ranging from molecular systems Debenedetti and Stillinger (2001); Berthier and Biroli (2011), to soft matter Hunter and Weeks (2012) and biological systems Angelini et al. (2011). For colloidal systems, the relevant control parameters are the particle volume fraction and the strength of the interparticle interactions. Because hard sphere interactions are central to theoretical and computational studies that capture the essence of the glass transition Berthier and Biroli (2011), hard sphere colloidal systems have been extensively investigated Hunter and Weeks (2012).
The glass transition of hard sphere systems is well documented. With increasing , positional correlations develop, reflected by the appearance of a diffraction peak in the static structure factor at a wavevector corresponding to the typical interparticle distance. Both and monotonically increase with , whereas the structural relaxation time measured, e.g., in scattering experiments increases by several orders of magnitude. The initial growth can be described as a power law divergence, Pusey and Van Megen (1986); van Megen et al. (1991), consistent with mode-coupling theory Bengtzelius et al. (1984). The data at deep supercooling are better fitted to an exponential divergence, , where typically Brambilla et al. (2009). This exponential growth bears some (formal Berthier and Witten (2009)) resemblance with the fragile behaviour of molecular glass-formers Mattsson et al. (2009). Compressing hard spheres further, the system enters a non-equilibrium aging regime, where the relaxation time increases rapidly with the age of the material El Masri et al. (2009), until it becomes so large that no relaxation is measurable on accessible time scales.
The focus recently shifted from hard colloids to a large variety of soft colloidal particles, such as emulsions, microgel suspensions or biological systems, in view of their interest for both fundamental science and applications Yunker et al. (2014). Soft colloids can overlap and deform and may thus be compressed up to packing fractions that cannot be explored with hard particles. Two striking signatures of particle softness were reported. First, softness results in an anomalous non-monotonic evolution of with , which initially increases as in hard spheres, but then decreases at larger Zhang et al. (2009); Graves et al. (2005); Caswell et al. (2013); Paloli et al. (2013); Seekell et al. (2015), as a result of a competition between entropy and energy Jacquin and Berthier (2010). Theory suggests that this loss of local order at large is accompanied by a reentrant glass transition and a complete suppression of aging Berthier et al. (2010), reported in Ref. Srivastava et al. (2013). Second, it was argued Senff and Richtering (1999a); Mattsson et al. (2009); Seekell et al. (2015); Gupta et al. (2015); Nigro et al. (2017) that softness changes the nature of the glassy dynamics. In particular, a very gradual increase of the relaxation time of the form was reported Mattsson et al. (2009); Nigro et al. (2017); Yang and Schweizer (2010), in stark contrast with hard sphere behaviour and other studies of soft particles Berthier and Witten (2009); Xu et al. (2009); Vagberg et al. (2011); Pellet and Cloitre (2016); Li et al. (2017). These conflicting reports show the lack of consensus about how softness impacts the dynamical slowing down with density, and how structural and dynamical anomalies relate to each other.
In this work, we provide a coherent picture of the behaviour of colloidal particles interacting via a soft, repulsive potential, by determining experimentally the -dependent structural, dynamical and rheological properties of soft colloids. We support our results using a simple numerical model of soft particles, where the magnitude of soft repulsion can be easily tuned over a very broad range and its impact on the equilibrium glassy dynamics analysed carefully. Previous experiments predominantly focused on microgel particles Senff and Richtering (1999a); Mattsson et al. (2009); Zhang et al. (2009); Nigro et al. (2017); Li et al. (2017); van der Scheer et al. (2017) formed by permanently crosslinked polymer chains. While microgels are a convenient experimental realization of soft particles Yunker et al. (2014), their polymeric nature introduces additional degrees of freedom and complexity, making data interpretation difficult: whether microgels deform Seth et al. (2011); Mattsson et al. (2009) or interpenetrate Mohanty et al. (2017) at high volume fraction is still a debated issue, as is the role of entanglements and chain relaxation in the observed dynamics Li et al. (2017). In our work, we overcome these difficulties by systematically comparing the behavior of microgels to that of compact silica particles interacting via a soft potential, for which no polymeric degrees of freedom are present. This allows us to disentangle unambiguously the role of particle softness from any other effect. The microgels are poly(N-isopropylacrylamide) (PNiPAM) microgels synthesized as in Senff and Richtering (1999), which we produce in two batches with hydrodynamic diameter of respectively nm and nm at temperature K. The silica particles are Ludox-TM 50 (Sigma-Aldrich), with nm, see Sup for details on the samples and their preparation. Silica particles are compact, hard and undeformable, but they interact through a soft repulsive Yukawa potential, due to their surface charge. The static structure factor of the suspensions is obtained either by static light scattering (SLS, for the microgels) or by small-angle X ray scattering (SAXS, for the silica particles), where is the scattering vector, with (resp., the wavelength of the incident laser (resp., X-ray) radiation, the solvent refractive index and the scattering angle. The macroscopic flow properties are measured by rheology, using a stress-controlled rheometer Sup . The microscopic dynamics are probed by dynamic light scattering (DLS Berne and Pecora (1976)), using a commercial apparatus for diluted samples and custom setups El Masri et al. (2005); Philippe et al. (2016) with a CMOS detector for concentrated suspensions. Most of the DLS data are collected at (), but we also perform experiments at (). DLS experiments yield the two-time intensity autocorrelation function describing the relaxation of density fluctuations of wavevector , as a function of sample age and delay time Sup . The intensity correlation function is related to the intermediate scattering function by . We use molecular dynamics to simulate soft repulsive particles interacting via a harmonic potential, as detailed in Ref. Berthier and Witten (2009). The harmonic potential is a good model for soft microgels Chen et al. (2010). The model neglects polymeric degrees of freedom. Its physics is controlled by the particle softness, which can be tuned at will, and which is expressed by the ratio between the elastic energy scale, , and thermal fluctuations, . The system behaves as nearly hard spheres when , whereas soft microgels typically have Chen et al. (2010); Ikeda et al. (2013). Simulations are used to understand the impact of particle softness on the equilibrium glassy dynamics, and we do not explore the aging regime numerically.
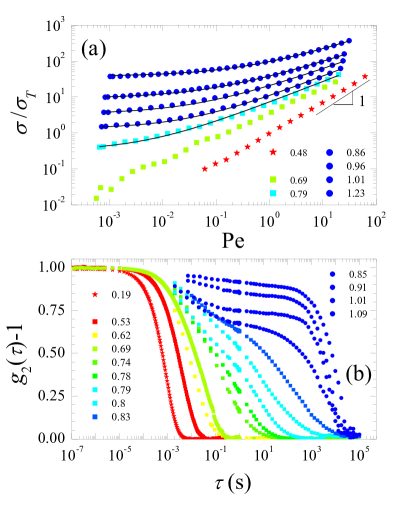
Selected examples of the -dependent flow curves are shown in Fig. 1(a), where shear stress is normalized by the entropic stress of dense Brownian suspensions, , and the shear rate is normalized by the Brownian diffusion rate, which results in the Péclet number, ; is the Boltzmann constant. Newtonian behaviour, , is observed at low . With increasing we start to observe shear-thinning, and for we find that the flow curves are well-fitted by the Herschel-Bulkley law Bonn et al. (2017), . This signals the emergence of a finite yield stress and thus marks a transition from a fluid to an amorphous solid Bonn et al. (2017); Petekidis et al. (2004). Near the transition, we find , as observed for Brownian hard spheres Petekidis et al. (2004). This is a first indication that the glass transition of microgels is driven by entropy, as for hard spheres, rather than by particle elasticity Ikeda et al. (2012, 2013). The flow curves for silica particles exhibit a similar behavior Sup , except that a measurable yield stress emerges at much lower volume fraction, , confirming the key role played by long-range repulsion.
The evolution of the microscopic dynamics across the transition to solid-like behavior is shown in Fig. 1(b), where we display the data obtained for the PNiPAM samples. The correlation functions exhibit distinct characteristics, which suggest the existence of three regimes. In regime I, corresponding to , the dynamics are fast and decays exponentially, with a decay time close to , the relaxation time in the dilute limit. In regime II, , the dynamics slow down dramatically with increasing . The relaxation time obtained from a stretched exponential fit to the final decay of the correlation function, , increases by 7 orders of magnitude (Fig. 2(a)). Concurrently, the shape of becomes stretched, , as shown in Fig. 2(c). The emergence of a yield stress near is accompanied by the onset of caging, as signaled by the intermediate-time plateau in . Regime III is entered at higher packing fractions, where the decay of the correlation functions becomes much steeper, as shown by the rapid growth of up to values , see Figs. 2(c, d). While the plateau height keeps increasing with (Fig. 1(b)), indicating a tighter particle caging, the final relaxation time is weakly sensitive to , in stark contrast with regime II, see Fig. 2(a). A similar saturation of the relaxation time at very high has been reported very recently in PNiPAM-grafted polystyrene particles Li et al. (2017), and was attributed to the relaxation of the polymer shell. Crucially, we find that the same behaviour is observed for the Ludox suspensions Sup , see Figs. 2(b, d). This rules out the polymeric nature of PNiPAM as an explanation and suggests that the scenario emerging from Fig. 1 is instead a more general feature of soft colloidal particles. Remarkably, our data in regime II do not display the gradual (or ‘strong’) increase of reported in Ref. Mattsson et al. (2009) for microgels, but a very steep (or ‘fragile’) increase.
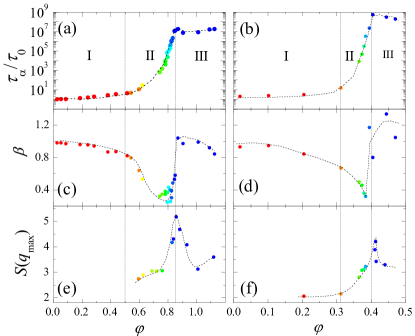
The transition between regimes II and III is characterized by the saturation of and by a marked minimum of the stretching exponent , which first decreases to but then steeply increases to , indicative of compressed exponential relaxation. Remarkably, the sharp dynamic crossover between regimes II and III is reflected in the static structure factor. The magnitude of the peak of the structure factor, , evolves non-monotonically with ; it exhibits a maximum close to the transition between the two regimes, see Figs. 2(e, f). The decrease of at large is a distinctive feature of ultrasoft potentials Graves et al. (2005); Zhang et al. (2009). It is ascribed to the entropy gained by the exploration of a large number of disordered configurations whose energy cost remains modest due to the soft particle interaction Jacquin and Berthier (2010). This anomalous structural evolution suggests that the dynamical hallmarks in regime III are specific to soft colloids, in contrast to those of regime II, which are not.
This expectation is quantitatively confirmed in Fig. 3 which gathers for several systems. To compare different materials, we follow the glass literature Berthier and Biroli (2011) and rescale by , a ‘glass transition’ volume fraction arbitrarily defined by , which corresponds to s for our systems. We also display numerical data for soft harmonic particles with softness varying over more than two orders of magnitude, and literature data from experiments on colloidal hard spheres Brambilla et al. (2009). We find that the sharp increase of the relaxation time in the equilibrium regime II is unaffected by particle softness, by the interaction type, by internal degrees of freedom, or by particle deformability. All data collapse onto a master curve, which is well described by the same steep exponential divergence describing the hard sphere behavior Brambilla et al. (2009). Other fragile functional forms have been tested, yielding similar results Sup . This behavior is also robust with respect to the probed lengthscale, since data collected at various fall onto the same mastercurve. This universal behavior is in stark contrast with the central finding of Ref. Mattsson et al. (2009). Our PNiPAM microgels are slightly softer Sup than the softest particles of Mattsson et al. (2009); thus, the discrepancy can not be attributed to particle softness itself. Rather, we attribute it to osmotic deswelling, which is specific to charged microgels such as those of Mattsson et al. (2009). Recent work Pelaez-Fernandez et al. (2015); van der Scheer et al. (2017) indicates that charged microgels significantly deswell as their concentration is increased, due to the decrease in the osmotic contribution of the counterions to particle swelling. Owing to deswelling, both the particle size and the interparticle interactions change with , resulting in the observed ‘strong’ behaviour. Altogether, the idea that softness alone affects the nature of the growth of in the equilibrated supercooled regime needs drastic revision.
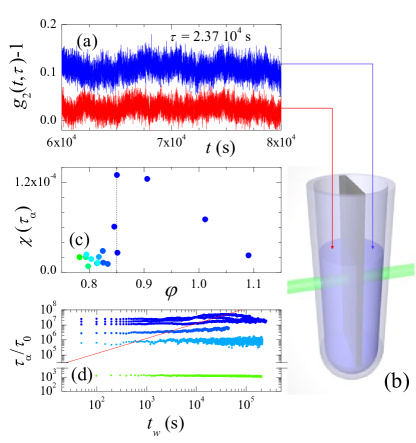
While regime II is generic to all colloids (hard and soft), the behaviour in regime III is instead specific to very soft colloids; it is not observed for hard spheres. An explanation for the mild dependence of in regime III could be that measurements are limited by setup instabilities. To rule this out we performed several tests Sup , including the simultaneous measurement of the dynamics of the same system placed in two independent chambers, as shown in Fig. 4(b) Duri et al. (2009); Cipelletti et al. (2013). The fluctuations in observed for the two chambers are not correlated, see Fig. 4(a). Therefore, the observed dynamical fluctuations do not result from instabilities of the experimental setup, but occur spontaneously within the sample itself.
The dynamical behaviour in regime III is clearly not the smooth continuation of the equilibrium regime II. Our experiments suggest that the system is in fact out of equilibrium and displays aging behaviour. In Fig. 4(d), we show the age dependence of for representative concentrated PNiPAM samples. At , in regime II, is age-independent, as expected for equilibrium dynamics. At higher , in regime III, the relaxation time fluctuates erratically and increases, albeit very slowly, suggesting lack of full equilibration. Note that for all samples we access the regime (see red line in Fig. 4(d)), which insures that the experiments lasted long enough for the measured relaxation time not to be limited by the aging time itself.
The interpretation of regime III as an aging regime is further confirmed by the appearance of a compressed exponential decay of time correlation functions (), and by the significant temporal fluctuations of the dynamics observed experimentally in regime III (see Fig. 4(a)). These are typical signatures found in non-equilibrium, glassy soft matter, which result from an intermittent release of internal stresses Cipelletti et al. (2003); Madsen et al. (2010). These events are known to trigger long-ranged dynamical heterogeneities Duri et al. (2009); Maccarrone et al. (2010); Lieleg et al. (2011); Duri and Cipelletti (2006). We have indeed detected a sharp increase of dynamical heterogeneity at the transition between regimes II and III. This is shown in Fig. 4(c), which reports the evolution of the dynamical susceptibility Duri et al. (2005); Berthier et al. (2011). An analogous non-monotonic behavior of the dynamic susceptibility was reported previously for similar concentrated PNiPAM suspensions Rahmani et al. (2012).
A key difference between the aging of hard and soft particles is the very mild increase of the relaxation time with both sample age and packing fraction in Figs. 3 and 4(d). By contrast, spontaneous relaxation cannot be observed in hard sphere glasses. We believe that the difference stems from the observed structural evolution of soft systems, which display a weakening of local order, as revealed by the sharp decrease of at large . In glassy systems, increasing the structural disorder typically accelerates the dynamics Berthier et al. (2010), which indeed appears to be faster in soft spheres than it is in hard spheres, for which keeps increasing with in the glass phase.
Our work shows that the glassy dynamics of soft colloids is markedly different from what has been assumed so far. Regardless of their softness, colloids exhibit in the supercooled regime a sharp increase of the equilibrium relaxation time similar to that of hard colloids. But in contrast to hard spheres, at larger density soft colloids enter a peculiar aging regime characterized by intermittent release of internal stress and with a mild aging of the structural relaxation time, due to particle softness. Our work provides a coherent picture of the glass transition of colloidal particles interacting via a soft potential. The strong similarities between the dynamics of charged compact particles and microgels suggests that the behavior uncovered by our experiments is quite general and insensitive to the details of the interaction potential. The comparison with previous findings for polymer-based systems and charged microgels Vlassopoulos et al. (2001); Pelaez-Fernandez et al. (2015); van der Scheer et al. (2017) indicates that it is not softness per se but other mechanisms, such as osmotic deswelling and polymeric degrees of freedom, which are likely responsible for the ‘strong’-like behavior reported earlier for some of these systems.
Acknowledgements.
We thank A. Fernandez-Nieves and J. Mattsson for useful discussions. The research leading to these results has received funding from CNES, the Swiss National Science Foundation (200020_130056), the European Research Council under the European Union’s Seventh Framework Programme (FP7/2007-2013)/ERC Grant Agreement No. 306845, and was supported by a grant from the Simons Foundation (# 454933, Ludovic Berthier)References
- Debenedetti and Stillinger (2001) P. G. Debenedetti and F. H. Stillinger, Nature 410, 259 (2001).
- Berthier and Biroli (2011) L. Berthier and G. Biroli, Rev. Mod. Phys. 83, 587 (2011).
- Hunter and Weeks (2012) G. L. Hunter and E. R. Weeks, Rep. Prog. Phys. 75, 066501 (2012).
- Angelini et al. (2011) T. E. Angelini, E. Hannezo, X. Trepat, M. Marquez, J. J. Fredberg, and D. A. Weitz, Proc. Natl. Acad. Sci. U. S. A. 108, 4714 (2011).
- Pusey and Van Megen (1986) P. Pusey and W. Van Megen, Nature 320, 340 (1986).
- van Megen et al. (1991) W. van Megen, S. M. Underwood, and P. N. Pusey, Phys. Rev. Lett. 67, 1586 (1991).
- Bengtzelius et al. (1984) U. Bengtzelius, W. Götze, and A. Sjolander, Journal of Physics C: Solid State Physics 17, 5915 (1984).
- Brambilla et al. (2009) G. Brambilla, D. El Masri, M. Pierno, L. Berthier, L. Cipelletti, G. Petekidis, and A. B. Schofield, Phys. Rev. Lett. 102, 085703 (2009).
- Berthier and Witten (2009) L. Berthier and T. A. Witten, Phys. Rev. E 80, 021502 (2009).
- Mattsson et al. (2009) J. Mattsson, H. M. Wyss, A. Fernandez-Nieves, K. Miyazaki, Z. Hu, D. R. Reichman, and D. A. Weitz, Nature 462, 83 (2009).
- El Masri et al. (2009) D. El Masri, G. Brambilla, M. Pierno, G. Petekidis, A. B. Schofield, L. Berthier, and L. Cipelletti, Journal of statistical mechanics: theory and experiment 2009, P07015 (2009).
- Yunker et al. (2014) P. J. Yunker, K. Chen, M. D. Gratale, L. M. A., T. Still, and A. G. Yodh, Rep. Prog. Phys. 77, 056601 (2014).
- Zhang et al. (2009) Z. Zhang, N. Xu, D. T. N. Chen, P. Yunker, A. M. Alsayed, K. B. Aptowicz, P. Habdas, A. J. Liu, N. S. R., and A. G. Yodh, Nature 459, 230 (2009).
- Graves et al. (2005) S. Graves, K. Meleson, J. Wilking, M. Y. Lin, and T. G. Mason, J. Chem. Phys. 122, 134703 (2005).
- Caswell et al. (2013) T. A. Caswell, Z. Zhang, M. L. Gardel, and S. R. Nagel, Phys. Rev. E 87, 012303 (2013).
- Paloli et al. (2013) D. Paloli, P. S. Mohanty, J. J. Crassous, E. Zaccarelli, and P. Schurtenberger, Soft Matter 9, 3000 (2013).
- Seekell et al. (2015) R. P. Seekell, III, P. S. Sarangapani, Z. Zhang, and Y. Zhu, Soft Matter 11, 5485 (2015).
- Jacquin and Berthier (2010) H. Jacquin and L. Berthier, Soft Matter 6, 2970 (2010).
- Berthier et al. (2010) L. Berthier, A. J. Moreno, and G. Szamel, Phys. Rev. E 82, 060501(R) (2010).
- Srivastava et al. (2013) S. Srivastava, L. A. Archer, and S. Narayanan, Phys. Rev. Lett. 110, 148302 (2013).
- Senff and Richtering (1999a) H. Senff and W. Richtering, The Journal of chemical physics 111, 1705 (1999a).
- Gupta et al. (2015) S. Gupta, J. Stellbrink, E. Zaccarelli, C. N. Likos, M. Camargo, P. Holmqvist, J. Allgaier, L. Willner, and D. Richter, Physical Review Letters 115, 128302 (2015).
- Nigro et al. (2017) V. Nigro, R. Angelini, M. Bertoldo, F. Bruni, M. A. Ricci, and B. Ruzicka, Soft Matter 13, 5185–5193 (2017).
- Yang and Schweizer (2010) J. Yang and K. S. Schweizer, EPL 90, 66001 (2010).
- Xu et al. (2009) N. Xu, T. K. Haxton, A. J. Liu, and S. R. Nagel, Phys. Rev. Lett. 103, 245701 (2009).
- Vagberg et al. (2011) D. Vagberg, P. Olsson, and S. Teitel, Phys. Rev. E 83, 031307 (2011).
- Pellet and Cloitre (2016) C. Pellet and M. Cloitre, Soft Matter 12, 3710 (2016).
- Li et al. (2017) Q. Li, X. Peng, and G. B. McKenna, Soft Matter 13, 1396 (2017).
- van der Scheer et al. (2017) P. van der Scheer, T. van de Laar, J. van der Gucht, D. Vlassopoulos, and J. Sprakel, ACS Nano 11, 6755 (2017).
- Seth et al. (2011) J. R. Seth, L. Mohan, C. Locatelli-Champagne, M. Cloitre, and R. T. Bonnecaze, Nat Mater 10, 838 (2011).
- Mohanty et al. (2017) P. S. Mohanty, S. Nöjd, K. van Gruijthuijsen, J. J. Crassous, M. Obiols-Rabasa, R. Schweins, A. Stradner, and P. Schurtenberger, Scientific Reports 7 (2017), 10.1038/s41598-017-01471-3.
- Senff and Richtering (1999b) H. Senff and W. Richtering, J. Chem. Phys. 111, 1705 (1999b).
- (33) Supplementary Material: Details of sample preparation and characterization, static structure factors, rheology and dynamics of the Ludox samples.
- Berne and Pecora (1976) B. J. Berne and R. Pecora, Dynamic Light Scattering (Wiley, New York, 1976).
- El Masri et al. (2005) D. El Masri, M. Pierno, L. Berthier, and L. Cipelletti, J. Phys.: Condens. Matter 17, S3543 (2005).
- Philippe et al. (2016) A. Philippe, S. Aime, V. Roger, R. Jelinek, G. Prévot, L. Berthier, and L. Cipelletti, J. Phys.: Condens. Matter 28, 075201 (2016).
- Chen et al. (2010) K. Chen, W. G. Ellenbroek, Z. Zhang, D. T. N. Chen, P. J. Yunker, S. Henkes, C. Brito, O. Dauchot, W. van Saarloos, A. J. Liu, and A. G. Yodh, Physical Review Letters 105, 025501 (2010).
- Ikeda et al. (2013) A. Ikeda, L. Berthier, and P. Sollich, Soft Matter 9, 7669 (2013).
- Bonn et al. (2017) D. Bonn, M. M. Denn, L. Berthier, T. Divoux, and S. Manneville, Reviews of Modern Physics 89 (2017), 10.1103/RevModPhys.89.035005.
- Petekidis et al. (2004) G. Petekidis, D. Vlassopoulos, and P. N. Pusey, J. Phys.: Condens. Matter 16, S3955 (2004).
- Ikeda et al. (2012) A. Ikeda, L. Berthier, and P. Sollich, Phys. Rev. Lett. 109, 018301 (2012).
- Pelaez-Fernandez et al. (2015) M. Pelaez-Fernandez, A. Souslov, L. A. Lyon, P. M. Goldbart, and A. Fernandez-Nieves, Physical Review Letters 114, 098303 (2015), 10.1103/PhysRevLett.114.098303.
- Duri et al. (2009) A. Duri, D. A. Sessoms, V. Trappe, and L. Cipelletti, Phys. Rev. Lett. 102, 085702 (2009).
- Cipelletti et al. (2013) L. Cipelletti, G. Brambilla, S. Maccarrone, and S. Caroff, Optics Express 21, 22353 (2013).
- Cipelletti et al. (2003) L. Cipelletti, L. Ramos, S. Manley, E. Pitard, D. A. Weitz, E. E. Pashkovski, and M. Johansson, Faraday Discuss. 123, 237 (2003).
- Madsen et al. (2010) A. Madsen, R. L. Leheny, H. Guo, M. Sprung, and O. Czakkel, New Journal of Physics 12, 055001 (2010).
- Maccarrone et al. (2010) S. Maccarrone, G. Brambilla, O. Pravaz, A. Duri, M. Ciccotti, J. M. Fromental, E. Pashkovski, A. Lips, D. Sessoms, V. Trappe, and L. Cipelletti, Soft Matter 6, 5514 (2010).
- Lieleg et al. (2011) O. Lieleg, J. Kayser, G. Brambilla, L. Cipelletti, and A. R. Bausch, Nature Mat. 10, 236 (2011).
- Duri and Cipelletti (2006) A. Duri and L. Cipelletti, Europhys. Lett. 76, 972 (2006).
- Duri et al. (2005) A. Duri, H. Bissig, V. Trappe, and L. Cipelletti, Phys. Rev. E 72, 051401 (2005).
- Berthier et al. (2011) L. Berthier, G. Biroli, J.-P. Bouchaud, C. L., and van Saarloos W., Dynamical Heterogeneities in Glasses, Colloids and Granular Media (Oxford University Press, 2011).
- Rahmani et al. (2012) Y. Rahmani, K. van der Vaart, B. van Dam, Z. Hu, V. Chikkadi, and P. Schall, Soft Matter 8, 4264 (2012).
- Vlassopoulos et al. (2001) D. Vlassopoulos, G. Fytas, T. Pakula, and J. Roovers, J. Phys.: Condens. Matter 13, R855 (2001).
Supplemental Material
I Particle size
Two distinct batches of Poly-N-isopropylacrylamide (PNiPAM) microgels were synthesized by emulsion polymerization according to the protocol described in Senff and Richtering (1999) and were suspended in a mM aqueous solution, to prevent bacterial growth. PNiPAM microgels exhibit a lower critical solution temperature (LCST) close to room temperature, which results in a temperature-dependent size of the particles. We characterized the -dependent size of our microgels by measuring their hydrodynamic diameter with conventional dynamic light scattering (DLS) Berne and Pecora (1976), using a goniometer equipped with a Brookhaven correlator (BI-9000 AT) and working at very high dilution (w/w concentration ). Most experiments reported in the main text were performed with batch 1, for which the hydrodynamic diameter ranges from at to at . The data at shown in Fig. 3 of the main text were collected using batch 2, for which at and at .
The silica particles are Ludox TM-50 by Sigma-Aldrich, suspended in salt-free Milli-Q water. Their size was measured by DLS in the very dilute limit ( w/w), finding nm.
II Sample volume fraction
The quoted volume fraction of the microgel suspensions has been obtained from their mass fraction (known from the synthesis) using , where at K is determined by fitting the zero-shear viscosity of diluted suspensions to Einstein’s law, , with the viscosity of the solvent Truzzolillo et al. (2015). In the experiments, the volume fraction is varied either by changing or by varying and hence the particle size Senff and Richtering (1999). Temperature is always kept in the range , well below the LCST, thus avoiding the onset of attractive interactions and the sharp change of electrophoretic mobility reported for PNiPAM microgels at high Daly and Saunders (2000).
For the silica particles, is controlled by varying and is calculated from , where g/ml is the density of water at and g/ml that of the particles. is measured by drying an aliquot of the sample.
III Debye length of the Ludox suspensions
The screening length characterizing Ludox suspensions in absence of added salt is a function of the particle concentration and can be calculated by imposing that each ionized group on the particle surface releases one Na+ counterion. We calculate the number of ionized groups per particles by measuring their -potential at very low concentration (). We obtain mV. The measured -potential is the value of the electrostatic potential at the slipping plane, which is at a distance from the particle surface. can be related to the surface potential , i.e. the electrostatic potential at distance from the center of the colloid, via the Gouy-Chapman model Hunter (1988); Sennato et al. (2012) as
| (1) |
where is the Boltzmann constant, is the absolute temperature, the elementary charge, F/m is the dielectric permittivity of water, and is the Debye length that takes into account the counterions released by each particle in a suspension at particle volume fraction . By imposing that the electrostatic potential at the particle surface is and knowing that nm nm Kobayashi and Sasaki (2014) we calculate numerically the valence of each particle and hence the Debye length as a function of . In the range of volume fraction investigated here, we obtain nm nm. It’s worth noting that for volume fractions ranging from (lower bound of Regime II) up to (maximum volume fraction investigated in regime III) the Debye length varies only marginally, from nm up to nm. Therefore, the interaction potential is almost independent of in the range of volume fractions over which the dynamics change the most.
IV PniPam microgel softness
We follow the method of Sierra-Martin et al. (2011) and obtain the compression modulus of our PNiPAM particles by measuring the variation of the particle size upon applying an external osmotic pressure, which is imposed by adding polyethylene glycol (PEG) with molecular weight kDa. We measure the PNiPAM size using dynamic light scattering for increasing concentrations of polymer. To extract the microgel size from the DLS data, we use the viscosity of the PEG35k solutions as measured by standard rheometry (for ) or using an Anton Paar Lovis 2000 ME microviscosimeter (at lower ). The osmotic pressure has been measured with a cryo-osmometer (Gonotec - Osmomat 3000) for Pa. For lower pressures, i.e. low polymer concentrations, we obtain from static light scattering (SLS) measurements. The isothermal compressibility of a PEG solution, , is related to the low- limit of the intensity scattered by the polymer solution by Danner and High (1993)
| (2) |
where is the laser wavelength, the solution refractive index, a setup-dependent constant, and the distance between two monomer units. Note that in the range of -vectors accessible by our setup we easily probe the regime. The dependence of on polymer concentration was fitted by a quadratic polynomial. The fitting function was then integrated, yielding the -dependent osmotic pressure , up to the multiplicative constant . was determined by matching the osmotic pressure determined from SLS data to that obtained by cryo-osmometry, in the range of where both techniques are available.
![[Uncaptioned image]](/html/1712.02634/assets/x5.png)
Fig. SM-1: Osmotic pressure as a function of the relative variation of the microgel volume, . Black points refer to the microgels used in this work, red triangles are data for the softest microgels of Ref. Mattsson et al. (2009).
Figure SM-1 shows that, within the experimental uncertainty, our data closely match those reported by Mattsson et al. Mattsson et al. (2009) for their softest microgels. We calculate the compression modulus of our PNiPAM microgels by performing a linear fit of the data at low pressure ( Pa, dashed line in Fig. SM-1), obtaining kPa. Alternatively, we fit the data over the full range of available using a parabolic function (solid line), , obtaining kPa. We conclude that the compression modulus of our microgels is of the order of 10-15 kPa, indicating that our PNiPAM microgels are somehow softer than the softest particles of Ref. Mattsson et al. (2009), for which kPa.
V Stability of the DLS setup
We successfully established the apparatus stability by using a fully frozen sample. We use a frosted glass, for which unavoidable mechanical instabilities eventually lead to a spurious relaxation of , but only on very long time scales , more than a factor of 3.75 (resp., times) longer than the longest relaxation time measured for the silica (resp. the PNiPAM) particles. In addition, by collecting the scattered light in an imaging geometry Duri et al. (2009); Cipelletti et al. (2013), we are able to detect a potential drift of the sample that could also spuriously accelerate the dynamics, as recently argued by Gabriel and coworkers Gabriel et al. (2015). We find no measurable drift, confirming the setup stability.
VI Rheology
The flow curves for all samples in the regimes II and III were obtained by performing steady rate rheology experiments, using a stress-controlled AR 2000 rheometer (TA Instruments), equipped with a steel cone-and-plate geometry (cone diameter = 25 mm, cone angle = 0.1 rad). For the samples in the regime I a bigger cone (cone diameter = 50 mm, cone angle = 0.0198 rad) has been used.
VII Static structure factor
Figure SM-2 shows representative static structure factors measured for PNiPAM (a) and Ludox (b) suspensions, at various . Note that the height of the first maximum of initially increases with , but eventually decreases upon increasing volume fraction, as discussed in the main text. The height of the peak, , reported in Fig. 2e-f) of the main text is obtained from a Lorentzian fit (lines in Fig. SM-2).
![[Uncaptioned image]](/html/1712.02634/assets/x6.png)
Fig. SM-2: Representative static structure factors for PNiPAM (a) and Ludox (b) suspensions. Lines are Lorentzian fits to the peak of .
VIII Additional data for Ludox suspensions
VIII.1 Rheology and dynamic light scattering
Analogously to what has been reported in Figure 1 of the main text for the PNiPAM microgels, we show below in Fig. SM-3 the flow curves and the intensity correlation functions of suspensions of Ludox particles at representative volume fraction .
![[Uncaptioned image]](/html/1712.02634/assets/x7.png)
Fig. SM-3: Selected flow curves for Ludox suspensions. Curves are labelled by the volume fraction; the lines are Herschel-Bulkley fits. b): Representative correlation functions for Ludox suspensions. In both panels, star, square and circle symbols correspond to concentration regimes I, II and III, respectively, as in Fig. 1 of the main text.
VIII.2 Aging
Figure SM-4 shows the age dependence of for representative concentrated Ludox samples. Note the fluctuations of , which indicate that the suspensions are not fully equilibrated.
![[Uncaptioned image]](/html/1712.02634/assets/x8.png)
Fig. SM-4: Age dependence of the dynamics for representative Ludox suspensions. From top to bottom: , , , , . The line shows the function: for all samples, the experiment duration is long enough to access the regime , where the relaxation time is not dictated by the sample age.
![[Uncaptioned image]](/html/1712.02634/assets/x9.png)
Fig. SM-5: Residues of fits with various functional forms to the vs data of Fig. 3 of the main manuscript. Only data in the supercooled regime, Regime II, have been fitted. See text for more details.
IX Fits to the data in the supercooled regime, Regime II
We have tested various fitting functions to model the data of Fig. 3 of the main manuscript in Regime II (supercooled regime). We fit as a function of with the following expressions:
| (3) |
| (4) |
| (5) |
Equation 3 is the mode coupling theory (mct) prediction. Equation 4 with is the usual Vogel-Fulcher-Tammann law Debenedetti and Stillinger (2001). Leaving as a free fitting parameter yields a generalized VFT law, analogous to the Avramov equation proposed for molecular glass formers Hecksher et al. (2008) with the substitution , to account for the apparent divergence of the relaxation time as the colloidal volume fraction approaches a critical packing fraction . Equation 5 is the colloidal counterpart of the functions FF1 and FF2 (for and 2, respectively) proposed in Hecksher et al. (2008), where again we have substituted with . Figure SM-5 shows the residues as a function of . The experimental and simulation relaxation times have been fitted in the range , except for mct, where a smaller fitting range had to be used, . Attempts to extend the mct fitting range led to nonphysical values of the exponent , which mct predicts to be in the range : as reported previously Brambilla et al. (2010), the mct exponent rapidly increases beyond when data at higher volume fractions are included in the fit. As seen in Fig. SM-5, all fits give very close results. We quantify the goodness of the fits by calculating , the reduced chi-squared defined as , with the number of fitted data points and the number of fitting parameters. The reduced chi-squared is shown in Table SM-T1, together with the values of the fitting parameters. All functions have a very similar reduced chi-squared, indicating equal quality fits, with the exception of the mct expression, which has a smaller . However, this is a consequence of the reduced interval over which the mct fit has been performed: when fitting the same set of data points with the other expressions, one recovers essentially the same fit quality. For example, over the reduced range of relaxation times used for the mct fit, one finds for the VFT expression , to be compared to 0.077 for the mct function. In the main manuscript, we choose the VFT expression, since it fits satisfactorily the largest range of data with the smallest number of parameters.
TABLE SM-T1: fitting parameters and reduced chi-squared for various fitting functions, in the supercooled regime (see text for more details). The fitting range is for mct and for all the other functions.
Function
mct
1.01
-0.19
2.71
0.077
VFT
1.10
0.55
-0.48
1 (fixed)
0.127
generalized VFT
1.10
0.61
-0.59
0.94
0.129
FF1
1.13
6.08
-6.52
0.08
0.129
FF2
1.19
0.69
-0.63
0.015
0.129
References
- Senff and Richtering (1999) H. Senff and W. Richtering, J. Chem. Phys. 111, 1705 (1999).
- Berne and Pecora (1976) B. Berne and R. Pecora, Dynamic Light Scattering: With Applications to Chemistry, Biology, and Physics (John Wiley & Sons, Inc., New York, 1976).
- Truzzolillo et al. (2015) D. Truzzolillo, R. V., C. Dupas, S. Mora, and L. Cipelletti, J. Phys.: Condens. Matter 27, 194103 (2015).
- Daly and Saunders (2000) E. Daly and B. R. Saunders, Phys. Chem. Chem. Phys. 2, 3187 (2000).
- Hunter (1988) R. J. Hunter, Zeta Potential in Colloid Science: Principles and Applications (Academic Press, 1988).
- Sennato et al. (2012) S. Sennato, D. Truzzolillo, and F. Bordi, Soft Matter 8, 9384 (2012).
- Kobayashi and Sasaki (2014) M. Kobayashi and A. Sasaki, Colloids. Surf. A Physicochem. Eng. Asp. 440, 74 (2014).
- Sierra-Martin et al. (2011) B. Sierra-Martin, J. A. Frederick, Y. Laporte, G. Markou, J. J. Lietor-Santos, and A. Fernandez-Nieves, Colloid and Polymer Science 289, 721 (2011), ISSN 0303-402X, 1435-1536.
- Danner and High (1993) R. P. Danner and M. S. High, Handbook of Polymer Solution Thermodynamics (American Institute of Chemical Engineers, New York, 1993).
- Mattsson et al. (2009) J. Mattsson, H. Wyss, A. Fernandez-Nieves, K. Miyazaki, Z. Hu, D. R. Reichman, and D. A. Weitz, Nature 462, 83 (2009).
- Duri et al. (2009) A. Duri, D. A. Sessoms, V. Trappe, and L. Cipelletti, Phys. Rev. Lett. 102, 085702 (2009).
- Cipelletti et al. (2013) L. Cipelletti, G. Brambilla, S. Maccarrone, and S. Caroff, Optics Express 21, 22353 (2013).
- Gabriel et al. (2015) J. Gabriel, T. Blochowicz, and B. Stühn, J. Chem. Phys. 142, 104902 (2015).
- Debenedetti and Stillinger (2001) P. G. Debenedetti and F. H. Stillinger, Nature 410, 259 (2001), ISSN 0028-0836.
- Hecksher et al. (2008) T. Hecksher, A. I. Nielsen, N. B. Olsen, and J. C. Dyre, Nature Physics 4, 737 (2008), ISSN 1745-2473, 1745-2481.
- Brambilla et al. (2010) G. Brambilla, D. El Masri, M. Pierno, L. Berthier, and L. Cipelletti, Phys. Rev. Lett. 105, 199605 (2010), ISSN 0031-9007.