Finite-sized rigid spheres in turbulent Taylor-Couette flow: Effect on the overall drag
Abstract
We report on the modification of drag by neutrally buoyant spherical finite-sized particles in highly turbulent Taylor-Couette (TC) flow. These particles are used to disentangle the effects of size, deformability, and volume fraction on the drag, and are contrasted with the drag in bubbly TC flow. From global torque measurements we find that rigid spheres hardly decrease or increase the torque needed to drive the system.
The size of the particles under investigation have a marginal effect on the drag, with smaller diameter particles showing only slightly lower drag. Increasing the particle volume fraction shows a net drag increase, however this increase is much smaller than can be explained by the increase in apparent viscosity due to the particles. The increase in drag for increasing particle volume fraction is corroborated by performing laser Doppler anemometry where we find that the turbulent velocity fluctuations also increase with increasing volume fraction. In contrast with rigid spheres, for bubbles the effective drag reduction also increases with increasing Reynolds number. Bubbles are also much more effective in reducing the overall drag.
keywords:
Taylor-Couette, drag reduction, particles1 Introduction
Flows in nature and industry are generally turbulent, and often these flows carry bubbles, drops, or particles of various shapes, sizes, and densities. Examples include sediment-laden rivers, gas-liquid reactors, volcanic eruptions, plankton in the oceans, pollutants in the atmosphere, and air bubbles in the ocean mixing layer (Toschi & Bodenschatz, 2009). Particle-laden flows may be characterized in terms of particle density , particle diameter , volume fraction , and Reynolds number Re of the flow. When is small (compared to the dissipative length scale ) and low (), the system may be modelled using a point particle approximation with two-way coupling (Elghobashi, 1994; Mazzitelli et al., 2003; Mathai et al., 2016). With recent advances in computing, fully resolved simulations of particle-laden flows have also become feasible. Uhlmann (2008) conducted one of the first numerical simulations of finite-sized rigid spheres in a vertical particle-laden channel flow. They observed a modification of the mean velocity profile and turbulence modulation due to the presence of particles. A number of studies followed, which employed immersed boundary (Peskin, 2002; Cisse et al., 2013), Physalis (Naso & Prosperetti, 2010; Wang et al., 2017), and front-tracking methods (Unverdi & Tryggvason, 1992; Roghair et al., 2011; Tagawa et al., 2013) to treat rigid particles and deformable bubbles, respectively, in channel and pipe flow geometries (Pan & Banerjee, 1996; Lu et al., 2005; Uhlmann, 2008; Dabiri et al., 2013; Kidanemariam et al., 2013; Lashgari et al., 2014; Picano et al., 2015; Costa et al., 2016). Flows with dispersed particles, drops, and bubbles can, under the right conditions, reduce skin friction and result in significant energetic (and therefore financial) savings. In industrial settings this is already achieved using polymeric additives which disrupt the self-sustaining cycle of wall turbulence and dampen the quasi-streamwise vortices (White & Mungal, 2008; Procaccia et al., 2008). Polymeric additives are impractical for maritime applications, and therefore gas bubbles are used with varying success rates (Ceccio, 2010; Murai, 2014). Local measurements in bubbly flows are non-trivial and the key parameters and their optimum values are still unknown. For example, it is impossible to fix the bubble size in experiments and therefore to isolate the effect of bubble size. Various studies hinted that drag reduction can also be achieved using spherical particles (Zhao et al., 2010), also by using very large particles in a turbulent von Kármán flow (Cisse et al., 2015). In this latter study a tremendous decrease in turbulent kinetic energy (TKE) was observed. A similar, but less intense, decrease in TKE was also seen by Bellani et al. (2012) using a very low particle volume fraction. By using solid particles it is possible to isolate the size effect on drag reduction and even though rigid particles are fundamentally different from bubbles, this can give additional insight into the mechanism of bubbly drag reduction. Machicoane & Volk (2016) already showed that the particle dynamics are highly influenced by the diameter of the particle. This might or might not have a direct influence on the global drag of the system and has never been studied. Whether and when solid particles increase or decrease the drag in a flow is yet not fully understood and two lines of thought exist. On one side, it is hypothesized that solid particles decrease the overall drag as they damp turbulent fluctuations (Zhao et al., 2010; Poelma et al., 2007). On the other side, one could expect that solid particles increase drag as they shed vortices, which must be dissipated. In addition, they also increase the apparent viscosity. A common way to quantify this is the so called ‘Einstein relation’ (Einstein (1906):
| (1) |
where is the viscosity of the continuous phase. This compensation is valid for the small values used in this manuscript (Stickel & Powell, 2005). Direct measurements of drag in flows with solid particles are scarce, and the debate on under what condition they either enhance or decrease the friction has not yet been settled. Particles and bubbles may show collective effects (clustering) and experiments have revealed that this has significant influence on the flow properties (Liu & Bankoff, 1993; Kulick et al., 1994; Muste & Patel, 1997; So et al., 2002; Fujiwara et al., 2004; van den Berg et al., 2005, 2007; Shawkat et al., 2008; Calzavarini et al., 2008; Colin et al., 2012; van Gils et al., 2013; Maryami et al., 2014; Mathai et al., 2015; Alméras et al., 2017; Mathai et al., 2018). In general, the Stokes number is used to predict this clustering behaviour, but for neutrally buoyant particles this is found to be insufficient (Bragg et al., 2015; Fiabane et al., 2012). In addition, the position of the particles (or the particles clusters) is likely to have a large influence on the skin friction. In DNS at low Reynolds numbers, Kazerooni et al. (2017) found that the particle distribution is mainly governed by the bulk Reynolds number.
In order to study the effects of particles on turbulence it is convenient to use a closed setup where one can relate global and local quantities directly through rigorous mathematical relations. In this manuscript the Taylor-Couette (TC) geometry (Grossmann et al., 2016)—the flow between two concentric rotating cylinders—is employed as this is a closed setup with global balances. The driving of the Taylor-Couette geometry can be described using the Reynolds number based on the inner cylinder (IC): , where is the azimuthal velocity at the surface of the IC, the angular velocity of the IC, the gap between the cylinders, the kinematic viscosity, and () the radius of the inner(outer) cylinder. The geometry of Taylor-Couette flow is characterized by two parameters: the radius ratio and the aspect ratio , where is the height of the cylinders. The response parameter of the system is the torque, , required to maintain constant rotation speed of the inner cylinder. It was mathematically shown that in Taylor-Couette flow the angular velocity flux defined as , where the subscript denotes averaging over a cylindrical surface and time, is a radially conserved quantity (Eckhardt, Grossmann & Lohse (2007) (EGL)). One can, in analogy to Rayleigh-Bénard convection, normalize this flux and define a Nusselt number based on the flux of the angular velocity:
| (2) |
where is the angular velocity flux for laminar, purely azimuthal flow and is the angular velocity of the outer cylinder. In this spirit the driving is expressed in terms of the Taylor number:
| (3) |
Here is a geometric parameter (“geometric Prandtl number”), in analogy to the Prandtl number in Rayleigh-Bénard convection. In the presented work, where only the inner cylinder is rotated and the outer cylinder is kept stationary, we can relate Ta to the Reynolds number of the inner cylinder by
| (4) |
The scaling of the dimensionless angular velocity flux (torque) with the Taylor (Reynolds) number has been analysed extensively, see e.g. Lathrop et al. (1992); Lewis & Swinney (1999); Paoletti & Lathrop (2011); van Gils et al. (2011); Ostilla-Mónico et al. (2013) and the review articles by Fardin et al. (2014) and Grossmann et al. (2016), and the different regimes are well understood. In the current Taylor number regime it is known that . Because this response is well known, it can be exploited to study the influence of immersed bubbles and particles (van den Berg et al., 2005, 2007; van Gils et al., 2013; Maryami et al., 2014; Verschoof et al., 2016) on the drag needed to sustain constant rotational velocity of the inner cylinder.
In this paper we will use the TC geometry to study the effect of neutrally buoyant rigid spherical particles on the drag. We study the effects of varying the particle size , the volume fraction , the density ratio , and the flow Reynolds number Re on the global torque (drag) of the Taylor-Couette flow. The drag reduction is expressed as and as we are interested in the net drag reduction, it is not compensated for increased viscosity effects using correction models, such as the Einstein relation.
2 Experimental setup
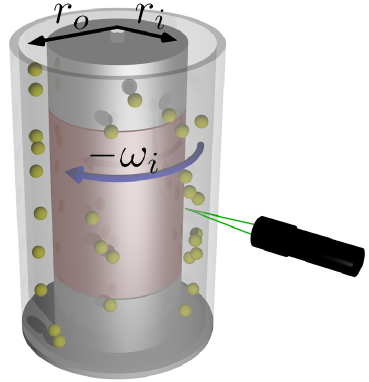
The experiments were conducted in the Twente Turbulent Taylor-Couette (T3C) facility (van Gils et al. (2011)). A schematic of the setup is shown in Figure 1. In this setup, the flow is confined between two concentric cylinders, which rotate independently. The top and bottom plates are attached to the outer cylinder. The radius of the inner cylinder (IC) is and the radius of the outer cylinder (OC) is , resulting in a gap width of and a radius ratio of . The IC has a total height of resulting in an aspect ratio of . The IC is segmented axially in three parts. To minimize the effect of the stationary end plates, the torque is measured only over the middle section of the IC with height , away from the end plates. A hollow reaction torque sensor made by Honeywell is used to measure the torque which has an error of roughly 1% for the largest torques we measured. Between the middle section and the top and bottom section of the inner cylinder is a gap of 2mm.
The IC can be rotated up to . In these experiments only the IC is rotated and the OC is kept at rest. The system holds a volume of of working fluid, which is a solution of glycerol () and water. To tune the density of the working fluid, the amount of glycerol was varied between and resulting in particles being marginally heavy, neutrally buoyant, or marginally light.
The system is thermally controlled by cooling the top and bottom plates of the setup. The temperature was kept at for all the experiments, with a maximum spatial temperature difference of within the setup, and we account for the density and viscosity changes of water and glycerol (Glycerine Producers’ Association, 1963).
Rigid polystyrene spherical particles (RGPballs S.r.l.) were used in the experiments, these particles have a density close to that of water (940 –). We chose particles with diameters , 4.0, and . To our disposal are: of diameter particles, of diameter particles, and of diameter particles, resulting in maximum volume fractions of , , and , respectively. The particles are found to be nearly mono-disperse ( of the particles are within of their target diameter). Due to the fabrication process, small air bubbles are sometimes entrapped within the particles. This results in a slight heterogeneous density distribution of the particles. After measuring the density distribution for each diameter, we calculated the average for all batches, which is . By adding glycerol to water we match this value in order to have neutrally buoyant particles.
Using a laser Doppler anemometry (LDA) system (BSA F80, Dantec Dynamics) we captured the azimuthal velocity at mid-height and mid-gap of the system (see figure 1) and we performed a radial scan at mid-height. The flow was seeded with diameter polyamide particles (PSP-5, Dantec Dynamics). Because of the curved surface of the outer cylinder (OC), the beams of the LDA get refracted in a non-trivial manner, which was corrected for using a ray-tracing technique described in Huisman et al. (2012).
Obviously, LDA measurements in a multi-phase flow are more difficult to set up than for single phase flows, as the The method relies on the reflection of light from tiny tracer particles passing through a measurement volume (). Once we add a second type of relatively large particles to the flow, this will affect the LDA measurements, mostly by blocking the optical path, resulting in lower acquisition rates. These large particles will also move through the measurement volume, but as these particles are at least 300 times larger than the tracers and thus much larger than the fringe pattern (fringe spacing ), the reflected light is substantially different from a regular Doppler burst and does not result in a measured value. The minimal signal-to-noise ratio for accepting a Doppler burst was set to 4. As a post-processing step the velocities were corrected for the velocity bias by using the transit time of the tracer particle.
3 Results
3.1 Effect of particle size
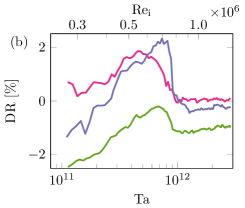
First we study the effect of changing the particle diameter on the torque of the system. In these experiments, we kept the particle volume fraction fixed at and the density of the working fluid, , at , for which the particles are neutrally buoyant. The results of these measurements are presented as in figure 2a. Our curves are practically overlapping, suggesting that the difference in drag between the different particle sizes is only marginal. We compare these with the bubbly drag reduction data at similar conditions (hollow symbols) from Verschoof et al. (2016); van Gils et al. (2013); van den Berg et al. (2005). At low Ta the symbols overlap with our data. However, at larger Ta, the bubbly flow data shows much lower torque (drag) than the particle-laden cases. As we are in the ultimate regime of turbulence where effectively scales as (Huisman et al., 2012; Ostilla-Mónico et al., 2013), we compensate the data with in figure 2b to emphasize the differences between the datasets. For the single phase case, this yields a clear plateau. For the particle-laden cases, the lowest drag corresponds to the smallest particle size. The reduction is however quite small (). The compensated plots also reveal a sudden increase in drag at a critical Taylor number . The jump is more distinct for the smaller particles, and might suggest a reorganisation of the flow (Huisman et al. (2014)). Beyond , the drag reduction is negligible for the larger particles ( and spheres). However, for the particles, the drag reduction seems to increase, and was found to be very repeatable in experiments. Interestingly, the size of these particles is comparable to that of the air bubbles in van Gils et al. (2013). This might suggest that for smaller size particles at larger Ta, one could expect drag reduction. At the increased viscosity of the suspension, a maximum could be reached in our experiments. We have performed an uncertainty analysis by repeating the measurements for the single phase, and for the cases with and particles multiple times and calculating the maximum deviation from the ensemble average. The left error bar indicates the maximum deviation for all measurements combined and is . For , we see an increase in uncertainty of (shown by the right error bar in figure 2b), which is only caused by the particles. These tiny particles can accumulate in the gap between the cylinder segments and thereby increase the uncertainty. Above , both, the and particles, show a maximum deviation below 0.25%.
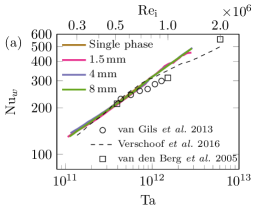
Below , the drag reduction due to spherical particles appears to be similar to bubbly drag reduction (van Gils et al., 2013). However, in the lower Ta regime, the bubble distribution was highly non-uniform due to buoyancy of the bubbles (van den Berg et al., 2005; van Gils et al., 2013; Verschoof et al., 2016). Therefore, the volume fractions reported were only the global values, and the torque measurements were for the mid-sections of their setups. What is evident from the above comparisons is that in the high Ta regime, air bubbles drastically reduce the drag, reaching far beyond the drag modification by rigid spheres.
3.2 Effect of particle volume fraction
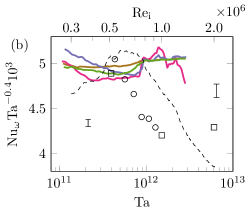
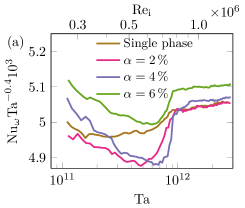
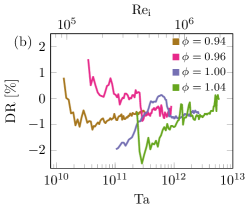
The next step is to investigate the effect of the particle volume fraction on the torque. For the particles, we have the ability to increase the particle volume fraction up to . This was done in steps of , and the results are plotted in compensated form in figure 3a. The normalised torque increases with the volume fraction of particles. The case shows the largest drag. Figure 3b shows the same data in terms of drag reduction as function of Ta. A volume fraction of particles gives the highest drag reduction. With increasing the drag reduction decreases. These measurements are in contrast with the findings for bubbly drag reduction (van Gils et al., 2013), for which the net drag decreases with increasing gas volume fraction. A common explanation for the increase of drag in a particle-laden flow is the larger apparent viscosity. If we would calculate the apparent viscosity for our case with the Einstein relation (equation 1) for , the drag increase would be , as compared to the pure working fluid. Including this effect in our drag reduction calculation would result in reductions of the same order. However, when comparing the drag with or without particles, the net drag reduction is practically zero. This result is different from the work of Picano et al. (2015) in turbulent channel flow where they found that the drag increased more than the increase of the viscosity.
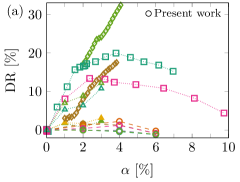
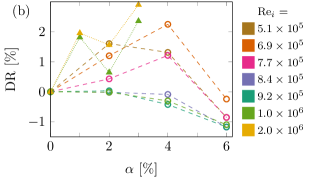
For a better comparison with bubbly drag reduction, we plot the drag reduction as a function of (gas or particle volume fraction ; see figure 4a. Different studies are shown using different symbols, and Re is indicated by colours. None of the datasets were compensated for the changes in effective viscosity. DR is defined in slightly differently way in each study: van den Berg et al. (2005) makes use of the friction coefficient ; van Gils et al. (2013) uses the dimensionless torque , ; and Verschoof et al. (2016) uses the plain torque value . While the rigid particles only showed marginal drag reduction, some studies using bubbles achieve dramatic reduction of up to and beyond. Figure 4b shows a zoomed in view of the bottom part of the plot with the rigid sphere data. The triangles denote the data from Verschoof et al. (2016), corresponding to small bubbles in the Taylor-Couette system. The rigid particles and the small bubbles show a similar drag response. What is remarkable is that this occurs despite the huge difference in size. The estimated diameter of the bubbles in Verschoof et al. (2016) is , while the rigid spheres are about two orders in magnitude larger. This provides key evidence that the particle size alone is not enough to cause drag reduction, also the density ratio of the particle and the carrier fluid is of importance.
3.3 Effect of marginal changes in particle density ratio
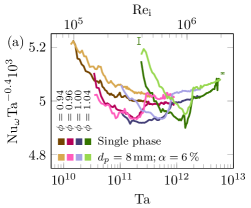
With the effects of particle size and volume fraction revealed, we next address the sensitivity of the drag to marginal variations in particle density. A change in the particle density ratio brings about a change in the buoyancy and centrifugal forces on the particle, both of which can affect the particle distribution within the flow. We tune the particle to fluid density ratio by changing the volume fraction of glycerol in the fluid, such that the particles are marginally buoyant (), neutrally buoyant () and marginally heavy () particles. In figure 5a we show the compensated as function of Ta for various . was fixed to and only particles were used. The darker shades of colour correspond to the single phase cases, while lighter shades correspond to particle-laden cases. In general, the single phase drag is larger as compared to the particle-laden cases. However, there is no striking difference between the different . In figure 5b, we present the drag reduction for particle-laden cases at different density ratios. On average we see for all cases drag modification of approximately . We can also identify a small trend in the lower Ta region: the two larger (heavy and neutrally buoyant particles) tend to have a drag increase, while the smaller cases (both light particles) have a tendency for drag reduction. Nevertheless, the absolute difference in DR between the cases is within 4%. The above results provide clear evidence that minor density mismatches do not have a serious influence on the global drag of the system. To investigate for strong buoyancy effects, additional measurements were done using expanded polystyrene particles (). However, due to the particles accumulating between the inner cylinder segments leading to additional mechanical friction, these measurements were inconclusive.
3.4 Flow statistics using particles
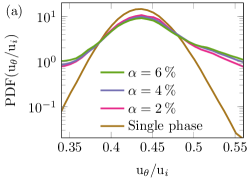
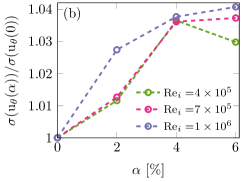
In the above sections, we presented the effects of changing particle size, volume fraction, and density on the global drag of the system. Next we look into local flow properties using LDA while the particles are present. First, we collected a total of data points of azimuthal velocity at mid-height and mid-gap. These were captured over a period of approximately cylinder rotations. From this data we calculate the probability density function (PDF) of normalised by for various , shown in figure 6a. The particle size was fixed to and the Reynolds number was set to . From this figure we see a large increase in turbulent fluctuations, resulting in very wide tails. While the difference between , , and is not large, we can identify an increase in fluctuations with increasing . These increased fluctuations can be explained by the additional wakes produced by the particles (Poelma et al., 2007; Alméras et al., 2017). The increase in fluctuations can also be visualized using the standard deviation of normalised by the standard deviation of the single phase case—see figure 6b. In this figure, is shown for three different Re, again for particles. In general, we see a monotonically increasing trend with , and it seems to approach an asymptotic value. One can speculate that there has to be an upper limit for fluctuations which originate from wakes of the particles. For large the wakes from particles will interact with each other and with the carried flow.
Measurements using particles yielded qualitatively similar results. It is known that in particle-laden gaseous pipe flows, large particles can increase the turbulent fluctuations, while small particles result in turbulence attenuation (Tsuji et al., 1984; Gore & Crowe, 1989; Vreman, 2015). The LDA measurements were not possible with the smallest particles (), as the large amount of particles in the flow blocked the optical paths of the laser beams.
We are confident that for these bi-disperse particle-laden LDA measurements, the large particles do not have an influence on the measurements as these millimetric-sized particles are much larger than the fringe spacing () and do not show a Doppler burst. However, during the measurements the particles get damaged and small bits of material are fragmented off the particles. We estimate the size of these particles slightly larger than the tracer particles and these can have an influence on the LDA measurements as they do not act as tracers.
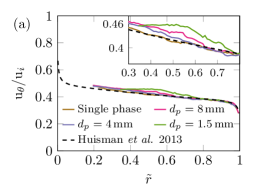
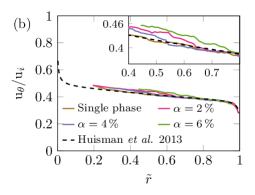
How the average azimuthal velocity changes with particle radius is shown in figure 7. We measured a total of data points during approximately 900 cylinder rotations. Again, the data were corrected for velocity bias by using the transit time as a weighing factor. Figure 7a shows the effect of particle size for , and figure 7b shows the effect of particle volume fraction for particles. Both figures additionally show the high-precision single phase data from Huisman et al. (2013) for which our single phase measurements are practically overlapping. Since LDA measurements close to the inner cylinder are difficult, due to the reflecting inner cylinder surface, we limited our radial extent to . We found that the penetration depth of our LDA measurements is the smallest for experiments with the smallest particles and the largest . All differences with the single phase case are only marginal and we can conclude that the average mean velocity is not much affected by the particles in the flow, at least for .
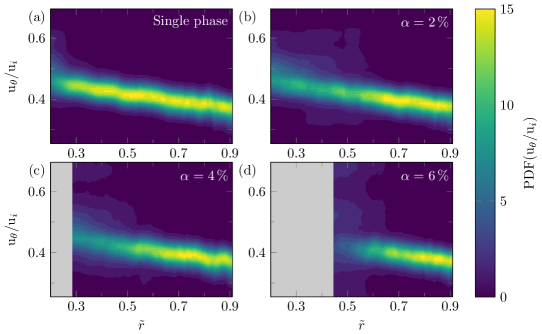
To get an idea of the fluctuations we can use the previous data to construct a two-dimensional PDF of the azimuthal velocity as function of radius. These are shown for using particles at various and the single phase case in figure 8. First thing to notice is again that the penetration depth is decreasing with increasing . The single phase case shows a narrow banded PDF. When is increased, for the lower values of the PDF is much wider. While it makes sense that an increase in increases the fluctuations due to the increased number of wakes of particles, this is expected everywhere in the flow, not only closer to the inner cylinder. It is possible that the particles have a preferred concentration closer to the inner cylinder. We have tried to measure the local concentration of particles as function of radius but failed due to limited optical accessibility. Therefore, we can only speculate under what circumstances there would be an inhomogeneous particle distribution which would lead to the visible increase in fluctuations. The first possibility is a mismatch in density between the particle and the fluid, which would result in light particles () to accumulate closer to the inner cylinder. Another possibility is that due to the rotation of the particle, an effective lift force arises, leading to a different particle distribution in the flow. While this is quite plausible, this is difficult to validate as we would need to capture the rotation. The fragments of plastic that are sheared off the particles can also have a bias to the LDA measurement. While we estimate them to be larger than the tracers, they might still be small enough to produce a signal and they might not follow the flow faithfully.
4 Conclusions and outlook
We have conducted an experimental study on the drag response of a highly turbulent Taylor-Couette flow containing rigid neutrally buoyant spherical particles. We have found that, unlike the case of bubbles used in prior works (van Gils et al., 2013; Verschoof et al., 2016), rigid particles barely reduce (or increase) the drag on the system, even for cases where their size was comparable to that of bubbles used in other studies. There was no significant size effect. Even for very large particles, which can attenuate turbulent fluctuations and generate wakes, there was no distinct difference with the single phase flow. We also varied the volume fraction of the particles in the range 0%–6%. The particle volume fraction has no greater effect on the system drag than what is expected due to changes in the apparent viscosity of the suspension. Further, we tested the sensitivity of our drag measurements to marginal variations in particle to fluid density ratio . A trend was noticeable, towards drag reduction when was reduced from 1.00 to 0.94. This suggests that a low density of the particle could be a necessary ingredient for drag reduction. Finally, we have also probed the local flow at the mid height and mid gap of the system using LDA. With the addition of particles, the liquid velocity fluctuations are enhanced, with wider tails of the distributions. A finite relative velocity between the particle and the flow around it can cause this increase in velocity fluctuations (Mathai et al., 2015), as seen for bubbly flows (pseudo-turbulence), and in situations of sedimenting particles in quiescent or turbulent environments (Gore & Crowe, 1989). In the present situation, the relative velocity between the particle and the flow is expected, owing to the inertia of the finite-sized particles we used. There is only a marginal deviation from the single phase case in the average azimuthal velocity over the radial positions measured using any size or concentration of particles measured. From the two-dimensional PDFs, we see that closer to the inner cylinder, using smaller or larger , the PDF gets wider. This can be due to a preferential concentration of the particles or a slight density mismatch.
Our study is a step towards a better understanding of the mechanisms of bubbly drag reduction. Bubbles are deformable, and they have a tendency to migrate towards the walls, either due to lift force (Dabiri et al., 2013), or due to the centripetal effects (van Gils et al., 2013). When compared to the drag reducing bubbles in van Gils et al. (2013); Verschoof et al. (2016), our particles do not deform, and they do not experience centripetal effects as they are density matched. At least one of these differences must therefore be crucial for the observed, bubbly drag reduction in those experiments. In a future investigation, we will conduct more experiments using very light spherical particles that experience similar centripetal forces as the bubbles in van Gils et al. (2013), but are non-deformable. These particle need to be larger than the size of the gap between the inner cylinder segments and very rigid, or the setup needs to be modified to close the gap between the IC segments. Such experiments can then disentangle the role of particle density on drag reduction from that of the particle shape.
Acknowledgements: We would like to thank Elisabeth Guazzelli, Bert Vreman, Rodrigo Ezeta, Pim Bullee and Arne te Nijenhuis for various stimulating discussions. Also, we like to thank Gert-Wim Bruggert and Martin Bos for technical support. This work was funded by STW, FOM, and MCEC, which are part of the Netherlands Organisation for Scientific Research (NWO). CS acknowledges financial support from VIDI grant No. 13477, and the Natural Science Foundation of China under Grant No. 11672156.
References
- Alméras et al. (2017) Alméras, E., Mathai, V., Lohse, D. & Sun, C. 2017 Experimental investigation of the turbulence induced by a bubble swarm rising within incident turbulence. J. Fluid Mech. 825, 1091–1112.
- Bellani et al. (2012) Bellani, G., Byron, M. L., Collignon, A. G., Meyer, C. R. & Variano, E. A. 2012 Shape effects on turbulent modulation by large nearly neutrally buoyant particles. J. Fluid Mech. 712, 41–60.
- Bragg et al. (2015) Bragg, A. D., Ireland, P. J. & Collins, L. R. 2015 Mechanisms for the clustering of inertial particles in the inertial range of isotropic turbulence. Physical Review E 92 (2).
- Calzavarini et al. (2008) Calzavarini, E., Cencini, M., Lohse, D. & Toschi, F. 2008 Quantifying turbulence-induced segregation of inertial particles. Phys. Rev. Lett. 101 (8).
- Ceccio (2010) Ceccio, S. L. 2010 Friction drag reduction of external flows with bubble and gas injection. Annu. Rev. Fluid Mech. 42, 183–203.
- Cisse et al. (2013) Cisse, M., Homann, H. & Bec, J. 2013 Slipping motion of large neutrally buoyant particles in turbulence. J. Fluid Mech. 735.
- Cisse et al. (2015) Cisse, M., Saw, E.-W., Gibert, M., Bodenschatz, E. & Bec, J. 2015 Turbulence attenuation by large neutrally buoyant particles. Phys. Fluids 27, 061702.
- Colin et al. (2012) Colin, C., Fabre, J. & Kamp, A. 2012 Turbulent bubbly flow in pipe under gravity and microgravity conditions. J. Fluid Mech. 711, 469–515.
- Costa et al. (2016) Costa, P., Picano, F., Brandt, L. & Breugem, W.-P. 2016 Universal scaling laws for dense particle suspensions in turbulent wall-bounded flows. Phys. Rev. Lett. 117, 134501.
- Dabiri et al. (2013) Dabiri, S., Lu, J. & Tryggvason, G. 2013 Transition between regimes of a vertical channel bubbly upflow due to bubble deformability. Phys. Fluids 25, 102110.
- Eckhardt et al. (2007) Eckhardt, B., Grossmann, S. & Lohse, D. 2007 Torque scaling in turbulent Taylor–Couette flow between independently rotating cylinders. J. Fluid Mech. 581, 221–250.
- Einstein (1906) Einstein, A. 1906 Eine neue Bestimmung der Moleküldimensionen. Ann. d. Phys. 324 (2), 289–306.
- Elghobashi (1994) Elghobashi, S. 1994 On predicting particle-laden turbulent flows. Appl. Sci. Res. 52 (4), 309–329.
- Fardin et al. (2014) Fardin, M. A., Perge, C. & Taberlet, N. 2014 “The hydrogen atom of fluid dynamics“ - introduction to the Taylor–Couette flow for soft matter scientists. Soft Matter 10, 3523–3535.
- Fiabane et al. (2012) Fiabane, L., Zimmermann, R., Volk, R., Pinton, J.-F. & Bourgoin, M. 2012 Clustering of finite-size particles in turbulence. Physical Review E 86 (3).
- Fujiwara et al. (2004) Fujiwara, A., Minato, D. & Hishida, K. 2004 Effect of bubble diameter on modification of turbulence in an upward pipe flow. Int. J. Heat Fluid Fl. 25 (3), 481–488.
- Glycerine Producers’ Association (1963) Glycerine Producers’ Association 1963 Physical properties of glycerine and its solutions. Glycerine Producers’ Association.
- Gore & Crowe (1989) Gore, R. A. & Crowe, C. T. 1989 Effect of particle size on modulating turbulent intensity. Int. J. Multiphase Flow 15 (2), 279–285.
- Grossmann et al. (2016) Grossmann, S., Lohse, D. & Sun, C. 2016 High–Reynolds Number Taylor–Couette Turbulence. Annu. Rev. Fluid Mech. 48, 53–80.
- Huisman et al. (2013) Huisman, S. G., Scharnowski, S., Cierpka, C., Kähler, C. J., Lohse, D. & Sun, C. 2013 Logarithmic boundary layers in strong Taylor-Couette turbulence. Phys. Rev. Lett. 110, 264501.
- Huisman et al. (2012) Huisman, S. G., van Gils, D. P. & Sun, C. 2012 Applying laser Doppler anemometry inside a Taylor-Couette geometry using a ray-tracer to correct for curvature effects. Eur. J. Mech. B-Fluids 36, 115–119.
- Huisman et al. (2014) Huisman, S. G., van der Veen, R. C., Sun, C. & Lohse, D. 2014 Multiple states in highly turbulent Taylor–Couette flow. Nat. Comm. 5, 3820.
- Kazerooni et al. (2017) Kazerooni, H. T., Fornari, W., Hussong, J. & Brandt, L. 2017 Inertial migration in dilute and semidilute suspensions of rigid particles in laminar square duct flow. Phys. Fluids 2, 084301.
- Kidanemariam et al. (2013) Kidanemariam, A. G., Chan-Braun, C., Doychev, T. & Uhlmann, M. 2013 Direct numerical simulation of horizontal open channel flow with finite-size, heavy particles at low solid volume fraction. New J. Phys. 15, 025031.
- Kulick et al. (1994) Kulick, J. D., Fessler, J. R. & Eaton, J. K. 1994 Particle response and turbulence modification in fully developed channel flow. J. Fluid Mech. 277, 109–134.
- Lashgari et al. (2014) Lashgari, I., Picano, F., Breugem, W.-P. & Brandt, L. 2014 Laminar, turbulent, and inertial shear-thickening regimes in channel flow of neutrally buoyant particle suspensions. Phys. Rev. Lett. 113, 254502.
- Lathrop et al. (1992) Lathrop, D. P., Fineberg, J. & Swinney, H. L. 1992 Turbulent flow between concentric rotating cylinders at large Reynolds number. Phys. Rev. Lett. 68, 1515.
- Lewis & Swinney (1999) Lewis, G. S. & Swinney, H. L. 1999 Velocity structure functions, scaling, and transitions in high-Reynolds-number Couette-Taylor flow. Phys. Rev. E 59, 5457.
- Liu & Bankoff (1993) Liu, T. J. & Bankoff, S. G. 1993 Structure of air-water bubbly flow in a vertical pipe—i. liquid mean velocity and turbulence measurements. Int. J. Heat Mass Tran. 36 (4), 1049–1060.
- Lu et al. (2005) Lu, J., Fernández, A. & Tryggvason, G. 2005 The effect of bubbles on the wall drag in a turbulent channel flow. Phys. Fluids 17, 095102.
- Machicoane & Volk (2016) Machicoane, N. & Volk, R. 2016 Lagrangian velocity and acceleration correlations of large inertial particles in a closed turbulent flow. Physics of Fluids 28, 035113.
- Maryami et al. (2014) Maryami, R., Farahat, S., Javad poor, M. & Shafiei Mayam, M. H. 2014 Bubbly drag reduction in a vertical Couette–Taylor system with superimposed axial flow. Fluid Dyn. Res. 46 (5), 055504.
- Mathai et al. (2016) Mathai, V., Calzavarini, E., Brons, J., Sun, C. & Lohse, D. 2016 Microbubbles and microparticles are not faithful tracers of turbulent acceleration. Phys. Rev. Lett. 117, 024501.
- Mathai et al. (2018) Mathai, V., Huisman, S. G., Sun, C., Lohse, D. & Bourgoin, M. 2018 Enhanced dispersion of big bubbles in turbulence. arXiv preprint arXiv:1801.05461 .
- Mathai et al. (2015) Mathai, V., Prakash, V. N., Brons, J., Sun, C. & Lohse, D. 2015 Wake-driven dynamics of finite-sized buoyant spheres in turbulence. Phys. Rev. Lett. 115, 124501.
- Mazzitelli et al. (2003) Mazzitelli, I. M., Lohse, D. & Toschi, F. 2003 The effect of microbubbles on developed turbulence. Phys. Fluids 15, L5.
- Murai (2014) Murai, Y. 2014 Frictional drag reduction by bubble injection. Exp. Fluids 55 (7), 1773.
- Muste & Patel (1997) Muste, M. & Patel, V. C. 1997 Velocity profiles for particles and liquid in open-channel flow with suspended sediment. J. Hydraul. Eng. 123 (9), 742–751.
- Naso & Prosperetti (2010) Naso, A. & Prosperetti, A. 2010 The interaction between a solid particle and a turbulent flow. New J. Phys. 12, 033040.
- Ostilla-Mónico et al. (2013) Ostilla-Mónico, R., Stevens, R. J. A. M., Grossmann, S., Verzicco, R. & Lohse, D. 2013 Optimal Taylor–Couette flow: direct numerical simulations. J. Fluid Mech. 719, 14–46.
- Pan & Banerjee (1996) Pan, Y. & Banerjee, S. 1996 Numerical simulation of particle interactions with wall turbulence. Phys. Fluids 8, 2733.
- Paoletti & Lathrop (2011) Paoletti, M. S. & Lathrop, D. P. 2011 Angular momentum transport in turbulent flow between independently rotating cylinders. Phys. Rev. Lett. 106, 024501.
- Peskin (2002) Peskin, C. S. 2002 The immersed boundary method. Acta numer. 11, 479–517.
- Picano et al. (2015) Picano, F., Breugem, W.-P. & Brandt, L. 2015 Turbulent channel flow of dense suspensions of neutrally buoyant spheres. J. Fluid Mech. 764, 463–487.
- Poelma et al. (2007) Poelma, C., Westerweel, J. & Ooms, G. 2007 Particle–fluid interactions in grid-generated turbulence. J. Fluid Mech. 589, 315–351.
- Procaccia et al. (2008) Procaccia, I., L’vov, V. S. & Benzi, R. 2008 Colloquium: Theory of drag reduction by polymers in wall-bounded turbulence. Rev. Mod. Phys. 80 (1), 225–247.
- Roghair et al. (2011) Roghair, I., Mercado, J. M., Annaland, M. V. S., Kuipers, H., Sun, C. & Lohse, D. 2011 Energy spectra and bubble velocity distributions in pseudo-turbulence: Numerical simulations vs. experiments. Int. J. Multiphase Flow 37 (9), 1093–1098.
- Shawkat et al. (2008) Shawkat, M. E., Ching, C. Y. & Shoukri, M. 2008 Bubble and liquid turbulence characteristics of bubbly flow in a large diameter vertical pipe. Int. J. Multiphase Flow 34 (8), 767–785.
- So et al. (2002) So, S., Morikita, H., Takagi, S. & Matsumoto, Y. 2002 Laser Doppler velocimetry measurement of turbulent bubbly channel flow. Exp. Fluids 33 (1), 135–142.
- Stickel & Powell (2005) Stickel, J. J. & Powell, R. L. 2005 Fluid mechanics and rheology of dense suspensions. Annu. Rev. Fluid Mech. 37, 129–149.
- Tagawa et al. (2013) Tagawa, Y., Roghair, I., Prakash, V. N., van Sint Annaland, M., Kuipers, H., Sun, C. & Lohse, D. 2013 The clustering morphology of freely rising deformable bubbles. J. Fluid Mech. 721.
- Toschi & Bodenschatz (2009) Toschi, F. & Bodenschatz, E. 2009 Lagrangian properties of particles in turbulence. Annu. Rev. Fluid Mech. 41, 375–404.
- Tsuji et al. (1984) Tsuji, Y., Morikawa, Y. & Shiomi, H. 1984 Ldv measurements of an air-solid two-phase flow in a vertical pipe. J. Fluid Mech. 139, 417–434.
- Uhlmann (2008) Uhlmann, M. 2008 Interface-resolved direct numerical simulation of vertical particulate channel flow in the turbulent regime. Phys. Fluids 20, 053305.
- Unverdi & Tryggvason (1992) Unverdi, S. O. & Tryggvason, G. 1992 A front-tracking method for viscous, incompressible, multi-fluid flows. J. Comput. Phys. 100 (1), 25–37.
- van den Berg et al. (2005) van den Berg, T. H., Luther, S., Lathrop, D. P. & Lohse, D. 2005 Drag Reduction in Bubbly Taylor-Couette Turbulence. Phys. Rev. Lett. 94, 044501.
- van den Berg et al. (2007) van den Berg, T. H., van Gils, D. P. M., Lathrop, D. P. & Lohse, D. 2007 Bubbly turbulent drag reduction is a boundary layer effect. Phys. Rev. Lett. 98, 084501.
- van Gils et al. (2011) van Gils, D. P., Bruggert, G.-W., Lathrop, D. P., Sun, C. & Lohse, D. 2011 The Twente turbulent Taylor-Couette () facility: strongly turbulent (multi-phase) flow between independently rotating cylinders. Rev. Sci. Instr. 82, 025105.
- van Gils et al. (2013) van Gils, D. P., Narezo Guzman, D., Sun, C. & Lohse, D. 2013 The importance of bubble deformability for strong drag reduction in bubbly turbulent Taylor–Couette flow. J. Fluid Mech. 722, 317–347.
- Verschoof et al. (2016) Verschoof, R. A., van der Veen, R. C., Sun, C. & Lohse, D. 2016 Bubble drag reduction requires large bubbles. Phys. Rev. Lett. 117, 104502.
- Vreman (2015) Vreman, A. W. 2015 Turbulence attenuation in particle-laden flow in smooth and rough channels. J. Fluid Mech. 773, 103–136.
- Wang et al. (2017) Wang, Y., Sierakowski, A. J. & Prosperetti, A. 2017 Fully-resolved simulation of particulate flows with particles–fluid heat transfer. J. Comput. Phys. 350, 638–656.
- White & Mungal (2008) White, C. M. & Mungal, M. G. 2008 Mechanics and prediction of turbulent drag reduction with polymer additives. Annu. Rev. Fluid Mech. 40, 235–256.
- Zhao et al. (2010) Zhao, L. H., Andersson, H. I. & Gillissen, J. J. J. 2010 Turbulence modulation and drag reduction by spherical particles. Phys. Fluids 22, 081702.