The long-term optical evolution of the black hole candidate MAXI J1659152
Abstract
We present 5 years of optical and infrared data of the black hole candidate MAXI J1659152 covering its 2010 outburst, decay and quiescence. Combining optical data taken during the outburst decay, we obtain an orbital period of h, in perfect agreement with the value previously measured from X-ray dips. In addition, we detect a clear H excess in MAXI J1659152 with data taken during the outburst decay. We also detect a single hump modulation most likely produced by irradiation. Assuming that the maximum occurs at orbital phase 0.5, we constrain the phase of the X-ray dips to be . We also detect the quiescent optical counterpart at , and . These magnitudes provide colour indices implying an M2–M5 donor star assuming 60% contribution from a disc component in the -band.
keywords:
X-rays: binaries – stars: black holes – stars: binaries: close – X-rays: individual: MAXI J16591521 Introduction
X-ray binaries are systems formed by a neutron star or a black hole (BH) accompanied by a star which is feeding the compact source via an accretion disc. The mass of the companion star determines the main mode of accretion, e.g. whether produced through stellar winds in systems with massive companions or through Roche lobe overflow in systems with cool stars. Most of the systems harbouring a BH have been found in X-ray transients (XRTs), a type of X-ray binary with sporadic outburst episodes –caused by thermal-viscous instabilities in the accretion disc (see e.g. Lasota, 2001; King et al., 1996)– followed by an e-folding decay towards the quiescent state, where the system can reside for decades to centuries. During outburst, XRTs increase their brightness by several orders of magnitude, such that they can be detected by the all-sky monitors onboard X-ray satellites.
MAXI J1659152 (initially referred to as GRB 100925A) was detected during an outburst on 2010 September 25 simultaneously by the Gas Slit Camera (GSC) mounted on the Monitor of All-sky X-ray Image (MAXI) (Negoro et al., 2010) and the Burst Alert Telescope (BAT) mounted on the Swift telescope (Mangano et al., 2010). de Ugarte Postigo et al. (2010) found broad emission lines from the Balmer series as well as He ii and Ca ii, confirming the Galactic origin and the X-ray binary nature. It was classified as a BH candidate based on its X-ray spectral and timing properties (Kalamkar et al., 2010; Kalamkar et al., 2011; Muñoz-Darias et al., 2011), which resemble those typically found in confirmed BH XRTs. (see, e.g., Belloni et al. 2011; Belloni & Motta 2016). A radio counterpart was also detected with the Westerbork Synthesis Radio Telescope showing 23% linear polarization (van der Horst et al., 2010) and the European Very Large Base Interferometer (eVLBI) network. The coordinates of the radio source are (J2000) = 16h59m01.676891s and (J2000) = -15°15′28.73237″, with 690 and 220 as uncertainties, respectively (Paragi et al., 2013).
The optical counterpart was promptly detected by Swift/UVOT (Marshall, 2010) and several ground based telescopes (e.g. Jelinek et al., 2010; De Cia et al., 2010). By analysing pre-outburst survey images, Kong et al. (2010) reported an optical counterpart consistent with the coordinates of the X-ray source. Later, Kong (2012) reported a quiescent -band magnitude in the range 23.623.8 from postoutburst images. However, Kuulkers et al. (2013) proposed that the quiescent counterpart found by Kong et al. (2010) and Kong (2012) was too bright to be the true counterpart and probably was a foreground star in our line-of-sight. To conclude this, they used the Shahbaz & Kuulkers (1998) relation corrected for inclination effects (Warner, 1987; Miller-Jones et al., 2011) and proposed a magnitude for the quiescent counterpart in the range .
Dips in the X-ray flux were detected during outburst with Swift/X-ray telescope (Kennea et al., 2010; Kennea et al., 2011), INTEGRAL (International Gamma Ray Astrophysics Laboratory; Kuulkers et al., 2010a) and XMM-Newton (Kuulkers et al., 2010b), recurring approximately every 2.42.5 h (Kuulkers et al., 2010b, 2013). This allowed Kuulkers et al. (2013) to obtain an accurate orbital period () of h, being the shortest reported for a BH candidate hitherto (see, e.g., BlackCAT 111www.astro.puc.cl/BlackCAT; Corral-Santana et al., 2016). Kuulkers et al. (2013) constrained the inclination to be between 65° and 80° due to the lack of eclipses, and the presence of the aforementioned periodic absorption dips that obscured up to 90% of the total emission.
The distance of MAXI J1659152 is not well constrained. With the reported quiescent counterpart, Kong (2012) assumed an M2 or M5 dwarf companion which contributes 50% to the total optical flux (Jonker et al., 2012) to derive a distance of kpc and kpc, respectively. Kennea et al. (2011) estimated a distance of kpc from the properties of the X-ray emission whereas, Kaur et al. (2012) obtained a distance of kpc from the interstellar lines of the optical spectra. Jonker et al. (2012) derived a distance of kpc assuming an M2 V companion star with a 50% contribution of the accretion disc to the -band magnitude. Finally, using the Shahbaz & Kuulkers (1998) relation together with the estimated Galactic hydrogen column density () given by Kalberla et al. (2005), Kuulkers et al. (2013) obtained a distance to MAXI J1659152 of kpc. However, this relation does not take into account inclination effects, yielding overestimated values (Miller-Jones et al., 2011). Thus, the distance would drop to kpc for ° or kpc for ° (Kuulkers et al., 2013).
Interestingly, there is a growing population of XRTs with short located at high Galactic latitudes. MAXI J1659152 has a height above the Galactic plane of kpc. This can be compared to Swift J1753.50127 with kpc and h (Cadolle Bel et al., 2007; Zurita et al., 2008); XTE J1118+480 with kpc and h (Zurita et al., 2002b; Torres et al., 2004; Gelino et al., 2006) and more recently Swift J1357.20933 with kpc and h (Mata Sánchez et al., 2015; Corral-Santana et al., 2013; Shahbaz et al., 2013). It has been proposed by Yamaoka et al. (2012) that MAXI J1659152 is probably a runaway BH XRTs kicked out from the Galactic plane at a high speed similar to XTE J1118+480 (Mirabel et al., 2001). Although this scenario has not been established for Swift J1753.50127 and Swift J1357.20933 yet, the hypothesis is well supported by the properties found in MAXI J1659152 (Kuulkers et al., 2013).
2 Observations and data reduction
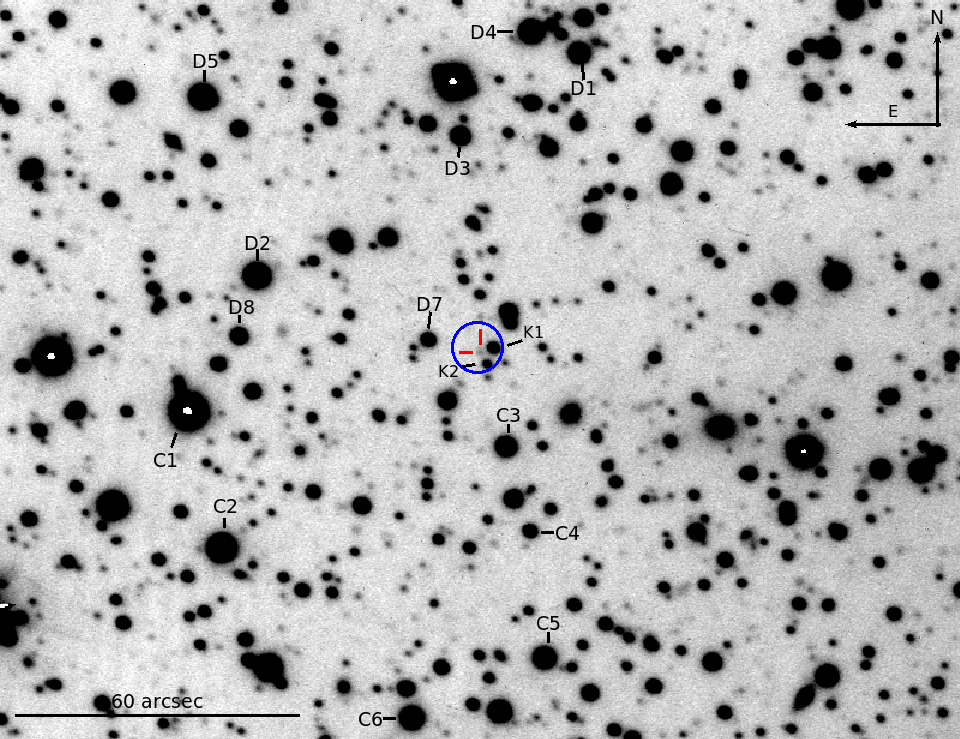
In what follows, we detail the observations and reduction of the data taken with the Gran Telescopio Canarias (GTC), Gemini South (GS), Very Large Telescope (VLT), William Herschel (WHT), Isaac Newton (INT), Faulkes North and South (FTN and FTS, respectively) and Mercator (MER) telescopes. A log of the observations is shown in Table 1. In Figure 1 we present a finding chart with the comparison stars used for the photometry, the magnitudes of which are listed in Table 2.
| UT date | Telescope∗ | Detector | Filter | Exp. (s) | No. |
|---|---|---|---|---|---|
| 2010-09-26 | FTN | Merope | 300 | 5 | |
| 2010-09-28 | FTS | Merope | 100 | 14 | |
| 2010-10-05 | FTS | Merope | 40 | 11 | |
| 2011-05-21 | FTS | Spectral | 200 | 1 | |
| 2011-05-25 | FTS | Spectral | 200 | 1 | |
| 2011-05-26 | FTS | Spectral | 200 | 1 | |
| 2011-05-27 | FTS | Spectral | 200 | 1 | |
| 2011-05-30 | Mer | Merope | 120 | 117 | |
| 2011-05-31 | Mer | Merope | 120 | 132 | |
| 2011-06-02 | FTN | Spectral | 200 | 24 | |
| 2011-06-03 | FTN | Spectral | 200 | 4 | |
| 2011-06-06 | FTN/S | Spectral | 200 | 37 | |
| 2011-06-28 | WHT | ACAM | 240 | 42 | |
| 2011-07-27 | FTS | Spectral | 200 | 11 | |
| 2011-07-31 | INT | WFC | 120 | 2 | |
| 2011-08-03 | FTS | Spectral | 200 | 1 | |
| 2011-08-26 | FTS | Spectral | 200 | 1 | |
| 2011-08-28 | WHT | ACAM | 200 | 2 | |
| " | " | " | 150 | 2 | |
| " | " | " | H | 600 | 3 |
| 2012-06-08 | INT | WFC | 1800 | 4 | |
| 2013-04-13 | GS | GMOS | 603 | 13 | |
| 2013-05-04 | GS | GMOS | 603 | 12 | |
| 2013-06-06 | VLT | FORS2 | 90+120 | 2 | |
| 2014-02-26 | WHT | LIRIS | 30 | 180 | |
| 2014-04-09 | " | " | 60 | 90 | |
| 2014-06-30 | GTC | Osiris | 180 | 4 | |
| 2014-07-20 | WHT | LIRIS | 30 | 120 | |
| 2014-09-01 | " | " | 15 | 278 | |
| 2015-06-12 | VLT | FORS2 | 240 | 11 | |
| ∗ See text for the definition of the acronyms | |||||
2.1 Photometry from Australia and Hawaii
Optical images of MAXI J1659-152 were taken with the 2-m FTN and FTS telescopes situated in Haleakala, Hawaii (USA) and Siding Spring (Australia), respectively. The observations are part of an ongoing monitoring campaign of low-mass X-ray binaries (Lewis et al., 2008). The observations mostly covered the outburst and decay phases, since during quiescence the system is too faint to obtain clear detections with these telescopes. Useful images were taken in -band between 2010 September 26 and 2011 August 26. We adjusted the exposure time to account for the change of brightness of the system, between 40 and 300 s. The observations obtained in 2010 were taken with the Merope detector which had a pixel scale of 0.278 ″ pix-1 (binning ), covering a field of view (FoV) of . Since 2011, the Spectral camera replaced Merope, providing a pixel scale of 0.304 ″ pix-1 and a FoV. The average image quality of the entire dataset is 1.3 ″.
Science images were de-biased and flat-fielded with an automatic pipeline. We then performed aperture photometry using PHOT in IRAF with a fixed aperture of 6.0 pixels ( and ″ for each camera, respectively) in the target and local comparison stars.
2.2 Observations from the Canary Islands
We obtained images with several telescopes located at the Roque de los
Muchachos Observatory on the island of La Palma, Spain. We observed
with the 1.2-m MER telescope on 2011 May 30 and 31 using the Merope
camera ( FoV,
0.19″ pix-1 plate scale) and the -band filter.
The exposure times were 120 s for both nights, obtaining a total
of 117 and 132 images, respectively, with a seeing better than
0.9″ in all cases.
The conditions during 2011 May 30 were degraded due to the
presence of some cirrus during part of the night.
Thus, data taken between UT 01:44 and UT 02:25 were
removed due to its lack of quality to the detect the target.
The images were de-biased and flat-fielded following
standard procedures in IRAF. Then, we applied differential
optimal-aperture photometry (Naylor, 1998) to obtain the magnitudes
of local comparison stars and the object with tasks in IRAF
and IDL.
We also observed MAXI J1659-152 with the 4.2-m WHT on 2011 June 28
and August 28 using the Auxiliary-port CAMera (ACAM; Benn
et al. 2008).
This instrument provides a FoV of with
a plate scale of 0.25 ″ pix-1. The images were taken with
the , and Hband (,
Å) filters, with the latter only used on 2011
August 28. The average seeing in each band along the entire
FoV was 1.2, 1.2 and 1.1″, respectively. The reduction and
analysis of these images were done as for the data taken with MER.
, and -band images were obtained with the Long-Slit Intermediate Resolution Infrared Spectrograph (LIRIS) on four nights between 2014 February 26 and September 01. This camera provides FoV with a plate scale of 0.25″ pix-1. The observing conditions were variable with seeing ranging from 0.7 to 2 ″. The exposure times used ranged from 15 to 60 s depending on the filter (see Table 1). The standard data reduction was performed using the lirisdr package (Alves et al., 2011). Optimal aperture photometry (Naylor, 1998) was carried out on the resulting combined images for each band to obtain the counts for MAXI J1659152 and local comparison stars as well as a 2MASS star in the field (2MASS165907901515289). Differential photometry of MAXI J1659152 with respect to the 2MASS local standard was then performed, which also allow an absolute photometric calibration.
We also obtained images with the 2.5-m INT on 2011 July 31 and 2012 June 08 and 09. In these campaigns we used the Wide Field Camera (WFC) mounted on the prime focus of the telescope with the -band filter, obtaining an average seeing of 2.0, 1.4 and 1.6″, respectively for each night. Given the large FoV of 0.3 square degrees of this camera, we reduced the exposure area in order to decrease the readout time. The images were de-biased and flat-fielded with IRAF. We used optimal aperture photometry on the 2011 campaign. Given the faintness of the system in 2012 and the presence of nearby stars of similar brightness, we decided to perform point spread function (PSF) photometry using DAOPHOT II/ALLSTAR (Stetson, 1987). The PSF model was chosen interactively among the six different functions available in the software to fit the profile of point-like objects. This is repeated iteratively to reject non-stellar objects. Once the model converged, it is applied to all the detections in the field. On 2012 June 09 the weather and seeing conditions prevented us from detecting the system.
Photometric frames were taken on 2014 June 30 with the 10.4-m GTC telescope. Four 180 s -band exposures were taken with the Optical System for Imaging and low-Intermediate-Resolution Integrated Spectroscopy (OSIRIS) with an average seeing of 0.8″. This instrument covers a FoV in imaging mode with a plate scale of 0.254″ pix-1 (binning ). As before, the images were de-biased and flat-fielded following standard procedures in IRAF. The reduced images were aligned and combined in order to detect the faint quiescent counterpart to MAXI J1659152 with a higher signal-to-noise ratio. We then obtained PSF photometry on both the average and individual frames.
2.3 Photometry from Chile
We obtained -band images with the Gemini Multi-Object Spectrograph (GMOS) mounted on the 8-m GS situated in Cerro Pachón on 2013 April 13 and May 04. The observations were performed with the EEV detectors which had a pixel scale of 0.073″ pix-1 covering a FoV of and a seeing better than 0.7″.
We also obtained -band images with the 8-m VLT situated on Cerro Paranal on 2013 June 06 and 2015 June 12. We used the FOcal Reducer and low dispersion Spectrograph (FORS2) which provides a FoV of and a scale of 0.25″ pix-1 (binning ). The 2015 frames were taken in imaging mode and standard resolution collimator whereas the images taken in 2013 correspond to the acquisition frames of long-slit spectroscopy (see Torres et al., in preparation for more details).
We again reduced the GS and VLT images in the standard way with tasks
on IRAF and performed PSF photometry in both the single and
the average images. The source is only detected in six
of the 11 VLT frames obtained in 2015 due to the combination of poor
seeing (1.3″on average) and high airmass (>1.5).
The 2013 data had 0.7″seeing.
2.4 Calibration of the data
Table 1 lists all the data obtained in different bands and photometric systems. In order to calibrate the data, we searched for calibrated stars in our field in different public surveys. In our search we only found the star C1 [, ] in the AAVSO Photometric All-Sky Survey (APASS, Henden et al. 2009) with magnitudes and . Given the large uncertainty on the -band magnitude, we decided to calibrate this band with the check stars published by Kong (2012) in his so called epoch 1 (hereafter labelled as K1 and K2), with derived -band magnitudes and , respectively. We calibrated the -band magnitudes of the comparison stars listed in Table 2, by obtaining a weighted average offset between our instrumental and the calibrated magnitudes. Thus, we derivate for C1. We adopted the C1 -band value given in APASS survey since Kong (2012) did not obtain images in this band. The magnitudes of all the local standards in both bands are listed in Table 2. We then derived the equivalent - and -band magnitudes of all the local comparisons applying the transformation equations given by Jordi et al. (2006).
| ID | ||
|---|---|---|
| C1 | ||
| C2 | ||
| C3 | ||
| C4 | ||
| C5 | ||
| C6 | ||
| D1 | ||
| D2 | ||
| D3 | ||
| D4 | ||
| D5 | ||
| D7 | ||
| D8 |

3 Results
In Figure 2 we show the light curve of MAXI J1659152 covering the evolution since its 2010 outburst until 2015. It contains all the photometric data listed in Table 1 together with the photometry published by D’Avanzo et al. (2010), Gorbovskoy et al. (2010), Kong et al. (2011) and Kong (2012). In the bottom part of the figure, we added the acronyms of the telescopes used to obtain the data, using the same colour code as the photometric points. Our images taken with MER on 2011 May 30-31 (JD 2455714-5) were close to the peak of the X-ray rebrightening reported by Homan et al. (2013) (JD 2455700).
3.1 H emission in outburst
On 2011 August 28 we obtained, quasi-simultaneous (45 min) , and H images of the field containing MAXI J1659152 with the WHT. The H emission in XRTs is produced in the accretion disc, which dominates the optical spectrum during the outburst in nearly all X-ray binaries.
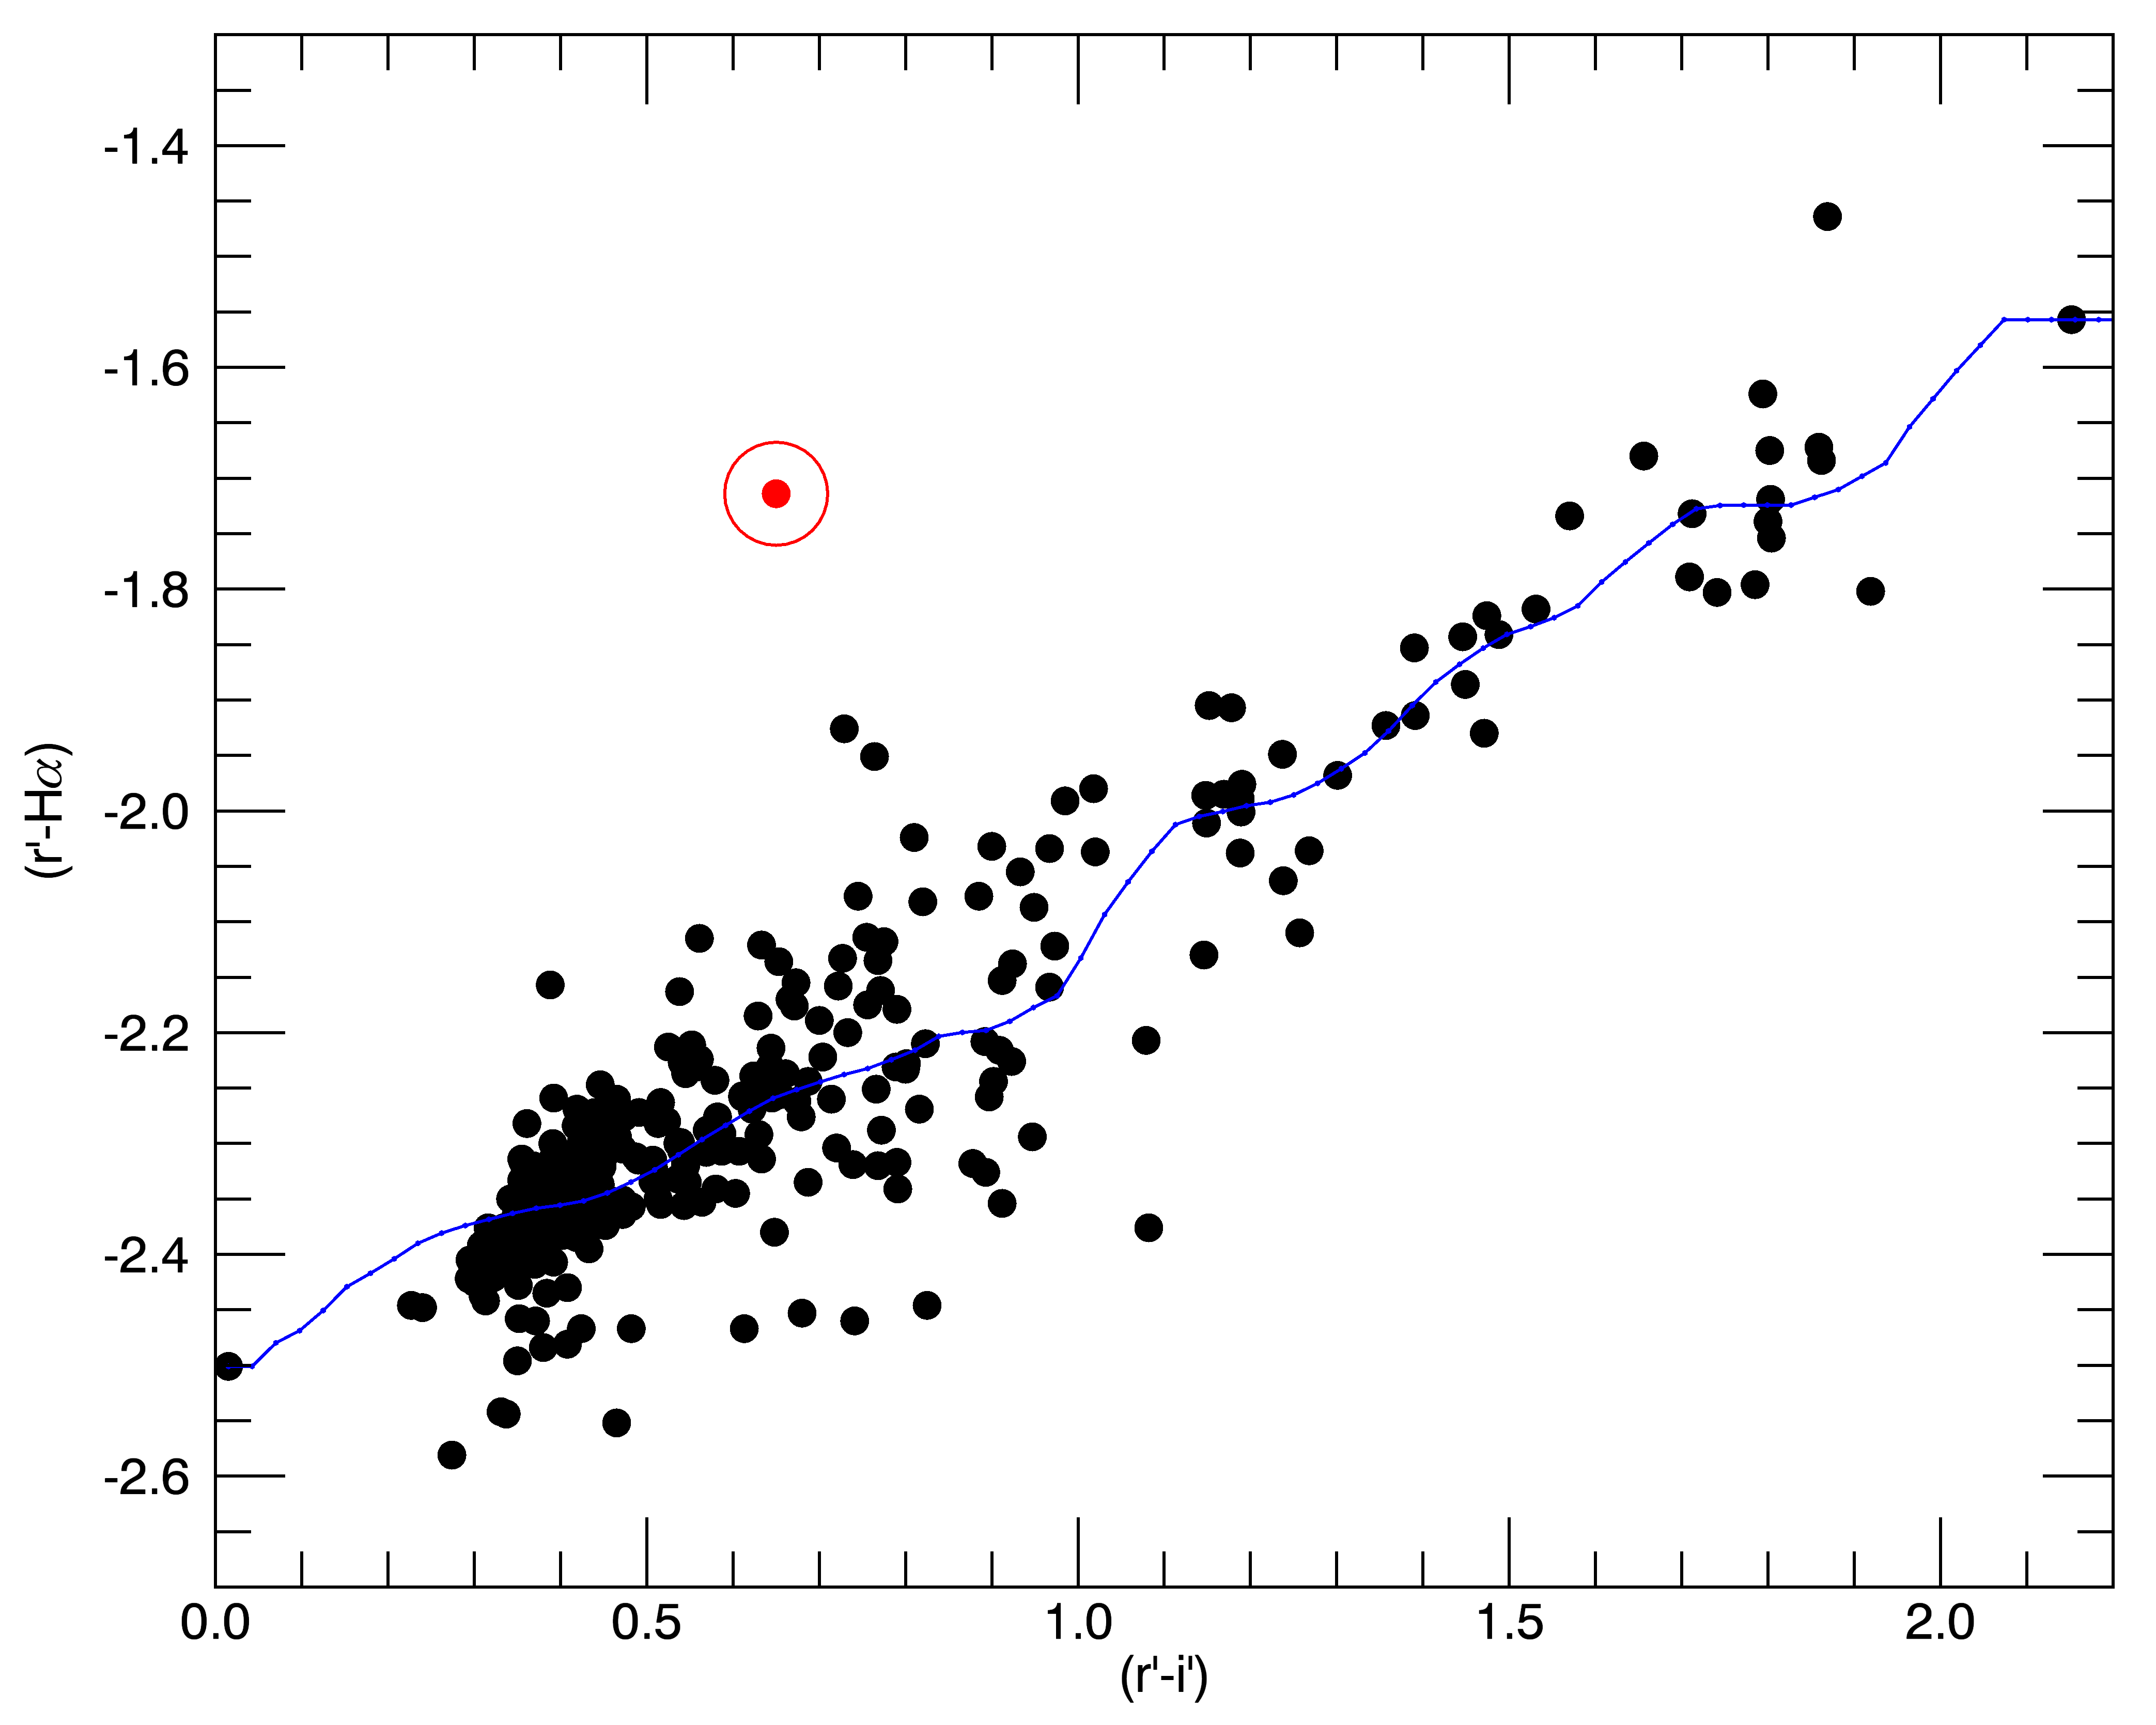
With the instrumental magnitudes obtained in the above bands, we examine an () vs () diagram. This has been used not only as a very efficient way to distinguish among different populations in the Galactic plane (see e.g. Drew et al. 2005; Corradi et al. 2008, 2010; Wevers et al. 2016) but also to identify the missing optical counterpart of BH candidates (Zurita et al. 2015). Figure 3 shows the uncalibrated () vs () diagram of all the stars observed in the detector FoV and detected in all three filters. The blue solid line is calculated as the running median of the () colour of nearly all the observed stars in the field, providing a reference ()0 colour such that all objects with values above it will have an H excess. The optical counterpart of MAXI J1659152 (encircled in red) shows a clear H excess.
From the colour-colour diagram (Figure 3), it is possible to estimate the equivalent width of the H line [EW(H)]. To do so, we first need to obtain the H excess emission (H) defined as the difference between the observed ()obs colour of a star, and the reference value ()0 at the same ()0 colour. Then, the equivalent width EW(H) can be derived from equation 4 in De Marchi et al. (2010):
| (1) |
where RW is the rectangular width of the filter in Å (see e.g. De Marchi et al. 2010 and Beccari et al. 2014 for more details). To derive RW, we normalized to unity and resampled the H filter profile to 1 Å and measured its equivalent width, obtaining a value of Å. Thus, with the equation above, we obtained EW(H) Å for MAXI J1659152.
3.2 Time series analysis
To search for a periodic modulation we performed a Lomb-Scargle analysis (Lomb 1976; Scargle 1982) on the data acquired on 2011 May 30 and 31, June 02, 06 and 28. These nights were chosen as they have the best time coverage over the shortest baseline. Differential photometry of MAXI J1659152 was performed with C4 and then detrended by subtracting the mean value of each night. Analysis was performed using the astropy.stats.LombScargle package.
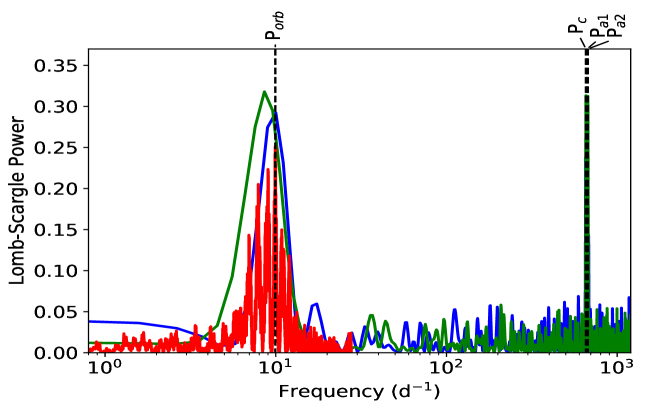
Figure 4 shows the resulting periodogram of the full dataset, as well as the periodograms of the data from the nights of the 2011 May 30 and 31. In all instances the initial frequency space searched was determined by a heuristic technique to optimise the frequency baseline searched and the grid spacing. A clear peak is seen in all the periodograms at , consistent with that reported by Kuulkers et al. (2013). The periodogram of the full dataset, shown in red, has a complex structure due to the window function of the data (i.e. the gaps between the observations), whereas the corresponding peaks in the periodograms of the individual nights are broad, reflecting the fact that we are at the limit of the range of periods in a single night of observations. These periodograms also have strong peaks at 656, 666 and 673 d-1, corresponding to the beat period of the duration of the observations, and once and twice the actual period, respectively.
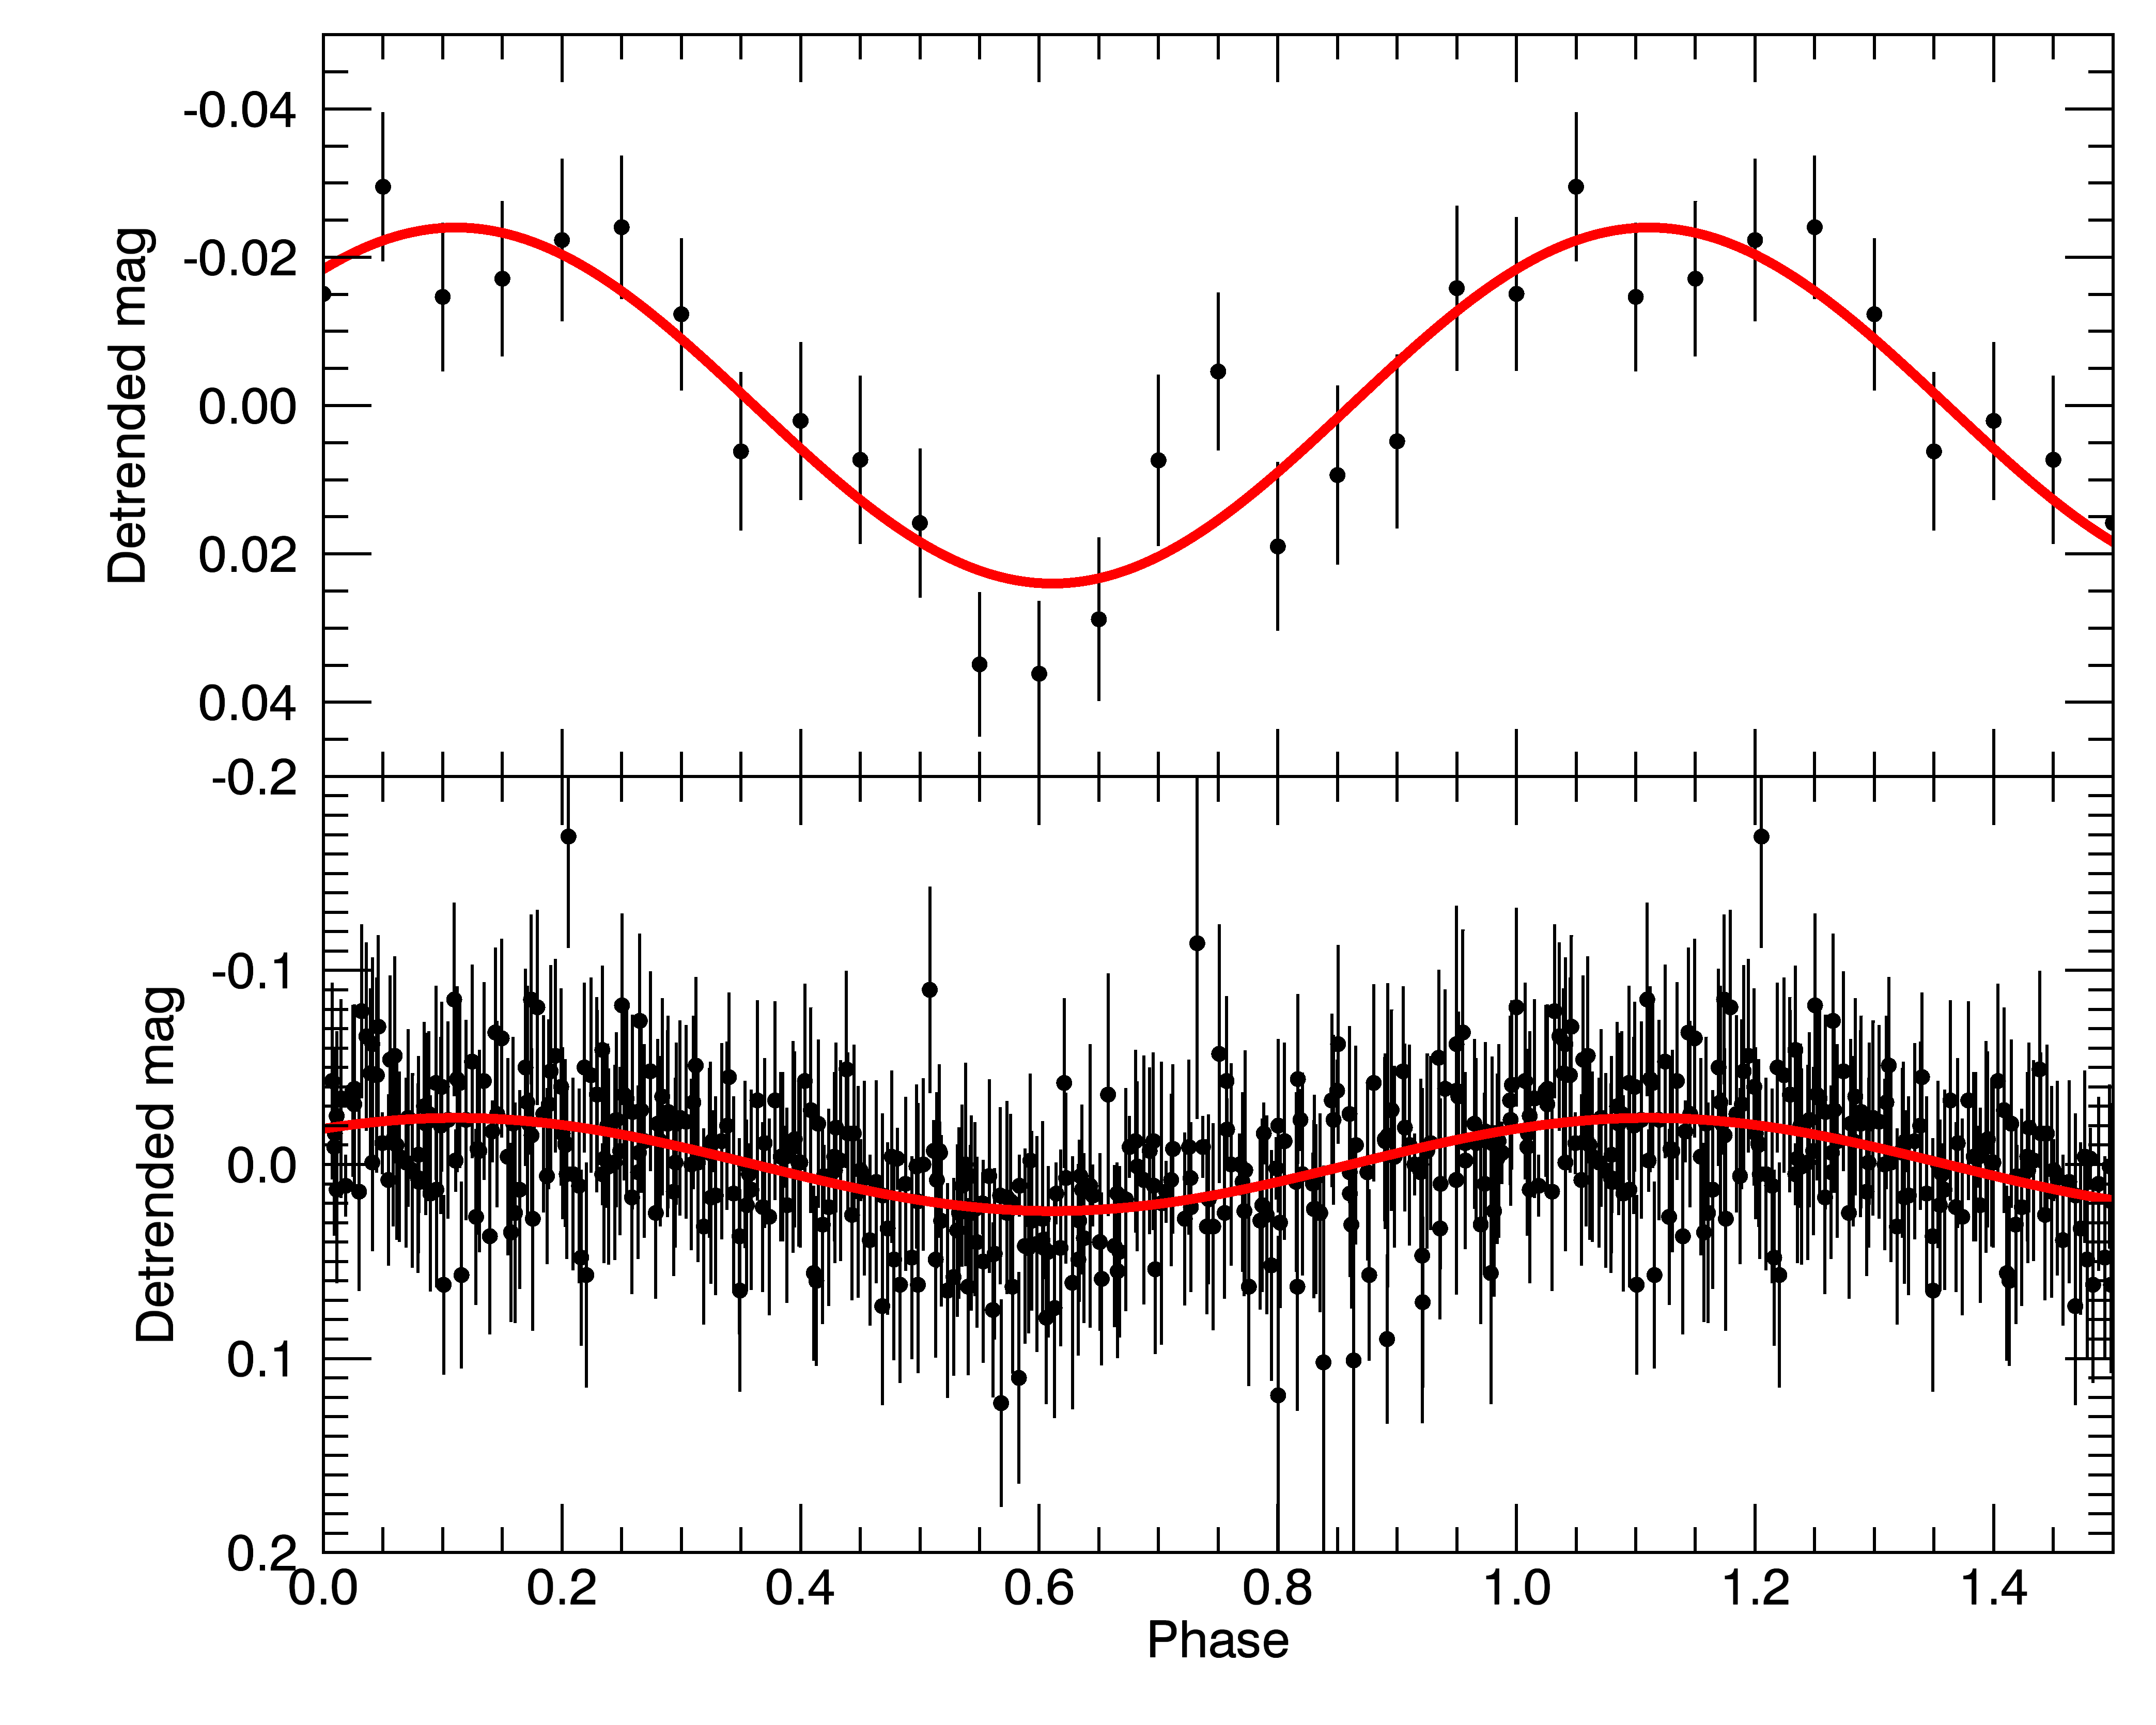
The uncertainty on the orbital period was determined via a bootstrap technique: 1000 artificial light curves of MAXI J1659152 were generated by sampling with replacement from the original dataset. The period was then estimated by performing a least squares fit of a simple sine wave to the data. Whilst we recognise that Lomb-Scargle analysis can be considered as a form of least squares fitting (see the review of the Lomb-Scargle periodgram by van der Plas 2017), the resulting structure of the window function on the periodogram makes determining the error on the period via Lomb-Scargle analysis difficult as we probe a discrete grid of frequencies. By performing a least squares fit, we can search a more continuous distribution of frequencies. The histogram of the frequencies determined from the artificial light curves is well described with a Gaussian with mean 9.938 d-1 and standard deviation 0.003 d-1. This corresponds to a period of 2.41490.0006 h. Figure 5 shows the complete dataset, folded on the determined period, along with a best fit sine wave, with frequency fixed to that determined by this analysis and amplitude free to vary.
This is the first detection of periodic optical variability in MAXI J1659152. The consistency between the X-ray period (i.e. h) and the periodicity found at optical wavelengths strongly suggests that the optical variability is due to X-ray irradiation of the donor star and not to a superhump modulation. The latter is due to the formation of an eccentric and precessing accretion disc during outburst (Whitehurst & King, 1991). Given the orbital period, we can estimate the period of the superhump modulation using the empirical relation derived by Patterson et al. (2005):
| (2) |
where stands for the superhump period and for the mass ratio of the binary, where and are the mass of the secondary star and compact object, respectively. For an M5 V donor star, ranges between 0.15 and 0.25 M☉ (Kuulkers et al. 2013; see also section 4). On the other hand, Molla et al. (2016) proposed a BH mass between 4.7 and 7.8 M☉, depending on their models. These values imply , which together with , yield h - adopting instead a canonical 10 M☉ BH, is between 2.421 and 2.425 h for the range of mentioned above. The light curve folded with the 2.4149 h period (Figure 5) shows a single-humped modulation with maximum brightness occurring at T0=JD 2455713.62643123. Assuming that this takes place at at orbital phase 0.5 (when the irradiated face of the donor star is best visible to the observer), we constrain the phase of the X-ray dips to be .
3.3 Study of the companion star in quiescence
Kong et al. (2010) found a quiescent optical counterpart in a pre-outburst Pan-STARRS 3Pi Survey image with . However, Kennea et al. (2010) proposed that it was not the real counterpart since it was brighter than expected in the context of the Shahbaz & Kuulkers (1998) relation (Equation 3). Kong (2012) reported that the object dropped in brightness down to showing variations of mag in 30 min interval. However, Kuulkers et al. (2013) discarded this counterpart and supported the line-of-sight scenario.
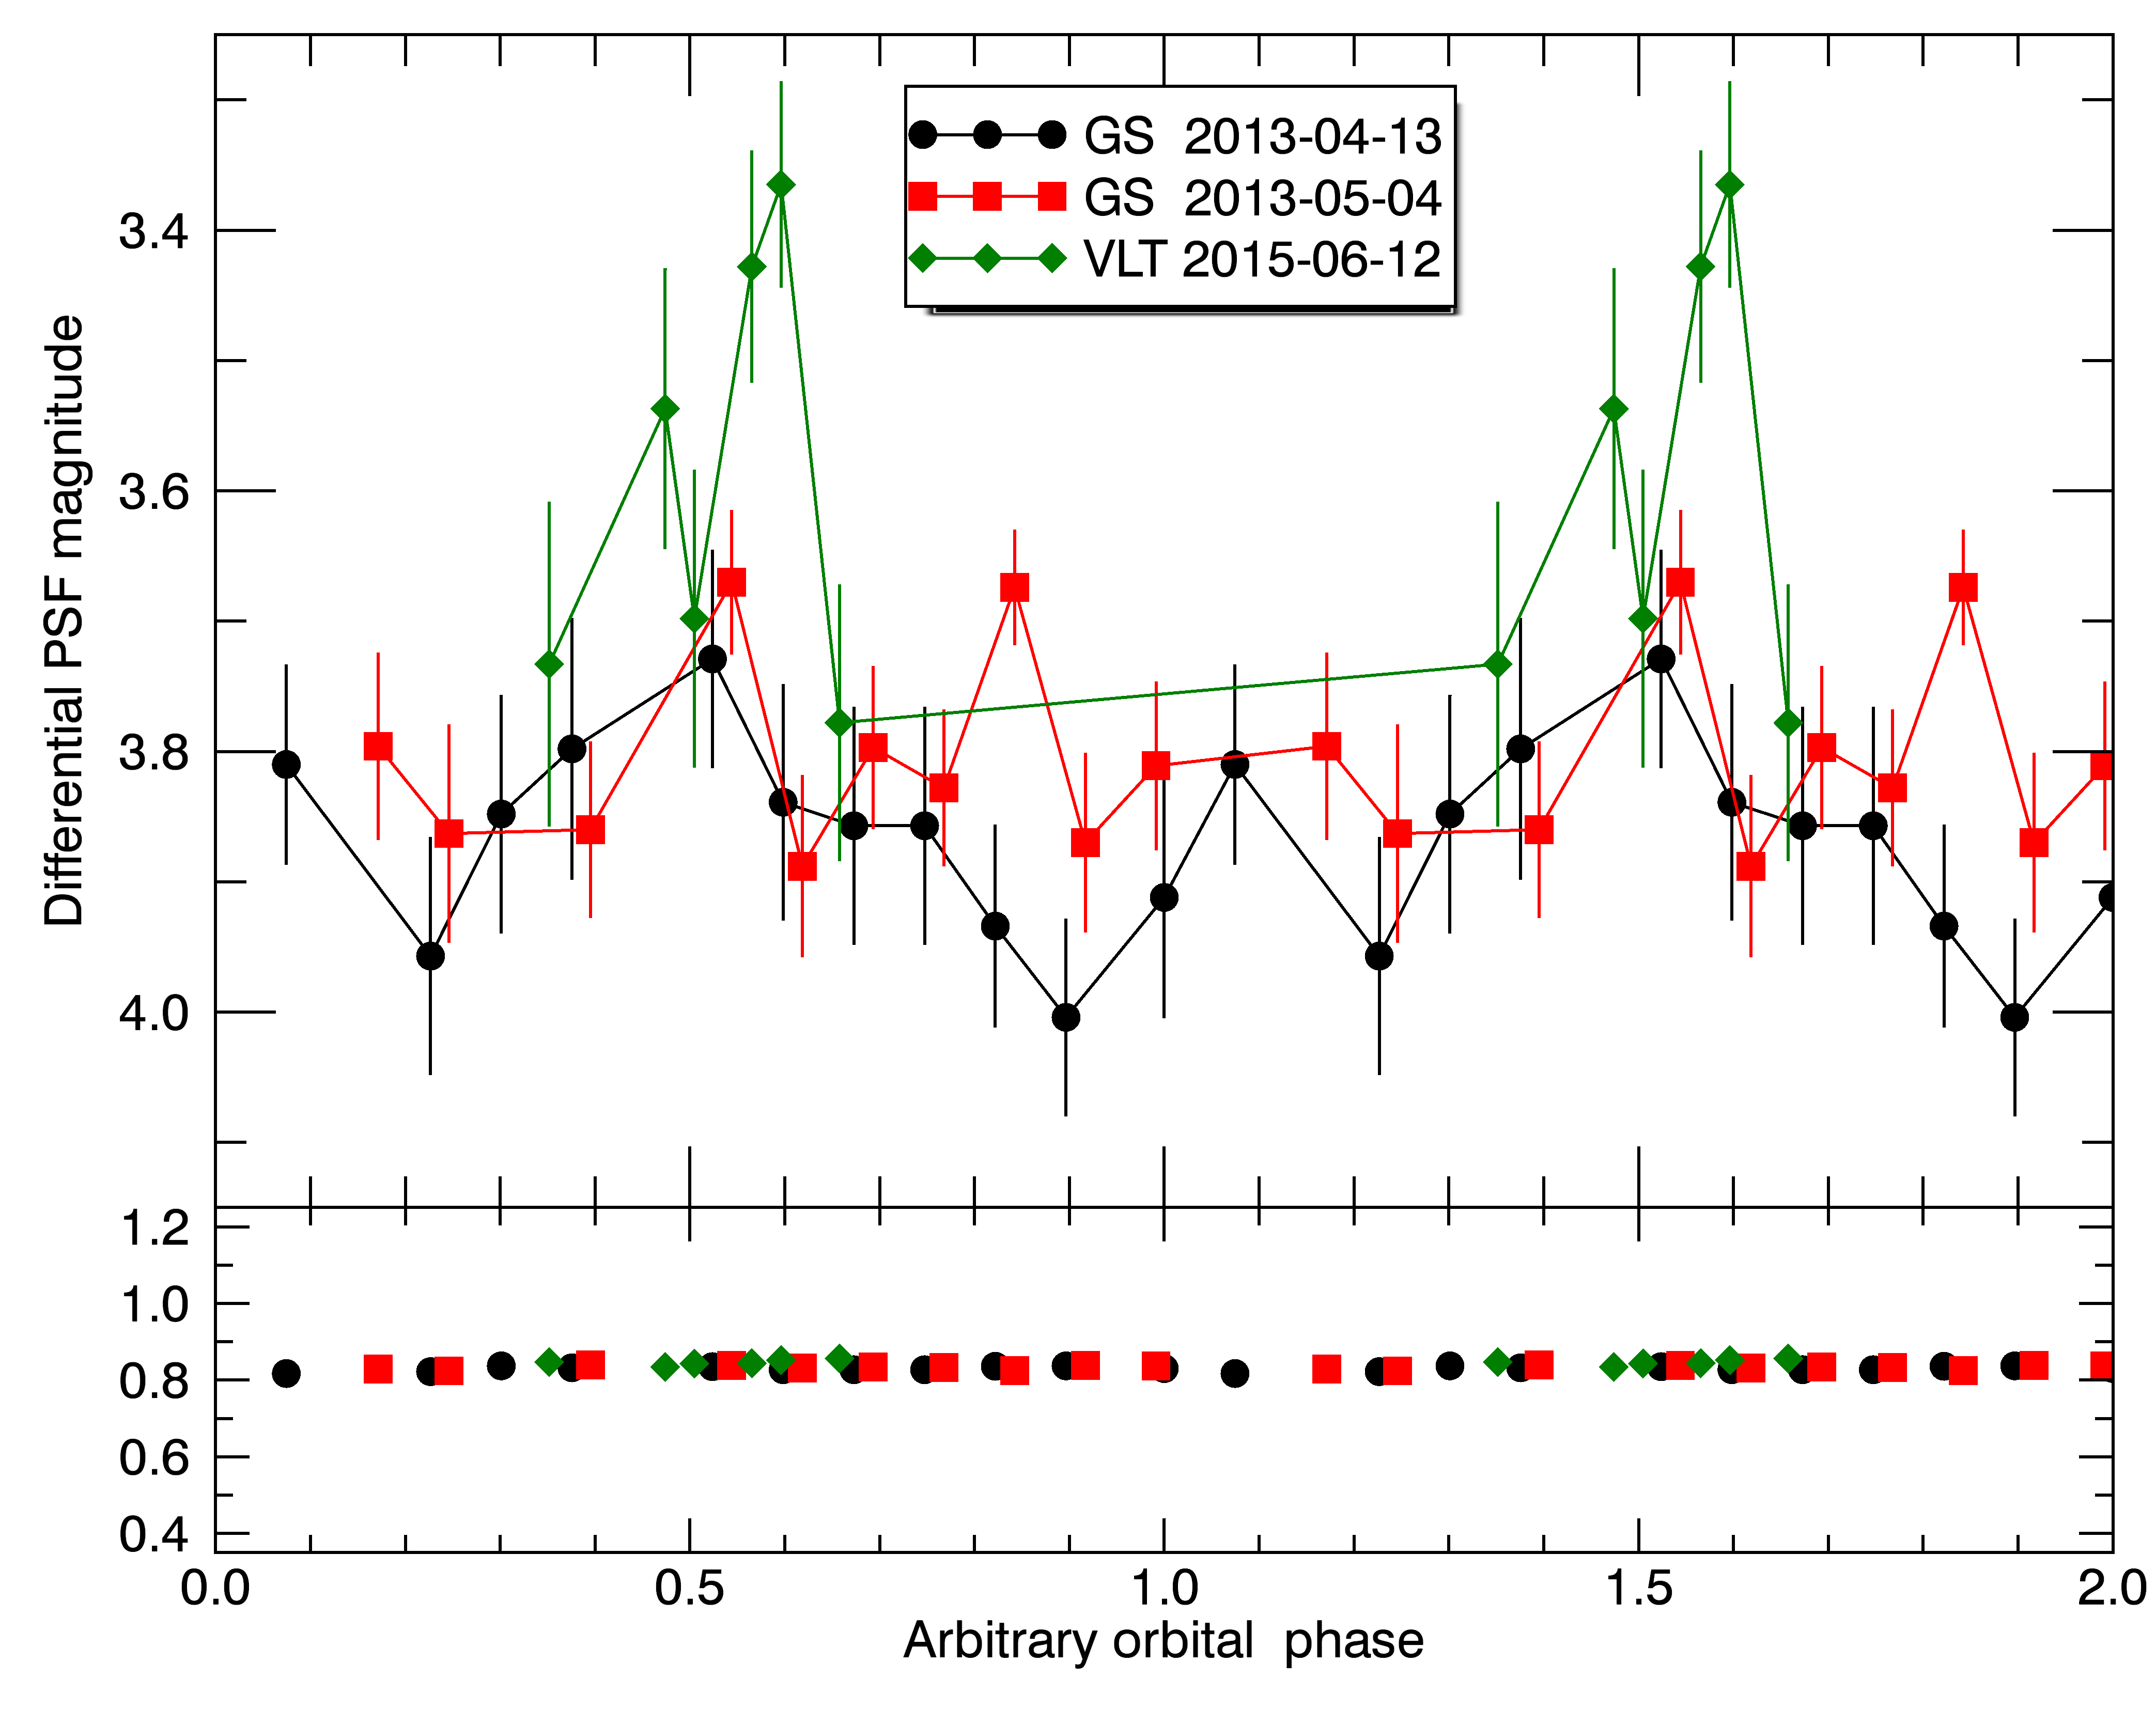
In 2014, we obtained optical photometry of MAXI J1659152, almost four years after the outburst. We clearly detect the system with a magnitude of in the -band with GTC. This suggests that the system reached its true quiescent state, as shown by the trend in Figure 2, between 2012 and 2014. In addition, we obtained images in the -band with GS in 2013 (two nights covering h each) and -band images with VLT in 2013 and 2015 (the latter covering 0.74 h). On 2013 April 13 and May 04, we observed MAXI J1659152 with GMOS-S obtaining 11 and 10 useful frames in each night, respectively. During the h of nightly coverage, the system displays optical variability with root mean square (RMS) of 0.2 mag and maximum amplitude of 0.3 mag (see Figure 6). On 2013 June 06, two images were acquired with FORS2 at VLT (see Torres et al. in prep.). From these images we obtained an average magnitude . In 2015, the system is only detected in 6 out of 11 images, with an average magnitude . The individual exposures show variability of up to 0.35 mag with an RMS of 0.14 mag, which is consistent with the variability shown in the GS data taken two years earlier (see Figure 6).
The photometric variability observed during quiescence is consistent with fluctuations produced by the relative contribution of the accretion disc, since the time coverage by the VLT data (0.74 h) represents only a third of the orbit and do not seem to follow a sinusoidal pattern. This activity is not surprising and has been reported in many others XRTs. Thus, Zurita et al. (2003) found variability of up to 0.6 mag independently on the orbital phase. However, the quality of the data does not allow us to establish robust conclusions about this scenario.
We also obtained near-infrared photometry with WHT. Due to the variable seeing, the quiescent counterpart was only detected in the -band images taken on 2014 July 20, with an average magnitude of .
4 Discussion
The presence of an interloper star was suggested to reconcile the short of MAXI J1659152 with the amplitude of the outburst () given by the Shahbaz & Kuulkers (1998) relation:
| (3) |
where and stand for the quiescent and outburst magnitudes in the -band, respectively. Thus, for a 2.4 h orbital period, Kennea et al. (2011) derived a quiescent counterpart of while Kuulkers et al. (2013) derived (corrected by inclination effects; Miller-Jones et al. 2011). Both authors used mag at the peak of the outburst (Kennea et al., 2011; Russell et al., 2010). However, Equation 3 is an empirical relation valid for systems with h but which also may break down for h, considering that the system with the shortest orbital period found at that time was GRO J0422+32 with h (Gelino & Harrison, 2003). Since then, an increasing number of short orbital period XRTs have been discovered: XTE J1118+480 ( h; Zurita et al. 2002a; Torres et al. 2004), Swift J1753.50127 ( h; Zurita et al. 2008) and Swift J1357.20933 ( h; Corral-Santana et al. 2013). None of these follow Equation 3 because they have quiescent magnitudes much brighter than predicted by the Shahbaz & Kuulkers (1998) relation. Consequently, we suggest that the Shahbaz & Kuulkers (1998) relation breaks down at short orbital periods, which is specially relevant in MAXI J1659152, the BH candidate with the shortest orbital period detected so far.
Kaur et al. (2012) found a double-peaked H emission line in two spectra obtained at the onset of the outburst. They measured EW(H Å, consistent with values reported for similar systems in outburst (see e.g. Torres et al. 2002). We obtained an EW(H) Å from the colour-colour diagram during the decay (see Section 3.1), when the system was mag, more than 5 mag fainter than at the peak of the outburst. This difference in the EW is probably caused by the change in the continuum of the spectra during the evolution of the outburst. The detection of the clear H excess (Figure 3) when the system was only 1 mag brighter than in quiescence, together with the variability seen in quiescence (Figure 6), clearly indicates that the counterpart proposed by Kong (2012) is the true optical counterpart of MAXI J1659152, ruling out the interloper star.
From the light curve of MAXI J1659152 (Figure 2), it is not possible to establish the time when the source reached its optical quiescent level. Our photometry taken with the INT on 2012 June 08 (JD 2456086) about 2.5 months after Kong 2012’s observations (JD 2456009), shows that the counterpart faded to , i.e. an average rate of mag-per-month. After that, the system brightness decreased to on 2014 June 30 (JD 2456838). Assuming that the brightness of the system continued dropping constantly at that rate, MAXI J1659152 would have reached by July 2012. In addition, our and band photometry, taken with GS and VLT (in 2013 and 2015) in three different nights, show that the system reached (). The average magnitude shown in these datasets are compatible within errors and show no trend between the two epochs. Thus, from the analysis of the , and band magnitudes, quiescence at optical wavelengths is reached between July 2012 and April 2013, i.e., 660 d after the beginning of the X-ray outburst.
On the other hand, MAXI J1659152 reached its nearly quiescent X-ray
level 220 d after the outburst onset (see figure 4 in
Homan
et al. 2013 and Figure 2).
However, a bright X-ray reflare occurred between JD 2455700 and
JD 2455800 (240 d after the beginning of the outburst).
MAXI J1659152 returned to its quiescent X-ray level 100 d after
the end of the re-flare activity (i.e. 300 d after the
outburst was detected). This is almost a year before quiescence
is reached at optical wavelengths. It is difficult to pin down the
quiescence in X-rays due to the limited sensitivity of the all-sky
monitors onboard X-ray satellites.
However, similar outburst light curve evolution was observed, e.g.,
after the 2015 June
outburst of V404 Cyg when the system reached the quiescent state
in X-rays between 2015 August 5 and August 21 (Sivakoff et al., 2015),
while in the optical the system reached this level only between 2015
October 10 and 15 (Bernardini et al., 2016).
One possible explanation for the long time needed by MAXI J1659152 to reach
optical quiescence is, perhaps, that the cooling
time of the donor
and irradiated disc at optical wavelengths is long, while the X-rays
coming from the central region of the accretion disc had reached
a stable quiescent level much sooner.
This behaviour might happen in all or many black hole transients
in outburst and with MAXI J1659152 being one of the first observational
evidences for it.
In order to constrain the spectral type of the companion star,
we must analyse the relative stellar and disc contributions
of the star and disc
to the total light. For this, we need the unreddened flux of
MAXI J1659152 in quiescence. Kuulkers
et al. (2013) reported an
=0.26 using the estimated Galactic HI density
( cm-2)
given by Kalberla et al. (2005) in the direction of the source.
Kaur
et al. (2012) obtained =0.32, consistent with the
=0.34 (D’Avanzo et al., 2010) obtained by using
cm-2
published by Kennea et al. (2010), although this was later
observed to vary with the stages of the outburst
( cm; Kennea
et al. 2011).
This variety of reddening is not surprising since MAXI J1659152 is a dipping source, which can often show large changes in
their internal absorption and might lead
to systematic errors in the distance (see e.g. Jonker &
Nelemans, 2004).
Thus, for the sake of our analysis, we adopt =0.26
(Kuulkers
et al., 2013).
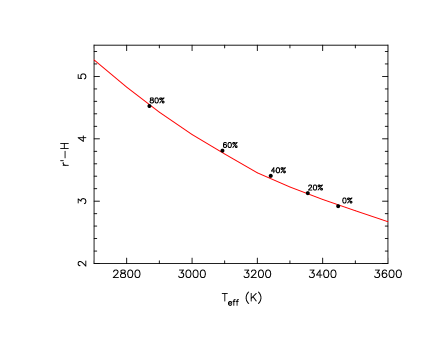
In Figure 7 we show the the () colour versus effective temperature for NextGen model atmospheres 222https://phoenix.ens-lyon.fr/Grids/NextGen/COLORS/. We also show the de-reddened colours of MAXI J1659152 allowing for the accretion disc contamination to the observed flux. We first de-reddened the observed magnitudes of MAXI J1659152 using =3.1 (Cardelli et al., 1989), which results in reddening values of 0.68 and 0.15 mag in the and -bands, respectively. We then allow for different amounts of accretion disc contamination to the observed fluxes assuming a power-law of the form , as observed in X-ray binaries (Shahbaz et al., 1996). The power-law index is typically in the range -1 to -3 and here we assume a value of -2.0. In Figure 7 we show the results for different -band disc contaminations. Assuming there is no disc contamination, the observed colours imply a companion star with K. This is an upper limit because, as in other X-ray systems, the observed light is likely contaminated by accretion disc emission. For short-orbital period systems such as GRO J0422+32, this could represent up to 60% of the total light (Filippenko et al., 1995). Assuming an index of and 60% -band contamination we find a secondary star with K. Allowing for disc power-law indices of –1 and –3 gives K and K, respectively. Therefore, we expect the spectral type of the secondary star to lie in the range M2 to M5 (Pecaut & Mamajek, 2013).
Kuulkers et al. (2013) obtained M☉ and M☉ using the Smith & Dhillon (1998) relation, which correspond to M5 V if the star is on the main-sequence. On the other hand, Jonker et al. (2012) favour an M2 V star over the M5 V because the latter would only be consistent with the 4 kpc lower limit on the distance if the accretion disc is dominating the optical light. In fact, the optical variability found in the VLT -band images could be explained as due to a large contribution of the accretion disc in this band, which would favour an M5 V spectral type of the companion star. However, it is also well known that stars in cataclysmic variables and X-ray binaries often deviate from main-sequence and tend to be overluminous for their masses and colors, which would imply a hotter spectral type.
5 Conclusions
We present optical and infrared data of the evolution of MAXI J1659152 during its 2010 outburst, decay and quiescence, analysing more than 400 images covering 5 years of photometric data.
-
(i)
Combining several observational campaigns of MAXI J1659152 to monitor the decay towards quiescence we obtained the first optical confirmation of the h orbital period. This value is in perfect agreement with that obtained by Kuulkers et al. (2013) analysing the X-ray dips, confirming MAXI J1659152 as the BH XRT with the shortest orbital period hitherto. The light curve folded with the orbital period is single hump and likely produced by X-ray irradiation of the donor star. Assuming that the maximum of the light curve occurs at phase 0.5, the outburst X-ray dips would have occurred at phase 0.65.
-
(ii)
In addition, we investigated a () vs () diagram with all the stars in the field. In this diagram, the optical counterpart of MAXI J1659152 during its outburst decay is clearly detected above the main stellar locus, implying a large H excess.
-
(iii)
We also determined optical quiescent magnitudes of MAXI J1659152: , and . Combining the colour together with a model of stellar atmospheres and assuming a 60% accretion disc contamination to the observed -band fluxes, we find a secondary star in the range M2 to M5. This range of spectral types are in agreement with those reported by Kuulkers et al. (2013) and Jonker et al. (2012).
Acknowledgements
We thank the anonymous referee for the useful comments.
JMC-S acknowledges partial support from CONICYT-Chile through the FONDECYT
Postdoctoral Fellowship 3140310. MAPT acknowledges support via a
Ramón y Cajal Fellowship (RYC-2015-17854). TS acknowledges support
by the Spanish Ministry of Economy and Competitiveness (MINECO)
under the grant AYA2013-42627. JC acknowledges support by the
Leverhulme Trust through the Visiting Professorship grant VP2-2015-04.
TMD acknowledges support via a Ramón y Cajal Fellowship (RYC-2015-18148)
FEB acknowledges support from CONICYT-Chile grants Basal-CATA PFB-06/2007,
FONDECYT Regular 1141218 and the Ministry of Economy, Development and
Tourism’s Millenium Science Initiative through grant IC120009, awarded to
The Millenium Institute of Astrophysics, MAS. PGJ acknowledges support
from the European Research Council (ERC CoG-647208).
This article is based on observations made with several telescopes
installed in the Spanish Observatorio del Roque de los Muchachos of
the Instituto de Astrofísica de Canarias, in the island of La Palma.
MER is operated by the Flemish Community whereas the INT, WHT and their
service programme are operated by the Isaac Newton Group of telescopes.
The Faulkes Telescope Project is an education partner of Las Cumbres
Observatory. The Faulkes Telescopes are maintained and operated by LCO.
Based on observations
collected at the European Organisation for Astronomical Research in the
Southern Hemisphere under ESO programmes 091.D-0865(A) and 095.D-0973(A).
Based on observations obtained at the Gemini Observatory (under program ID
GS-2013A-Q-58), which is operated by the Association of Universities for
Research in Astronomy, Inc., under a cooperative agreement with the
National Science Foundation (NSF) on behalf of the Gemini partnership: the
NSF (United States), the National Research Council (Canada), Comisión
Nacional de Investigación Científica y Tecnológica (Chile),
Ministerio de Ciencia, Tecnología e Innovación Productiva
(Argentina), and Ministério da Ciência, Tecnologia e
Inovação (Brazil).
References
- Alves et al. (2011) Alves F. O., Acosta-Pulido J. A., Girart J. M., Franco G. A. P., López R., 2011, AJ, 142, 33
- Beccari et al. (2014) Beccari G., De Marchi G., Panagia N., Pasquini L., 2014, MNRAS, 437, 2621
- Belloni & Motta (2016) Belloni T. M., Motta S. E., 2016, Astrophysics of Black Holes: From Fundamental Aspects to Latest Developments, 440, 61
- Belloni et al. (2011) Belloni T. M., Motta S. E., Muñoz-Darias T., 2011, Bulletin of the Astronomical Society of India, 39, 409
- Benn et al. (2008) Benn C., Dee K., Agócs T., 2008, in Ground-based and Airborne Instrumentation for Astronomy II. p. 70146X, doi:10.1117/12.788694
- Bernardini et al. (2016) Bernardini F., Russell D. M., Lewis F., 2016, The Astronomer’s Telegram, 8515
- Cadolle Bel et al. (2007) Cadolle Bel M., et al., 2007, ApJ, 659, 549
- Cardelli et al. (1989) Cardelli J. A., Clayton G. C., Mathis J. S., 1989, ApJ, 345, 245
- Corradi et al. (2008) Corradi R. L. M., et al., 2008, A&A, 480, 409
- Corradi et al. (2010) Corradi R. L. M., et al., 2010, A&A, 509, A41+
- Corral-Santana et al. (2013) Corral-Santana J. M., Casares J., Muñoz-Darias T., Rodríguez-Gil P., Shahbaz T., Torres M. A. P., Zurita C., Tyndall A., 2013, Science, 339, 1048
- Corral-Santana et al. (2016) Corral-Santana J. M., Casares J., Muñoz-Darias T., Bauer F. E., Martínez-Pais I. G., Russell D. M., 2016, A&A, 587, A61
- D’Avanzo et al. (2010) D’Avanzo P., Goldoni P., Patruno A., Casella P., Campana S., Russell D. M., Belloni T. M., 2010, The Astronomer’s Telegram, 2900, 1
- De Cia et al. (2010) De Cia A., et al., 2010, GRB Coordinates Network, 11302
- De Marchi et al. (2010) De Marchi G., Panagia N., Romaniello M., 2010, ApJ, 715, 1
- de Ugarte Postigo et al. (2010) de Ugarte Postigo A., Flores H., Wiersema K., Thoene C. C., Fynbo J. P. U., Goldoni P., 2010, GRB Coordinates Network, 11307
- Drew et al. (2005) Drew J. E., et al., 2005, MNRAS, 362, 753
- Filippenko et al. (1995) Filippenko A. V., Matheson T., Ho L. C., 1995, ApJ, 455, 614
- Gelino & Harrison (2003) Gelino D. M., Harrison T. E., 2003, ApJ, 599, 1254
- Gelino et al. (2006) Gelino D. M., Balman Ş., Kızıloğlu Ü., Yılmaz A., Kalemci E., Tomsick J. A., 2006, ApJ, 642, 438
- Gorbovskoy et al. (2010) Gorbovskoy E., et al., 2010, GRB Coordinates Network, 11314
- Henden et al. (2009) Henden A. A., Welch D. L., Terrell D., Levine S. E., 2009, in American Astronomical Society Meeting Abstracts #214. p. 669
- Homan et al. (2013) Homan J., Fridriksson J. K., Jonker P. G., Russell D. M., Gallo E., Kuulkers E., Rea N., Altamirano D., 2013, ApJ, 775, 9
- Jelinek et al. (2010) Jelinek M., et al., 2010, GRB Coordinates Network, 11301
- Jonker & Nelemans (2004) Jonker P. G., Nelemans G., 2004, MNRAS, 354, 355
- Jonker et al. (2012) Jonker P. G., Miller-Jones J. C. A., Homan J., Tomsick J., Fender R. P., Kaaret P., Markoff S., Gallo E., 2012, MNRAS, 423, 3308
- Jordi et al. (2006) Jordi K., Grebel E. K., Ammon K., 2006, A&A, 460, 339
- Kalamkar et al. (2010) Kalamkar M., et al., 2010, The Astronomer’s Telegram, 2881
- Kalamkar et al. (2011) Kalamkar M., Homan J., Altamirano D., van der Klis M., Casella P., Linares M., 2011, ApJ, 731, L2
- Kalberla et al. (2005) Kalberla P. M. W., Burton W. B., Hartmann D., Arnal E. M., Bajaja E., Morras R., Pöppel W. G. L., 2005, A&A, 440, 775
- Kaur et al. (2012) Kaur R., et al., 2012, ApJ, 746, L23
- Kennea et al. (2010) Kennea J. A., Krimm H., Mangano V., Curran P., Romano P., Evans P., Burrows D. N., 2010, The Astronomer’s Telegram, 2877, 1
- Kennea et al. (2011) Kennea J. A., et al., 2011, ApJ, 736, 22
- King et al. (1996) King A. R., Kolb U., Burderi L., 1996, ApJ, 464, L127+
- Kong (2012) Kong A. K. H., 2012, ApJ, 760, L27
- Kong et al. (2010) Kong A. K. H., et al., 2010, The Astronomer’s Telegram, 2976, 1
- Kong et al. (2011) Kong A. K. H., Yang Y. J., Wijnands R., 2011, The Astronomer’s Telegram, 3524
- Kuulkers et al. (2010a) Kuulkers E., Kouveliotou C., Chenevez J., van der Horst A. J., 2010a, The Astronomer’s Telegram, 2888
- Kuulkers et al. (2010b) Kuulkers E., et al., 2010b, The Astronomer’s Telegram, 2912
- Kuulkers et al. (2013) Kuulkers E., et al., 2013, A&A, 552, A32
- Lasota (2001) Lasota J.-P., 2001, New Astron. Rev., 45, 449
- Lewis et al. (2008) Lewis F., Russell D. M., Fender R. P., Roche P., Clark J. S., 2008, in VII Microquasar Workshop: Microquasars and Beyond. p. 69
- Lomb (1976) Lomb N. R., 1976, Ap&SS, 39, 447
- Mangano et al. (2010) Mangano V., Hoversten E. A., Markwardt C. B., Sbarufatti B., Starling R. L. C., Ukwatta T. N., 2010, GRB Coordinates Network, 11296
- Marshall (2010) Marshall F. E., 2010, GRB Coordinates Network, 11298
- Mata Sánchez et al. (2015) Mata Sánchez D., Muñoz-Darias T., Casares J., Corral-Santana J. M., Shahbaz T., 2015, MNRAS, 454, 2199
- Miller-Jones et al. (2011) Miller-Jones J. C. A., Madej O. K., Jonker P. G., Homan J., Ratti E. M., Torres M. A. P., 2011, The Astronomer’s Telegram, 3358
- Mirabel et al. (2001) Mirabel I. F., Dhawan V., Mignani R. P., Rodrigues I., Guglielmetti F., 2001, Nature, 413, 139
- Molla et al. (2016) Molla A. A., Debnath D., Chakrabarti S. K., Mondal S., Jana A., 2016, MNRAS, 460, 3163
- Muñoz-Darias et al. (2011) Muñoz-Darias T.and Motta S., Stiele H., Belloni T. M., 2011, MNRAS, 415, 292
- Naylor (1998) Naylor T., 1998, MNRAS, 296, 339
- Negoro et al. (2010) Negoro H., et al., 2010, The Astronomer’s Telegram, 2873, 1
- Paragi et al. (2013) Paragi Z., et al., 2013, MNRAS, 432, 1319
- Patterson et al. (2005) Patterson J., et al., 2005, PASP, 117, 1204
- Pecaut & Mamajek (2013) Pecaut M. J., Mamajek E. E., 2013, ApJS, 208, 9
- Russell et al. (2010) Russell D. M., et al., 2010, The Astronomer’s Telegram, 2884, 1
- Scargle (1982) Scargle J. D., 1982, ApJ, 263, 835
- Shahbaz & Kuulkers (1998) Shahbaz T., Kuulkers E., 1998, MNRAS, 295, L1
- Shahbaz et al. (1996) Shahbaz T., Smale A. P., Naylor T., Charles P. A., van Paradijs J., Hassall B. J. M., Callanan P., 1996, MNRAS, 282, 1437
- Shahbaz et al. (2013) Shahbaz T., Russell D. M., Zurita C., Casares J., Corral-Santana J. M., Dhillon V. S., Marsh T. R., 2013, MNRAS, 434, 2696
- Sivakoff et al. (2015) Sivakoff G. R., Bahramian A., Altamirano D., Beardmore A. P., Kuulkers E., Motta S., 2015, The Astronomer’s Telegram, 7959
- Smith & Dhillon (1998) Smith D. A., Dhillon V. S., 1998, MNRAS, 301, 767
- Stetson (1987) Stetson P. B., 1987, PASP, 99, 191
- Torres et al. (2002) Torres M. A. P., et al., 2002, ApJ, 569, 423
- Torres et al. (2004) Torres M. A. P., Callanan P. J., Garcia M. R., Zhao P., Laycock S., Kong A. K. H., 2004, ApJ, 612, 1026
- van der Horst et al. (2010) van der Horst A. J., Granot J., Paragi Z., Kouveliotou C., Wijers R. A. M. J., Ramirez-Ruiz E., 2010, The Astronomer’s Telegram, 2874
- van der Horst et al. (2013) van der Horst A. J., et al., 2013, MNRAS, 436, 2625
- van der Plas (2017) van der Plas J. T., 2017, preprint, (arXiv:1703.09824)
- Warner (1987) Warner B., 1987, MNRAS, 227, 23
- Wevers et al. (2016) Wevers T., et al., 2016, MNRAS, 458, 4530
- Whitehurst & King (1991) Whitehurst R., King A., 1991, MNRAS, 249, 25
- Yamaoka et al. (2012) Yamaoka K., et al., 2012, PASJ, 64, 32
- Zurita et al. (2002a) Zurita C., et al., 2002a, MNRAS, 333, 791
- Zurita et al. (2002b) Zurita C., et al., 2002b, MNRAS, 334, 999
- Zurita et al. (2003) Zurita C., Casares J., Shahbaz T., 2003, ApJ, 582, 369
- Zurita et al. (2008) Zurita C., Durant M., Torres M. A. P., Shahbaz T., Casares J., Steeghs D., 2008, ApJ, 681, 1458
- Zurita et al. (2015) Zurita C., Corral-Santana J. M., Casares J., 2015, MNRAS, 454, 3351