Monitoring the orientation of rare-earth-doped nanorods for flow shear tomography
Abstract
Rare-earth phosphors exhibit unique luminescence polarization features originating from the anisotropic symmetry of the emitter ion’s chemical environment. However, to take advantage of this peculiar property, it is necessary to control and measure the ensemble orientation of the host particles with a high degree of precision. Here, we show a methodology to obtain the photoluminescence polarization of Eu-doped LaPO4 nanorods assembled in an electrically modulated liquid- crystalline phase. We measure Eu3+ emission spectra for the three main optical configurations (, and , depending on the direction of observation and the polarization axes) and use them as a reference for the nanorod orientation analysis. Based on the fact that flowing nanorods tend to orient along the shear strain profile, we use this orientation analysis to measure the local shear rate in a flowing liquid. The potential of this approach is then demonstrated through tomographic imaging of the shear rate distribution in a microfluidic system.
Luminescent particles or molecules are widely used for labelling and tracking of small objects. Anisotropic emitters such as semi-conductor nanowires ref1 , quantum rods ref2 or organic dyes ref3 exhibit polarized luminescence, providing an additional sensitivity to the orientation ref4 . The polarization is, in most cases, dominated by the size and shape anisotropy of the emitter particle ref1 ; ref2 , which is understood within the quantum size effect and the electric field confinement effect on both the excitation and emission processes ref5 ; ref6 ; ref7 ; ref8 . The photoluminescence of rare-earth phosphors, however, shows a distinguished nature of emission polarization. The photoluminescence spectrum of lanthanide ions in a crystalline host matrix consists of many sharp peaks due to the multiple transition levels within the 4 configuration and their crystal-field splitting into degenerate sub- levels ref9 ; ref10 . Each sublevel emission is polarized along a particular direction allowed by the crystallographic symmetry. Consequently, the emission spectrum from a single crystal manifests variation of its line shape when the crystal’s orientation changes with respect to the direction of polarization analysis ref11 ; ref12 ; ref13 ; ref14 . This phenomenon is independent of the particle size and morphology, and is decoupled from the polarization of the usually indirect excitation, which is a crucial advantage for the orientation analysis when compared to the other types of anisotropic emitter.
A prerequisite for precise orientation analysis is to acquire the reference photoluminescence polarization components, which requires either working with a single crystal or achieving a uniform orientation of small crystallites. Here, we use liquid-crystalline (LC) self-assembly of monocrystalline LaPO4:Eu nanorods ref15 ; ref16 that exhibit polarized photoluminescence, as from a large single crystal. By electrically switching the orientation of the LC domain ref17 , in a manner similar to the approach by Galyametdinov et al. with organic lanthanidomesogens ref18 , polarized Eu3+ emission spectra could be selectively obtained for the three main configurations ( and , the radial propagations polarized perpendicular and parallel to the rod axis, respectively, and , the isotropic axial propagation). We show that the distinct -- line shapes allow us to determine the unknown three-dimensional rod orientation and also the collective degree of orientation of an ensemble of nanorods, thereby establishing a route to the in-situ study of rod-orientation dynamics.
We apply this method to measure the local shear rate in a flowing liquid that imposes the orientation of colloidally dispersed nanorods. The orientation of anisotropic objects under flow is a ubiquitous effect. The local orientation director and the order parameter are directly correlated with the principal direction and intensity of the shear rate ref19 ; ref20 . Accordingly, scanning and should allow one to retrieve the time-dependent shear rate distribution, which is of particular interest when studying microfluidic and biofluidic systems ref21 ; ref22 ; ref23 ; ref24 . The currently available particle imaging velocimetry (PIV) technique, which measures the flow velocity profile by tracking the displacements of fluorescent microspheres ref25 ; ref26 , requires heavy accumulation and post-treatment of image frames. This limits access to the local real-time observation of dynamic systems. Moreover, the signal-to-noise ratio and the spatial resolution of PIV deteriorate when the principal interest is in shear (gradient of velocity). Our approach aims to achieve direct measurement and fast scanning of the local shear rate by instantly detecting the collective orientation of nanorods in a small focal volume. As a proof of concept, we demonstrate tomographic mapping of the shear distribution in a microfluidic channel using scanning confocal microscopy.
Polarized photoluminescence from assembled nanorods
Figure 1a presents polarized photoluminescence spectra from a nematic LC suspension of LaPO4:Eu nanorods modulated in an electro-optical cell. The most intense 5D0–7F1 (magnetic dipole) transition and the adjacent 5D0–7F2 (electric dipole) transition spectra, both consisting of multiple sublevel peaks, were collected under excitation of the 7F0–5L6 transition at 394 nm (the excitation spectrum is shown in Supplementary Fig. 3). An optical transmission microscopy image of the cell placed between crossed polarizers (Fig. 1b) shows a bright region exhibiting in-plane birefringence induced by the transverse rod alignment, as schematized in Fig. 1c, left. A uniform LC domain orientation was directed by shear strain applied during the capillary invasion of the viscous suspension into the 20-m-thick gap of the cell (for the cell geometry see Supplementary Fig. 1). The blue and red curves in Fig. 1a were obtained from this transverse region (dotted circle labelled ‘1’ in Fig. 1b) with an analyser perpendicular and parallel to the domain orientation, respectively. Considering the hexagonal symmetry of LaPO4:Eu, with the crystallographic axis parallel to the long axis of the rod ref27 , these two spectra correspond to the mutually orthogonal polarization components referred to as and configurations (Fig. 1d). The difference in their line shapes is due to the independent polarization of each sublevel emission originating from the crystal-field splitting ref9 . When the electric field was applied longitudinally in the cell gap (Fig. 1c, right), the nematic domain, initially in a transverse state, was switched to a homeotropic state where the birefringence vanished completely (dark square region in Fig. 1b) as a consequence of the rod alignment being along the field normal to the substrate plane. The α spectrum (green line in Fig. 1a) corresponding to the axial propagation (Fig. 1d) was obtained from this homeotropic region (dotted circle ‘2’ in Fig. 1b). In contrast to the and spectra, the spectrum was unchanged when rotating the analyser, because the axial symmetry of the crystal produces isotropic polarization contributions in the plane.
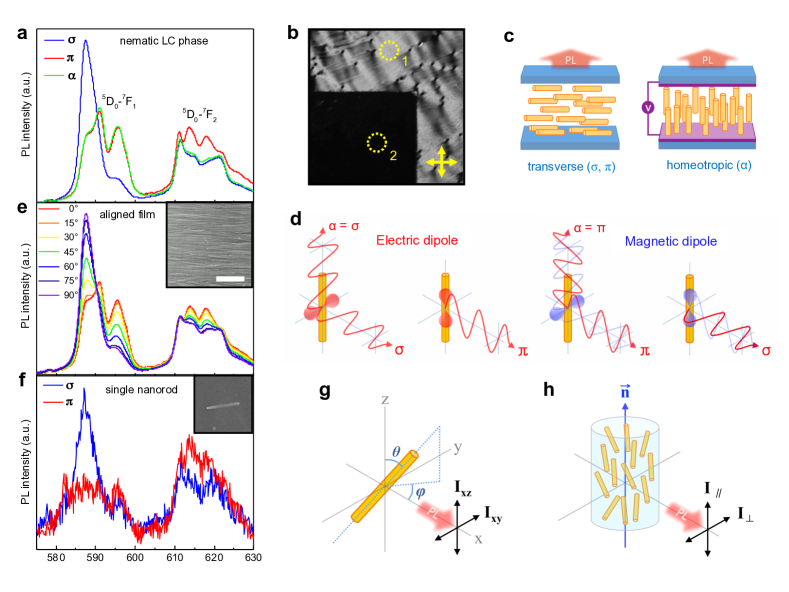
The and spectra were also confirmed with two different types of sample, where the rod orientation was directly observable by scanning electron microscopy (SEM). First, a thin film with transverse rod alignment (Fig. 1e, inset) was prepared by directed assem- bly of a nematic gel suspension ref28 . The polarized photoluminescence spectra observed from this solid film (Fig. 1e) with analyser angle perpendicular () and parallel () to the rod orientation are identical to the and spectra obtained from the LC sample (Fig. 1a). Moreover, the tendency of the line shape variation with supports that the polarization of the Eu3+ emission is subject to the uniaxial symmetry of the crystalline LaPO4 matrix. A peak deconvolution study of the 5D0–7F1 transition shows that the sublevel peak intensity as a function of closely fits the trigonometric equation , where and indicate the peak intensities in the and spectra (Supplementary Figs. 4–5). Furthermore, the polarized emission spectra taken from a single nanorod (Fig. 1f) show the same and spectral line shapes, verifying that the observed polarization behaviour originates exclusively from the intrinsic crystal structure and not from the collective effect of the assembled structure.
Three-dimensiontal orientation analysis
Note that the spectrum is identical to the spectrum in the (magnetic dipole) band and the spectrum in the 5D0–7F2 (electric dipole) band (Fig. 1a). This can be understood considering that the radiation electric field is parallel to the electric dipole and perpendicular to the magnetic dipole (Fig. 1d). This peculiar aspect of polarization offers the opportunity to measure the three-dimensional rod orientation precisely. Defining the rod orientation in the laboratory frame by the polar and azimuthal angles (Fig. 1g), it is possible to express the two measured polarized photoluminescence intensities and (the two indices refer to the axis of propagation and the axis parallel to the analyser, respectively) as functions of and . In the case of the magnetic dipole transition,
| (1) | ||||
| (2) |
where and indicate the relative intensities of the and configurations. By solving these equations simultaneously with their equivalents for the electric dipole transition (Supplementary Eqs. (4) and (5)), one can determine the set of without consideration of the absolute intensities. Errors that may occur with the overall signal fluctuation from any extrinsic parameter can be avoided in this ratiometric line shape analysis. When regarding an ensemble of nanorods that acquires a partial orientation toward a preferential direction (Fig. 1h), the order parameter, defined by , can be deduced from the following equations (written here also for the magnetic dipole transition):
| (3) | ||||
| (4) |
where and indicate the two polarized photoluminescence intensities perpendicular and parallel to . A complete description for obtaining (similar to the way of obtaining and for a single nanorod) and then and from a system with unknown is provided in Supplementary Section II.
Flow shear measurement
This capability to analyse the collective rod orientation was used to probe the local arrangement of nanorods induced by the shear flow. The stress-optical law describes the direct correlation between the shear rate () and , which is proportional to the induced flow birefringence () ref29 ; ref30 ; ref31 . Measuring allows us to deduce the value of and the related rheological parameters of fluids ref32 . The rheological properties of bulk fluids have often been studied in this way ref33 . However, so far, the stress-optical method has not been applicable to local measurements because birefringence is an integrated signal throughout the whole light pathway across the medium. Polarized photoluminescence, in contrast, enables a microscopic focal volume in the middle of the medium to be addressed. Local stress-optical analysis and three-dimensional mapping can therefore be attempted when taking advantage of the high sensitivity and resolution provided by confocal microscopy.
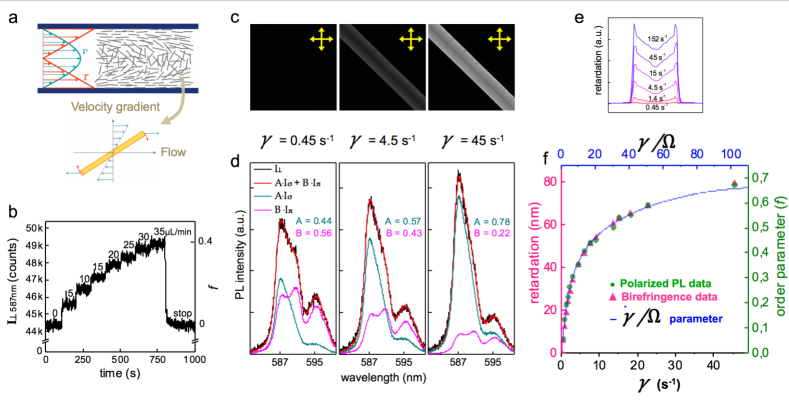
We first studied the flow of a dilute colloidal nanorod suspension in a capillary tube. Figure 2a schematically shows the general aspect of the rod orientation in a Poiseuille flow. Rods are highly oriented near the wall where a large shear stress (, where is the dynamic viscosity) is applied, and are disordered at the centre where approaches to zero. The photoluminescence spectrum observed from the whole capillary volume should be partially polarized in correlation with the average shear rate (), which is proportional to the flow rate. Figure 2b shows the intensity variation of a polarized photoluminescence emission peak ( = 587 nm, observed with an analyser perpendicular to the capillary) while increasing the flow rate in steps. The initially disordered nanorods start to orient when the suspension flows. The increment of is directly proportional to , according to Eq. (3). Even a very small change in the flow rate of 5 L min–1 ( mm s–1 in average velocity) produces an appreciable change in , ensuring the high sensitivity of the method.
To examine the validity of this polarized photoluminescence-based stress-optical measurement, it is necessary to compare it with the traditional method based on birefringence measurement. An experiment was implemented using a microfluidic channel with a rectangular cross-section, from which the photoluminescence and birefringence could be simultaneously observed. Figure 2c displays the gradual increase of flow birefringence when increasing the flow rate, which can be converted into . The corresponding polarized photoluminescence line shape, collected from a section of the channel volume with an analyser perpendicular to the flow direction, also changes towards the shape of the spectrum, implying higher with higher (Fig. 2d). The optical retardation (, where is the channel thickness) profiles across the channel width for different are shown in Fig. 2e. These profiles represent the integrated birefringence through the channel depth. The value at the channel centre is non-zero due to the contribution of shear at the top and bottom surfaces of the channel. This illustrates why local stress-optical analysis cannot be achieved by birefringence measurements alone. In Fig. 2f, the values averaged over the image plane are plotted (green circles) along with the values deduced from the line shape analysis of the polarized photoluminescence spectra (red triangles) collected over the same image plane. These two independently measured quantities display an identical evolution as a function of (bottom abscissa axis). An excellent agreement is also found with a theoretical calibration curve for (blue line) as a function of (top abscissa axis) ref34 when , the rotational diffusion coefficient, was set to be 0.5 s−1 for the best fitting. Theoretically, is given as
| (5) |
where is the Boltzmann constant, is the solvent viscosity, and and , respectively, are the half-length and equatorial radius of the particle ref20 . The value calculated with the measured viscosity and average nanorod size is 10 s−1, which is an order of magnitude greater than 0.5 s−1 from the calibration curve fitting. We estimate that the collective behaviour of nanorods with surface-charge-mediated long-range repulsive interactions or size polydispersity are responsible for such a difference.
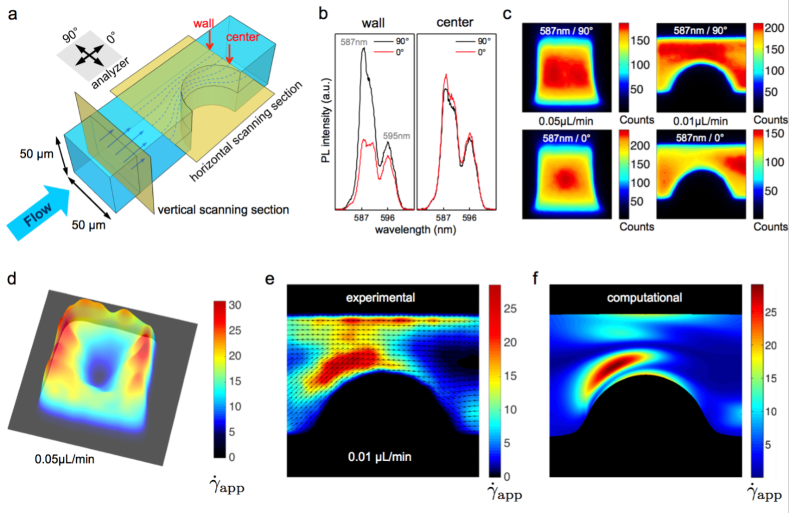
The above results guarantee a reliable stress-optical measurement by analysing the polarized photoluminescence of colloidal LaPO4:Eu nanorods. On this basis, local detection of was tested for a geometrically complex flow generated in a microfluidic channel with a constriction (Fig. 3a). Confocal microscopy with laser excitation at 394 nm (7F0–5L6 transition) was performed for the local photoluminescence measurement. The polarized photoluminescence spectra emitted from focal spots positioned at the channel wall and centre (indicated by red arrows in Fig. 3a) are plotted in Fig. 3b. At the wall, where reaches its maximum, the two spectra obtained with analyser angles of and exhibit contrasting line shapes that are close to the and spectra, respectively. However, at the channel centre, the two spectra are almost identical, because approaches zero. When the flow rate was abruptly changed, the resulting spectral fluctuation at a fixed focal position could be recorded with the time resolution available with the spectrometer. The scanning operation of the confocal microscope allowed the construction of tomographic maps of such a local shear measurement over any scanning section. Figure 3c presents polarized photoluminescence intensity maps for a peak wavelength of 587 nm over vertical and horizontal scanning sections (Fig. 3a). From each set of these intensity maps, a corresponding map of the apparent shear rate () can be constructed by simple image processing using Eqs. (3) and (4) and the vs. calibration curve in Fig. 3f. Note that, because the vs. curve is not linear, the accuracy of the determination of should depend on its value. However, the relative uncertainty, , estimated from the derivative of the vs. curve, varies weakly as soon as (Supplementary Fig. 6). This is advantageous for an accurate determination of in a wide range extending over 100 s−1. The value in our experiment is smaller than 30%. Figure 3d shows a surface plot of the profile over the vertical scanning section. In this case, the local director of , that is, the principal shear direction, is constantly normal to the scanning plane. This profile is similar to the inverted pyramidal shape theoretically predicted for a Poiseuille flow in a rectangular channel. This result implies the near-Newtonian rheology of the dilute LaPO4:Eu nanorod suspension, which thus seems to be suited for performing the stress-optical analysis. Meanwhile, the map constructed over the horizontal scanning section with the semicircular constriction (Fig. 3e, the colour represents the quantity of and the arrows indicate ) shows an unexpected asymmetric profile. Considering the small channel dimension and flow rate (Reynolds number of ), inertia plays a negligible role here and the flow regime is purely viscous, which should lead to a fore-aft symmetry for Newtonian fluids ref35 , as can be seen from a theoretically modelled map (Supplementary Fig. 8a). However, in Fig. 3e, the region of maximum (that is, maximum ) is deviated towards the upstream (left side) and away from the constriction wall. Similar asymmetric birefringence profiles have also been reported in the study of viscoelastic polymer suspensions ref36 .
Computational analysis
Examining the asymmetry of the map (Fig. 3e) is imperative for establishing a reliable stress-optical analysis. Therefore, we con- ducted a computational analysis of the rod-orientation dynamics. The details of the method and results are provided in Supplementary Section III and Supplementary Fig. 7. This study reveals that the discrepancy between and the real shear rate originates in the advection and non-instantaneous reorientation of the nanorods in a non-homogeneous flow. When the streamlines are not parallel around the constriction, the nanorods advected by the flow experience time-dependent local shear that varies over a typical timescale (where is the channel width and the flow velocity) taken to flow over the constriction. However, the response of the probability distribution for the nanorods’ orientation occurs on the rotational diffusion timescale . The Peclet number is the ratio of these two timescales, , and measures the relative rates of advection and diffusion. For small Pe, the response is instantaneous, and the stress-optical law holds everywhere, whereas for intermediate to large Pe, the orientation of individual particles depends on the local shear but also on the shear to which the particles have been exposed previously, leading to history effects. Indeed, the computationally-obtained map for (Supplementary Fig. 8b) is almost identical to the theoretical map, which is symmetric (Supplementary Fig. 8a). However, the Pe given for our experiment is 5 when applying the s–1 obtained from the calibration curve (Fig. 2f). History effects are thus non-negligible and explain the discrepancy between the apparent and real shear rates: the computationally obtained map for (Fig. 3f) matches well the experimental map (Fig. 3e), both qualitatively (highly ordered upstream and rapid loss of orientation coherence downstream) and quantitatively.
These computational results suggest that, to produce reliable maps, the Pe number needs to be small enough to suppress the history effects. This can be realized by reducing the particle size, which would rapidly increase (Equation (5)). We estimate that if the LaPO4:Eu nanorod size is reduced by a factor of three (), the stress-optical analysis and the tomographic mapping would be satisfactory for most microfluidic systems of interest.
Conclusions
We have presented a simple method to measure the polarized photoluminescence spectra (in , and configurations) of LaPO4:Eu nanorods from their electrically modulated liquid-crystalline phase. The three-dimensional orientation of an individual nanorod or the director () and order parameter () of a rod assembly can be precisely determined by analysing their polarized photoluminescence line shape. This approach allowed us to investigate the rod-orientation dynamics of the colloidal nanorods flowing in a microfluidic channel. The local shear rate () profiles over sections of the fluid volume were deduced based on the stress-optical law. A reliable estimation of the profile was obtained over a region where the streamlines are parallel. However, a discrepancy between theory and experiment was found for non-parallel flows involving rod advection and reorientation. A computational study verified that this discrepancy is due to the non-instantaneous reorientation of nanorods and that it could be effectively suppressed by decreasing the nanorod size. With further optimization of the nanorod size, this technique is promising in that it yields a straightforward stress-optical method for tomographic mapping and real-time monitoring of local with the high spatial resolution necessary for applications in microfluidics and biofluidics. Furthermore, the presented orientation analysis might be exploited for the study of the complex dynamics of other microscopic systems (such as cells, genes and enzymes) by using rare-earth luminophores as orientation markers.
Methods
Methods and any associated references are available in the online version of the paper.
Acknowledgements.
The authors thank C. Frot and N. Taccoen for the fabrication of microfluidic channels, C. Henry de Villeneuve for atomic force microscopy and A. Agrawal for graphics. This research was partially supported by LASERLAB-EUROPE (grant agreement no. 284464 from the European Community’s Seventh Framework Programme). G.A., E.F. and C.N.B. acknowledge funding by the ERC under grant agreement 278248 (Multicell).References
- (1) J. Wang, M. S. Gudiksen, X. Duan, Y. Cui, and C. M. Lieber. Highly polarized photoluminescence and photodetection from single indium phosphide nanowires. Science, 293:1455–1457, 2001.
- (2) J. Hu et al. Linearly polarized emission from colloidal semiconductor quantum rods. Science, 292:2060–2063, 2001.
- (3) J. N. Forkey, M. E. Quinlan, M. A. Shaw, J. E. T. Corrie, and Y. E. Goldman. Three-dimensional structural dynamics of myosin v by single-molecule fluorescence polarization. Nature, 422:399–404, 2003.
- (4) M. Ohmachi et al. Fluorescence microscopy for simultaneous observation of 3d orientation and movement and its application to quantum rod-tagged myosin v. Proc. Natl. Acad. Sci. USA, 109:5294–5298, 2012.
- (5) M. Califano and A. Zunger. Anisotropy of interband transitions in inas quantum wires: an atomistic theory. Phys. Rev. B, 70:165317, 2004.
- (6) H.-Y. Chen, Y.-C. Yang, H.-W. Lin, S.-C. Chang, and S. Gwo. Polarized photoluminescence from single GaN nanorods: effects of optical confinement. Opt. Express, 16:13465–13475, 2008.
- (7) C. R. McIntyre and L. J. Sham. Theory of luminescence polarization anisotropy in quantum wires. Phys. Rev. B, 45:9443–9446, 1992.
- (8) Y. Wang and N. Herron. Nanometer-sized semiconductor clusters: materials synthesis, quantum size effects, and photophysical properties. J. Phys. Chem., 95:525–532, 1991.
- (9) K. Binnemans and C. C. Görller-Walrand. Application of the Eu3+ ion for site symmetry determination. J. Rare Earth, 14:173–180, 1996.
- (10) P. H. Hänninen, T. Ala-Kleme, and H. Hèarmèa. Lanthanide Luminescence: Photophysical, Analytical and Biological Aspects. Springer, 2011.
- (11) C. Brecher, H. Samelson, A. Lempicki, R. Riley, and T. Peters. Polarized spectra and crystal-field parameters of Eu3+ in YVO4. Phys. Rev, 155:178–187, 1967.
- (12) E. V. Sayre and S. Freed. pectra and quantum states of the europic ion in crystals. II. fluorescence and absorption spectra of single crystals of europic ethylsulfate nonahydrate. J. Chem. Phys., 24:1213–1219, 1956.
- (13) L. G. DeShazer and G. H. Dieke. Spectra and energy levels of Eu3+ in LaCl3. J. Chem. Phys., 38:2190–2199, 1963.
- (14) C. Brecher. Europium in the ultraphosphate lattice: polarized spectra and structure of EuP5O14. J. Chem. Phys., 61:2297–2315, 1974.
- (15) J. Kim et al. LaPO4 mineral liquid crystalline suspensions with outstanding colloidal stability for electro-optical applications. Adv. Funct. Mater., 22:4949–4956, 2012.
- (16) L. Onsager. The effects of shape on the interaction of colloidal particles. Ann. NY Acad. Sci., 51:627–659, 1949.
- (17) J. Kim et al. Optimized combination of intrinsic and form birefringence in oriented LaPO4 nanorod assemblies. Appl. Phys. Lett., 105:061102, 2014.
- (18) Y. G. Galyametdinov et al. Polarized luminescence from aligned samples of nematogenic lanthanide complexes. Adv. Mater., 20:252–257, 2008.
- (19) F. P. Bretherton. The motion of rigid particles in a shear flow at low reynolds number. J. Fluid Mech., 14:284–304, 1962.
- (20) R. Cerf and H. A. Scheraga. Flow birefringence in solutions of macromolecules. Chem. Rev., 51:185–261, 1952.
- (21) A. B. Fisher, S. Chien, A. I. Barakat, and R. M. Nerem. Endothelial cellular response to altered shear stress. Am. J. Physiol. Lung Cell. Mol. Physiol., 281:L529–L533, 2001.
- (22) C. N. Baroud, F. Gallaire, and R. Dangla. Dynamics of microfluidic droplets. Lab Chip, 10:2032–2045, 2010.
- (23) M. H. Oddy, J. G. Santiago, and J. C. Mikkelsen. Electrokinetic instability micromixing. Anal. Chem., 73:5822–5832, 2001.
- (24) J. El-Ali, P. K. Sorger, and K. F. Jensen. Cells on chips. Nature, 442:403–411, 2006.
- (25) R. Lindken, M. Rossi, S. Grosse, and J. Westerweel. Micro-particle image velocimetry (PIV): recent developments, applications, and guidelines. Lab Chip, 9:2551–2567, 2009.
- (26) S. J. Lee and S. Kim. Advanced particle-based velocimetry techniques for microscale flows. Microfluid. Nanofluid., 6:577–588, 2009.
- (27) Y.-P. Fang et al. Systematic synthesis and characterization of single-crystal lanthanide orthophosphate nanowires. J. Am. Chem. Soc., 125:16025–16034, 2003.
- (28) J. Kim, J. Peretti, K. Lahlil, J.-P. Boilot, and T. Gacoin. Optically anisotropic thin films by shear-oriented assembly of colloidal nanorods. Adv. Mater., 25:3295–3300, 2013.
- (29) A. S. Lodge. Variation of flow birefringence with stress. Nature, 176:838–839, 1955.
- (30) W. Philippoff. Flow-birefringence and stress. Nature, 178:811–812, 1956.
- (31) W. Philippoff. Stress-optical analysis of fluids. Rheol. Acta, 1:371–375, 1961.
- (32) S. P. Sutera and H. Wayland. Quantitative analysis of two-dimensional flow by means of streaming birefringence. J. Appl. Phys., 32:721–730, 1961.
- (33) G. G. Fuller. Optical rheometry. Annu. Rev. Fluid Mech., 22:387–417, 1990.
- (34) R. Cressely, R. Hocquart, T. Wydro, and J. P. Decruppe. Numerical evaluation of extinction angle and birefringence in various directions as a function of velocity gradient. Rheol. Acta, 24:419–426, 1985.
- (35) G. L. Leal. Advanced Transport Phenomena: Fluid Mechanics and Convective Transport Processes. Cambridge Univ. Press, 2006.
- (36) T. Ober, S. Haward, C. Pipe, J. Soulages, and G. McKinley. Microfluidic extensional rheometry using a hyperbolic contraction geometry. Rheol. Acta, 52:529–546, 2013.