First-principles investigation of magnetocrystalline anisotropy oscillations in Co2FeAl/Ta heterostructures
Abstract
We report first-principles investigations of magnetocrystalline anisotropy energy (MCAE) oscillations as a function of capping layer thickness in Heusler alloy Co2FeAl/Ta heterostructures. Substantial oscillation is observed in FeAl-interface structure. According to -space and band-decomposed charge density analyses, this oscillation is mainly attributed to the Fermi-energy-vicinal quantum well states (QWS) which are confined between Co2FeAl/Ta interface and Ta/vacuum surface. The smaller oscillation magnitude in the Co-interface structure can be explained by the smooth potential transition at the interface. These findings clarify that MCAE in Co2FeAl/Ta is not a local property of the interface and that the quantum well effect plays a dominant role in MCAE oscillations of the heterostructures. This work presents the possibility of tuning MCAE by QWS in capping layers, and paves the way for artificially controlling magnetic anisotropy energy in magnetic tunnel junctions.
pacs:
73.22.-f, 85.75.-dI introduction
With the increasing demand for high-speed and low-power-consumption storage devices, intensive researches have been made on spin-transfer-torque magnetic random access memory (STT-MRAM). The core structure of MRAM is magnetic tunnel junction (MTJ), Ikeda et al. (2010) which is composed of an insulating barrier sandwiched by two ferromagnetic (FM) electrodes. The relative orientation of two FM electrodes represents two states and can be utilized to store one bit information. To realize high storage density, the manufacturing process is scaling down to nanometer regime. However, the increasing process variations in the fabrication pose serious challenges to fundamental physics,Kang et al. (2015) especially magnetocrystalline anisotropy energy (MCAE), which is critical for the thermal stability of the relative magnetization orientation of two FM electrodes. Previous work reported that to achieve a retention time of years, an interfacial perpendicular magnetic anisotropy (PMA) of is required for device sizes scaling down to .Peng et al. (2017a) However, at present the most widely used FM electrode, CoFeB, can commonly reach an interfacial PMA of when interfaced with MgO tunneling barrier. Ikeda et al. (2010); Yang et al. (2011); Hallal et al. (2013); Dieny and Chshiev (2017) At the same time tunneling magnetoresistance (TMR) can reach a value of in CoFeB/MgO/CoFeB MTJ,Ikeda et al. (2010) which needs to be improved as well.
To further promote the development of STT-MRAM, other FM materials are under investigation. Heusler alloys are a big family of ternary intermetallic compounds with nearly members.Graf et al. (2011) According to their chemical composition, Heusler alloys can be separated into two classes, full Heusler with chemical composition X2YZ ( structure) and half Heusler XYZ ( structure), in which X and Y are transition metals, and Z is main group element.Trudel et al. (2010) By virtue of the broad choices of elements and stoichiometry, many Heusler compounds exhibit interesting properties, such as half-metallicity, Galanakis et al. (2002) various Hall effect, Husmann and Singh (2006); Dubenko et al. (2009); Chadov et al. (2010) thermoelectric effect, Kuo et al. (2005) topological effect Chadov et al. (2010) and superconductivity, Sprungmann et al. (2010) etc. Among Heusler alloys, Co2FeAl (CFA) has attracted lots of attention due to its high spin polarization and low magnetic damping constant. Bai et al. (2012); Sukegawa et al. (2014) TMR ratio can reach up to at and at room temperature (RT) in Co2FeAl/MgO/CoFe MTJ. Wang et al. (2009) Magnetic damping constant, , can reach as low as , Mizukami et al. (2009) which is beneficial for reducing STT switching current. Another merit of CFA is its fine lattice matching with MgO. As a result, epitaxial growth of CFA(001)[110]MgO(001)[100] can be achieved in experiment.Gabor et al. (2011) All these advantages make CFA a promising candidate for MTJ electrode material. Regarding magnetic anisotropy energy (MAE) of CFA, experimental and theoretical results confirmed that the Co2FeAl/MgO interface can reach around . Wen et al. (2011, 2014); Vadapoo et al. (2016) However, as discussed above, MAE needs to be optimized further.Besides, it is crucial to find out effective ways to artificially control MAE.
Recently, experimental and theoretical results showed that heavy metals (HM) can induce large variations of physical properties including MAE when interfaced with FM materials. Ouazi et al. (2012); Andersson et al. (2007); Pai et al. (2014); Zhou et al. (2016); Zhang et al. (2017); Gambardella et al. (2003); Balashov et al. (2009); Peng et al. (2017b) In practical MTJs, a buffer layer at the bottom and a capping layer on the top are necessary to improve and protect the FM/MgO/FM core structure. Consequently, the choice of capping layer provides us a unique way to control MAE of the whole structure. On the other hand, when the thickness of these multilayers reaches down to atomic scale, quantum mechanical (QM) effects start to dominate. One of the most well-known QM effect is quantum well (QW), in which the wave functions of the quantum particle are confined by potential barriers and the energy levels are quantized. In spintronics, the milestone effect, giant magnetoresistance (GMR), and its closely related phenomenon, interlayer exchange coupling (IEC), are deeply related to QW. These effects have been successfully explained by quantum interferences due to reflections at the spacer boundaries. Bruno and Chappert (1991) In terms of the influence of quantum well states (QWS) on MAE, early theoretical works, using tight-binding formalism and a perturbation treatment to spin orbit coupling (SOC), reported the oscillation of MAE with respect to Pd layer thickness in Co/Pd system. Cinal and Edwards (1997) While there also exists other work which supports interfacial-MAE in Pd/Co/Pd(111) structure.Dorantes-Dávila et al. (2003) Other than HM Pd, MAE oscillations with respect to both Co and Cu were found in Co/Cu system.Szunyogh et al. (1997) Since the IEC effects are prominent in these structures, Parkin (1991); Celinski and Heinrich (1991) the formation of QWS are well confirmed. Indeed, years later, MAE oscillations were observed in Cu(001)/Co, Ag(001)/FePrzybylski et al. (2012) and Fe/Cu, Co/Cu structures,Manna et al. (2013) and the origin of these oscillations were attributed to QWS. Also, QWS induced oscillatory IEC was found in Co/MgO/Co PMA MTJ.Nistor et al. (2010) Recent first-principles studies have correlated QWS with MCAE in Ag/Fe and IEC in Fe/Ag/Fe structures. Chang et al. (2015, 2017) These works indicate that the influence of QWS on magnetic properties, specifically MAE, may become salient in some structures.
In this paper, we report ab-initio calculations of MCAE in CFA/Ta structures and observe MCAE oscillations associated with the Ta layer thickness. These oscillations are further proved as induced by both majority-spin and minority-spin QWS confined in Ta layers. The origin of the significant MCAE oscillation is attributed to the repeated traversing of QWS across Fermi energy and the large SOC of Ta. In all, QWS formed in the capping layer provide us a unique method to tune MAE in the MTJ structure.
II methods
Calculations were performed using Vienna ab initio simulation package (VASP) based on projector-augmented wave (PAW) method and a plane wave basis set.Kresse and Furthmüller (1996) The exchange and correlation terms were described using generalized gradient approximation (GGA) in the scheme of Perdew-Burke-Ernzerhof (PBE) parameterization.Kresse and Joubert (1999) We used a kinetic energy cutoff of and a Gamma centered Monkhorst-Pack -point mesh of . The convergence of MCAE relative to -point has been checked carefully, the variation of MCAE is about when changing -point mesh from to , which is at least a magnitude smaller than the oscillation amplitude of MCAE. The energy convergence criteria of all the calculations were set as , and all the structures were relaxed until the force acting on each atom was less than . All the structures have at least vacuum space to eliminate interactions between periodic images.
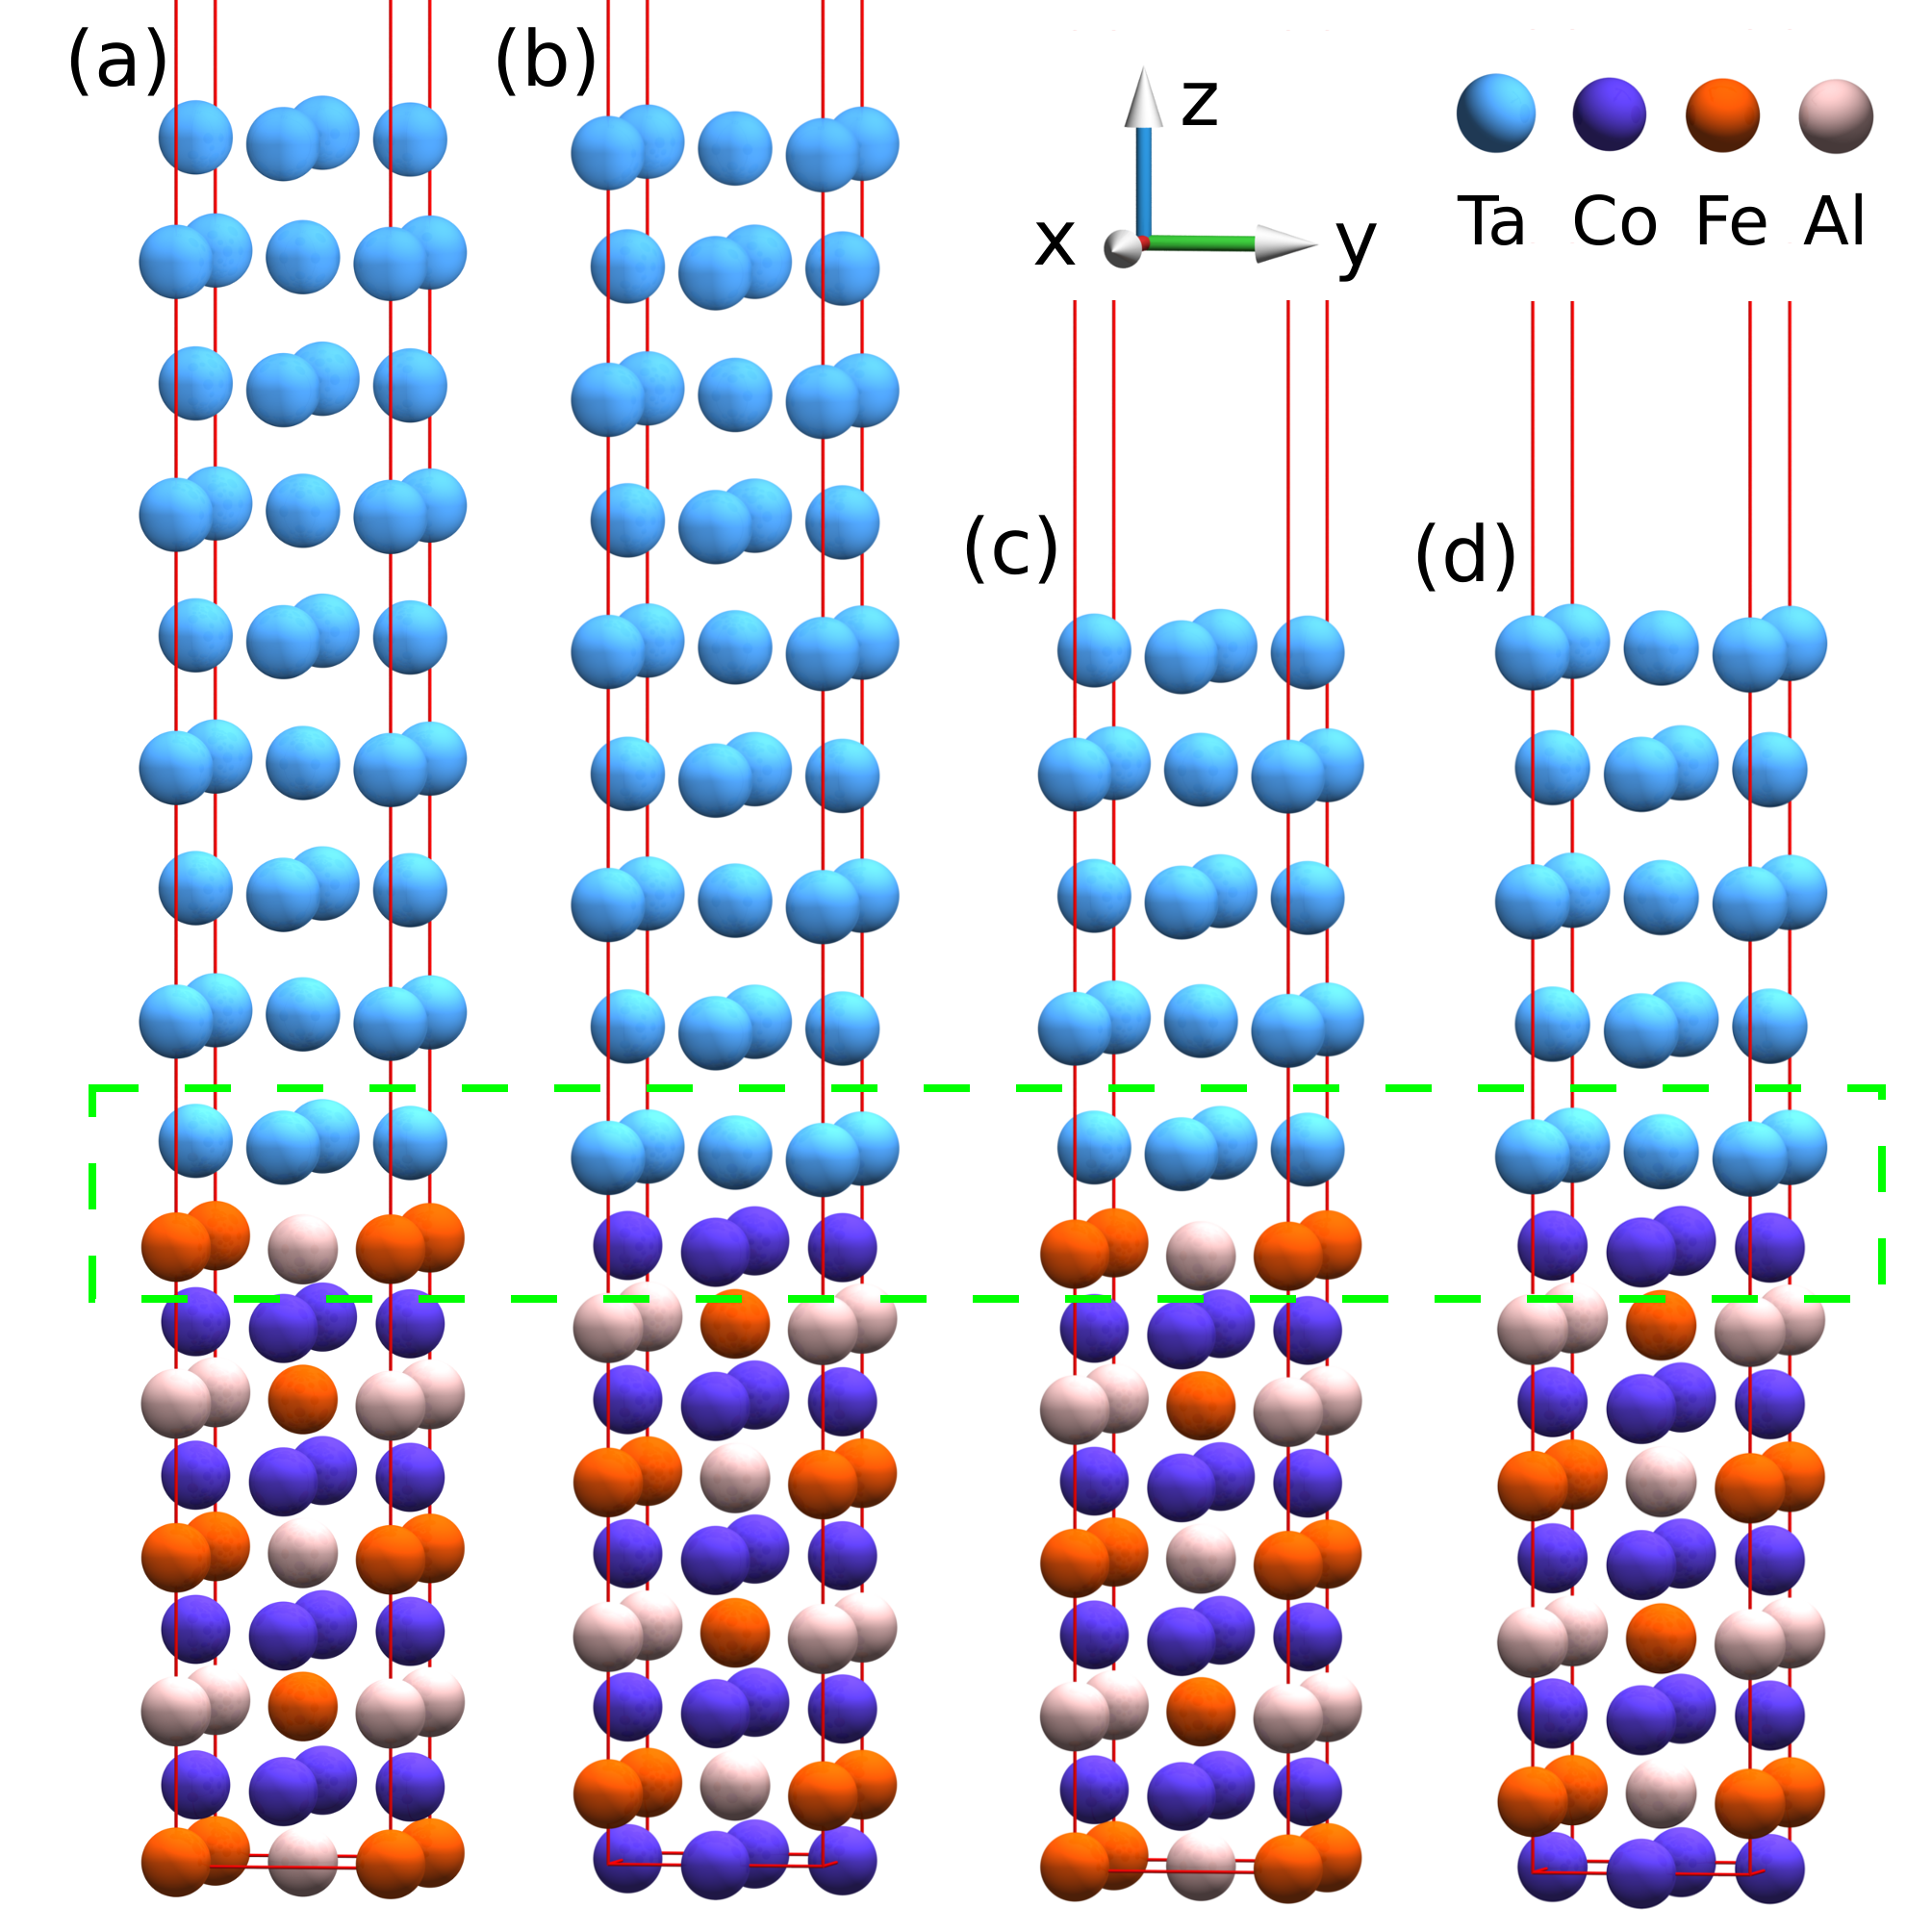
Bulk CFA has a cubic crystal structure. After fully relaxing bulk structure in volume and shape, the lattice constant is found to be , perfectly matches the experimental value . Ortiz et al. (2011) For CFA/Ta heterostructure, an in-plane lattice constant of is adopted for the unit cell, which is rotated by degrees from the conventional cell of bulk CFA. For all the CFA/Ta structures, monolayers (ML) of CFA are used, and to ML of Ta layers are put on top of CFA, as shown in Fig. 1. We use CFA/Ta[] to label structures of different Ta ML, where is the number of Ta ML, ranging from to . As for the interface between CFA and Ta, there exist two kinds of configurations and both of them have been investigated. FeAl-CFA/Ta is used as the label when FeAl layer of CFA directly contact with Ta, while Co-CFA/Ta is used when Co layer of CFA contact with Ta.
To calculate MCAE, two-step procedures were adopted. Firstly, charge density was acquired self-consistently without taking into account SOC. Secondly, reading the self-consistent charge density, two non-self-consistent calculations were performed including SOC, with magnetization pointing towards the direction and the direction, respectively. Finally, MCAE was calculated by , positive MCAE stands for PMA while negative MCAE for in-plane magnetic anisotropy.
To get a deeper understanding of the origin of oscillation, MCAE is decomposed into -space. According to force theorem, Wang et al. (1993); Daalderop et al. (1994); Wang et al. (1996) the main contribution of MCAE originates from the difference of eigenvalues between two magnetization directions. Indeed, we found that the ion Ewald summation energy, Hartree energy, exchange correlation energy and external potential energy are exactly the same between two magnetization directions, the difference of total energy only comes from the difference of eigenvalue summation, this testifies the feasibility of -space decomposition of MCAE. Specifically, this can be expressed as
| (1) |
where is the -point index, are the band indexes of magnetization direction along [100] and [001], respectively. is occupation number of this band, is the energy of band at -point .
III results and discussion
III.1 MCAE oscillation
Unlike the FM/oxide structure where the MCAE can be accounted as local hybridization of the interfacial Fe- orbital and the interfacial O- orbital,Dieny and Chshiev (2017) the MCAE of CFA/Ta structure varies strongly when the Ta thickness changes. In this circumstance, MCAE cannot be treated as a local property of the interface. We observe a strong oscillation of MCAE in FeAl-CFA/Ta structure relative to the thickness of capping layer Ta, as shown in Fig. 2. The oscillation period is approximately ML, and the oscillation amplitude decreases as the number of Ta ML increases. This is due to that the confinement effect of QW will become less prominent when the width of QW increases and the bulk states of Ta will account for a larger proportion in all the electron states. Interestingly, the oscillation is smaller in the Co-CFA/Ta structure, the reason for this phenomenon will be discussed later.
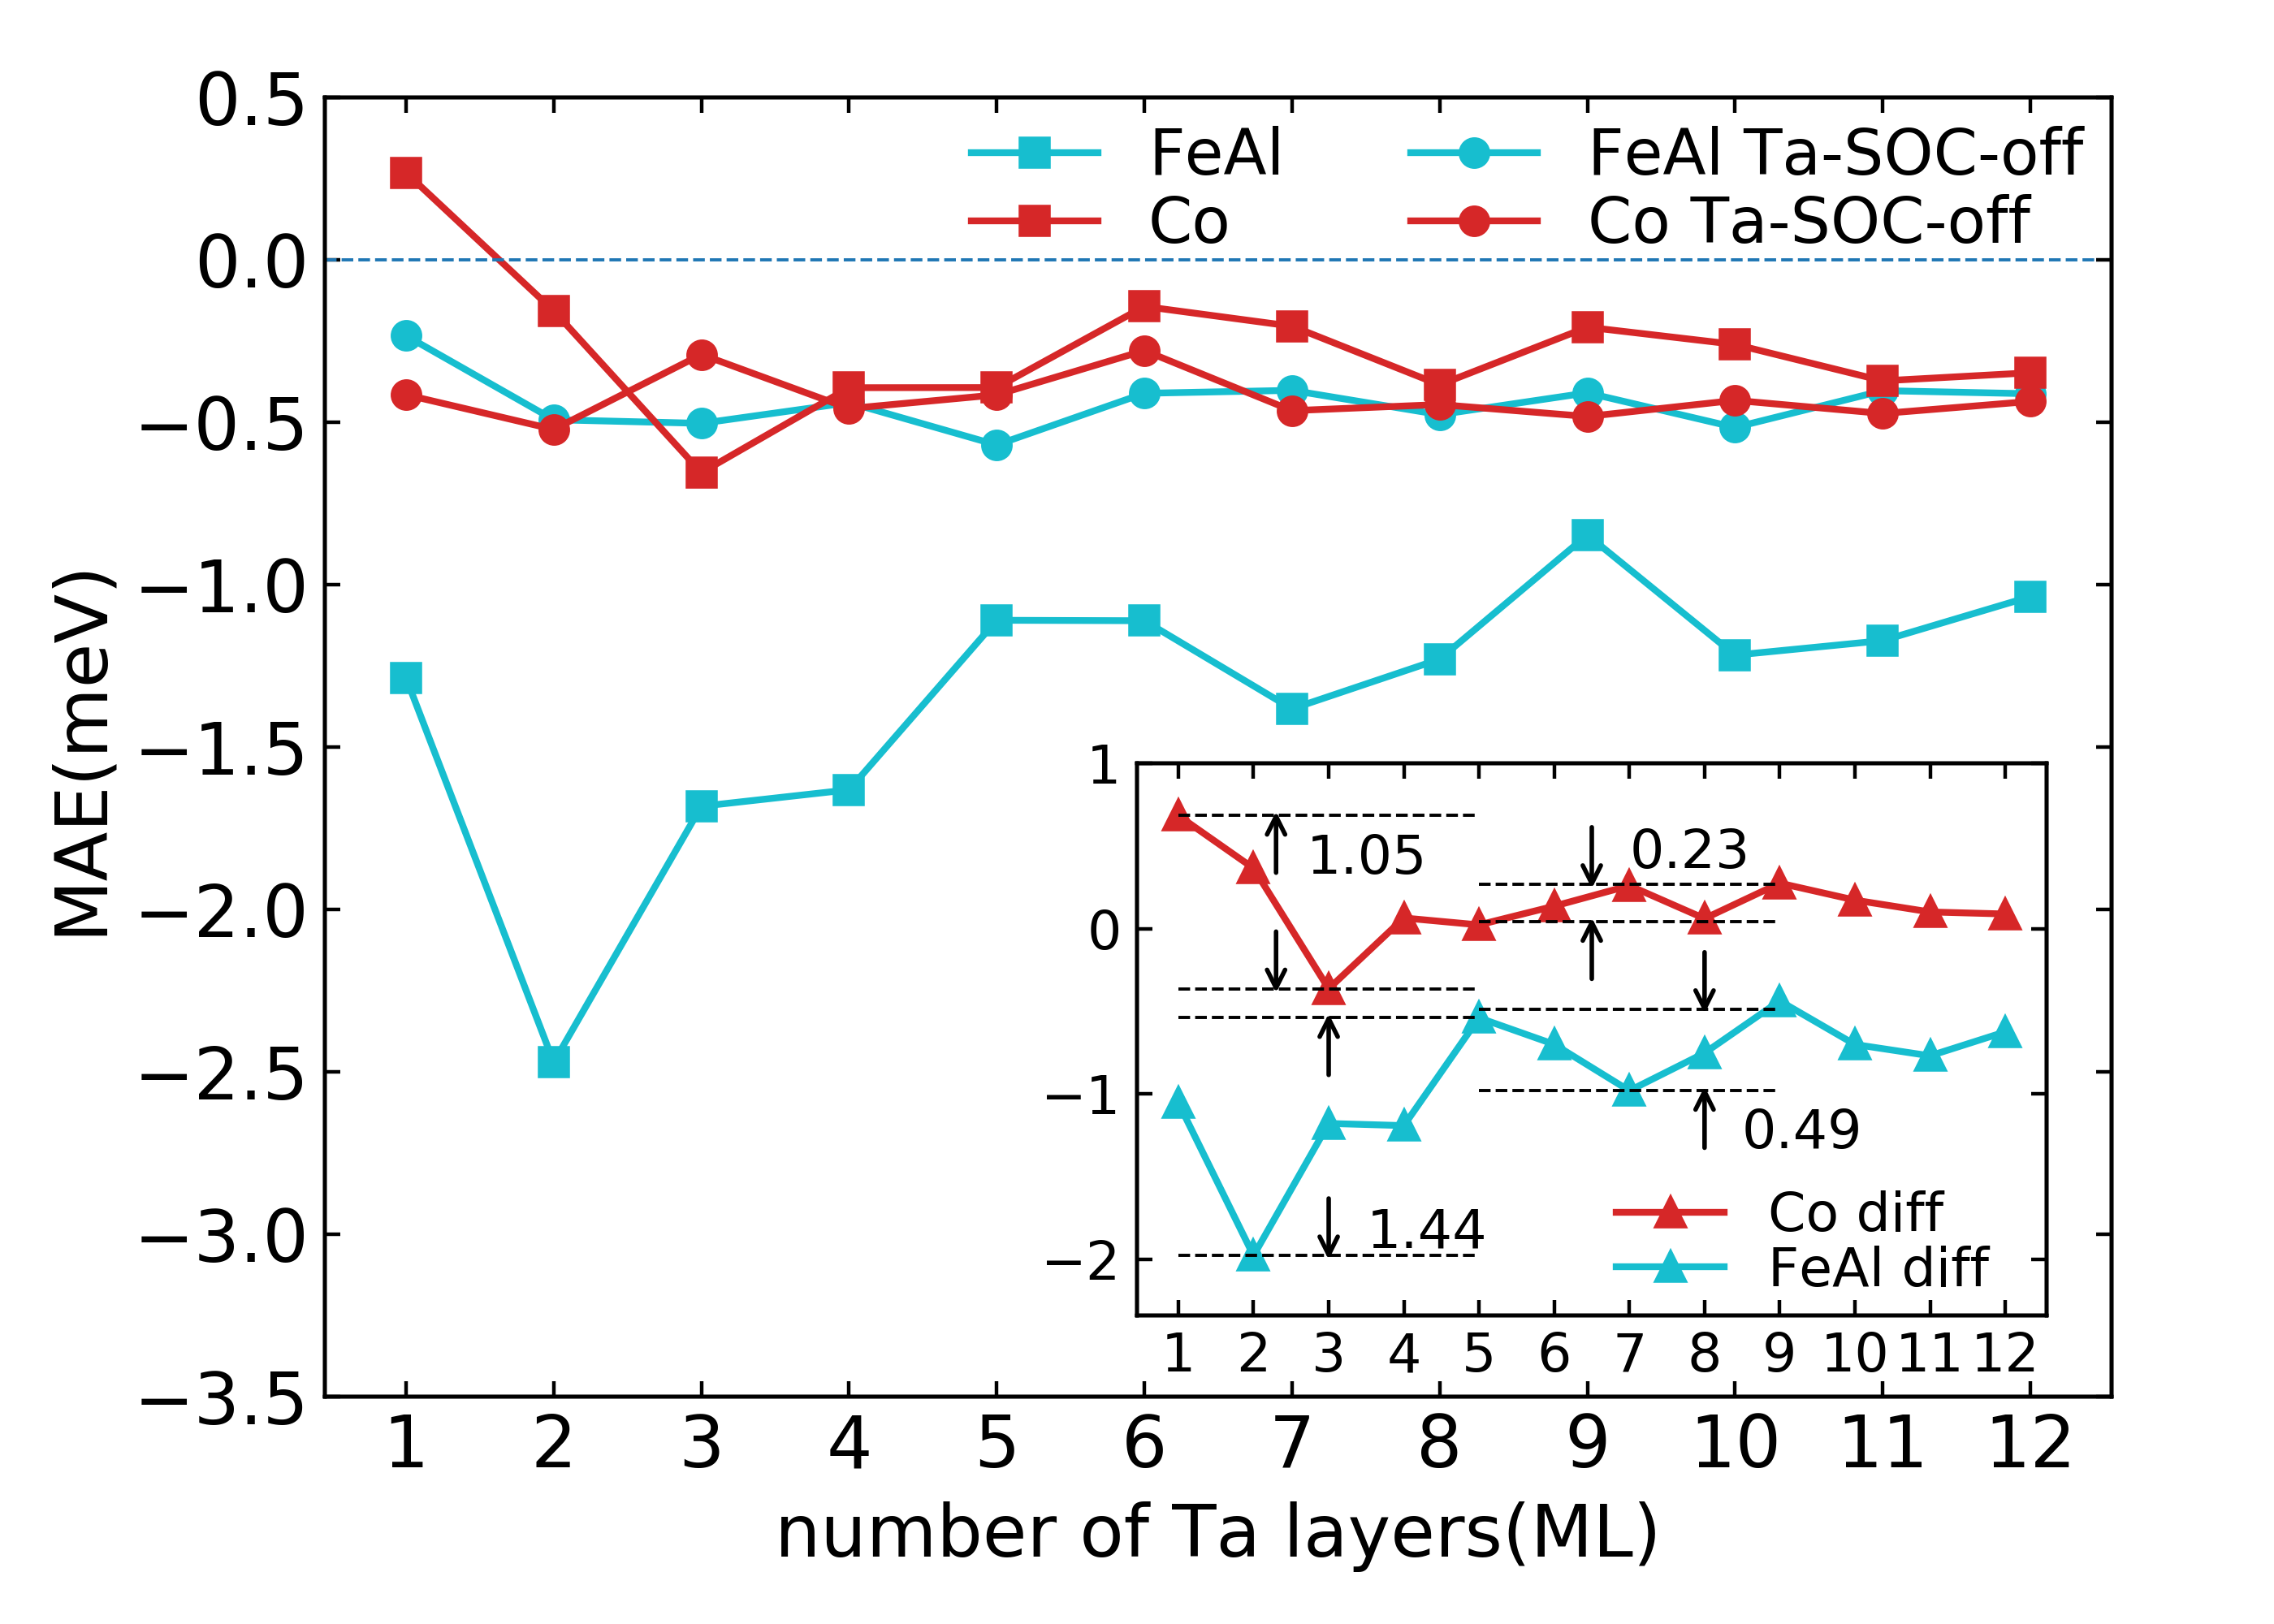
To comprehend the origin of the oscillations, we manually tweak the strength of SOC in the structures. Since MCAE only comes from SOC, switching off the SOC of Ta will totally screen out the contribution of Ta to MCAE of the whole system. For the FeAl-CFA/Ta structure, by suppressing the SOC of Ta while still keeping the SOC of CFA, oscillation of the MCAE relative to Ta layer thickness disappears [see cyan lines in Fig. 2]. For the Co-CFA/Ta structure, a smaller oscillation exists and the tweaking of the SOC of Ta has little influence on the MCAE [see red lines in Fig. 2]. These strongly indicate that the electron states in Ta play the determinant role in the MCAE oscillations of CFA/Ta structures.
A further analysis can be carried out by defining the MCAE difference
| (2) |
where is the number of Ta ML, is the result calculated with SOC of Ta switched off. The will only contain MCAE contribution originated from Ta layers, as plotted in the inset of Fig. 2. Note three major differences can be discerned. Firstly, the oscillation magnitude of Co-CFA/Ta vanishes much faster than that of FeAl-CFA/Ta. Secondly, we can define an oscillation period of ML in FeAl-CFA/Ta but it is harder to clearly define an oscillation period for Co-CFA/Ta. Thirdly, in Co-CFA/Ta, the mean value of is essentially zero while the mean value of of FeAl-CFA/Ta largely deviates from zero. The oscillation of physical properties relative to film thickness is a hallmark of QWS, and these three remarkable differences suggest that for FeAl-CFA/Ta, the electron states in Ta layers may form QWS and explain the MCAE oscillation. While for Co-CFA/Ta, since the MCAE oscillation is less prominent, there is less probability to correlate MCAE oscillation with QWS in Ta layers. The subsequent paragraph will concentrate on the analysis of MCAE with special electron states and evidence of the existence of QWS in FeAl-CFA/Ta structure. The same analytic procedures are also applied to Co-CFA/Ta in the Supplemental Material.
III.2 Critical -points and band structure
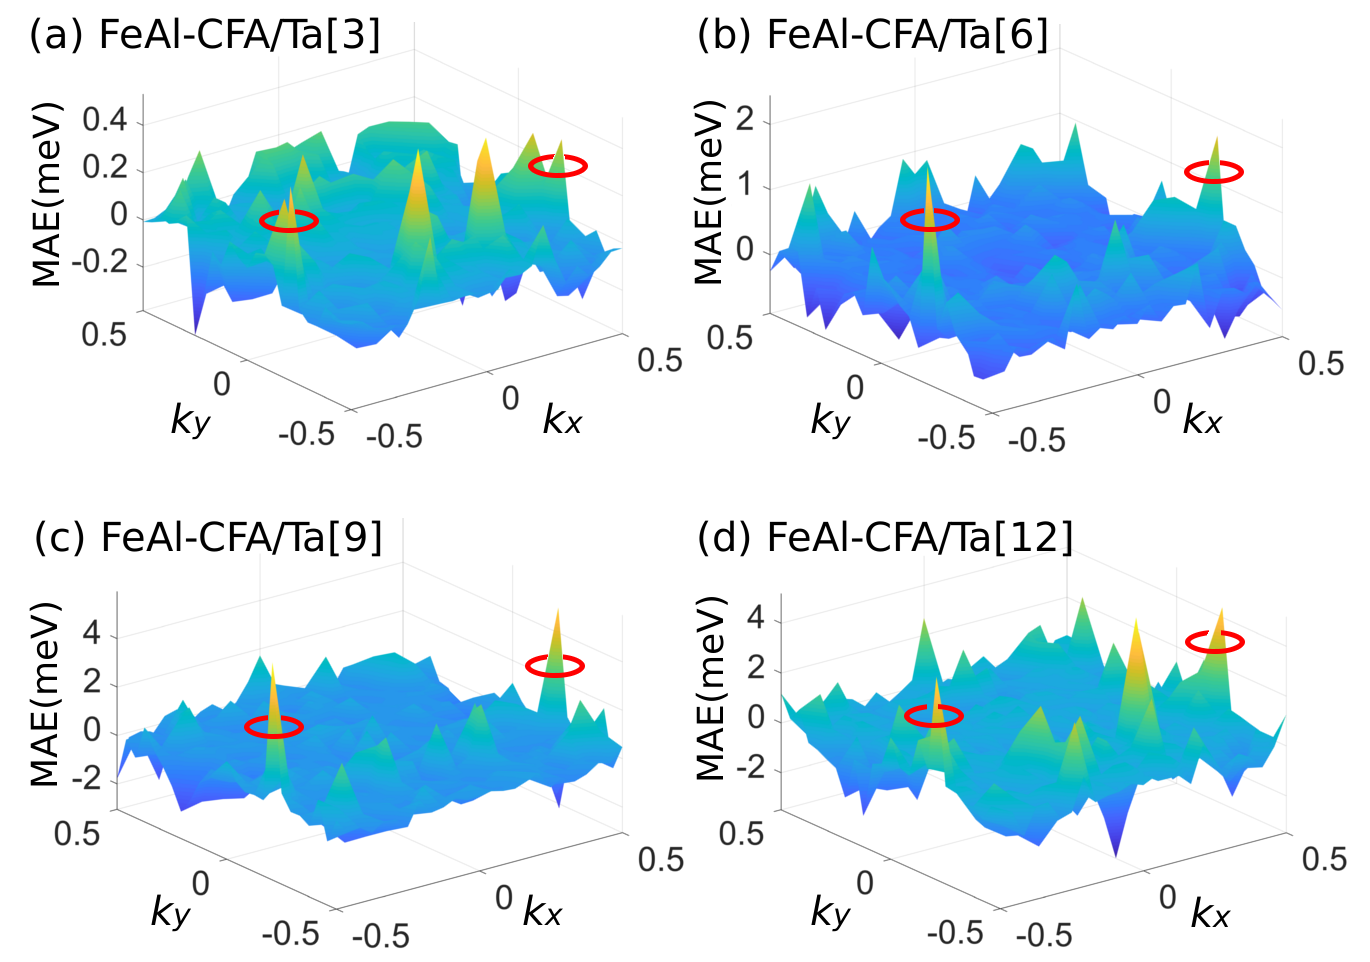
Employing -space resolved method, we dissect MCAE into two-dimensional Brillouin zone (2D-BZ) for FeAl-CFA/Ta[]. Comparing -resolved graphs for structures with different Ta layer thickness, two critical -points, which have large contributions to MCAE, can be selected out, i.e. -points at and , as shown in Fig. 3. (with number of -points set as , and ranging from to ). The SOC breaks the symmetry of 2D-BZ, contributions to total MCAE slightly differ from each other between these two -points. In fact, when considering the symmetry of the crystal structure, these two -points are identical and locate at the center of point and point of the 2D-BZ, and they will be called as critical -point in the following text.
According to second order perturbation theory, the perturbation of SOC to one-electron energies can be written as
| (3) |
| (4) |
where is the quantum number of one-electron states, is the one-electron energy and is the Hamiltonian of SOC, is the magnetization direction, and is the energy correction to unperturbed state caused by SOC.
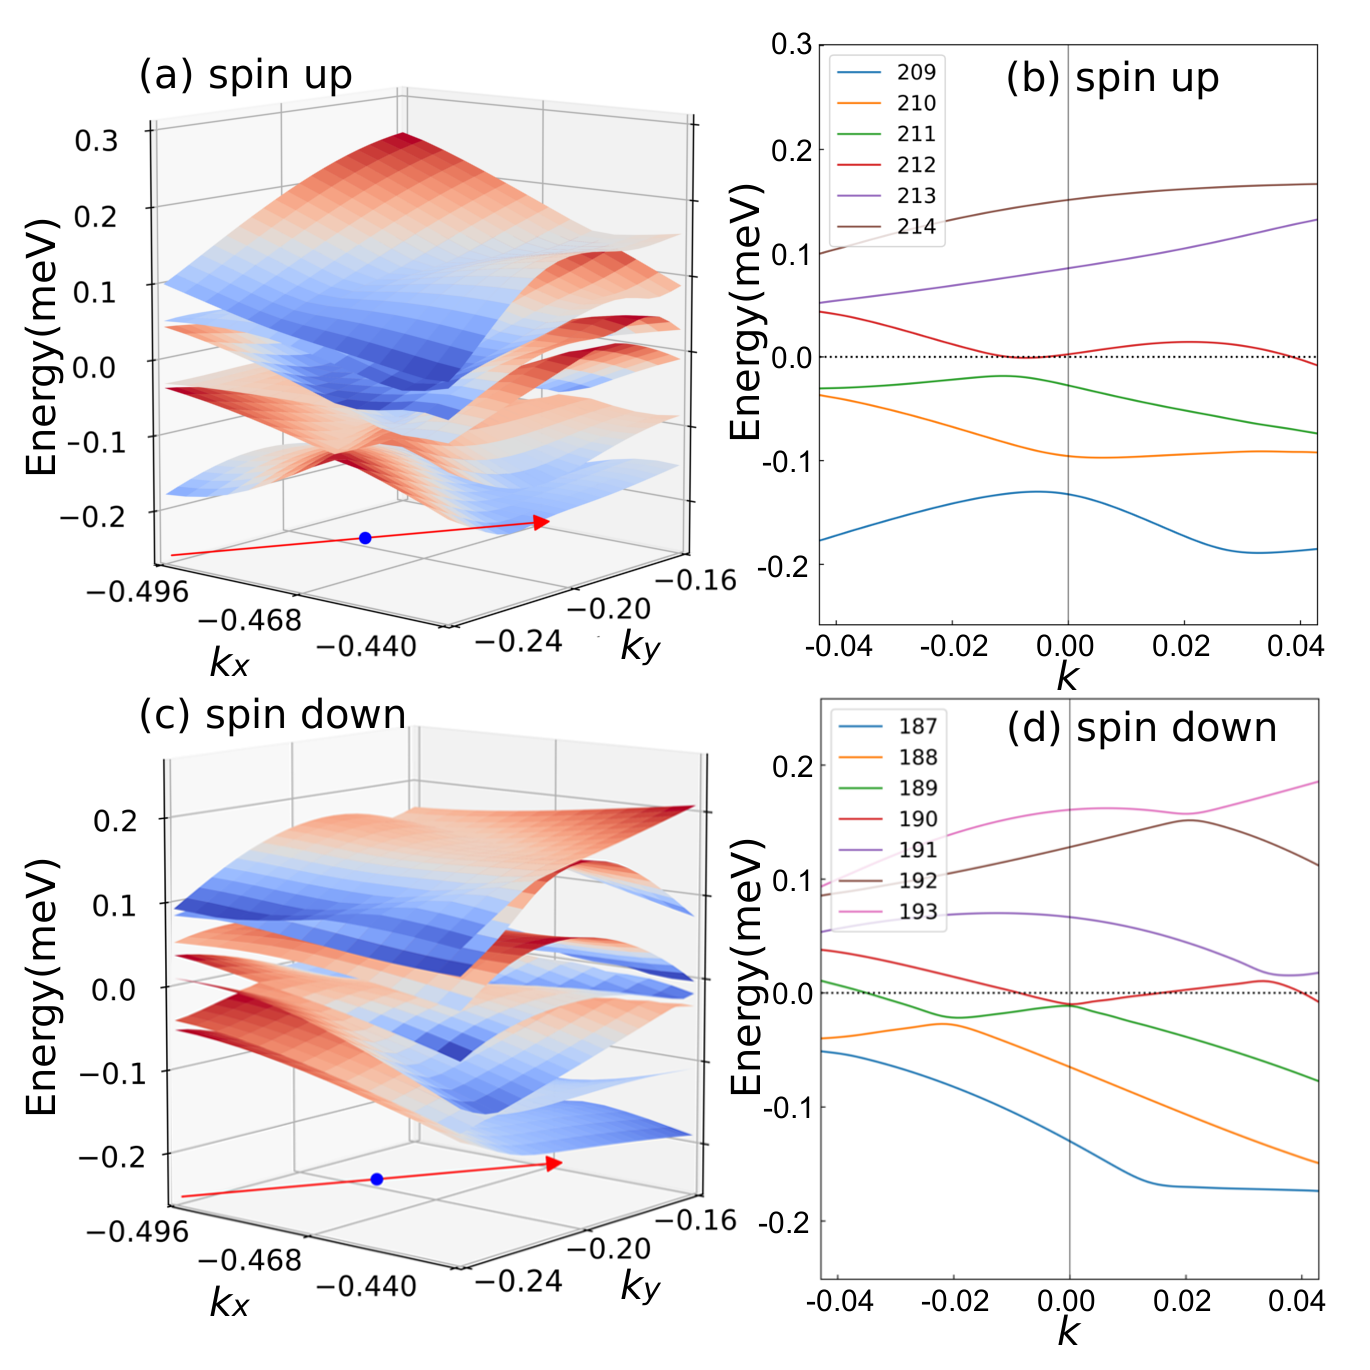
This expression indicates that only electron states near Fermi energy have maximal impact on MCAE. To extract out more information about states contributing most to the MCAE oscillation, we systematically examine spin-resolved band structures along different directions at this -point. As an example, we draw the band structure along line , with band index ranging from , as shown in Fig. 4(b) for spin-up electrons, and band for spin-down electrons, as shown in Fig. 4(d). We find that the spin-up band with index and spin-down band with index traverse Fermi energy along most of the directions in 2D-BZ. As a reminder, this particular number has no physical meaning but only labels the order of Kohn-Sham eigenvalues in the calculation result. Note due to exchange splitting, the energy of spin-down band are higher than the corresponding spin-up band which has identical band index with the spin-up band, so the Fermi-energy-vicinal bands are different for spin-up and spin-down electrons and should be considered separately.
For the Co-CFA/Ta, we find that different from FeAl-CFA/Ta, the rapid variations in 2D-BZ make the ascription of MCAE oscillation to a specific electron state a bit more difficult. We can still select out critical -points but the magnitude of the peak does not have a sharp contrast with other -points, as shown in Fig. LABEL:sm:fig:kgraph of Supplemental Material.
III.3 Characterization of QWS
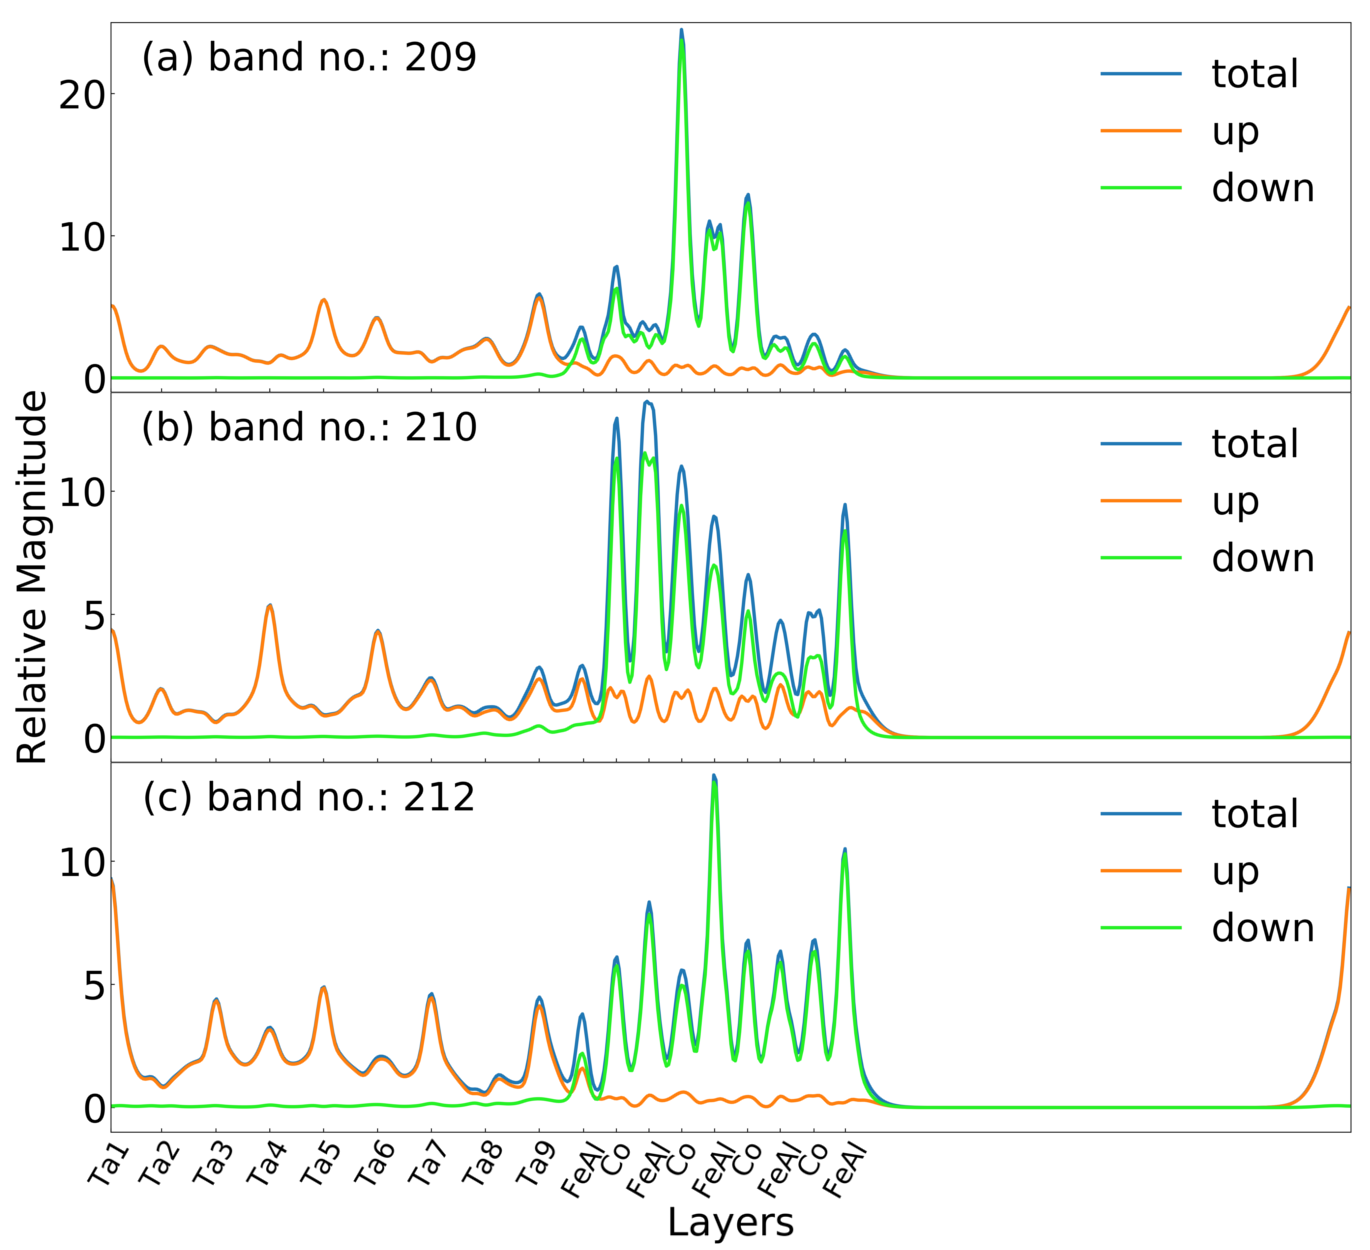
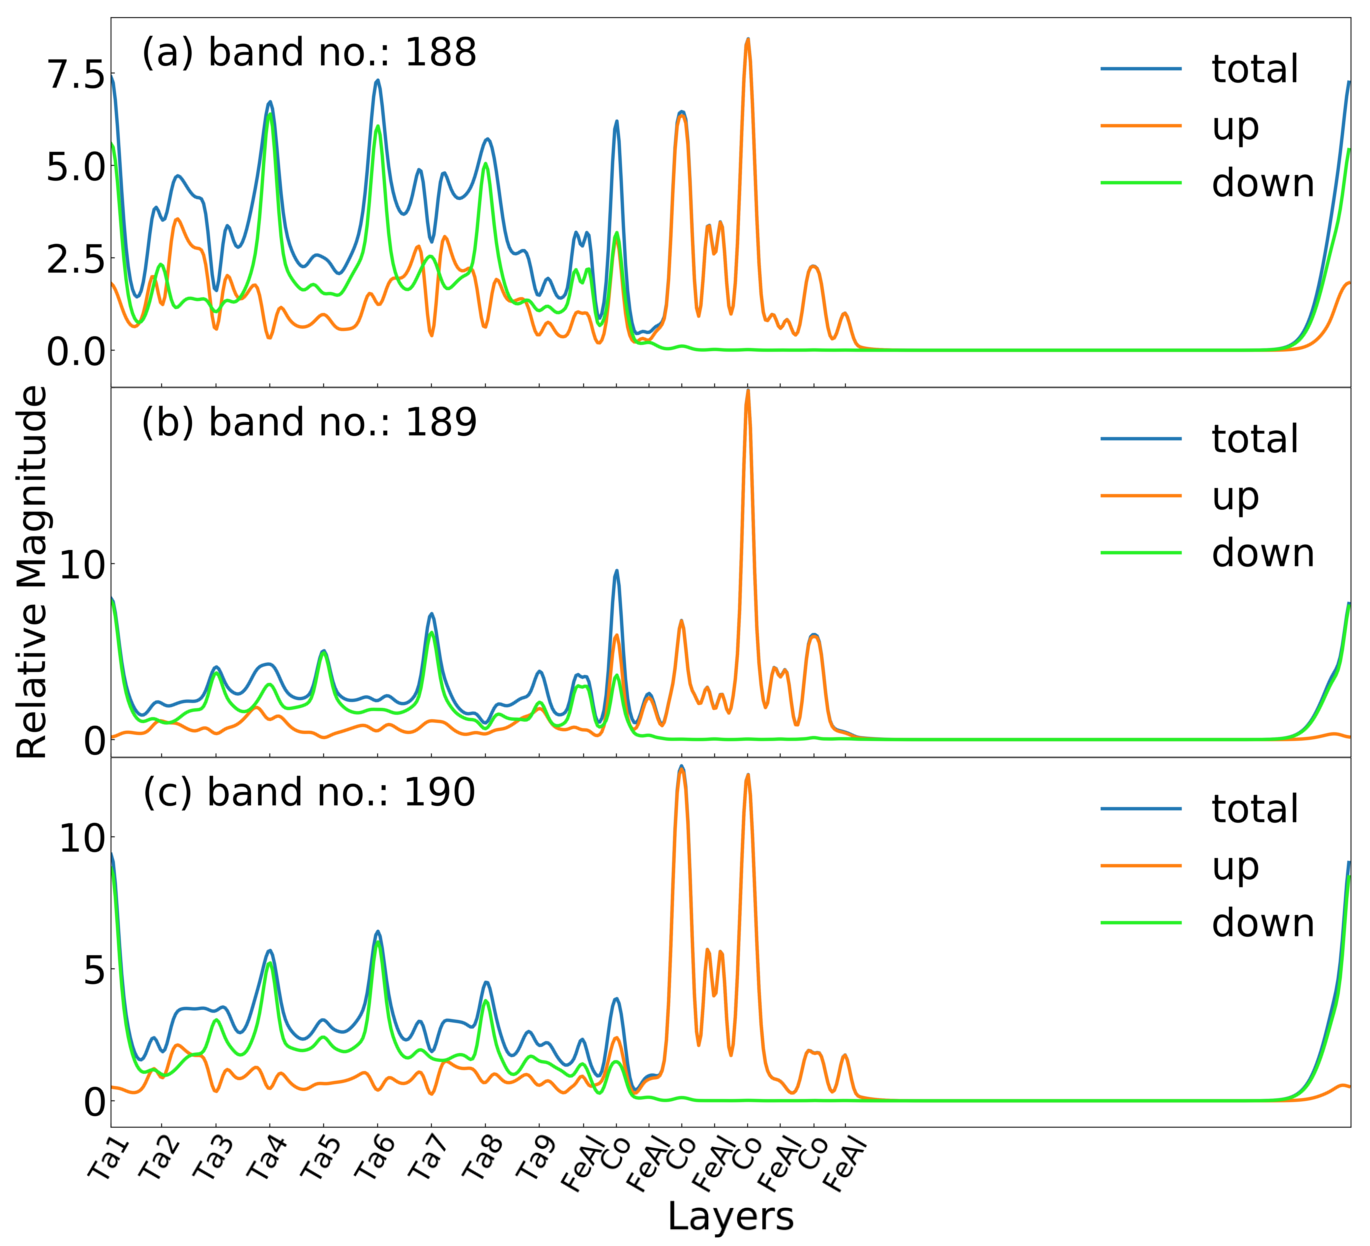
To explore the nature of these specific electron states, the band-decomposed charge densities of these Fermi-energy-vicinal states are plotted, and we conclude that these are the quantum well states confined between the FeAl-CFA/Ta interface and the Ta/vacuum surface, as shown in Fig. 5 for spin-up electrons and Fig. 6 for spin-down electrons. Note spin-up electrons of band are Fermi-energy-vicinal, while for spin-down Fermi-energy-vicinal states, their band indexes are from . For the Fermi-energy-vicinal states of both majority spin and minority spin, i.e. spin-up and spin-down electrons, all of them are mostly confined in Ta layers, as indicated by the orange lines in Fig. 5 and green lines in Fig. 6. With increasing band index, more wave crests are formed, which are the characteristic feature of QWS. The energies of QWS depend on the width of the well, namely, the thickness of the Ta layer. By increasing or decreasing Ta layer thickness, the QWS will fall or rise through Fermi energy, consequently lead to the oscillation of the total MCAE, as suggested by Eq. (4).
For the Co-CFA/Ta structure, the band-decomposed charge densities of Fermi-energy-vicinal states do not perfectly resemble that of an idealized one-dimensional quantum well with infinite potential barriers, the character of QWS is less apparent than FeAl-CFA/Ta. Band-decomposed charge densities of Co-CFA/Ta[9] are plotted in Fig. LABEL:sm:fig:parchg_up and Fig. LABEL:sm:fig:parchg_dn of Supplemental Material.
Before concluding the charge density analysis, we would like to clarify that both Fig. 5 and Fig. 6 are band-decomposed, while the total charge density should be the sum of all the occupied bands. So the crests in the band-decomposed charge densities do not imply a large antiferromagnetic coupling between Ta layers and CFA. The magnetic moments of all the atoms are plotted in Fig. LABEL:sm:fig:magmom_feal for FeAl-CFA/Ta[9] and LABEL:sm:fig:magmom_co for Co-CFA/Ta[9] for the interested reader.
III.4 Interface potential
The phenomenon that only the FeAl-CFA/Ta structure has strong MCAE oscillation can be understood by the interface potential difference. The potential drop at the interface determines the magnitude of confinement of electrons. Potential of FeAl layer differs substantially from Co layer. As shown in Fig. 7, a larger mismatch of the potential between Ta and FeAl-CFA is found while the mismatch between Ta and Co-CFA is much smoother. Since the constructions of initial structures and the processes of atomic relaxations inevitably lead to a small displacement along axis between two structures of different interfaces, and the potential difference strongly relies on the origins of coordinates in two structures, we choose part of Ta layers as sampling and minimize the square error so as to accurately align these two structures, i.e. the potential difference is calculated as
| (5) |
where
| (6) |
where is the coordinate along axis, is the displacement of FeAl-interface structure that accurately aligns two structures, and are the potentials of Co-CFA/Ta[] and FeAl-CFA/Ta[], respectively. and are the potentials of Ta layers of Co-CFA/Ta[] and FeAl-CFA/Ta[], respectively. is the potential difference plotted in Fig. 7(c).
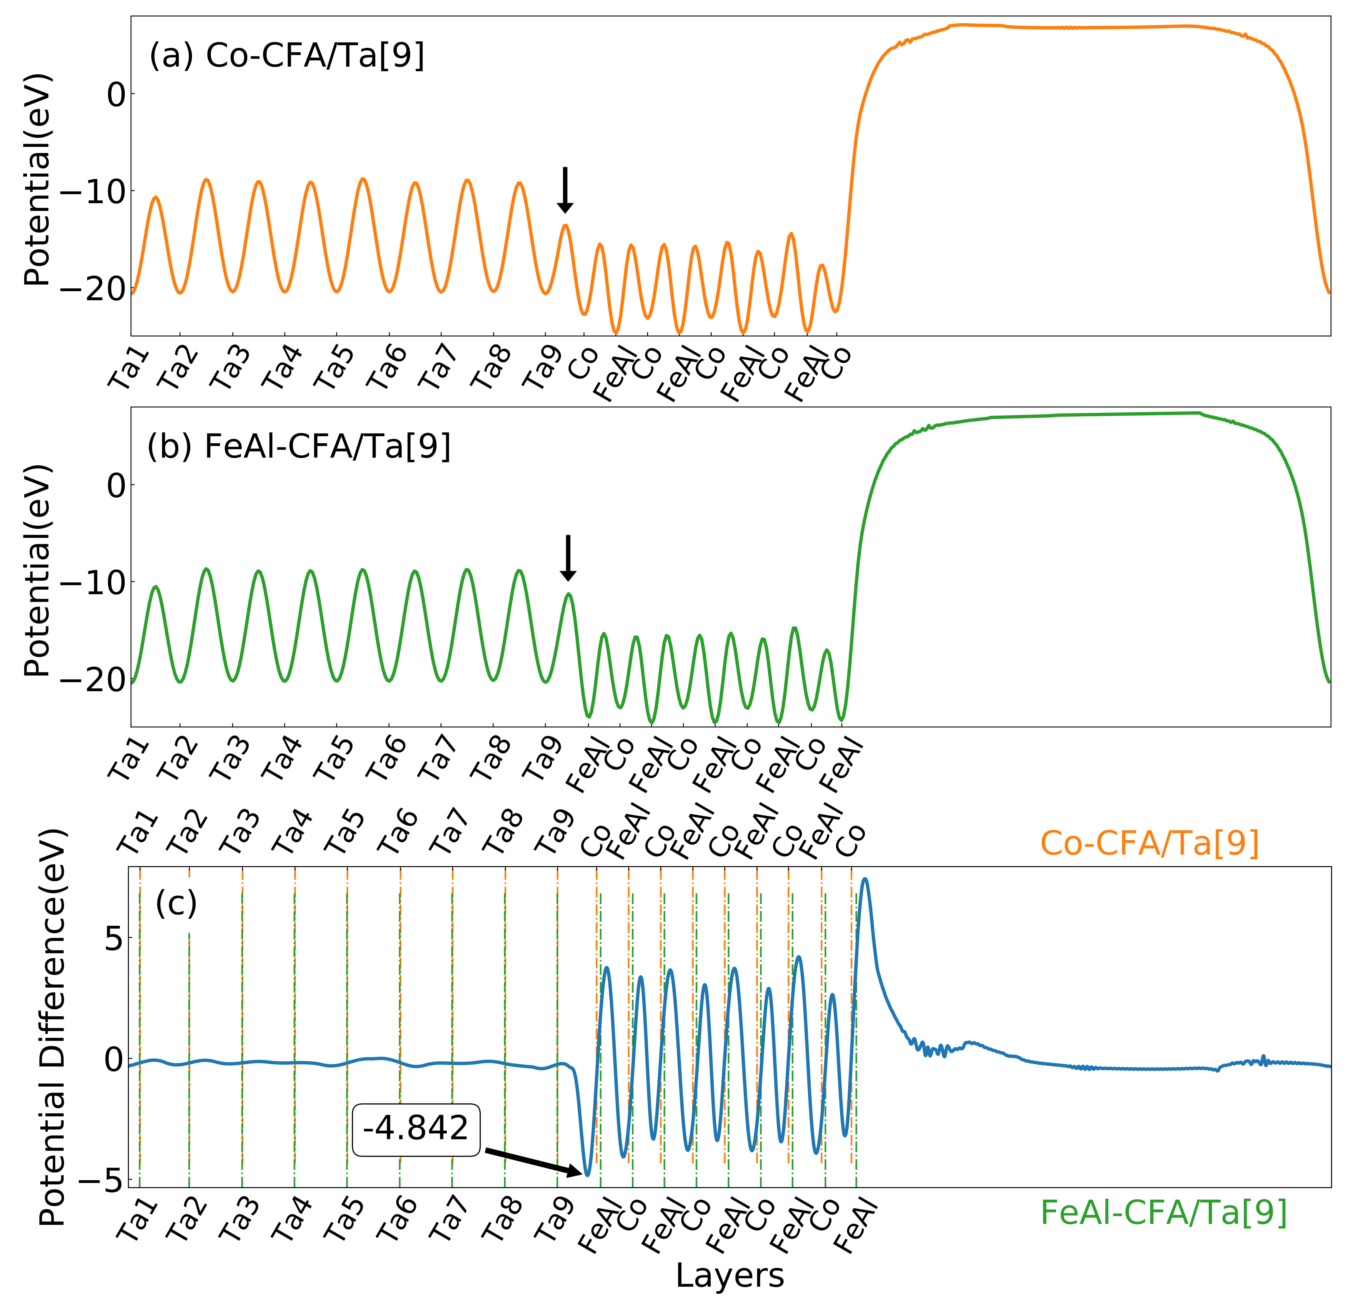
By carefully aligning Ta layers of FeAl-interface and Co-interface structures to the same position, little difference is found in Ta part between both structures. But at the interface, the potential is higher in FeAl-CFA/Ta than Co-CFA/Ta [see Fig. 7(c)]. This larger mismatch ultimately makes confinement effect more prominent in the FeAl-CFA/Ta structure, thus explaining the larger magnitude of MCAE oscillation. The smoother transition of potential in Co-CFA/Ta does not strongly confine electrons into Ta layers, consequently MCAE oscillation relative to Ta layer thickness vanishes faster in the Co-interface structure.
IV conclusions
By means of first-principles calculations, we observed a significant oscillation of MCAE as a function of heavy metal layer thickness in the CFA/Ta structure with FeAl interface. The origin of this oscillation can be attributed to electron states confinement in Ta layers. Through -space analysis, states having the largest contribution to MCAE can be traced down into special -points located at the center of point and point in 2D-BZ. Moreover, it was unveiled that the Fermi-energy-vicinal states contribute the most to total MCAE. The wave crests and troughs appearing in these bands indicate that these are the quantum well states confined in Ta layers. The smaller oscillation magnitude in Co-interface structure can be explained by the smoother potential transition at the Co/Ta interface, which imposes less confinement on electrons in Ta layers. This work clarifies that due to the QWS in capping layer, MCAE in CFA/Ta cannot be accounted as a local property of the interface. Other than commonly used approach of inducing MAE by FM/MgO interface, we demonstrate that QWS formed in the capping layer provide a way to artificially control MAE in nanostructures, which could promote the development of STT-MRAM.
Acknowledgements.
The authors would like to thank the supports by the projects from National Natural Science Foundation of China (No. 61571023, 61501013 and 61627813), Beijing Municipal of Science and Technology (No. D15110300320000), and the International Collaboration Project (No. 2015DFE12880 and No. B16001).References
- Ikeda et al. (2010) S. Ikeda, K. Miura, H. Yamamoto, K. Mizunuma, H. D. Gan, M. Endo, S. Kanai, J. Hayakawa, F. Matsukura, and H. Ohno, Nat. Mater. 9, 721 (2010).
- Kang et al. (2015) W. Kang, L. Zhang, J. O. Klein, Y. Zhang, D. Ravelosona, and W. Zhao, IEEE Trans. Electron Devices 62, 1769 (2015).
- Peng et al. (2017a) S. Peng, W. Kang, M. Wang, K. Cao, X. Zhao, L. Wang, Y. Zhang, Y. Zhou, K. L. Wang, and W. Zhao, IEEE Magn. Lett. 8, 3105805 (2017a).
- Yang et al. (2011) H. X. Yang, M. Chshiev, B. Dieny, J. H. Lee, A. Manchon, and K. H. Shin, Phys. Rev. B 84, 054401 (2011).
- Hallal et al. (2013) A. Hallal, H. X. Yang, B. Dieny, and M. Chshiev, Phys. Rev. B 88, 184423 (2013).
- Dieny and Chshiev (2017) B. Dieny and M. Chshiev, Rev. Mod. Phys. 89, 025008 (2017).
- Graf et al. (2011) T. Graf, C. Felser, and S. S. Parkin, Prog. Solid State Chem. 39, 1 (2011).
- Trudel et al. (2010) S. Trudel, O. Gaier, J. Hamrle, and B. Hillebrands, J. Phys. D: Appl. Phys. 43, 193001 (2010).
- Galanakis et al. (2002) I. Galanakis, P. H. Dederichs, and N. Papanikolaou, Phys. Rev. B 66, 174429 (2002).
- Husmann and Singh (2006) A. Husmann and L. J. Singh, Phys. Rev. B 73, 172417 (2006).
- Dubenko et al. (2009) I. Dubenko, A. K. Pathak, S. Stadler, N. Ali, Y. Kovarskii, V. N. Prudnikov, N. S. Perov, and A. B. Granovsky, Phys. Rev. B 80, 092408 (2009).
- Chadov et al. (2010) S. Chadov, X. Qi, J. Kübler, G. H. Fecher, C. Felser, and S. C. Zhang, Nat. Mater. 9, 541 (2010).
- Kuo et al. (2005) Y. K. Kuo, K. M. Sivakumar, H. C. Chen, J. H. Su, and C. S. Lue, Phys. Rev. B 72, 054116 (2005).
- Sprungmann et al. (2010) D. Sprungmann, K. Westerholt, H. Zabel, M. Weides, and H. Kohlstedt, Phys. Rev. B 82, 060505 (2010).
- Bai et al. (2012) Z. Bai, L. Shen, G. Han, and Y. P. Feng, SPIN 02, 1230006 (2012).
- Sukegawa et al. (2014) H. Sukegawa, Z. C. Wen, S. Kasai, K. Inomata, and S. Mitani, SPIN 04, 1440023 (2014).
- Wang et al. (2009) W. Wang, H. Sukegawa, R. Shan, S. Mitani, and K. Inomata, Appl. Phys. Lett. 95, 182502 (2009).
- Mizukami et al. (2009) S. Mizukami, D. Watanabe, M. Oogane, Y. Ando, Y. Miura, M. Shirai, and T. Miyazaki, J. Appl. Phys. 105, 07D306 (2009).
- Gabor et al. (2011) M. S. Gabor, T. Petrisor, C. Tiusan, M. Hehn, and T. Petrisor, Phys. Rev. B 84, 134413 (2011).
- Wen et al. (2011) Z. Wen, H. Sukegawa, S. Mitani, and K. Inomata, Appl. Phys. Lett. 98, 242507 (2011).
- Wen et al. (2014) Z. Wen, H. Sukegawa, T. Furubayashi, J. Koo, K. Inomata, S. Mitani, J. P. Hadorn, T. Ohkubo, and K. Hono, Adv. Mater. 26, 6483 (2014).
- Vadapoo et al. (2016) R. Vadapoo, A. Hallal, H. Yang, and M. Chshiev, Phys. Rev. B 94, 104418 (2016).
- Ouazi et al. (2012) S. Ouazi, S. Vlaic, S. Rusponi, G. Moulas, P. Buluschek, K. Halleux, S. Bornemann, S. Mankovsky, J. Minár, J. B. Staunton, H. Ebert, and H. Brune, Nat. Commun. 3, 1313 (2012), article.
- Andersson et al. (2007) C. Andersson, B. Sanyal, O. Eriksson, L. Nordström, O. Karis, D. Arvanitis, T. Konishi, E. Holub-Krappe, and J. H. Dunn, Phys. Rev. Lett. 99, 177207 (2007).
- Pai et al. (2014) C.-F. Pai, M.-H. Nguyen, C. Belvin, L. H. Vilela-Leão, D. C. Ralph, and R. A. Buhrman, Appl. Phys. Lett. 104, 082407 (2014).
- Zhou et al. (2016) J. Zhou, W. Zhao, Y. Wang, S. Peng, J. Qiao, L. Su, L. Zeng, N. Lei, L. Liu, Y. Zhang, and A. Bournel, Appl. Phys. Lett. 109, 242403 (2016).
- Zhang et al. (2017) B. Zhang, A. Cao, J. Qiao, M. Tang, K. Cao, X. Zhao, S. Eimer, Z. Si, N. Lei, Z. Wang, X. Lin, Z. Zhang, M. Wu, and W. Zhao, Appl. Phys. Lett. 110, 012405 (2017).
- Gambardella et al. (2003) P. Gambardella, S. Rusponi, M. Veronese, S. S. Dhesi, C. Grazioli, A. Dallmeyer, I. Cabria, R. Zeller, P. H. Dederichs, K. Kern, C. Carbone, and H. Brune, Science 300, 1130 (2003).
- Balashov et al. (2009) T. Balashov, T. Schuh, A. F. Takács, A. Ernst, S. Ostanin, J. Henk, I. Mertig, P. Bruno, T. Miyamachi, S. Suga, and W. Wulfhekel, Phys. Rev. Lett. 102, 257203 (2009).
- Peng et al. (2017b) S. Peng, W. Zhao, J. Qiao, L. Su, J. Zhou, H. Yang, Q. Zhang, Y. Zhang, C. Grezes, P. K. Amiri, and K. L. Wang, Appl. Phys. Lett. 110, 072403 (2017b).
- Bruno and Chappert (1991) P. Bruno and C. Chappert, Phys. Rev. Lett. 67, 1602 (1991).
- Cinal and Edwards (1997) M. Cinal and D. M. Edwards, Phys. Rev. B 55, 3636 (1997).
- Dorantes-Dávila et al. (2003) J. Dorantes-Dávila, H. Dreyssé, and G. M. Pastor, Phys. Rev. Lett. 91, 197206 (2003).
- Szunyogh et al. (1997) L. Szunyogh, B. Újfalussy, C. Blaas, U. Pustogowa, C. Sommers, and P. Weinberger, Phys. Rev. B 56, 14036 (1997).
- Parkin (1991) S. S. P. Parkin, Phys. Rev. Lett. 67, 3598 (1991).
- Celinski and Heinrich (1991) Z. Celinski and B. Heinrich, J. Magn. Magn. Mater. 99, L25 (1991).
- Przybylski et al. (2012) M. Przybylski, M. Dąbrowski, U. Bauer, M. Cinal, and J. Kirschner, J. Appl. Phys. 111, 07C102 (2012).
- Manna et al. (2013) S. Manna, P. L. Gastelois, M. Dabrowski, P. Kuświk, M. Cinal, M. Przybylski, and J. Kirschner, Phys. Rev. B 87, 134401 (2013).
- Nistor et al. (2010) L. E. Nistor, B. Rodmacq, S. Auffret, A. Schuhl, M. Chshiev, and B. Dieny, Phys. Rev. B 81, 220407 (2010).
- Chang et al. (2015) C.-H. Chang, K.-P. Dou, Y.-C. Chen, T.-M. Hong, and C.-C. Kaun, Sci. Rep. 5, 16844 (2015).
- Chang et al. (2017) C.-H. Chang, K.-P. Dou, G.-Y. Guo, and C.-C. Kaun, NPG Asia Mater. 9, e424 (2017).
- Kresse and Furthmüller (1996) G. Kresse and J. Furthmüller, Phys. Rev. B 54, 11169 (1996).
- Kresse and Joubert (1999) G. Kresse and D. Joubert, Phys. Rev. B 59, 1758 (1999).
- Ortiz et al. (2011) G. Ortiz, M. S. Gabor, J. T. Petrisor, F. Boust, F. Issac, C. Tiusan, M. Hehn, and J. F. Bobo, J. Appl. Phys. 109, 07D324 (2011).
- Wang et al. (1993) D.-s. Wang, R. Wu, and A. J. Freeman, Phys. Rev. B 47, 14932 (1993).
- Daalderop et al. (1994) G. H. O. Daalderop, P. J. Kelly, and M. F. H. Schuurmans, Phys. Rev. B 50, 9989 (1994).
- Wang et al. (1996) X. Wang, D. sheng Wang, R. Wu, and A. Freeman, J. Magn. Magn. Mater. 159, 337 (1996).