Interaction of the accretion flows in corona and disk near the black hole in AGN.
Accretion flows toward black holes can be of a quite different nature, described as an optically thick cool gas flow in a disk for high accretion rates or as a hot coronal optically thin gas flow for low accretion rates, possibly affected by outflowing gas. The detection of broad iron emission lines in active galactic nuclei (AGN) indicates the coexistence of corona and disk. The appearance and relative strength of such flows essentially depends on their interaction. Liu et al. suggested that condensation of gas from the corona to the disk allows to understand accretion flows of comparable strength of emission. Matter inflow due to gravitational capture of gas is important for the condensation process. We discuss observational features predicted by the model. Data from simultaneous observations of AGN with Swift’s X-ray and UV-optical telescopes are compared with the theoretical predictions. The frequent detection of broad iron K emission lines and the dependence of the emitted spectra on the Eddington ratio, described by the values of the photon index and the two-point spectral index are in approximate agreement with the predictions of the condensation model; the latter, however, with a large scatter. The model further yields a coronal emission concentrated in a narrow inner region as is also deduced from the analysis of emissivity profiles. The accretion flows in bright AGN could be described by the accretion of stellar wind or interstellar medium and its condensation into a thin disk.
Key Words.:
accretion, accretion disks – X-rays: binaries – X-rays: galaxies – galaxies: Seyfert – galaxies: individual: Mrk 3351 Introduction
Observations indicate that the accretion of gas onto black holes can be described in the form of an optically thick, geometrically thin accretion disk or a hot optically thin, vertically extended flow. In the inner regions of active galactic nuclei (AGN) both types of accretion flow often exist, that is, a disk embedded in a hot coronal flow. X-ray contributions from a corona have already been found in spectra during early AGN observations (e.g., Elvis et al. 1994, Nandra & Pounds 1994). Relativistic Fe K lines were first detected in ASCA data (Tanaka et al. 1995). The presence of X-ray reflection in the spectra of many AGN indicates that the downward emission from the hot coronal flow is Compton scattered by matter of an accretion disk in the inner region (Fabian et al. 2000). Recent results, for example, a multi-epoch spectral analysis of all XMM-Newton, Suzaku, and NuSTAR observations of Mrk 335 by Keek & Ballantyne (2016), confirm the existence of the accretion disk corona.
For the hot accretion flow different solutions were investigated. The advection-dominated accretion flow (ADAF, Narayan & Yi 1994, 1995a), the adiabatic inflow-outflow solution (ADIOS, Blandford & Begelman 1999), the convection-dominated accretion flow (CDAF, Igumenshchev & Abramowicz 1999), and the luminous hot accretion flow (LHAF, Yuan 2001) have been studied in detail (for a recent review see Yuan and Narayan (2014). Among these solutions, the ADAF is believed to exist in black hole X-ray binaries (BHXRBs) at low/hard state and low-luminosity AGN.
The coexistence of the cool and the hot accretion flow raises the question of the interaction of such flows. A radiatively coupled disk corona model was proposed for AGN by Haardt & Maraschi (1991). It is found that a significant fraction of the accretion energy should be released in the corona in order to produce strong X-ray emission with spectral index in AGN. A more detailed investigation on the interaction of disk and corona around a black hole was performed by Meyer et al. (2000), where both energy exchange and gas exchange are taken into account. Such a model predicts how the geometry of the two-phase accretion flows varies with the accretion rate in the innermost area, thereby leading to spectral variation.
The physical processes involved in the disk-corona interaction are similar for stellar-mass black holes and supermassive black holes if the mass supply to the accretion flows is the same. However, an essential difference between AGN and BHXRBs is the environment. In AGN, matter can be captured from stellar winds of evolved stars in the central region of the galaxy or from interstellar medium, in contrast to the Roche-lobe mass overflow in BHXRBs which results in mass inflow concentrated to the mid-plane. The inflowing gas in AGN is hot and the density in the corona is large. This causes condensation of coronal gas to the underlying disk, which, meanwhile, produces strong X-ray emissions as observed in AGN (Liu et al. 2015, Qiao & Liu 2017).
The aim of our paper is to check whether simultaneous UV/optical and X-ray observations of suitable AGN with moderate accretion rates are in agreement with the condensation model. In Section 2 we give a brief review of corona models in the context of AGN. In Section 3 we describe the physics of the energy balance between corona and disk and show numerical results. In Section 4 we compare characteristic values of the spectral energy distribution obtained from observations with model predictions. Our conclusions are presented in Section 5.
2 Interaction of disk and corona
Observations in AGN provides strong evidence supporting interaction between the disk and corona in the proximity of central black holes. The X-ray spectrum, which is believed to be composed of direct coronal emission, reflection and broadened iron lines, and the reverberation analyses (for a review see Uttley et al. 2014) indicate strong coupling between the corona and the disk. The variability of the relative strength of these radiation components with flux, as observed in some AGNs (e.g., Gallo et al. 2015), implies a change of the geometry of the corona flow with Eddington ratio . With the improving quality of spectra from different observatories, the X-ray emission from coronae and its interaction with the thin disk in the innermost regions of AGN become a main astrophysical goal (e.g., Fabian et al. 2016, Wilkins et al. 2014, Kara et al. 2016, Wilkins et al. 2016, Keek & Ballantyne 2016) .
Theoretically, the interaction of disk and corona can lead to mass exchange from corona to disk or vice versa. Evaporation of matter from the disk causes the truncation of a disk in its inner region from a certain radius inward to the innermost circular stable orbit (ISCO), provided that the mass supply to the disk accretion is low (Meyer et al. 2000, Różańska & Czerny 2000, Mayer & Pringle 2007). It is the vertical heat conduction that plays a key role, which establishes the balance between cool disk and hot corona. This process yields an important feature for understanding the state transitions and spectra of LMXBs (Remillard & McClintock 2006, Yuan & Narayan 2014, Belloni and Motta 2016).
In the inner region, radiative cooling can dominate over conduction if the Eddington-scaled accretion rate in the corona is relatively high, . In this case, the corona gas partially condenses into the disk and a weak inner disk forms underneath the corona. This occurs in BHXBs only for a few cases (Miller 2006, Rykoff et al. 2007, Tomsick et al. 2008, Reis et al. 2010) since the corona gas is supplied by disk evaporation, with which the coronal accretion rate is lower than 0.02 (Liu et al. 2006, Meyer et al. 2007, Taam et al. 2008). However, in AGN, the accretion rate supplied from wind or interstellar medium to the corona can be higher; condensation of corona gas to a thin disk is then a common phenomenon in bright AGN.
The heating of the corona was a long-existing problem in bright AGN. To solve this problem Haardt and Maraschi (1991) considered a “two-phase” accretion disk model, which was the first work on interaction between disk and corona in AGN. A substantial fraction of the gravitational power is assumed to be dissipated via buoyancy and reconnection of magnetic fields in a hot corona surrounding a disk with Comptonization of soft photons from the cold phase as the main cooling mechanism (for details see Liu et al. 2002; 2003). Nakamura & Osaki (1993) presented a model along this scenario emphasizing the strong coupling between the cold disk and the hot corona.
Recently the disk-corona interaction for bright AGN was investigated by Liu et al.(2015) and Qiao & Liu (2017) taking into account the accretion of matter from stellar winds or interstellar medium in the AGN environment. A schematic description of the mass and energy flow in the inner region for either mass supply from vertically extended hot gas (stellar wind and interstellar medium material) or Roche-lobe overflow in the mid-plane was shown in Liu et al. (2015, Fig. 1). The accretion of strong stellar winds or interstellar medium provides a mechanism for producing strong X-ray emission as observed in AGN. The energy comes from coronal accretion and condensation-released thermal energy. This alleviates the long-existing problem of corona heating, which had been a basic assumption in previous accretion models for bright AGN (e.g., Haardt & Maraschi 1991, Nakamura & Osaki 1993). On the other hand, if the gas supply rate by wind or stellar medium is very low, no condensation occurs. Instead, the disk gas evaporates to the corona, leading to a complete depletion of the thin disk. This picture is consistent with the low-luminosity AGN. The detailed processes of the interaction are summarized in the following.
3 Computational results for condensation in AGN
The interaction of corona and disk underneath arises through cooling of electrons. Due to the large temperature difference between the hot ADAF and the cool disk, thermal conduction and inverse Compton scattering result in cooling of electrons until the coupling of electrons and ions becomes efficient with decreasing height and decreasing temperature. In the layer between the coupling interface and the disk surface, electrons and ions have the same temperature, the density rises and radiation losses become important. If the radiation losses are larger than the down-flowing heat flux, matter condenses from the corona into the disk. If the down-flowing flux cannot be radiated away, matter evaporates from the disk into the corona. The efficiency of the radiation losses depends critically on the density in the radiative layer and the pressure in the corona. Thus, the condensation/evaporation rate is a function of the mass-flow rate in the corona (Meyer et al. 2007, Liu et al. 2007).
For simplicity, the accretion flows are divided into three layers in the vertical direction, that is, the disk, the transition layer and the corona. The upper, vertically extended corona is similar to an ADAF and can be described by the self-similar solutions (Narayan & Yi 1995b),
| (5) |
where , , , and are the coronal pressure, electron density, viscous heating rate, and sound speed, respectively. is the viscous parameter, the black hole mass in unit of solar mass, the coronal accretion rate in unit of Eddington rate, the radius in unit of the Schwarzschild radius, and are functions of advection fraction of accretion energy,.
The temperatures in ions and electrons, and are determined by three equations, that is, the state equation, the energy balance between heating and cooling for ions and for electrons, respectively. As is implicitly contained in , and , and the energy equations are non-linear, iterative computations are needed to solve the ADAF equations.
The main difference between the ADAF and corona originates from the additional cooling term in the energy equation caused by vertical conduction to the underlying disk and the Compton scattering of coronal electrons with disk photons. The heat conduction plays an important role in determining the corona quantities and mass exchange rate between the disk and the corona. The flux conducted from the corona to the transition layer can be approximated as (Spitzer 1962),
| (6) |
with the corona height, the thermal conductivity constant, the electron temperature which is determined by the energy balance between heating by collisions with ions and cooling by radiation through Bremsstrahlung, synchrotron, Compton scattering, complemented by the state equation, and energy balance between viscous/magnetic heating and collisional cooling for ions.
The energy balance in the transition layer is set by the incoming conductive flux, Bremsstrahlung radiation flux , and the enthalpy flux carried by the mass condensation flow, which yields the condensation rate per unit area at a given distance from the center (see Liu et al. 2015)
| (7) |
with
| (8) |
where and are temperature and molecular weight of ions, is the ratio of gas pressure to total pressure, is the ratio of specific heats , is the coupling temperature in the transition layer, determined by taking the heating of the ions as completely shared with the electrons, is the coefficient of free-free radiation (Sutherland & Dopita 1993) and is the Boltzmann constant.
As the condensed gas is the only source for disk accretion, the emission from the disk depends on both condensation rate and irradiation from the corona. This disk emission is the main part of seed photons in Compton cooling in the corona. Therefore, and on the right side of Eq.(7) are implicit functions of the condensation rate resulting from the energy balance. Numerical computations consistently yield the condensation rate, the coronal temperatures and densities for a given black hole mass, accretion rate , viscous parameter and magnetic parameter .
We then calculate the spectra emitted from both the corona and disk. Repeating such calculations for a series of accretion rates, we can obtain the variation of the spectrum with the Eddington ratio.
With typical parameters, , , , and , we perform numerical computations. For the illumination of the disk by the corona we assume that the radiation of the somewhat extended corona can be approximated by the radiation from a point source at a height (Qiao & Liu 2017). To check the effect of the simplification we discuss the distribution of coronal luminosity which depends on the mass flow.
The computations show that the hot gas will partially condense to an underlying inner disk, while a certain amount remains in the corona. The accretion rate in the disk decreases outward to a radius where no condensation is found anymore. As there is no ”Roche-lobe overflow” to the disk, the disk ends at . For accretion rates around 0.02 the resulting values for are comparable in the optical/UV and the X-ray domain, documenting the presence of a hot and a cool flow, a precondition for broad iron lines. For a rate =0.03 the value in the optical/UV range becomes higher than that in the X-ray range (see Qiao & Liu 2017). An inner disk should exist only if the accretion rate is not very low.
The two-point spectral index of optical/UV and X-ray radiation (Tananbaum et al.1979), here at and 2keV respectively, documents the relative strength of corona to disk (results for many AGN compiled by Steffen et al. 2006). Fig.1 shows how the index varies with the Eddington ratio .
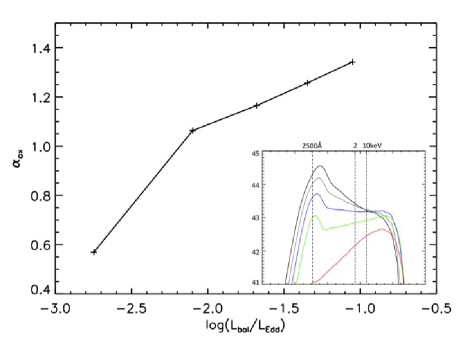
The Figure shows that increases with the Eddington ratio, which means the relative strength of corona emission to disk emission is weaker at higher Eddington ratios. For a higher mass supply rate to the corona, condensation is more efficient and starts at a larger distance. This results in less gas remaining in the inner corona and hence a decreased X-ray emission. Therefore, the relative strength of the corona decreases with increasing Eddington ratio. The steep variation of with at is caused by the transition from a pure ADAF to a disk-corona structure.
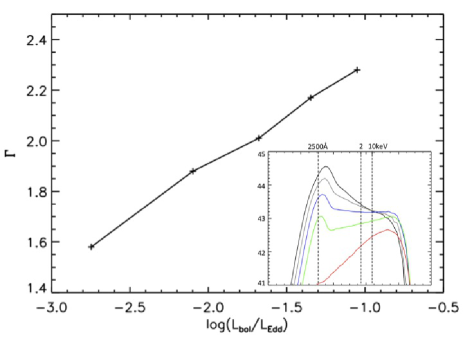
We also calculate the hard X-ray (2-10keV) photon index for various Eddington ratios and plot the results in Fig.2. The model predicts quite a large range of photon index, from 1.6 to 2.3, for an Eddington ratio change from 0.002 to 0.1. Very low photon indices as , correspond to a hard-state spectrum. In this case, the accretion flow is dominated by the corona and the inner disk is very small and weak. This is because cooling in the corona is inefficient at a low mass supply rate, thus, condensation can occur only in the region very close to the ISCO, while very little gas can condense to the disk. With increase of mass supply to the corona, cooling becomes more efficient, leading to more condensation. This puts the main accretion flow into the disk instead of the corona while the X-ray spectrum becomes steeper. At an accretion rate , a large fraction of the coronal gas condenses to the disk. The corona becomes weak and a high value of is reached.
The total amount of mass flow in the disk at given distance is calculated by integration of the condensation rate from the outer edge of the disk at to . The mass flow remaining in the corona then follows from the difference between the rate of inflowing matter in the corona and the integrated condensation rate. The mass flow in the corona is advection dominated (Narayan & Yi 1995b) and the radiation of the hot flow is due to the various electron cooling processes, Bremsstrahlung cooling, synchrotron cooling, self-Compton cooling and cooling by underlying disk photons on the electrons in the corona.
The luminosity of the corona is then calculated assuming irradiation of the disk from a point source at a height of 10 (Schwarzschild radius). Though the condensation leads to a somewhat radially extended mass distribution of the corona it was found that most of the luminosity is released in a very narrow inner region and might be simulated by radiation from a point source. We show the luminosity distribution in Fig.3.

4 Comparison with observations
4.1 Optical/UV to X-ray luminosity in active galactic nuclei
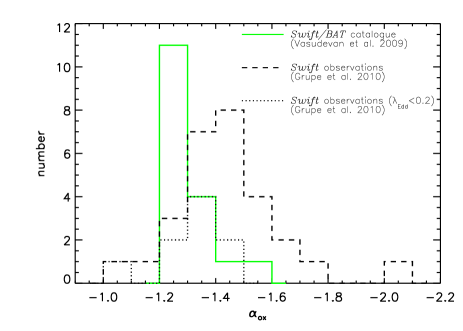
The index has a potential power for the documentation of accretion flows. As the dependence of flux at on the black hole mass differs from that at X-ray, the value of can be different for objects with different black hole mass even if their Eddington ratios are the same. This may lead to scattering when the model predictions are compared with observations for samples with a large range of black hole masses. Of special interest for a comparison of theoretical results and observations are simultaneous observations of optical/UV and X-ray flux such as those by Vasudevan et al. (2009) for 26 low-absorption AGN from the Swift-BAT 9-month catalog with which is the parameter range studied in the condensation model. For the comparison with model results () we consider sources with black hole masses in the range (17 sources). A histogram of these values is shown in Fig.4. Most of the sources lie in the range 1.1 to 1.35 as predicted by the model (Fig.1). From the model, a correlation between and the Eddington ratio would be expected, but was not found in the studied sample, maybe due to inaccuracies in mass determination methods as Vasudevan et al. (2009) pointed out.
A second sample with simultaneous observations are bright soft X-ray-selected AGN (Grupe et al. 2010), where 38 sources have a black hole mass around . Values of derived from the SED lie in a wide range; from 9 sources having leading up to sources having as high as 10 . The full sample and the subset are shown in Fig.4. The difference between the sample and the subset might indicate an increase of with increasing Eddington ratio. This is in agreement with the model prediction.
A third sample are X-ray selected type 1 AGN from the XMM-COSMOS survey studied by Lusso et al. (2010). The relation between and is shown in their Fig. 12. About half of the sources lie in the range of 0.01 to 0.1, as considered in the condensation model. There is a large scatter of values from 1.15 to 1.7. The scatter could be due to inaccuracies in mass determination and the determination of the SED. A comparable scatter is also found for the dependence of the hard bolometric correction on (their Fig. 11).
A very recent study of this relation (Fig.7 in Liu H. et al. 2017) also indicates no obvious correlation for many different samples. However, a correlation between and black hole mass has been found in their samples. This implies that the correlation between and Eddington ratio could become blurred by the different black hole masses in the above investigations. The large uncertainty in determining the X-ray flux (by hardness ratio rather than X-ray spectrum) is another reason.
But the study of the relation between and the monochromatic luminosity gives clearer results. Lusso et al. (2010) show this relation for the sources of their sample and find a significant correlation, though with quite a scatter also (their Fig. 7). The derived best-fit relation is
| (9) |
The theoretical calculated values are close to this relation: for the mass supply rate of, for example, 0.02 or 0.1, the values of log [ are 27.9 and 29.2 and values of are 1.06 and 1.34. The best-fit relation gives =1.12 and 1.34. This means the theoretical values agree with the best-fit values.
4.2 The photon index
The hard X-ray photon index of a power-law spectrum in the 2-10 keV band is one of the main characteristic features of the description of spectral properties. For a large part of the sources in the Vasudevan et al. (2009) sample (with low accretion ratio as mentioned above) the photon index derived is between 1.8 and 2.0. The condensation model (Qiao & Liu 2017) predicts an increase of the photon index from 1.6 to 2.3 for increasing Eddington ratio from 0.002 to 0.1 (Fig.2). The inaccuracies in mass-determination methods make a detailed study of the dependence of the photon index on the Eddington ratio difficult; for example, for five sources in two samples: in the Vasudevan et al. (2009) and also the Lubiński et al. (2016) sample, the black hole masses used differ by more than a factor of two, which corresponds to an essential difference of values for .
The Seyfert 1 galaxy Mrk 335 was observed several times during recent years. For the low-flux epoch in 2013 (Suzaku observation) a hard photon index of 1.9 was derived by Wilkins & Gallo (2015), which seems in agreement with model predictions. Keek & Ballantyne (2016) took observations of Mrk 335 during the years 2000 to 2014 and analyzed 12 X-ray spectra that span nearly a factor of 10 in flux. The authors point out that the derived values of photon index strongly correlate with the Eddington ratio (their Fig. 4). The Eddington ratio was calculated using a bolometric correction depending on .
For the low flux states, they found very low hard photon indices of around 1.4, definitely lower than those derived by Wilkins & Gallo (2015) and predicted by the model. Theoretically it is difficult to understand the very low values around 1.4. Though the photon index decreases with decreasing Eddington ratio as shown in Fig.2, this trend is inverted for further decreasing Eddington ratios. This is because condensation no longer occurs at very low accretion rate. Instead, evaporation depletes the inner disk, leaving only a corona/ADAF. Thus, the photon index emitted by an ADAF would increase with decreasing accretion rate, never reaching a value of 1.4. From the disk corona interaction model a lower photon index would be derived for a stronger heating of the corona, for example, if one assumes a larger viscosity value, which results in less efficient condensation and a denser corona, which then emits an X-ray spectrum with smaller photon index.
4.3 Illumination of the disk by the corona
The pattern of illumination of the disk by an X-ray-emitting source is one of the most interesting features of AGN. The emissivity profile is composed by the different profiles of the broad K emission line in the reflection spectrum when emitted from successive radii (Wilkins & Fabian 2011). Theoretical emissivity profiles were derived for illumination by coronae with different extension. The comparison of theoretical and observed emissivity profiles (Wilkins & Fabian 2012) yields, in combination with X-ray reverberation lags, information on the geometry of the accretion flow.
The analysis of theoretical emissivity profiles shows that a concentration of coronal flux near the center provides a relatively steep profile in the inner regions (Wilkins & Fabian 2012). Using these results Gallo et al. (2015) and Wilkins et al. (2015) investigate Suzaku observations for Mrk 335 during the low-flux state in 2013 and conclude from the emissivity profile that the corona is compact, at low height above the disk and extends to about five gravitational radii.
To compare with predictions of the condensation model one might ask which kind of emissivity profile would be expected. We show the luminosity contributed by radial annuli with in Fig.3. Most luminosity is released in the inner region, which should result in a steep inner emissivity profile as indicated by the observations for Mrk 335 in the low-luminosity state. But a detailed determination of the emissivity profile is beyond the scope of this paper.
Similar to these results for Mrk 335, Wilkins & Fabian (2011) point out that for the narrow line Seyfert 1 galaxy 1H0707-495 the emissivity profile derived for the observation in 2008 (Fabian et al. 2009) suggests a high percentage of the X-ray flux reflected from the innermost region (Fig. 8). But it is difficult to estimate the accretion rate in 1H0707-495 at the time of observation. For 1H0707-495 periods of varying flux are documented (Wilkins et al. 2014).
4.4 Fe K lines in AGN
A frequent detection of relativistic X-ray lines confirms a strong interaction between corona and disk flow as predicted by the condensation model. The broadening of the line indicates that the reflection occurs in the innermost region.
For the geometry of disk plus corona, the condensation model predicts a coexistence of disk and corona for mass supply rates larger than 0.01 for the given parameters in this work. For a higher mass supply rate, the accretion rate via the thin disk and the disk extension increase with the mass supply rate. In Fig.5 we show the disk size as a function of Eddington ratio. As shown, the disk extension can increase from a few to several hundred Schwarzschild radii. For an even higher Eddington ratio (beyond our calculation) a larger thin disk is expected. This coexistence provides the necessary condition for the formation of broad Fe lines. The strength and emissivity profile depend on ionization of iron.

Fabian et al. (2000) have already pointed out that the broadened iron line in the X-ray band at 6.4 to 6.9 keV is seen in the X-ray spectrum of many AGN and, in particular, Seyfert galaxies. Nandra et al. (2007) and Miller (2007) frequently found iron emission lines in different samples. But the geometry might be different from that in LMXBs in the intermediate hard spectral state, where the broad iron lines were found during outburst decline (Meyer-Hofmeister & Meyer 2011).
Recently Mantovani et al. (2016) critically examined the evidence for relativistic Fe K lines in Seyfert galaxies observed with Suzaku. The results show that the relativistic line is detected at % confidence in all sources observed with high signal-to-noise ratio, also in sources where such lines were not found earlier in XMM-Newton observations. The authors conclude that these lines are a ubiquitous feature in the spectra of Seyfert galaxies, but are often difficult to detect without very-high-quality data. These observations point to the coexistence of disk and corona as predicted by the condensation model for moderate accretion rates.
A further recent study of the broad Fe K line for a large sample of AGN with well measured optical parameters indicates that the detection of the broad Fe K line may strongly depend on the Eddington ratio (Liu Z. et al. 2016), interpreted as possibly caused by the disk size varying with the Eddington ratio in the condensation model, as shown in Fig.5. With the disappearance of the thin disk at low Eddington ratio, no broad Fe K line is expected.
5 Conclusions
We study the interaction of disk and coronal accretion flows in AGN that are fueled by stellar winds or interstellar medium. Different from Roche-lobe overflow in BHXBs, wind accretion in AGN can support a strong corona at high accretion rates, providing a physical scenario for interpreting strong X-ray emission observed in bright AGN.
Numerical calculations of the interacting mass flows in disk and corona allow us to derive the emitted spectra and reveal that the optical–X-ray spectral index increases with the Eddington ratio , which implies that the emission from the corona relative to the disk is weaker at a higher Eddington ratio.
We compare the computational results with observations. The values of for different samples plotted against the Eddington ratio have a large scatter which might be due to different black hole mass and inaccuracies of the SED , but theoretical results for a relation between and luminosity at 2500 are, despite also some scatter, in good agreement with best-fit parameters (Lusso et al. 2010). The dependence of on the theoretically derived Eddington ratio is in agreement with results by Keek & Ballantyne (2016) for Mrk 335.
The steep inner part of the emissivity profile of Mrk 335 in the low-luminosity state was interpreted as pointing to illumination by a centrally concentrated light source (Gallo et al. 2015). A similar illumination of the disk is predicted by the condensation model with a coronal luminosity released mainly in an innermost region.
A further interesting feature is the apparently frequent detection of broad Fe K lines in AGN for a wide range of Eddington ratios. The condensation model with wind accretion provides a natural interpretation for the occurrence of the relativistic iron lines.
Acknowledgements.
B.F.L. acknowledges the support from the National Program on Key Research and Development Project (Grant No. 2016YFA0400804) and the National Natural Science Foundation of China (grant 11673026).References
- (1) Belloni, T.M. & Motta, S.E. 2016, Astrophysics of Black Holes, in Astrophysics and Space Science Library, Vol. 440, Springer-Verlag Berlin Heidelberg, p. 61
- (2) Blandford, R.D. & Begelman, M.C. 1999 MNRAS 303, L1
- (3) Chiang, J., & Blaes, O. 2003, ApJ 586, 97)
- (4) Elvis, , M., Wilkes, B.J., McDowell, J.C. et al. 1994, ApJS 95, 1
- (5) Fabian, A.C., Iwasawa, K., Reynolds, C.S. et al. 2000, PASP, 112, 1145
- (6) Fabian, A.C., Zoghbi, A., & Ross, R.R. 2009, Nat 459, 540
- (7) Fabian, A.C., Alston, W.N., Cackett, E.M. et al. 2016, Astron. Nachr. 999, No. 88, 789
- (8) Gallo, L.C., Wilkins, D.R., Bonson, K. et al. 2015, MNRAS 446, 633
- (9) Grupe,D., Komossa, S., Leighly, K.M. et al. 2010, ApJS, 187, 64
- (10) Haardt, F., & Maraschi, L. 1991, ApJ, 380, L51
- (11) Igumenshchev, I.V. & Abramowicz, M.A. 1999, MNRAS 303, 309 779, 1
- (12) Kara, E., Alston, W.N., Fabian, A.C. et al. 2016, MNRAS 462, 511
- (13) Keek, L., & Ballantyne, D.R. 2016, MNRAS 456, 2722
- (14) Liu, B. F., Mineshige, S., & Ohsuga, K. 2003, ApJ, 587, 571
- (15) Liu, B. F., Mineshige, S., & Shibata, K. 2002, ApJL, 572, L173
- (16) Liu, B.F., Meyer, F., & Meyer-Hofmeister, E. 2006, A&A, 454, L9
- (17) Liu, B.F., Taam, R.E., Meyer-Hofmeister, E., Meyer, F. 2007, ApJ 671, 695
- (18) Liu, B.F., Taam, R., Qiao, E. et al. 2015, ApJ, 806, 223
- (19) Liu, H., Yuan, W., Dong, X.-B. et al. 2017, to appear in ApJ
- (20) Liu, Z., Yuan, W., Lu, Y. et al. 2016, MNRAS, 463, 684
- (21) Lubiński, P., Beckmann, V., Gibaud, L. et al. 2016, MNRAS 458, 2454
- (22) Lusso, E., Comastri, A., Vignali, C. et al. 2010, A&A 512, A34
- (23) Mantovani, G., Nandra, K., & Ponti, G. 2016, MNRAS, 458, 4198
- (24) Mayer, M., & Pringle, J.E. 2007, MNRAS, 376, 435
- (25) Meyer, F., Liu, B.F., & Meyer-Hofmeister, E. 2000, A&A, 361, 175
- (26) Meyer, F., Liu, B.F., & Meyer-Hofmeister, 2007, A&A, 463, 1
- (27) Meyer-Hofmeister, E., & Meyer, F. 2011, A&A 527, 127
- (28) Miller, J.M. 2007, ARA&A 45, 441
- (29) Miller, J.M., Homan, J.,& Miniutti, G. 2006, ApJ, 652, L113
- (30) Nakamura, K. & Osaki, Y. 1993, PASJ 45, 775
- (31) Nandra,K., & Pounds, K.A. 1994, MNRAS 268, 405
- (32) Nandra,K., O’Neill, P.M., George, I.M. et al. 2007, MNRAS 382, 194
- (33) Narayan, R., & Yi, I. 1994, ApJL, 428, L13
- (34) Narayan, R., & Yi, I. 1995a, ApJ, 444, 231
- (35) Narayan R., & Yi I., 1995b, ApJ, 452, 710
- (36) Qiao, E., & Liu, B.F. 2017, MNRAS 467, 898
- (37) Quataert,E., Di Matteo, T., Narayan, R. et al. 1999, ApJL 525, L89
- (38) Reis, R.C., Fabian, A.C., & Miller, J.,M. 2010, MNRAS 402, 836
- (39) Remillard, R.A., & McClintock, J.E. 2006, ARA&A 44, 49
- (40) Różańska, & A. Czerny, B. 2000, MNRAS 316, 473
- (41) Rykoff, E.S., Miller, J.M., Steeghs, D. et al. 2007, ApJ, 666, 1129
- (42) Spitzer, L. 1962, Physics of Fully Ionized Gases (2nd ed.; New York: Interscience)
- (43) Steffen, A.T., Strateva,I., Brandt, W.N., et al. 2006, AJ 131, 2826
- (44) Sutherland, R.S. & Dopita, M.A. 1993, ApJS, 88, 253
- (45) Taam, R.E., Liu, B.F., Meyer, F. et al. 2008, ApJ, 688, 527
- (46) Tanaka, Y.,Nandra, K., Fabian, A.C., et al. 1995, Nature 375, 659
- (47) Tananbaum, H., Avni, Y., Branduardi, G. et al. 1979, ApJ 234, L9
- (48) Tomsick, J.A., Kalemci, E., Kaaret, P. et al. 2008, ApJ, 680, 593
- (49) Uttley P., Cackett E. M., Fabian A. C., Kara E., Wilkins D. R., 2014, A&AR, 22, 72
- (50) Vasudevan, R.V., Mushotzky, R.F., Winter, L.M. et al. 2009, MNRAS 399, 1553
- (51) Wilkins, D.R., & Fabian, A.C. 2011, MNRAS 414, 1269
- (52) Wilkins, D.R., & Fabian, A.C. 2012, MNRAS 424, 1284
- (53) Wilkins, D.R., & Gallo, L.C., 2015, MNRAS 449, 129
- (54) Wilkins, D.R., Kara, E., Fabian, A.C. et al. 2014, MNRAS 443, 2746
- (55) Wilkins, D.R., Gallo, L.C., Grupe, D. et al. 2015, MNRAS 454, 4440
- (56) Wilkins, D.R., Cackett, E.,M., Fabian, A.C. et al. 2016, MNRAS 458, 200
- (57) Yuan, F. 2001, MNRAS 324, 119
- (58) Yuan, F., & Narayan, R. 2014, ARA&A 52, 529