Anomalous magneto-elastic coupling in Au-doped BaFe2As2
Abstract
We used polarization-resolved Raman scattering to study magneto-elastic coupling in Ba(Fe1-xAux)2As2 crystals as a function of light Au-doping, materials for which temperatures of the structural transition () and of the magnetic ordering transition () split. We study the appearance of the (As) phonon intensity in the scattering geometry that is very weak just below , but for which the intensity is significantly enhanced below . In addition, the (As) phonon shows an asymmetric line shape below and an anomalous linewidth broadening upon Au-doping in the magnetic phase. We demonstrate that the anomalous behavior of the (As) phonon mode in the scattering geometry can be consistently described by a Fano model involving the (As) phonon mode interacting with the symmetry-like magnetic continuum in which the magneto-elastic coupling constant is proportional to the magnetic order parameter.
pacs:
74.70.Xa,74,74.25.ndI Introduction
It is widely accepted that the magnetic and electronic properties of the Fe-based superconductors are very sensitive to the As height with respect to the Fe plane, and to the Fe-As-Fe bond angle of the Fe-As tetrahedra Kuroki et al. (2009a); Lee et al. (2014); Balédent et al. (2015); Vildosola et al. (2008); Calderón et al. (2009); Yin et al. (2008); Yndurain (2011); de la Cruz et al. (2010); Zhang et al. (2014a); Lee et al. (2008); Zhao et al. (2008); Kuroki et al. (2009b); Garbarino et al. (2011). The -axis vibration of the As atom corresponds to a fully symmetric phonon mode () that modulates these two parameters. First-principles calculations show that the phonon mode frequencies agree well with experiments when the Fe magnetic ordering is included Yildirim (2009); Boeri et al. (2010); Zbiri et al. (2009); Reznik et al. (2009); Hahn et al. (2009); Mittal et al. (2013); Hahn et al. (2013), and theoretical investigations suggest that the electron-phonon coupling constant is enhanced in the magnetic state Zbiri et al. (2009); Yndurain and Soler (2009); Huang et al. (2010); García-Martínez et al. (2013); Coh et al. (2016). The peak position of the fully symmetric As phonon density-of-states in the calculation with the collinear magnetic structure decreases by 23% compared with non-magnetic calculations Yildirim (2009). Experimental results suggest that the fully symmetric As mode plays a major role in the electron-phonon coupling in BaFe2As2 Rettig et al. (2015).
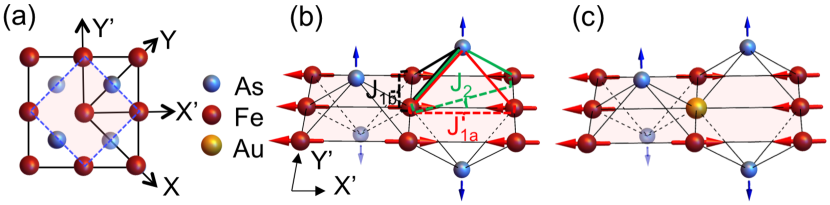
Supported by previous Raman scattering investigations Choi et al. (2008); Zhang et al. (2014b); Chauvière et al. (2011a); Kretzschmar et al. (2016); Kaneko et al. (2017); Gnezdilov et al. (2013), recently we reported a Raman study of a variety of parent compounds of Fe-based superconductors in which we note a significant intensity enhancement, below the Néel temperature , of the emergent fully symmetric As phonon mode measured in the unfavorable scattering geometry S.-F. Wu, W.-L. Zhang, V. K. Thorsmølle, G. F. Chen, A. S. Sefat, Y. G. Shi, H. Ding, P. Richard, and G. Blumberg (Fig. 1). This enhancement is found only for magnetically-ordered compounds. The results are interpreted in terms of a magneto-elastic coupling. In agreement with previous Raman studies on Ba(Fe1-xCox)2As2 Chauvière et al. (2011a); Kretzschmar et al. (2016), we also observed an asymmetric line-shape for the fully symmetric As mode below in the same scattering geometry. Our results are described by a Fano model involving a coupling between the fully symmetric As mode and the electronic continuum, with the coupling constant proportional to the magnetic order parameter S.-F. Wu, W.-L. Zhang, V. K. Thorsmølle, G. F. Chen, A. S. Sefat, Y. G. Shi, H. Ding, P. Richard, and G. Blumberg . The purpose of this paper is to detail this model and to apply it to Au-doped BaFe2As2, a system where the structural phase transition temperature is a few Kelvin degrees higher than the magnetic phase transition temperature Li et al. (2015); S.-F. Wu, W.-L. Zhang, L. Li, H.-H. Kung, A. S. Sefat, H. Ding, P. Richard and G. Blumberg . The experimental results support the previous observations, confirm the validity of the model, and gives about 1.5 meV as an estimate of the magneto-elastic coupling constant in the parent compound. Interestingly, we find an anomalous linewidth broadening upon Au-doping, essentially limited to the magnetic phase.
II Experiment and Methods
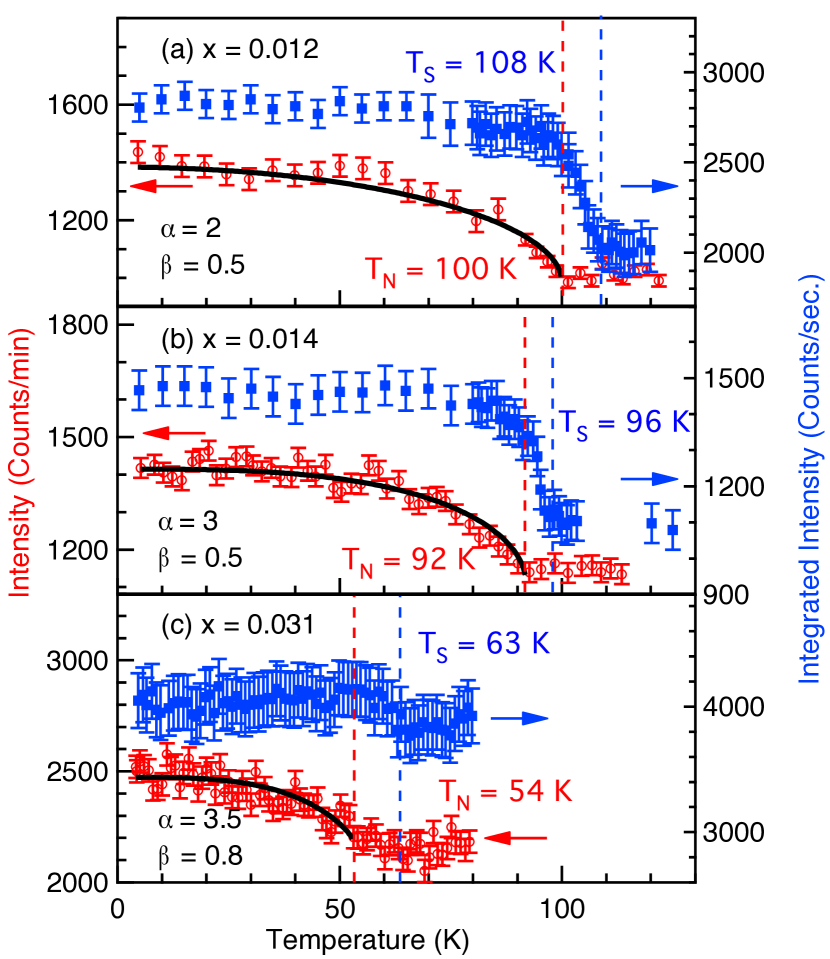
Single crystals of Ba(Fe1-xAux)2As2 (x = 0, 0.012, 0.014 and 0.031) were grown out of self-flux using a high-temperature solution-growth technique described in Refs. Sefat (2013); Li et al. (2015), and the chemical compositions were determined by inductive coupled plasma analysis Li et al. (2015). Neutron diffraction measurements on Au-doped samples were performed using the four-circle diffractometer HB-3A at the High Flux Isotope Reactor (HFIR) at the Oak Ridge National Laboratory to distinguish the structural and magnetic transitions. A neutron wavelength of 1.542 Å was used from a bent perfect Si-220 monochromator Chakoumakos et al. (2011). The corresponding structural phase transition temperatures () for Ba(Fe1-xAux)2As2 are determined by the temperature evolution of the integrated intensity of lattice Bragg peak in the tetragonal phase to in the orthorhombic phase [Fig. 2]. The corresponding magnetic phase transition temperature () is determined for each sample composition from the temperature evolution of the magnetic Bragg peak intensities in the tetragonal phase to in the orthorhombic phase [Fig. 2]. The and for the parent compound BaFe2As2 are determined by resistivity and magnetic susceptibility measurements Li et al. (2015). All the and values for Ba(Fe1-xAux)2As2 are summarized in Table 1.
| Sample | M | ||
|---|---|---|---|
| BaFe2As2 | 135 | 135 | 0.87 Dai (2015) |
| Ba(Fe0.988Au0.012)2As2 | 108 | 100 | 0.500.02 |
| Ba(Fe0.986Au0.014)2As2 | 96 | 92 | 0.420.04 |
| Ba(Fe0.969Au0.031)2As2 | 63 | 54 | 0.360.02 |
The crystals used for Raman scattering were cleaved and positioned in a continuous helium flow optical cryostat. The Raman measurements were performed using the Kr+ laser line at 647.1 nm (1.92 eV) in a quasi-back scattering geometry along the crystallographic -axis. The excitation laser beam was focused into a m2 spot on the -surface, with the incident power around 10 mW. The scattered light was collected and analyzed by a triple-stage Raman spectrometer, and recorded using a liquid nitrogen-cooled charge-coupled detector.
The laser heating in the Raman experiments is determined by imaging the appearance of stripes due to twin domain formation at the structural phase transition temperature Kretzschmar et al. (2016). When stripes appear under laser illumination, the spot temperature is just slightly below , thus , where is the temperature of cold helium gas in the cryostat, is the laser power and is the heating coefficient. By recording when the stripes appear at different laser powers, we can deduce the heating coefficient using a linear fit: K/mW.
In this manuscript, we define the and directions along the two-Fe unit cell basis vectors (at 45∘ degrees from the Fe-Fe directions) in the tetragonal phase, whereas and are along the Fe-Fe directions [Fig.1].
III Results and discussions
| Geometry | ||
|---|---|---|
| + | + | |
| not a proper geometry | ||
| + | ||
| not a proper geometry | ||
| + | ||
| + | ||
The body-centered crystal structure of BaFe2As2 in the high temperature phase belongs to space group (point group ). Below , the space group symmetry lowers to (point group ). The non-degenerate Raman active phonon modes at high-temperature () are (As)+(Fe). The Raman selection rules for the point group indicate that the , , and scattering geometries probe , , and , respectively. However, in the orthorhombic phase with point group symmetry, the unit cell of BaFe2As2 rotates by 45 degrees; the and representations of the point group merge into the representation of the point group, and and () merge into ().
In the orthorhombic phase, the three proper scattering polarization geometries are , and . Since the orthorhombicity is small, the improper and polarizations still probe and symmetry excitations, respectively. The symmetry correspondence for the point groups and are summarized in Table 2 Zhang et al. (2016).
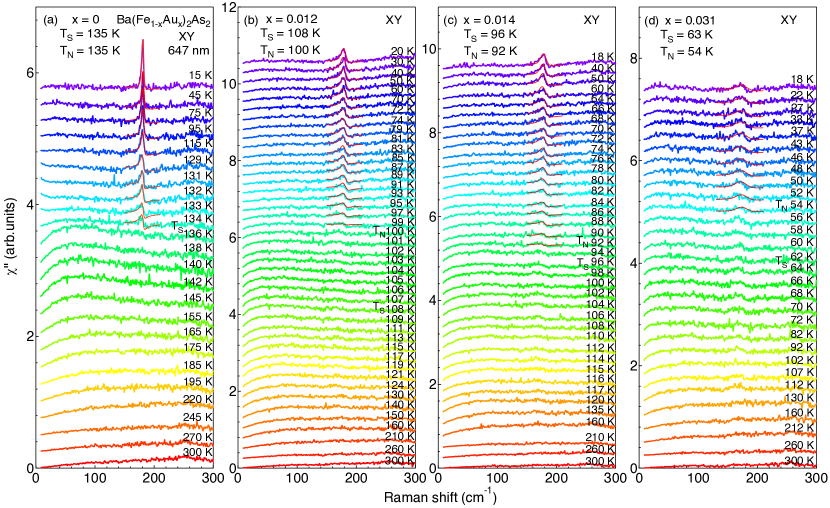
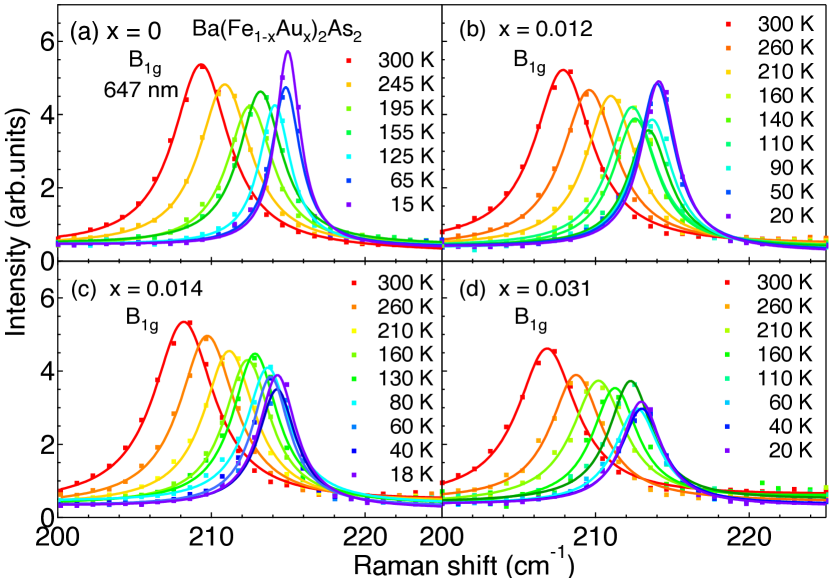
In Figs. 3(a)-3(d), we show detailed temperature evolution of Raman spectra for Ba(Fe1-xAux)2As2 (, 0.012, 0.014 and 0.031) in the scattering geometry. The and values of each sample, carefully characterized by neutron scattering [Fig. 2], are indicated in each panel. For the parent compound BaFe2As2 [Fig. 3(a)], the (As) phonon mode appears instantly below 134 K, which is close to and . The phonon mode rapidly sharpens upon cooling and becomes more symmetric. For Ba(Fe0.988Au0.012)2As2, (108 K) and (100 K) are split. The Raman data, displayed in Fig. 3(b), show that the (As) mode is hardly detectable between and . Similarly as in Co-doped BaFe2As2, the mode gains strength only below F. Kretzschmar, T. Böhm, U. Karahasanović, B. Muschler, A. Baum, D. Jost, J. Schmalian, S. Caprara, M. Grilli, C. Di Castro, J. G. Analytis, J.-H. Chu, I. R. Fisher and R. Hackl (2016). Although the asymmetry of the phonon line shape decreases upon cooling, we note that it remains more asymmetric than in pristine BaFe2As2 down to the lowest temperature. We report similar observation for Ba(Fe0.986Au0.014)2As2 [Fig. 3(c)] and Ba(Fe0.969Au0.031)2As2 [Fig. 3(d)] 111We note that for Ba(Fe0.969Au0.031)2As2 (As) phonon intensity appears above in forbidden polarization (see Fig. 3(d)). The leakage is due to the local symmetry breakdown for crystals with high Au impurity concentration for which the selection rules are relaxed., although the peak becomes broader due to the disorder introduced by Au-doping.
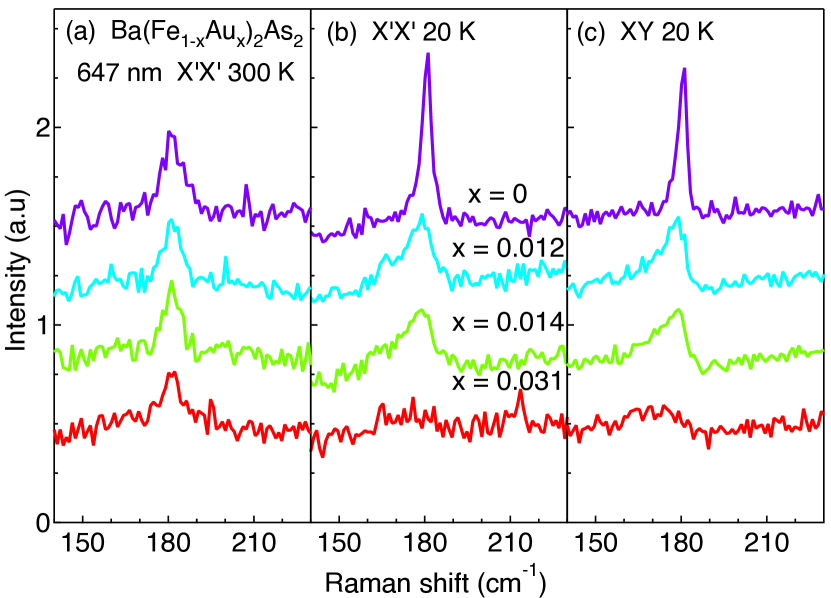
Broadening of the spectra due to the disorder introduced from dopants is expected. However, Fig. 4 indicates that the disorder effect in Ba(Fe1-xAux)2As2 is far from trivial. Indeed, the data show a broader line-width at 20 K than at 300 K. This would be expected only if disorder itself has a strong impact on the magneto-elastic coupling. In Figs. 4(a) and 4(b), we compare the doping evolution of the (As) phonon in the scattering geometry at 300 K and 20 K. At 300 K, in the non-magnetic phase, the (As) phonon is symmetric and shows nearly doping-independent mode frequency, linewidth and intensity, as shown in Fig. 4(a). Fig. 4(b) illustrates contrasting behavior for the (As) phonon at 20 K. We observe significant broadening, weakening, softening and a pronounced asymmetric line-shape upon Au-doping. Similar anomalous (As) phonon behavior in the magnetic phase is also detected in the scattering geometry at 20 K [Fig. 4(c)].
Before moving forward with a more quantitative analysis of the (As) phonon, it is instructive to take a closer look at the phonon, associated with the vibration of the Fe atom along the axis. While below the orthorhombic transition, the phonon is symmetry-allowed to couple to the -like electronic continuum, such coupling is not possible for the (Fe) phonon, and accordingly, the line shape of this mode in the configuration remains symmetric for all temperatures. However, a priori the (Fe) phonon could couple to the -like electronic continuum. To investigate this possibility, we display in Fig. 5 the temperature evolution of the (Fe) phonon at different Au-doping levels.
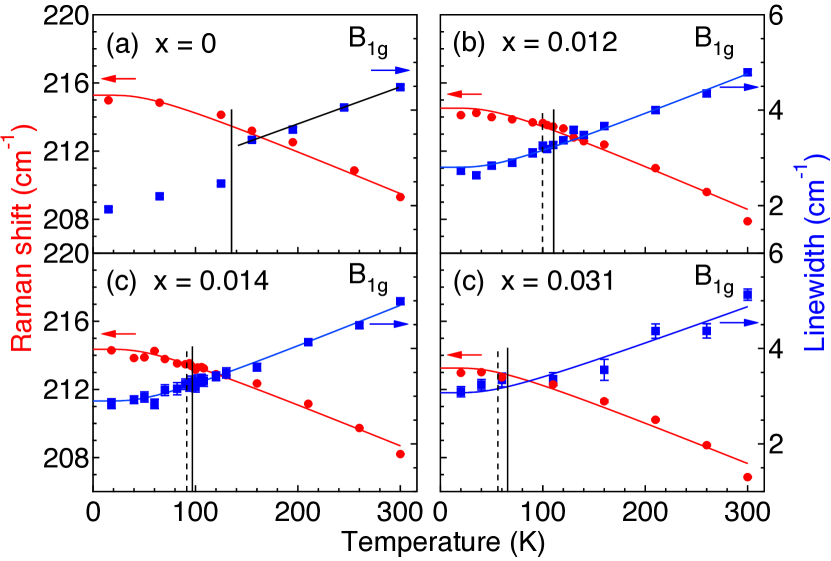
Upon cooling, the (Fe) phonon mode hardens and sharpens without detected anomalies around (see Figs. 6(a)-6(d)), except for the linewidth of the parent compound BaFe2As2, which displays a discontinuity around Chauvière et al. (2011b). The temperature dependence of the mode frequency and linewidth for the four Au-doping concentrations can be fitted by the anharmonic phonons decay model P. G. Klemens (1966); J. Menéndez and M. Cardona (1984):
| (1) |
| (2) |
| Sample | (cm-1 ) | |||
|---|---|---|---|---|
| BaFe2As2 | 217.25 | 1.97 | - | - |
| Ba(Fe0.988Au0.012)2As2 | 216.54 | 2.02 | 2.14 | 0.67 |
| Ba(Fe0.986Au0.014)2As2 | 216.28 | 1.92 | 2.22 | 0.68 |
| Ba(Fe0.969Au0.031)2As2 | 215.14 | 1.89 | 2.46 | 0.61 |
The fitting parameters are summarized in Table 3. The (Fe) phonon shows slight softening and broadening upon Au doping. There is no indication of a coupling between the (Fe) phonon and the electronic continuum. We also note that the linewidth of the (Fe) phonon broadens only by 1 cm-1 from to at 20 K, demonstrating that Au-doping barely affects the (Fe) phonon, in contrast to the (As) phonon.
As discussed in Ref. S.-F. Wu, W.-L. Zhang, V. K. Thorsmølle, G. F. Chen, A. S. Sefat, Y. G. Shi, H. Ding, P. Richard, and G. Blumberg , the enhancement of the (As) phonon intensity upon entering the magnetic phase is related to the magnetic moment. Although there is increasing evidence for a description of the magnetism of the Fe-based superconductors beyond simple weak coupling or strong coupling theories E. Bascones, B. Velenzuela and M. J. Caldéron (2016), it worths taking a look at these theories in order to get hints on a microscopic description of the enhancement of the (As) phonon intensity.
The enhancement of the (As) phonon intensity can be rationalized in several ways. A previous theoretical paper García-Martínez et al. (2013) proposes two mechanisms to explain the enhancement of the (As) phonon intensity due to the electron-phonon coupling upon entering the magnetic phase. The first mechanism is directly related to the geometrical parameters such as the Fe-As-Fe angle, whereas the second one has to do with the modification of the Fe-As Slater-Koster energy integrals and due to As displacements. Both mechanisms result in finite intensity in the channel when the magnetic moment is finite, which is consistent with our experimental results.
The (As) phonon intensity enhancement can also be understood from a model derived from the strong coupling approach Si and Abrahams (2008); C. Fang, H. Yao, W.-F. Tsai, J. P. Hu and S. A. Kivelson (2008); Xu et al. (2008, 2008). Here the effective nearest and next-nearest neighbors super-exchange parameters and are determined by the details of the Fe-As-Fe configuration. Below , the effective super-exchange constant becomes anisotropic along the and directions, either due to the anisotropy of the ordered magnetic moment Nevidomskyy (2011), or due to the difference in the electron hopping probability along and perpendicular to the stripe directions Anderson (1959). As the (As) phonon -axes vibration modulates the effective super-exchange parameters and via the As bridge, is also modulated because the super-exchange Fe-As-Fe path along the and directions are different. The relative anisotropy of the in-plane electronic polarizability along the and directions, as induced by the (As) phonon, is proportional to . The term becomes nonzero only below when the collinear AFM order is established, explaining why the (As) phonon in the geometry appears below with enhanced intensity.
Whether it originates from the local mechanism described just above, or it is caused by the bi-quadratic interaction revealed to be large due to deviations from a local picture A. L. Wysocki, K. D. Belashchenko and V. P. Antropov (2011), the effective term, proportional to the in-plane electronic polarizability, was shown to be proportional to the square of the magnetic ordered moment Nevidomskyy (2011). Furthermore, the (As) phonon intensity ratio in and scattering geometries is also demonstrated to scale with the square of the magnetic ordered moment S.-F. Wu, W.-L. Zhang, V. K. Thorsmølle, G. F. Chen, A. S. Sefat, Y. G. Shi, H. Ding, P. Richard, and G. Blumberg . These results suggest a magneto-elastic coupling with a strength proportional to the magnetic order parameter Han et al. (2009); Rettig et al. (2015); Mandal et al. (2014), a fact that we are going to exploit.
In order to quantify the electron-phonon interaction evidenced by the Raman data in the scattering geometry below , we introduce a Fano model in which the (As) phonon couples to the -like electronic continuum S.-F. Wu, W.-L. Zhang, V. K. Thorsmølle, G. F. Chen, A. S. Sefat, Y. G. Shi, H. Ding, P. Richard, and G. Blumberg . The resulting line shape, which describes the interference between a discrete phonon mode and an interacting continuum Fano (1961); Cardona (1983); Blumberg et al. (1994), has the following form:
| (3) |
where is the bare phonon frequency, is the magneto-elastic coupling constant, and are the Raman coupling amplitudes to the phonon and to the electronic continuum, respectively, and is the electronic density-of-states in the vicinity of the phonon frequency.
For BaFe2As2, we derive the temperature dependence of the magnetic order parameter obtained from the fitting of the temperature evolution of the magnetic Bragg peak intensity Wilson et al. (2009) (the magnetic Bragg peak intensity is proportional to the square of the magnetic order parameter). Since barely changes upon cooling, we use the constant cm-1 derived from the peak frequency in the scattering geometry at 15 K. We also fix the coupling of light to the electronic continuum , and we keep and as two -dependent fitting parameters. The spectrum at 15 K is well reproduced with , states/cm-1, and cm-1. The temperature dependence of , which is proportional to the magnetic order parameter, is shown in Fig. 7(a). The temperature evolutions of and are illustrated in Figs. 7(b) and 7(c), respectively.
| Au-doping | (cm-1 ) | (cm-1 ) | (cm-1 ) | ||
|---|---|---|---|---|---|
| 0 | 181.4 | 1.4 | 0.85 | ||
| 0.012 | 179.3 | 1.4 | 3.5 | ||
| 0.014 | 178 | 1.4 | 4.3 | ||
| 0.031 | 175 | 1.4 | 9 |
For Au-doped BaFe2As2 below , we convolute the Fano intensity with a Gaussian inhomogeneous broadening factor . The broadening is determined by fitting the spectra at the lowest temperature for each doping. The values are summarized in Fig. 7(d).
The temperature dependence of the Bragg peak intensity below is fitted with the formula , as shown in Fig. 2. Thus, the normalized magnetic order parameter is obtained using [Table 4]. As shown in Figs. 3(b)-3(d), the Raman data for the Au-doped samples are well described by the model. The corresponding temperature dependence of and for all Au dopings are given in Figs. 7(b) and 7(c), respectively. The sets of fixed parameters are given in Table 4. We note that we have normalized the parameters and to their values at 20 K. We also kept the electronic continuum transition matrix elements the same for all Au-doping concentrations.
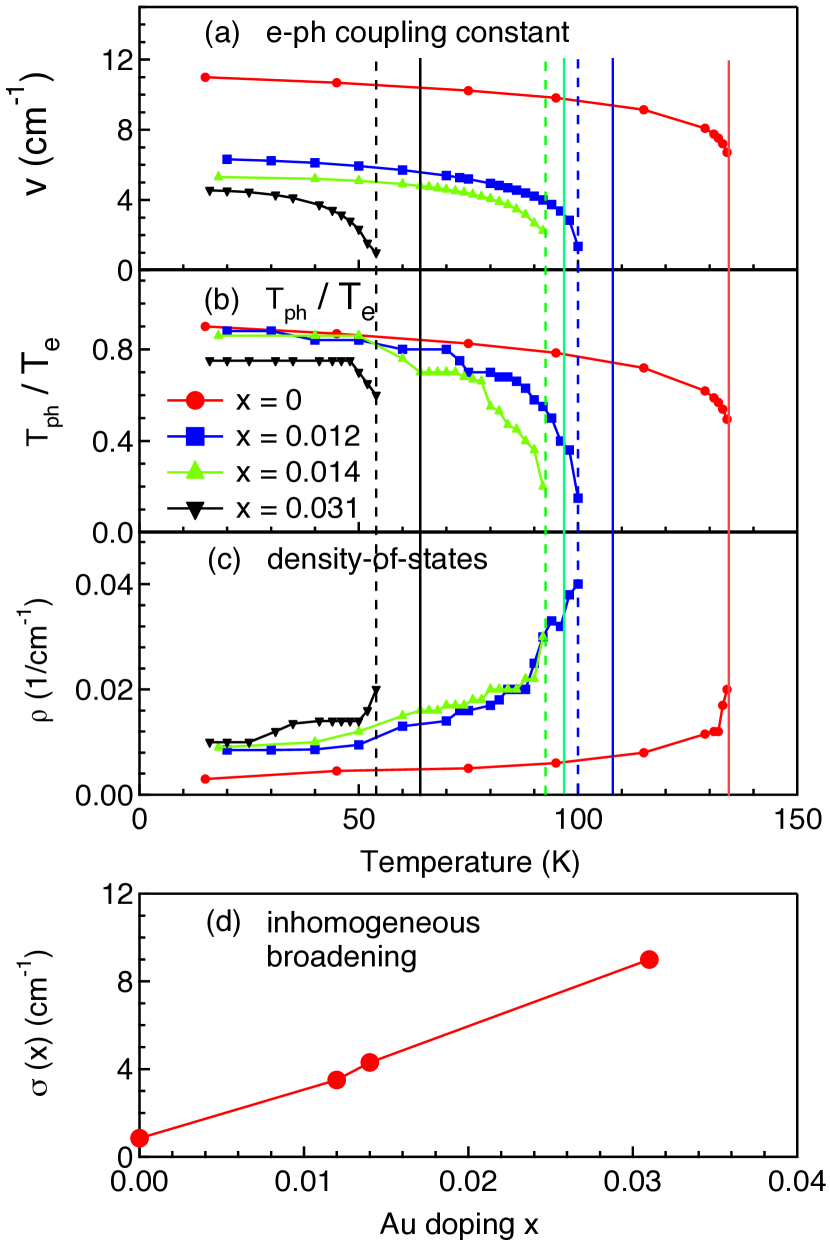
As shown in Fig. 7(b), the Raman coupling amplitude to the phonon () increases upon cooling as an order parameter. This observation is reasonable because itself should be proportional to the lattice orthorhombicity .
The electronic density-of-states represented by the parameter decreases upon cooling, which is consistent with the opening of a spin-density-wave gap Hu et al. (2008); P. Richard, K. Nakayama, T. Sato, M. Neupane, Y.-M. Xu, J. H. Bowen, G. F. Chen, J. L. Luo, N. L. Wang, X. Dai, Z. Fang, H. Ding and T. Takahashi (2010); Zhang et al. (2016); Chauvière et al. (2011a). This observation provides a natural explanation for the reduction of the asymmetry in the (As) phonon line shape upon cooling below Chauvière et al. (2011a).
The parameter describes the inhomogeneous broadening effect due to the Au substitution of Fe. As shown in Fig. 1(c), the non-magnetic Au disorder introduced at the Fe position significantly perturbs the local magnetic order and weakens the Fe-Fe spin-spin correlation length. Indeed, only 3.1% Au-doping is sufficient to lower from 135 K to 53 K. Each non-magnetic local Au dopant has four As neighbors and effectively changes the coupling strength between the (As) mode and the local Fe magnetic order parameter. The Au-doping has a major effect on the (As) phonon, unlike the (Fe) phonon. The broadening of the (As) phonon at is 9 cm-1, while it is only 1 cm-1 at 20 K for the (Fe) phonon. The significant broadening of the (As) phonon mode upon Au-doping in the magnetic state indicates a strong coupling of the (As) phonon to magnetism García-Martínez et al. (2013).
Finally, the enhanced electron-phonon coupling in the collinear AFM phase may have implications to superconductivity in the Fe-based superconductors. Earlier calculations of the electron-phonon coupling constant in the nonmagnetic phase led to Boeri et al. (2008). According to recent calculations, the electron-phonon matrix element is enhanced four times in the collinear AFM phase due to the presence of Fermi surfaces around the point Coh et al. (2016, 2015). The enhancement is notably important at 22 meV in the Eliashberg spectral function, which coincides with the energy of the mode. Therefore, the intra-band paring temperature is possibly enhanced due to the electron-phonon coupling.
IV Conclusion
In conclusion, we used polarized Raman scattering to study Au-doped BaFe2As2 samples for which the and transition temperatures split. Our results confirm that the intensity of the (As) mode in the scattering geometry is enhanced only below and also reveal an asymmetric phonon line shape of the (As) mode that becomes more symmetric upon cooling. To describe the line shape of the phonon peaks, we adopted a Fano model accounting for the magneto-elastic coupling. The enhancement of intensity below is consistent with a magneto-elastic coupling constant proportional to the magnetic order parameter, allowing to transfer the apparent phononic Raman intensity from the electronic continuum Klein and Dierker (1984). The magneto-elastic coupling constant, estimated to about 1.5 meV in the parent compound, is non-negligible. The temperature dependence of the line shape asymmetry is explained by the interference of the coherent light scattering amplitudes due to the As phonon mode and the interacting -symmetry continuum, the intensity of which monotonically diminishes upon cooling as the spin-density-wave gap opens when the magnetic order develops.
We also note that when the magnetic Fe atom is substituted by non-magnetic Au at a few per cent level, the (Fe) phonon associated with the Fe -axis vibration shows only little disorder-induced broadening. In contrast, the anomalous symmetry As mode appearing in the scattering geometry below shows significant enhancement of the inhomogeneous broadening with Au-doping, underlying the magneto-elastic coupling mechanism. The inferred inhomogeneous broadening of the anomalous (As) mode reaches 1 meV at 3.1% gold substitution.
The pronounced Fano line-shape and significant broadening of the (As) phonon mode upon Au-doping in the magnetic state demonstrates the strong coupling of the (As) phonon to magnetism and to the electronic continuum in the Fe-based superconductors, with possible consequences on the intra-band paring temperature.
Acknowledgements.
We thank E. Bascones and K. Haule for discussions. The research at Rutgers was supported by the US Department of Energy, Basic Energy Sciences, and Division of Materials Sciences and Engineering under Grant No. DE-SC0005463. The work at ORNL was supported by the US Department of Energy, Basic Energy Sciences, Materials Sciences and Engineering Division. Work at IOP was supported by grants from NSFC (11674371 and 11274362) and MOST (2015CB921301, 2016YFA0401000 and 2016YFA0300300) of China.References
- Kuroki et al. (2009a) K. Kuroki, H. Usui, S. Onari, R. Arita, and H. Aoki, “Pnictogen height as a possible switch between high- nodeless and low- nodal pairings in the iron-based superconductors,” Phys. Rev. B 79, 224511 (2009a).
- Lee et al. (2014) J. D. Lee, W. S. Yun, and S. C. Hong, “Ultrafast above-transition-temperature resurrection of spin density wave driven by coherent phonon generation in BaFe2As2,” New J. Phys. 16, 043010 (2014).
- Balédent et al. (2015) V. Balédent, F. Rullier-Albenque, D. Colson, J. M. Ablett, and J.-P. Rueff, “Electronic properties of BaFe2As2 upon doping and pressure: The prominent role of the As orbitals,” Phys. Rev. Lett. 114, 177001 (2015).
- Vildosola et al. (2008) V. Vildosola, L. Pourovskii, R. Arita, S. Biermann, and A. Georges, “Bandwidth and Fermi surface of iron oxypnictides: Covalency and sensitivity to structural changes,” Phys. Rev. B 78, 064518 (2008).
- Calderón et al. (2009) M. J. Calderón, B. Valenzuela, and E. Bascones, “Tight-binding model for iron pnictides,” Phys. Rev. B 80, 094531 (2009).
- Yin et al. (2008) Z. P. Yin, S. Lebègue, M. J. Han, B. P. Neal, S. Y. Savrasov, and W. E. Pickett, “Electron-hole symmetry and magnetic coupling in antiferromagnetic LaFeAsO,” Phys. Rev. Lett. 101, 047001 (2008).
- Yndurain (2011) F. Yndurain, “Coupling of magnetic moments with phonons and electron-phonon interaction in LaFeAsO1-x Fx,” EPL 94, 37001 (2011).
- de la Cruz et al. (2010) C. de la Cruz, W. Z. Hu, S. L Li, Q. Huang, J. W. Lynn, M. A. Green, G. F. Chen, N. L. Wang, H. A. Mook, Q. M Si, and P. C Dai, “Lattice distortion and magnetic quantum phase transition in CeFeAs1-xPxO,” Phys. Rev. Lett. 104, 017204 (2010).
- Zhang et al. (2014a) C. L. Zhang, L. W. Harriger, Z. P. Yin, W. C. Lv, M. Y. Wang, G. T. Tan, Y. Song, D. L. Abernathy, W. Tian, T. Egami, K. Haule, G. Kotliar, and P. C. Dai, “Effect of pnictogen height on spin waves in iron pnictides,” Phys. Rev. Lett. 112, 217202 (2014a).
- Lee et al. (2008) C. H Lee, A. Iyo, H. Eisaki, H. Kito, M. T. Fernandez-Diaz, T. Ito, K. Kihou, H. Matsuhata, M. Braden, and K. Yamada, “Effect of structural parameters on superconductivity in fluorine-free LnFeAsO1-y (Ln = La, Nd),” J. Phys. Soc. Jpn. 77, 083704 (2008).
- Zhao et al. (2008) J. Zhao, Q. Huang, C. de la Cruz, S. L. Li, J. W. Lynn, Y. Chen, M. A. Green, G. F. Chen, G. Li, Z. Li, J. L. Luo, N. L. Wang, and P. C. Dai, “Structural and magnetic phase diagram of CeFeAsO1-xFx and its relation to high-temperature superconductivity,” Nature Mater. 7, 953–959 (2008).
- Kuroki et al. (2009b) K. Kuroki, H. Usui, S. Onari, R. Arita, and H. Aoki, “Pnictogen height as a possible switch between high- nodeless and low- nodal pairings in the iron-based superconductors,” Phys. Rev. B 79, 224511 (2009b).
- Garbarino et al. (2011) G. Garbarino, R. Weht, A.Sow, C. Lacroix, A. Sulpice, M. Mezouar, X. Zhu, F. Han, H. H. Wen, and M. Núñez-Regueiro, “Direct observation of the influence of the FeAs4 tetrahedron on superconductivity and antiferromagnetic correlations in Sr2VO3FeAs,” EPL 96, 57002 (2011).
- Yildirim (2009) T. Yildirim, “Frustrated magnetic interactions, giant magneto–elastic coupling, and magnetic phonons in iron pnictides,” Physica C 469, 425 (2009).
- Boeri et al. (2010) L. Boeri, M. Calandra, I. I. Mazin, O. V. Dolgov, and F. Mauri, “Effects of magnetism and doping on the electron-phonon coupling in BaFe2As2,” Phys. Rev. B 82, 020506 (2010).
- Zbiri et al. (2009) M. Zbiri, H. Schober, M. R. Johnson, S. Rols, R. Mittal, Y. X. Su, M. Rotter, and D. Johrendt, “ initio lattice dynamics simulations and inelastic neutron scattering spectra for studying phonons in BaFe2As2: Effect of structural phase transition, structural relaxation, and magnetic ordering,” Phys. Rev. B 79, 064511 (2009).
- Reznik et al. (2009) D. Reznik, K. Lokshin, D. C. Mitchell, D. Parshall, W. Dmowski, D. Lamago, R. Heid, K.-P. Bohnen, A. S. Sefat, M. A. McGuire, B. C. Sales, D. G. Mandrus, A. Subedi, D. J. Singh, A. Alatas, M. H. Upton, A. H. Said, A. Cunsolo, Yu. Shvyd’ko, and T. Egami, “Phonons in doped and undoped BaFe2As2 investigated by inelastic x-ray scattering,” Phys. Rev. B 80, 214534 (2009).
- Hahn et al. (2009) S. E. Hahn, Y. Lee, N. Ni, P. C. Canfield, A. I. Goldman, R. J. McQueeney, B. N. Harmon, A. Alatas, B. M. Leu, E. E. Alp, D. Y. Chung, I. S. Todorov, and M. G. Kanatzidis, “Influence of magnetism on phonons in CaFe2As2 as seen via inelastic x-ray scattering,” Phys. Rev. B 79, 220511 (2009).
- Mittal et al. (2013) R. Mittal, M. K. Gupta, S. L. Chaplot, M. Zbiri, S. Rols, H. Schober, Y. Su, Th. Brueckel, and T. Wolf, “Spin-phonon coupling in K0.8Fe1.6Se2 and KFe2Se2: Inelastic neutron scattering and initio phonon calculations,” Phys. Rev. B 87, 184502 (2013).
- Hahn et al. (2013) S. E. Hahn, G. S. Tucker, J.-Q. Yan, A. H. Said, B. M. Leu, R. W. McCallum, E. E. Alp, T. A. Lograsso, R. J. McQueeney, and B. N. Harmon, “Magnetism-dependent phonon anomaly in LaFeAsO observed via inelastic x-ray scattering,” Phys. Rev. B 87, 104518 (2013).
- Yndurain and Soler (2009) F. Yndurain and J. M. Soler, “Anomalous electron-phonon interaction in doped LaFeAsO: First-principles calculations,” Phys. Rev. B 79, 134506 (2009).
- Huang et al. (2010) G. Q. Huang, Z. W. Xing, and D. Y. Xing, “Spin-phonon coupling and effect of pressure in the superconductor LiFeAs: Lattice dynamics from first-principles calculations,” Phys. Rev. B 82, 014511 (2010).
- García-Martínez et al. (2013) N. A. García-Martínez, B. Valenzuela, S. Ciuchi, E. Cappelluti, M. J. Calderón, and E. Bascones, “Coupling of the As phonon to magnetism in iron pnictides,” Phys. Rev. B 88, 165106 (2013).
- Coh et al. (2016) S. Coh, M. L. Cohen, and S. G. Louie, “Antiferromagnetism enables electron-phonon coupling in iron-based superconductors,” Phys. Rev. B 94, 104505 (2016).
- Rettig et al. (2015) L. Rettig, S. O. Mariager, A. Ferrer, S. Grübel, J. A. Johnson, J. Rittmann, T. Wolf, S. L. Johnson, G. Ingold, P. Beaud, and U. Staub, “Ultrafast structural dynamics of the Fe-pnictide parent compound BaFe2As2,” Phys. Rev. Lett. 114, 067402 (2015).
- Choi et al. (2008) K. Y. Choi, D. Wulferding, P. Lemmens, N. Ni, S. L. Bud’ko, and P. C. Canfield, “Lattice and electronic anomalies of CaFe2As2 studied by Raman spectroscopy,” Phys. Rev. B 78, 212503 (2008).
- Zhang et al. (2014b) W. L. Zhang, P. Richard, H. Ding, A. S. Sefat, J. Gillett, S. E. Sebastian, M. Khodas, and G. Blumberg, “On the origin of the electronic anisotropy in iron pnicitde superconductors,” arXiv:1410.6452 (2014b).
- Chauvière et al. (2011a) L. Chauvière, Y. Gallais, M. Cazayous, M. A. Méasson, A. Sacuto, D. Colson, and A. Forget, “Raman scattering study of spin-density-wave order and electron-phonon coupling in Ba(Fe1-xCox)2As2,” Phys. Rev. B 84, 104508 (2011a).
- Kretzschmar et al. (2016) F. Kretzschmar, T. Bohm, U. Karahasanovic, B. Muschler, A. Baum, D. Jost, J. Schmalian, S. Caprara, M. Grilli, C. Di Castro, J. G. Analytis, J.-H. Chu, I. R. Fisher, and R. Hackl, “Critical spin fluctuations and the origin of nematic order in Ba(Fe1-xCox)2As2,” Nat. Phys. 12, 560 (2016), letter.
- Kaneko et al. (2017) U. F. Kaneko, P. F. Gomes, A. F. Garcia-Flores, J. Q. Yan, T. A. Lograsso, G. E. Barberis, D. Vaknin, and E. Granado, “Nematic fluctuations and phase transitions in LaFeAsO: a Raman scattering study,” arXiv:1702.03774 (2017).
- Gnezdilov et al. (2013) V. Gnezdilov, Y. G. Pashkevich, P. Lemmens, D. Wulferding, T. Shevtsova, A. Gusev, D. Chareev, and A. Vasiliev, “Interplay between lattice and spin states degree of freedom in the FeSe superconductor: Dynamic spin state instabilities,” Phys. Rev. B 87, 144508 (2013).
- (32) S.-F. Wu, W.-L. Zhang, V. K. Thorsmølle, G. F. Chen, A. S. Sefat, Y. G. Shi, H. Ding, P. Richard, and G. Blumberg, “Magneto-elastic coupling in Fe-based superconductors,” Submitted to PRL .
- Li et al. (2015) L. Li, H. B. Cao, M. A. McGuire, J. S. Kim, G. R. Stewart, and A. S. Sefat, “Role of magnetism in superconductivity of BaFe2As2: Study of Au-doped crystals,” Phys. Rev. B 92, 094504 (2015).
- (34) S.-F. Wu, W.-L. Zhang, L. Li, H.-H. Kung, A. S. Sefat, H. Ding, P. Richard and G. Blumberg, “On the origin of critical nematic fluctuations in Fe-based superconductors,” In preparation .
- Sefat (2013) A. S. Sefat, “Bulk synthesis of iron-based superconductors,” Curr. Opin. Solid State Mater. Sci. 17, 59 (2013).
- Chakoumakos et al. (2011) B. C. Chakoumakos, H. B. Cao, F. Ye, A. D. Stoica, M. Popovici, M. Sundaram, W. D. Zhou, J. S. Hicks, G. W. Lynn, and R. A. Riedel, “Four-circle single-crystal neutron diffractometer at the high flux isotope reactor,” J. Appl. Cryst. 44, 655 (2011).
- Dai (2015) P. C. Dai, “Antiferromagnetic order and spin dynamics in iron-based superconductors,” Rev. Mod. Phys. 87, 855 (2015).
- M. Cardona and G. Güntherodt, Eds. (1982) M. Cardona and G. Güntherodt, Eds., “Light scattering in solids II, Basic Concepts and Instrumentation,” Topics in Applied Physics 50 (1982).
- Zhang et al. (2016) W.-L. Zhang, Z. P. Yin, A. Ignatov, Z. Bukowski, Janusz Karpinski, Athena S. Sefat, H. Ding, P. Richard, and G. Blumberg, “Raman scattering study of spin-density-wave-induced anisotropic electronic properties in AFe2As2 (A=Ca, Eu),” Phys. Rev. B 93, 205106 (2016).
- F. Kretzschmar, T. Böhm, U. Karahasanović, B. Muschler, A. Baum, D. Jost, J. Schmalian, S. Caprara, M. Grilli, C. Di Castro, J. G. Analytis, J.-H. Chu, I. R. Fisher and R. Hackl (2016) F. Kretzschmar, T. Böhm, U. Karahasanović, B. Muschler, A. Baum, D. Jost, J. Schmalian, S. Caprara, M. Grilli, C. Di Castro, J. G. Analytis, J.-H. Chu, I. R. Fisher and R. Hackl, Nat. Phys. 12, 560 (2016).
- Note (1) We note that for Ba(Fe0.969Au0.031)2As2 (As) phonon intensity appears above in forbidden polarization (see Fig. 3(d)). The leakage is due to the local symmetry breakdown for crystals with high Au impurity concentration for which the selection rules are relaxed.
- Chauvière et al. (2011b) L. Chauvière, Y. Gallais, M. Cazayous, M. A. Méasson, A. Sacuto, D. Colson, and A. Forget, “Raman scattering study of spin-density-wave order and electron-phonon coupling in Ba(Fe1-xCox)2As2,” Phys. Rev. B 84, 104508 (2011b).
- P. G. Klemens (1966) P. G. Klemens, “Anharmonic decay of optical phonons,” Phys. Rev. 148, 845 (1966).
- J. Menéndez and M. Cardona (1984) J. Menéndez and M. Cardona, “Temperature dependence of the first-order Raman scattering by phonons in Si, Ge, and -Sn: Anharmonic effects,” Phys. Rev. B 29, 2051 (1984).
- E. Bascones, B. Velenzuela and M. J. Caldéron (2016) E. Bascones, B. Velenzuela and M. J. Caldéron, “Magnetic interactions in iron superconductors: A review,” C. R. Physique 36, 17 (2016).
- Si and Abrahams (2008) Q. Si and E. Abrahams, “Strong Correlations and Magnetic Frustration in the High Iron Pnictides,” Phys. Rev. Lett. 101, 076401 (2008).
- C. Fang, H. Yao, W.-F. Tsai, J. P. Hu and S. A. Kivelson (2008) C. Fang, H. Yao, W.-F. Tsai, J. P. Hu and S. A. Kivelson, “Theory of electron nematic order in LaFeAsO,” Phys. Rev. B 77, 224509 (2008).
- Xu et al. (2008) C. K. Xu, M. Müller, and S. Sachdev, “Ising and spin orders in iron-based superconductors,” Phys. Rev. B 78, 020501(R) (2008).
- Nevidomskyy (2011) A. H. Nevidomskyy, “Interplay of orbital and spin ordering in the iron pnictides,” arXiv:1104.1747 (2011).
- Anderson (1959) P. W. Anderson, “New approach to the theory of superexchange interactions,” Phys. Rev. 115, 2 (1959).
- A. L. Wysocki, K. D. Belashchenko and V. P. Antropov (2011) A. L. Wysocki, K. D. Belashchenko and V. P. Antropov, “Consistent model of magnetism in ferropnictides,” Nat. Phys. 7, 485 (2011).
- Han et al. (2009) M. J. Han, Q. Yin, W. E. Pickett, and S. Y. Savrasov, “Anisotropy, itineracy, and magnetic frustration in high- iron pnictides,” Phys. Rev. Lett. 102, 107003 (2009).
- Mandal et al. (2014) S. Mandal, R. E. Cohen, and K. Haule, “Strong pressure-dependent electron-phonon coupling in FeSe,” Phys. Rev. B 89, 220502 (2014).
- Fano (1961) U. Fano, “Effects of configuration interaction on intensities and phase shifts,” Phys. Rev. 124, 1866 (1961).
- Cardona (1983) K. Cardona, “Light scattering in solids I, Introductory Concepts,” Topics in Applied Physics 8 (1983).
- Blumberg et al. (1994) G. Blumberg, M. V. Klein, L. Börjesson, R. Liang, and W. N. Hardy, “Investigation of the temperature dependence of electron and phonon raman scattering in single crystal YBa2Cu3O6.952,” J. Supercond 7, 445 (1994).
- Wilson et al. (2009) S. D. Wilson, Z. Yamani, C. R. Rotundu, B. Freelon, E. Bourret-Courchesne, and R. J. Birgeneau, “Neutron diffraction study of the magnetic and structural phase transitions in BaFe2As2,” Phys. Rev. B 79, 184519 (2009).
- Hu et al. (2008) W. Z. Hu, J. Dong, G. Li, Z. Li, P. Zheng, G. F. Chen, J. L. Luo, and N. L. Wang, “Origin of the spin density wave instability in AFe2As2 (A=Ba,Sr) as revealed by optical spectroscopy,” Phys. Rev. Lett. 101, 257005 (2008).
- P. Richard, K. Nakayama, T. Sato, M. Neupane, Y.-M. Xu, J. H. Bowen, G. F. Chen, J. L. Luo, N. L. Wang, X. Dai, Z. Fang, H. Ding and T. Takahashi (2010) P. Richard, K. Nakayama, T. Sato, M. Neupane, Y.-M. Xu, J. H. Bowen, G. F. Chen, J. L. Luo, N. L. Wang, X. Dai, Z. Fang, H. Ding and T. Takahashi, “Observation of Dirac Cone Electronic Dispersion in BaFe2As2,” Phys. Rev. Lett. 104, 137001 (2010).
- Boeri et al. (2008) L. Boeri, O. V. Dolgov, and A. A. Golubov, “Is LaFeAsO1-xFx an electron-phonon superconductor?” Phys. Rev. Lett. 101, 026403 (2008).
- Coh et al. (2015) S. Coh, M. L. Cohen, and S. G. Louie, “Large electron–phonon interactions from FeSe phonons in a monolayer,” New J. Phys. 17, 073027 (2015).
- Klein and Dierker (1984) M. V. Klein and S. B. Dierker, “Theory of Raman scattering in superconductors,” Phys. Rev. B 29, 4976–4991 (1984).