Copious Amounts of Dust and Gas in a Quasar Host Galaxy
Abstract
We present IRAM/NOEMA and JVLA observations of the quasar J1342+0928 at and report detections of copious amounts of dust and [C II] emission in the interstellar medium (ISM) of its host galaxy. At this redshift, the age of the universe is 690 Myr, about 10% younger than the redshift of the previous quasar record holder. Yet, the ISM of this new quasar host galaxy is significantly enriched by metals, as evidenced by the detection of the [C II] 158 m cooling line and the underlying far-infrared (FIR) dust continuum emission. To the first order, the FIR properties of this quasar host are similar to those found at a slightly lower redshift (), making this source by far the FIR-brightest galaxy known at . The [C II] emission is spatially unresolved, with an upper limit on the diameter of 7 kpc. Together with the measured FWHM of the [C II] line, this yields a dynamical mass of the host of . Using standard assumptions about the dust temperature and emissivity, the NOEMA measurements give a dust mass of . The brightness of the [C II] luminosity, together with the high dust mass, imply active ongoing star formation in the quasar host. Using [C II]–SFR scaling relations, we derive star formation rates of 85–545 yr-1 in the host, consistent with the values derived from the dust continuum. Indeed, an episode of such past high star formation is needed to explain the presence of of dust implied by the observations.
1 Introduction
The advent of large, wide-area optical and infrared surveys has resulted in the discovery of luminous quasars out to the highest redshifts, (e.g., Fan et al., 2006; Venemans et al., 2013; Bañados et al., 2016; Mazzucchelli et al., 2017). These quasars are powered by supermassive, black holes that accrete near the Eddington limit (e.g., De Rosa et al., 2014; Mazzucchelli et al., 2017). Since their discovery, the presence of such massive black holes has been a puzzle, as they require either very efficient accretion mechanisms from stellar black hole seeds (100 , e.g., Volonteri, 2012), or the formation of massive seeds, e.g. via direct gas collapse ( ; e.g., Agarwal et al., 2012; Regan et al., 2017).
Likewise, studies of the host galaxies of these distant quasars have revealed the presence of large amounts of dust and gas out to (e.g., Bertoldi et al., 2003; Walter et al., 2003; Maiolino et al., 2005; Venemans et al., 2012, 2016; Wang et al., 2013; Willott et al., 2015). The associated molecular gas masses are and provide the fuel for long-lasting (107-8 years) episodes of ultra-luminous infrared galaxies (ULIRG)-like star formation (with star-formation rates (SFRs) 100–1000 yr-1).
The observed tracers ([C II], [C I], CO, far-infrared (FIR) continuum) require that the interstellar medium (ISM) of the host galaxies is chemically enriched. While metal-enriched material is also evident from broad emission lines in the quasar’s rest-frame UV spectrum (e.g., Jiang et al., 2007; De Rosa et al., 2014), these emission lines originate from a concentrated region (1 pc) around the black hole, the so-called broad-line region (BLR). However, since the BLR total mass is only (e.g., Ferland, 2004), a modest amount of metals, , can explain the observed high BLR metallicities (, e.g., Dietrich et al., 2003; Juarez et al., 2009). On the other hand, the enrichment of the quasar host is on significantly larger scales (kpc; e.g., Walter et al., 2009; Wang et al., 2013; Venemans et al., 2016), which requires a galaxy-wide chemical enrichment due to extended star formation. The enrichment on galactic scales seen in dust and gas thus puts constraints on early metal production in the quasar host (e.g., Michałowski et al., 2010; Gall et al., 2011b). Star formation is only indirectly traced by the FIR emission, and to date the stellar component of the quasar host remains elusive (e.g., Decarli et al., 2012).
To further constrain the formation of dust and enrichment of gas in the ISM in the earliest galaxies, studies need to be pushed back in time, i.e., to the highest possible redshifts. The highest-redshift quasar in which gas and dust have been detected to date is J1120+0641 (Mortlock et al., 2011) at a redshift of (Venemans et al., 2017). Here, we report the detection of gas and dust emission in a newly discovered quasar at , J1342+0928 (Bañados et al., 2017). The redshift of the quasar derived from the Mg II line is (age of the universe: 690 Myr). From the width of the Mg II line and the strength of the continuum, Bañados et al. (2017) estimate that the quasar is powered by accretion onto a black hole. The quasar has an absolute magnitude of and shares many of the physical properties seen in quasars observed at (Bañados et al., 2017).
Throughout this Letter, we adopt a concordance cosmology with , , and km s-1 Mpc-1. The physical scale at is 5.0 kpc arcsec-1. All magnitudes are on the AB system.
2 Observations
2.1 NOEMA Observations
[C II]3/2-1/2 158 m (hereafter [C II]), CO(7–6), CO(10–9), H2O, and [C I]2-1 observations of J1342+0928 were performed with the IRAM NOrthern Extended Millimeter Array (NOEMA). Observations were done with the array in compact configuration, using 7–8 antennas. All of the NOEMA data have been reduced using the latest version of the GILDAS software111http://www.iram.fr/IRAMFR/GILDAS.
The observations were gathered between 2017 March 15 and May 21 in various visits. For the [C II] observations, the NOEMA receiver 3 (1.2 mm) was tuned to 224.121 GHz in the first execution, and to 222.500 GHz in all the other visits, in order to better encompass the line within the WideX 3.6 GHz bandwidth. The CO(10–9) line and the H2O 3(2,1)-3(1,2) line at rest-frequency 1162.91 GHz were observed in a single frequency setting, with NOEMA receiver 2 (2 mm) tuned to 135.495 GHz. The CO(7–6) and [C I]2-1 lines were observed with the 3 mm receivers tuned to 94.587 GHz. The radio quasar 1345+125 served as amplitude and phase calibrator. Additional calibrators used in the bandpass calibration included 3C273 and 3C454.3. The star MWC 349 was used to set the absolute flux scale. Measured line fluxes and continuum flux densities in Section 3 and Table 1 only include statistical errors and do not take the systematic flux calibration uncertainties of 10% into account. The total integration time on-source was 13.6, 3.8, and 11.1 hr (8 antenna equivalent) in the 1 mm, 2 mm, and 3 mm bands, respectively. Imaging was performed using natural weighting, in order to maximize sensitivity. The resulting synthesized beams are 2415, 3625, and 5834 and the final 1 mm, 2 mm, and 3 mm cubes reach a sensitivity of 0.47 mJy beam-1, 0.41 mJy beam-1, and 0.17 mJy beam-1 per 100 km s-1 channel (1-), respectively. In the 1 mm cube, both the [C II] emission and the underlying dust continuum are significantly detected (Figure 1 and Section 3), while no emission was detected in the other two cubes.
In the continuum images, an additional source is located 10″ northeast of the quasar (see Figure 2) with flux densities of Jy, Jy, and Jy. The spectrum of this object does not show emission lines. While the redshift remains unknown, the lack of line emission in the 1 mm datacube, which covers a [C II] redshift of around that of the quasar, makes it unlikely that this source is physically associated with J1342+0928.
2.2 Very Large Array (VLA) Observations
We searched for CO(3–2) emission from J1342+0928 with the VLA in 2017 April. The redshift of the source places the line at 40.4852 GHz. The data also provided a deep continuum observation at 41 GHz. A total of 9 hr (7 hr on-source), was spent using the 8 bit, 2 GHz bandwidth correlator mode for highest line sensitivity. An additional 3 hr was spent using 3 bit, 8 GHz bandwidth from 40 to 48 GHz for an additional continuum measurement.
Standard phase and amplitude calibration was performed, using J1331+305 to set the absolute gain scale and bandpass, and J1347+122 to determine complex gains as a function of time. Phase stability was excellent.
The line data were imaged using natural weighting and smoothed to a velocity resolution of 44.5 km s-1. The synthesized beam is 2220, and the rms noise per channel was 0.10 mJy beam-1. We also created a 41.0 GHz continuum image by suitably combining all the data. The rms noise of this continuum image is 5.7 Jy beam-1. No line was found, but a potential continuum source is reported (Section 3.1).
3 The Host Galaxy of J1342+0928 at
| R.A. (J2000) | 13h42m08097 |
|---|---|
| Decl. (J2000) | 09∘28′3828 |
| 7.54130.0007 | |
| (Jy km s-1) | 1.250.17 |
| FWHM[CII] (km s-1) | 38356 |
| EW[CII] (m) | 1.730.43 |
| (Jy) | 41573 |
| (Jy) | 139 |
| (Jy) | 48 |
| (Jy) | 15.05.7 |
| (Jy) | 432 |
| (Jy km s-1) | 0.081 |
| (Jy km s-1) | 0.13 |
| (Jy km s-1) | 0.32 |
| (Jy km s-1) | 0.14 |
| (Jy km s-1) | 0.30 |
| (Jy km s-1) | 0.33 |
| () | |
| () | |
| () | |
| () | |
| (K km s-1 pc2) | |
| SFRTIR ( yr-1) | 120–300 |
| SFR[CII] ( yr-1) | 85–545 |
| () | |
| () | |
| () |
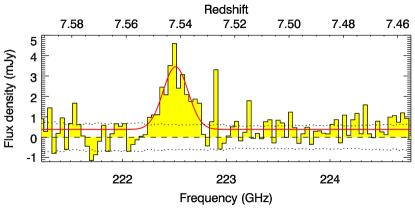
Our NOEMA observations reveal the gas and dust present in the host galaxy of J1342+0928. In Figures 1 we show the spectrum of the [C II] emission line and the underlying dust continuum. A summary of the measurements is given in Table 1.
3.1 Far-infrared Luminosity and Implied Dust Mass
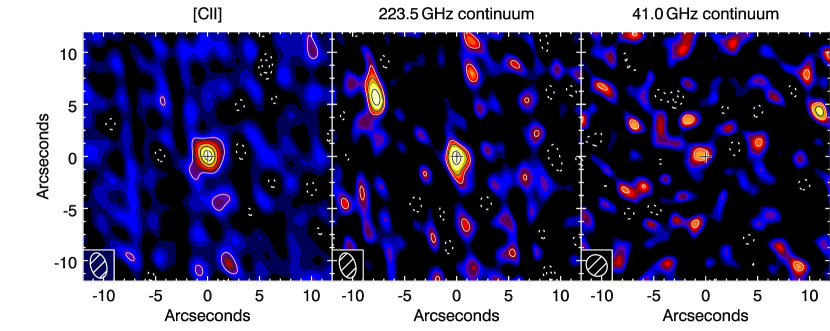
The dust continuum around the redshifted [C II] emission (rest-frame wavelength of 158 m) has been detected at a signal-to-noise ratio (S/N) 6 and a strength of Jy (Figures 1 and 2). The source is not resolved with the 2415 (12.17.3 kpc2) beam. We also estimated the source size in the uv plane and derive a source radius 05, which is consistent with the size measurement of the continuum image. The position of the quasar host, R.A. = 13h42m08097; decl. = +09∘28′3828, is consistent with the near-infrared location of the quasar (Bañados et al., 2017). The host galaxy is not detected in continuum in the other NOEMA setups down to 3 continuum limits of Jy and Jy. The VLA continuum map shows a potential source ( Jy beam-1 and S/N 2.6; Figure 2), located 07 from the [C II] emission of J1342+0928.
To compute the far-infrared (rest-frame 42.5–122.5 m) and total infrared (TIR; 8–1000 m) luminosities, and , and the dust mass in J1342+0928, we follow the same procedure as outlined in Venemans et al. (2016). In summary, we utilize three different models to estimate dust emission: a modified black body (MBB) with a dust temperature K and an emissivity index of (e.g., Beelen et al., 2006) and two templates of local star-forming galaxies (Arp220 and M82) from Silva et al. (1998). We also take the effect of the cosmic microwave background (CMB) on the dust emission into account (e.g., da Cunha et al., 2013; Venemans et al., 2016). The mass of dust is derived both by assuming an opacity index of cm2 g-1 (Dunne et al., 2000) and from scaling the Arp220 and M82 templates (Silva et al., 1998). We stress that due to the unknown shape of the dust continuum, the FIR and TIR luminosities remain highly uncertain, while the SFR and dust mass we derive crucially depend on the applicability of local correlations to this high-redshift source.
Scaling the NOEMA continuum detection of Jy to the three dust spectral energy distribution (SED) models results in luminosities of = and = . The derived dust mass is . Applying the local scaling relation between and SFR from Murphy et al. (2011) and assuming the infrared luminosity is dominated by star-formation (e.g., Leipski et al., 2014) results in an SFR of yr-1. This is significantly lower than the SFR derived for some of the quasar hosts at (e.g., Walter et al., 2009), but very similar to the SFR in J1120+0641 at (Venemans et al., 2017).
3.2 Tentative Radio Continuum Emission
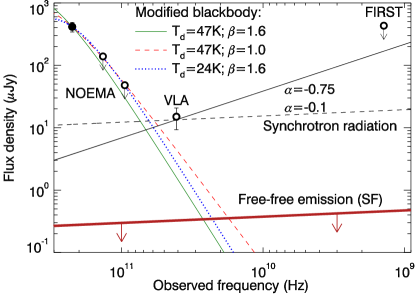
We now look into the origin of the potential VLA continuum detection. The first possibility is that the source is spurious. The S/N is only 2.6, and as shown in Figure 2, several positive noise peaks are visible close to the location of the quasar. It is therefore plausible that the 41 GHz detection will disappear when adding more data. On the other hand, if the source is real, then the question is whether it is due to dust emission, free–free emission, or non-thermal processes, e.g., synchrotron radiation. The typical quasar dust SED, the MBB with K and predicts flux densities of 90, 28, and 1.5 Jy at 135.5, 95, and 41.0 GHz, respectively (Figure 3). The limits in the NOEMA 2 mm and 3 mm bands are consistent with these expected flux densities, but the flux density measured in the VLA image is significantly (10) higher than expected from the dust emission. A much shallower emissivity index () and/or a lower dust temperature, which would result in a higher flux density at 41 GHz, can be ruled out by the nondetections at 135.5 and 95 GHz (Figure 3). Based on the derived SFR in the host galaxy (SFR yr-1, Table 1), the strength of free–free emission at 41.0 GHz is negligible ( Jy; e.g., Yun & Carilli, 2002). Alternatively, the flux density could be due to synchrotron radiation. We can estimate the radio loudness of the quasar using the radio-to-optical flux density ratio with and the flux densities at rest-frame 5 GHz and 4400 Å, respectively (Kellermann et al., 1989). Assuming a radio continuum can be described by a power law () with (e.g., Bañados et al., 2015), we derive Jy. Following Bañados et al. (2015), we derive Jy from the WISE W1 magnitude (W1 = 20.17). We obtain , making J1342+0928 a radio-loud quasar (where radio-loud is defined as ). Note that this is still consistent with the nondetection in the FIRST survey, with a 3 upper limit of Jy, as the expected flux density for J1342+0928 is Jy (Figure 3). Deeper imaging at radio frequencies will provide a definitive answer.
3.3 [C II] Luminosity
We detect the [C II] emission line in J1342+0928 in the continuum-subtracted [C II] map (Figure 2) with an S/N 10. The spectrum, extracted from the peak pixel in the datacube, is shown in Figure 1. From a Gaussian fit to the line, we derive a redshift of , a line flux of Jy km s-1, and a dispersion of km s-1 (FWHM km s-1); see Table 1. This corresponds to a [C II] luminosity in this quasar of , which is roughly 15% brighter than J1120+0641 at (Venemans et al., 2017) and a factor 3–5 fainter than the most [C II] luminous quasar at (e.g., Maiolino et al., 2005; Wang et al., 2013).
The redshift derived from the [C II] line is higher than that derived from the UV emission lines of the quasar. The C IV and Mg II lines are blueshifted by 6580270 km s-1 and 500140 km s-1 with respect to the [C II] line. The Mg II shift is close to the mean blueshift of the Mg II line of 480 km s-1 found in a sample of quasars (e.g., Venemans et al., 2016). This could indicate the presence of an outflow (e.g., Mazzucchelli et al., 2017).
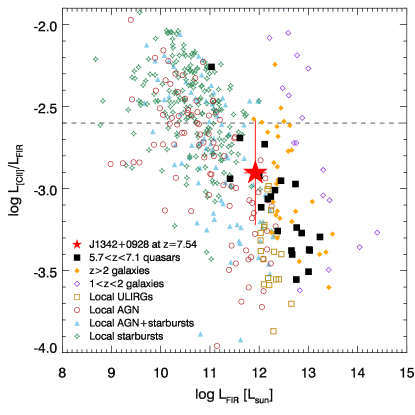
We measure a rest-frame [C II] equivalent width of EW m, which is consistent with the mean EW[CII] of local starburst galaxies (which have EW m; see e.g., Díaz-Santos et al., 2013; Sargsyan et al., 2014) and higher than those of luminous () quasars at (e.g., Wang et al., 2013). The [C II]-to-FIR luminosity ratio is / (Figure 4), again consistent within the large uncertainties with the / ratio of local star-forming galaxies that have a median / = (e.g., Díaz-Santos et al., 2013).
We can estimate the SFR from the [C II] emission using the SFR– relations for high-redshift () galaxies of De Looze et al. (2014):
| (1) |
with a systematic uncertainty of a factor of 2.5. With we derive SFR yr-1, which is similar to the SFR based on the TIR luminosity (Section 3.1).
The [C II] emission is not resolved in the 2515 beam (Figure 2). We fitted a 2D Gaussian to the [C II] map using the CASA task “imfit” and we derive a 1 upper limit on the size of 1712 (FWHM). A similar limit on the source diameter of is found when fitting a 1D Gaussian to the uv data. This translates to an upper limit on the size of the [C II]-emitting region of 8.45.9 kpc2 or a diameter of kpc. Approved observations with the Atacama Large Millimeter/ submillimeter Array (ALMA) at higher spatial resolution will put tighter constraints on the size of the host galaxy.
From the strength of the [C II] emission line, we can derive the mass of singly ionized carbon. In analogy to the formula to compute the mass of neutral carbon provided in Weiß et al. (2005) and assuming optically thin [C II] emission, the mass of singly ionized carbon can be calculated using
| (2) | |||||
with the conversion between pc2 and cm2, the mass of a carbon atom, s-1 the Einstein coefficient (Nussbaumer & Storey, 1981), the C II partition function, and the excitation temperature. As [C II] is emitted from the outer layers of photon-dominated region (PDR) clouds, K is a good assumption (see, e.g., Meijerink et al., 2007). Setting K we derive . For K (75 K), the mass would be 20% lower (higher).
3.4 Limits on the CO and [C I] Luminosity
We do not detect any of the other targeted emission lines in J1342+0928. To derive upper limits on the line fluxes, we averaged the datacubes over 2.8 (460 km s-1). We measured the following 3 upper limits: Jy km s-1, Jy km s-1, Jy km s-1, Jy km s-1, and Jy km s-1.
The limits on the CO luminosity are K km s-1 pc2, K km s-1 pc2, and K km s-1 pc2. We can estimate a limit on the molecular gas mass by utilizing with the CO luminosity-to-gas mass conversion factor. Assuming the CO(3–2) emission is thermalized (e.g., Riechers et al., 2009), the CO(1–0) luminosity is given by . Adopting (e.g., Downes & Solomon, 1998), we set an upper limit on the molecular gas mass of .
The limiting luminosity of the [C I] line is . With a measured [C II] luminosity of = (Section 3.3), we can set a lower limit to the [C II]-to-[C I] luminosity ratio of / . Following Venemans et al. (2017), we can compare this luminosity ratio to those predicted by the ISM models of Meijerink et al. (2007). From the measured luminosity ratio we can exclude that the lines originate from a region where the X-ray radiation from the accreting black hole is dominating the emission.
3.5 Dynamical mass estimate
From the velocity dispersion of the [C II] emission and the radius of the line emitting region, we can estimate a dynamical mass of the quasar host galaxy by utilizing the virial theorem: with as the gravitational constant. Assuming that the velocity dispersion can be derived from the Gaussian fit to the [C II] emission (Figure 1), and adopting a maximum radius of the [C II] emission of kpc (Section 3.3), we infer a dynamical mass . If instead we assume that the [C II] emission is in a rotating disk with inclination angle (e.g., Wang et al., 2013; Willott et al., 2015; Venemans et al., 2016), we derive a higher dynamical mass of . Adopting , the median inclination angle of quasar hosts (Wang et al., 2013), the dynamical mass of J1342+0928 becomes , which is 190 higher that of the black hole (Bañados et al., 2017). To more accurately constrain the dynamical mass, high spatially resolved observations of the [C II] emission are necessary.
4 Concluding remarks
We presented the detection of copious amounts of dust ( ) and metal-enriched gas ( of carbon in the singly ionized phase only) in a quasar host galaxy 690 Myr after the Big Bang. The enrichment of the ISM in this source appears similar to other quasars at (e.g., Riechers et al., 2009; Wang et al., 2013; Venemans et al., 2016) but much higher than what is typically found in non-quasar host galaxies at these redshifts (e.g., Watson et al., 2015; Pentericci et al., 2016).
We can only speculate which mechanism is responsible for the high mass in metals so early after the Big Bang. Because of the young cosmic age, asymptotic giant branch stars are thought to play only a marginal role (e.g., Morgan & Edmunds, 2003; Juarez et al., 2009; Gall et al., 2011a). On the other hand, type II supernovae (SNe) can produce significant amounts of dust, up to 1 per SN (e.g., Matsuura et al., 2015). For an initial mass function (IMF) similar to that of the Milky Way, the number of SNe is 1 per 200 of stars formed (e.g., Diehl et al., 2006). The implied stellar mass of J1342+0928 would then be . Assuming a top-heavy IMF the implied stellar mass would be reduced by a factor of 3. In either case, such a massive stellar population should be easily detectable with the combined sensitivity, resolution, and wavelength coverage of the James Webb Space Telescope (JWST).
At these extreme redshifts, population III stars also provide a plausible enrichment mechanism. Metal-free stars with a mass / could have dust yield as high as 15–30% (e.g., Nozawa et al., 2003). Neglecting dust destruction, one would ‘only’ require 2 million population III stars of 200 to create a mass of in dust, although the fast metal pollution may prevent the formation of so many population III stars (e.g., Maio et al., 2010).
The presented observations showcase how the study of quasar host galaxies at the highest redshifts can shed new light on the dawn of galaxy formation. Future ALMA and JWST observations will allow us to constrain the molecular gas mass, determine the shape of the FIR dust emission, and measure the size of the gas reservoir and to reveal the stellar population in the quasar host of this system.
References
- Agarwal et al. (2012) Agarwal, B., Khochfar, S., Johnson, J. L., et al. 2012, MNRAS, 425, 2854
- Bañados et al. (2016) Bañados, E., Venemans, B. P., Decarli, R., et al. 2016, ApJS, 227, 11
- Bañados et al. (2017) Bañados, E., Venemans, B. P., Mazzucchelli, C., et al. 2017, Natur
- Bañados et al. (2015) Bañados, E., Venemans, B. P., Morganson, E., et al. 2015, ApJ, 804, 118
- Beelen et al. (2006) Beelen, A., Cox, P., Benford, D. J., et al. 2006, ApJ, 642, 694
- Bertoldi et al. (2003) Bertoldi, F., Cox, P., Neri, R., et al. 2003, A&A, 409, L47
- da Cunha et al. (2013) da Cunha, E., Groves, B., Walter, F., et al. 2013, ApJ, 766, 13
- De Looze et al. (2014) De Looze, I., Cormier, D., Lebouteiller, V., et al. 2014, A&A, 568, A62
- De Rosa et al. (2014) De Rosa, G., Venemans, B. P., Decarli, R., et al. 2014, ApJ, 790, 145
- Decarli et al. (2012) Decarli, R., Walter, F., Yang, Y., et al. 2012, ApJ, 756, 150
- Díaz-Santos et al. (2013) Díaz-Santos, T., Armus, L., Charmandaris, V., et al. 2013, ApJ, 774, 68
- Diehl et al. (2006) Diehl, R., Halloin, H., Kretschmer, K., et al. 2006, Natur, 439, 45
- Dietrich et al. (2003) Dietrich, M., Hamann, F., Shields, J. C., et al. 2003, ApJ, 589, 722
- Downes & Solomon (1998) Downes, D., & Solomon, P. M. 1998, ApJ, 507, 615
- Dunne et al. (2000) Dunne, L., Eales, S., Edmunds, M., et al. 2000, MNRAS, 315, 115
- Fan et al. (2006) Fan, X., Strauss, M. A., Richards, G. T., et al. 2006, AJ, 131, 1203
- Ferland (2004) Ferland, G. 2004, in ASP Conf. Ser. 311, AGN Physics with the Sloan Digital Sky Survey, ed. G. T. Richards & P. B. Hall (San Francisco, CA: ASP), 161
- Gall et al. (2011a) Gall, C., Andersen, A. C., & Hjorth, J. 2011a, A&A, 528, A14
- Gall et al. (2011b) Gall, C., Hjorth, J., & Andersen, A. C. 2011b, A&ARv, 19, 43
- Jiang et al. (2007) Jiang, L., Fan, X., Vestergaard, M., et al. 2007, AJ, 134, 1150
- Juarez et al. (2009) Juarez, Y., Maiolino, R., Mujica, R., et al. 2009, A&A, 494, L25
- Kellermann et al. (1989) Kellermann, K. I., Sramek, R., Schmidt, M., Shaffer, D. B., & Green, R. 1989, AJ, 98, 1195
- Leipski et al. (2014) Leipski, C., Meisenheimer, K., Walter, F., et al. 2014, ApJ, 785, 154
- Maio et al. (2010) Maio, U., Ciardi, B., Dolag, K., Tornatore, L., & Khochfar, S. 2010, MNRAS, 407, 1003
- Maiolino et al. (2005) Maiolino, R., Cox, P., Caselli, P., et al. 2005, A&A, 440, L51
- Matsuura et al. (2015) Matsuura, M., Dwek, E., Barlow, M. J., et al. 2015, ApJ, 800, 50
- Mazzucchelli et al. (2017) Mazzucchelli, C., Bañados, E., Venemans, B. P., et al. 2017, ApJ accepted (arXiv:1710.01251)
- Meijerink et al. (2007) Meijerink, R., Spaans, M., & Israel, F. P. 2007, A&A, 461, 793
- Michałowski et al. (2010) Michałowski, M. J., Murphy, E. J., Hjorth, J., et al. 2010, A&A, 522, A15
- Morgan & Edmunds (2003) Morgan, H. L., & Edmunds, M. G. 2003, MNRAS, 343, 427
- Mortlock et al. (2011) Mortlock, D. J., Warren, S. J., Venemans, B. P., et al. 2011, Nature, 474, 616
- Murphy et al. (2011) Murphy, E. J., Condon, J. J., Schinnerer, E., et al. 2011, ApJ, 737, 67
- Nozawa et al. (2003) Nozawa, T., Kozasa, T., Umeda, H., Maeda, K., & Nomoto, K. 2003, ApJ, 598, 785
- Nussbaumer & Storey (1981) Nussbaumer, H., & Storey, P. J. 1981, A&A, 96, 91
- Pentericci et al. (2016) Pentericci, L., Carniani, S., Castellano, M., et al. 2016, ApJL, 829, L11
- Regan et al. (2017) Regan, J. A., Visbal, E., Wise, J. H., et al. 2017, Nature Astronomy, 1, 0075
- Riechers et al. (2009) Riechers, D. A., Walter, F., Bertoldi, F., et al. 2009, ApJ, 703, 1338
- Sargsyan et al. (2014) Sargsyan, L., Samsonyan, A., Lebouteiller, V., et al. 2014, ApJ, 790, 15
- Silva et al. (1998) Silva, L., Granato, G. L., Bressan, A., & Danese, L. 1998, ApJ, 509, 103
- Venemans et al. (2013) Venemans, B. P., Findlay, J. R., Sutherland, W. J., et al. 2013, ApJ, 779, 24
- Venemans et al. (2012) Venemans, B. P., McMahon, R. G., Walter, F., et al. 2012, ApJL, 751, L25
- Venemans et al. (2017) Venemans, B. P., Walter, F., Decarli, R., et al. 2017, ApJ, 837, 146
- Venemans et al. (2016) Venemans, B. P., Walter, F., Zschaechner, L., et al. 2016, ApJ, 816, 37
- Volonteri (2012) Volonteri, M. 2012, Science, 337, 544
- Walter et al. (2003) Walter, F., Bertoldi, F., Carilli, C., et al. 2003, Natur, 424, 406
- Walter et al. (2009) Walter, F., Riechers, D., Cox, P., et al. 2009, Natur, 457, 699
- Wang et al. (2013) Wang, R., Wagg, J., Carilli, C. L., et al. 2013, ApJ, 773, 44
- Watson et al. (2015) Watson, D., Christensen, L., Knudsen, K. K., et al. 2015, Nature, 519, 327
- Weiß et al. (2005) Weiß, A., Downes, D., Henkel, C., & Walter, F. 2005, A&A, 429, L25
- Willott et al. (2015) Willott, C. J., Bergeron, J., & Omont, A. 2015, ApJ, 801, 123
- Yun & Carilli (2002) Yun, M. S., & Carilli, C. L. 2002, ApJ, 568, 88