An LLVM Instrumentation Plug-in for Score-P
Abstract.
Reducing application runtime, scaling parallel applications to higher numbers of processes/threads, and porting applications to new hardware architectures are tasks necessary in the software development process. Therefore, developers have to investigate and understand application runtime behavior. Tools such as monitoring infrastructures that capture performance relevant data during application execution assist in this task. The measured data forms the basis for identifying bottlenecks and optimizing the code.
Monitoring infrastructures need mechanisms to record application activities in order to conduct measurements. Automatic instrumentation of the source code is the preferred method in most application scenarios. We introduce a plug-in for the LLVM infrastructure that enables automatic source code instrumentation at compile-time. In contrast to available instrumentation mechanisms in LLVM/Clang, our plug-in can selectively include/exclude individual application functions. This enables developers to fine-tune the measurement to the required level of detail while avoiding large runtime overheads due to excessive instrumentation.
1. Introduction
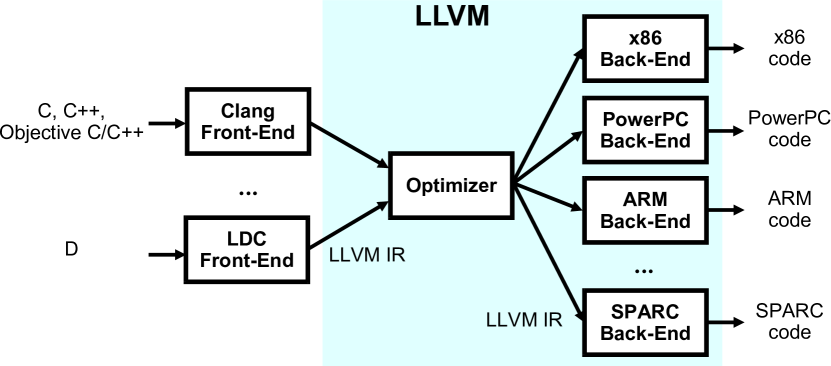
Compilers are a central component in software development. They translate statements of a high-level programming language into machine dependent instructions. In principle, the software design of a compiler consists of the phases: Front-End, Optimizer, and Back-End. Figure 1 illustrates the major components of a three-phase compiler design (Wirth, 1996).

Front-End The Front-End handles code input of a specific source language. It transforms the source code of the individual language to a generic internal representation (intermediate representation, IR). Therefore it performs lexical, syntactic, and semantic analyses of the source code.
Optimizer The code optimization phase transforms the IR while retaining its functionality. It selectively applies multiple optimization techniques to achieve different goals, e.g., optimize for performance or optimize for size. Common actions of the Optimizer are register allocation, function inlining, or elimination of unused code segments.
Back-End The Back-End targets a specific hardware architecture. It generates machine-dependent code from the transformed intermediate representation.
As already mentioned the Optimizer automatically transforms and optimizes the code. This allows software developers to easily obtain (performance) benefits by using compiler switches. However, when it comes to investigating application runtime behavior this technique poses additional hurdles. As the compiler transparently applies optimizations, it is sometimes unclear how it transforms high-level statements into specific machine code. For instance, it might not be discernible whether a specific function is inlined by the compiler. Some compilers provide textual optimization reports listing all applied actions. However, such reports are typically extensive and cumbersome to interpret manually. A more intuitive option are debugging and performance analysis tools assisting users in investigating application runtime behavior. Such tools typically involve a monitoring component observing the application at runtime and recording performance data. Based on this data, user-friendly graphical visualizations can intuitively depict an application execution or automated analyses may reveal performance bottlenecks. The monitoring component requires a compiler interface in order to obtain information from the machine code. This data acquisition should not impede compiler optimizations. Rather should the obtained data reflect optimizations applied by the compiler.
Because of LLVM’s growing importance and the fact that it will be one of the main compilers on the upcoming generation of HPC systems at Oak Ridge National Laboratory (Summit (Summit, 2017)) and Lawrence Livermore National Laboratory (Sierra (Sierra, 2017)), this work focuses on the Low Level Virtual Machine infrastructure (LLVM) (Lattner and Adve, 2004) and to some extent on the GNU Compiler Collection (GCC) (Gough and Stallman, 2004). Both are typical representatives of the three-phase compiler design. Figure 2 depicts the implementation of the three-phase compiler design in the LLVM infrastructure.
In this work we present a new approach for automatic source code instrumentation at compile-time in combination with LLVM. Our approach records performance relevant data of an application execution for subsequent analyses. In our work we directly address current limitations of automatic compiler instrumentation in LLVM. Our specific contributions are:
-
•
Implementation of an LLVM pass for automatic source code instrumentation that does not interfere with compiler optimizations
-
•
Support for function filtering at
-
–
Compile-time and thereby offering the possibility to avoid the overhead of excessive function instrumentation
-
–
Runtime with early evaluation of conditions whether a function is filtered or not directly in the instrumentation code avoiding unnecessary calls into the monitoring component
-
–
-
•
Support for user defined filter rules
-
•
Internal handling of meta data avoiding the need for additional tools in order to obtain, e.g., function names and line numbers
-
•
Exception-aware instrumentation improving consistency of recorded data even in case of errors
-
•
In-depth performance analysis based on the information provided by our LLVM pass
The remainder of this work is organized as follows: Section 2 presents the design of our LLVM pass for automatic compiler instrumentation. Section 3 highlights implementation aspects. Several case studies in Section 4 demonstrate the advantages of our LLVM instrumentation pass. Section 5 provides an overview of related work. Lastly, Section 6 and 7 summarize the work and give an outlook on future work.
2. Methodology
Typically, monitoring infrastructures observe an application at runtime. They annotate the source code with so-called hooks to record activities like function entries and exits. The hooks invoke the monitor at each of these events. This process is also called instrumentation and demonstrated in Listings 1 and 2. Listing 1 shows the unmodified version of a simple code example. Listing 2 illustrates the annotated source code of the example. Each entry and exit of a function now contains a call (hook) to the monitor. The monitor implements the functions ENTER and EXIT. Whenever the application enters an annotated function, it calls the hook ENTER and transfers the control flow to the monitor. The monitor records relevant information such as timestamp or name of the entered function. Afterwards the monitor returns the control flow back to the application which continues its execution. The monitor handles the function exit analogously.
Different strategies are possible to insert hooks into source code. One option is to let users insert hooks manually. However, manual instrumentation is error-prone, cumbersome, and biased. Real-world applications with thousands of lines of code render manual instrumentation infeasible. Consequently, in this work we focus on automatic instrumentation methods. This section presents two techniques for instrumenting source code with LLVM/Clang.
Automatic Compiler Instrumentation
This technique uses the -finstrument-functions option of the Clang compiler. This option instructs the compiler to generate calls instrumenting each function entry and exit. It works very similar to the analog functionality in the GNU compiler collection. The compiler annotates function entries with __cyg_profile_func_enter and function exits with __cyg_profile_func_exit. The monitoring tool needs to implement both functions. In contrast to the GNU compiler collection, Clang provides no options to exclude functions or source code files from the instrumentation. The GNU compiler collection provides the flags -finstrument-functions-exclude-function-list and -finstrument-functions-exclude-file-list for this purpose. Therefore, this approach is prohibitive for the instrumentation of short-running, fine-granular functions. The instrumentation of such functions causes unacceptably large overhead and increases the runtime significantly. As inserted hooks remain in the binary—and always get called during application execution—even runtime filtering is useless in reducing measurement overhead. These conditions render automatic compiler instrumentation problematic and raise the need for selective instrumentation at compile-time.
LLVM Compiler Pass
This technique uses the LLVM Pass Framework. The LLVM Pass Framework provides an interface to directly modify or interact with a specific task of the compilation process, e.g., the optimization. This allows to circumvent the drawbacks of the automatic compiler instrumentation technique. Depending on the goal of the pass, its implementation inherits from one of the following classes:
-
•
ModulePass
-
•
CallGraphSCCPass
-
•
FunctionPass
-
•
LoopPass
-
•
RegionPass
-
•
BasicBlockPass
-
•
MachineFunctionPass
The classes reflect the entities of the LLVM Intermediate Representation (IR). Figure 3 depicts the concept of the IR.
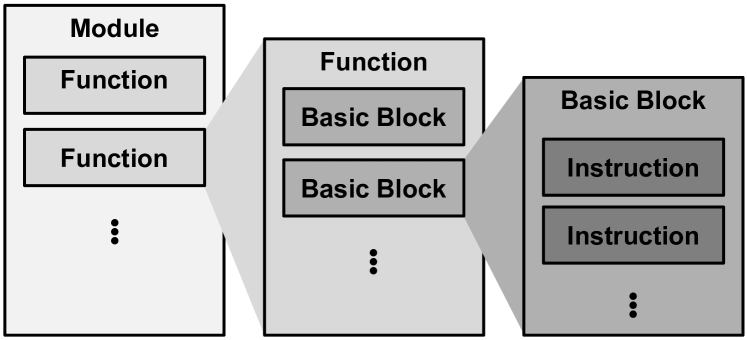
A module represents the complete application code. It consists of several functions. Each function contains multiple basic blocks. A basic block involves individual instructions. LLVM provides access to each layer and iterators for selecting individual items. The class FunctionPass is most suitable for function instrumentation. It is invoked for each application function. We use FunctionPass to insert hooks into the IR. By applying filtering techniques we realize selective function instrumentation at compile-time. We discuss our implementation in more detail in the following section.
3. Implementation
In this work we extend the Score-P monitoring infrastructure (Dieter An Mey et al., 2012) to improve its capability for instrumenting code with the Clang compiler. Figure 4 depicts the general software architecture of Score-P.
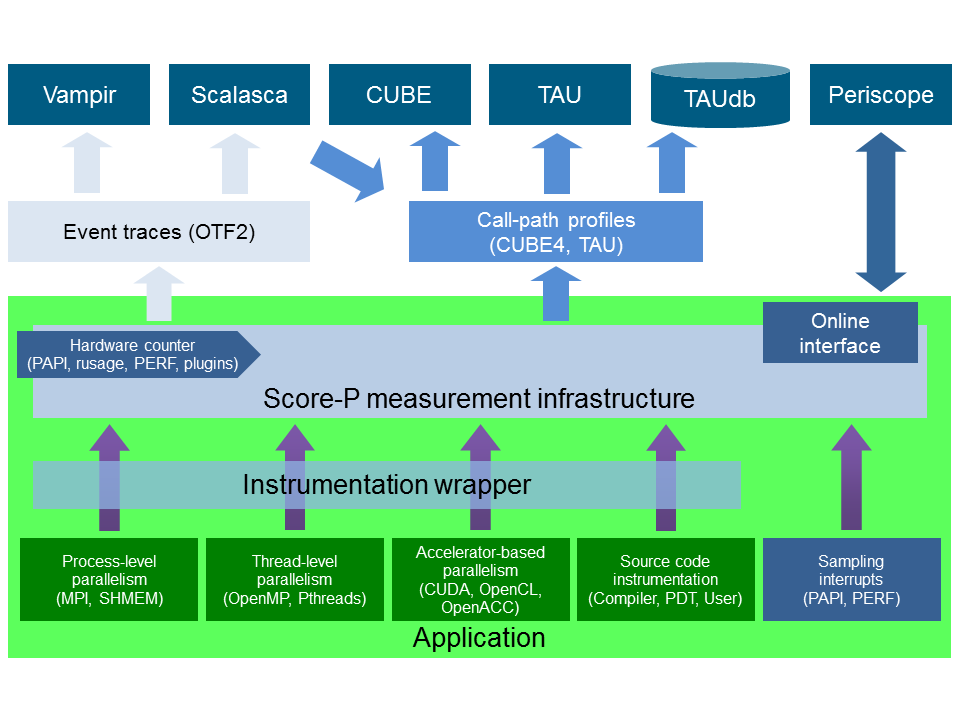
Score-P already supports automatic source code instrumentation for GNU, Intel, PGI, Cray, IBM, and Fujitsu compilers. In addition, Score-P provides a GCC compiler instrumentation plug-in (Ziegenbalg and Wesarg, 2012) since version 1.4 (released in January 2015). We have applied the knowledge gained during the GCC plug-in development for the implementation of our LLVM plug-in.
A major requirement of our plug-in is its independence from the programming language of the source code. This requirement disqualifies an implementation within the Front-End and suggests an LLVM pass implementation. Our work builds on LLVM version 3.8 or newer. In addition, we rely on Clang flags to load the dynamic library containing the instrumentation plug-in. As explained in Section 2 we instrument a source code function by implementing a FunctionPass. We override the virtual method runOnFunction(Function &F) inherited from the FunctionPass class. This runOnFunction method is called for each function in the processed IR. The parameter F provides the current function.
Collecting meta data
We utilize the compiler capabilities to collect and store function specific meta data. For example, we determine the name of the current function. This is necessary as the compiler might decorate the function name. For example, in case of function overloading this technique is necessary. There might exist multiple variants of a function with the same name but different signatures. In such case, the compiler creates unique internal function names. Yet, these internal function names are not created considering human readability. Therefore, we demangle the internal function name to provide function names corresponding to the source code. In addition, we record source file name and line numbers associated with the current function. Function names and line numbers allow users to correlate monitored events with the application source code. By internal meta data handling the plug-in is able to pass this information to the monitoring infrastructure. Otherwise, the monitoring infrastructure would need external tools or libraries to retrieve this data at runtime.
Deciding whether a function is instrumented
Within the method runOnFunction we check whether we should instrument the current function. Therefore, we test certain attributes of the function. For example, we skip the instrumentation if the function has an empty body, represents a built-in function, or is an internal function of the OpenMP runtime. Additionally, with our implementation users can selectively remove functions from instrumentation at compile-time. Thus, we apply a user specified rule set on each function name. The rule set can contain mangled and demangled function names as well as source file names. Eventually, considering all checks, we decide whether we filter—exclude from instrumentation—or instrument the current function.
Adding calls to the monitoring infrastructure
As described in Section 2, we insert hooks into the IR in order to instrument the current function. Listing 3 shows the result of adding the instrumentation in pseudo code. Calls to the monitoring infrastructure are guarded by if statements. These conditional calls allow an efficient runtime filtering as the condition is evaluated within the instrumentation code. User defined filter rules determine the condition. Iterators over basic blocks and their instructions help to find the appropriate place for inserting calls to the Score-P monitoring infrastructure. We insert the instrumentation of the function entry as the last instruction of the first basic block, or before the first call instruction of the first basic block. The structure of the remaining basic blocks is modified in order to achieve a try/finally semantic as shown in Listing 3. The try block encapsulates the instructions of the function body, whereas the corresponding finally block contains the function exit instrumentation.
Instrumentation plug-in usage
The pass is built as a shared library. The user has to ensure that the compiler loads this shared library to enable instrumentation at compile-time. Therefore, the Clang compiler requires the following additional arguments:
-Xclang <instrumenation_pass_library.so>
-c main.c
The LLVM pass registry manages registration and initialization of the pass subsystem at compiler startup.
After explaining implementation details of our work we demonstrate the usability of the presented instrumentation approach in the following section.
4. Case Study
In this section we present experiments evaluating the LLVM instrumentation plug-in. First, we compare event sequences recorded by LLVM’s automatic compiler instrumentation and our LLVM instrumentation plug-in. Second, we demonstrate the usability of our LLVM instrumentation plug-in using a computation kernel of a real world application. Our test system features IBM POWER8 CPUs with cores per CPU ( cores in total). We compile the source code of the experiments with Clang 4.0 and GCC 5.4.0. The experiments use the parallelization paradigms Message Passing Interface (MPI) (Forum, 2015) and OpenMP (Board, 2015) to distribute the workload over multiple processing elements. In our experiments we use IBM Spectrum MPI 10.1 and the OpenMP runtime of the corresponding compilers.
Comparison of event sequences
In the first experiment we compare sequence lengths recorded from a Jacobi solver application. The Jacobi method implements an iterative algorithm in order to compute the solutions of a diagonally dominant system of linear equations. This code uses MPI and OpenMP.
In general, the integration of our LLVM instrumentation plug-in into the Score-P infrastructure provides benefits. For example, we can utilize already existing features of the Score-P monitoring infrastructure and corresponding analysis tools. We instrument the Jacobi solver with Score-P and subsequently execute the application in order to record its activities at runtime. We use our LLVM plug-in to instrument user functions. In addition, Score-P supports the instrumentation of MPI and OpenMP.
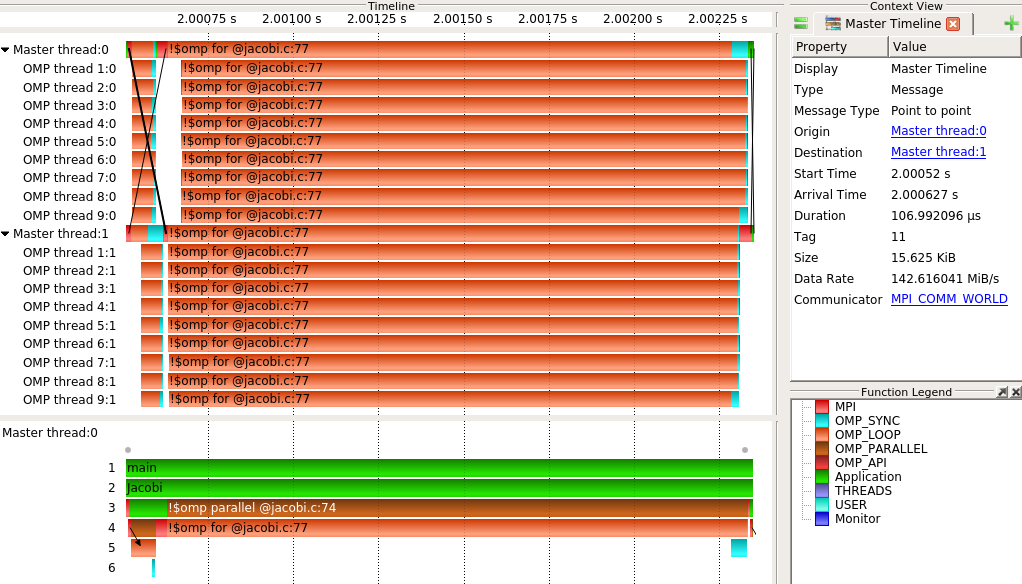
Figure 5 shows a timeline visualization of the recorded event sequence in Vampir (Knüpfer et al., 2008). The figure visualizes the application activities in a chronological order. The top chart shows an overview of all processing elements (represented by horizontal bars) including their executed activities (represented by individual colors in the bars). It depicts two MPI processes, “Master thread:0” and “Master thread:1”. Each MPI process forks nine additional threads in OpenMP parallel regions (“OpenMP thread”). The bottom chart visualizes the call stack of “Master thread:0”. Green areas indicate invocations of user functions111User functions are all functions belonging to the application source code excluding calls to libraries and parallelization paradigms.. Brown areas in the figure indicate OpenMP parallel regions, whereas orange areas indicate OpenMP parallel loops. Red areas represent calls to MPI library functions. Black lines between the MPI processes depict message transfers. As shown in the right side of Figure 5, users can access information about parallelization paradigms in addition to source code instrumentation. This is vital for comprehensive performance analyses since performance bottlenecks are often caused by complex effects. To improve the scalability of parallel applications, programmers have to investigate the interactions between user code, library calls, and parallelization paradigms.
In the next experiment we compile the source code with Clang using different optimization levels—-O0 to -O3—and both instrumentation options, -finstrument-functions and our LLVM instrumentation plug-in. The recorded event sequence—representing function enters and exits—differs between both instrumentation methods. Table 1 compares the experiment variants and their corresponding number of user function invocations summarized over all processing elements.
| Number of user function invocations | ||
| Optimization level | automatic compiler instrumentation | instrumentation via plug-in |
| -O0 | ||
| -O1 | ||
| -O2 | ||
| -O3 | ||
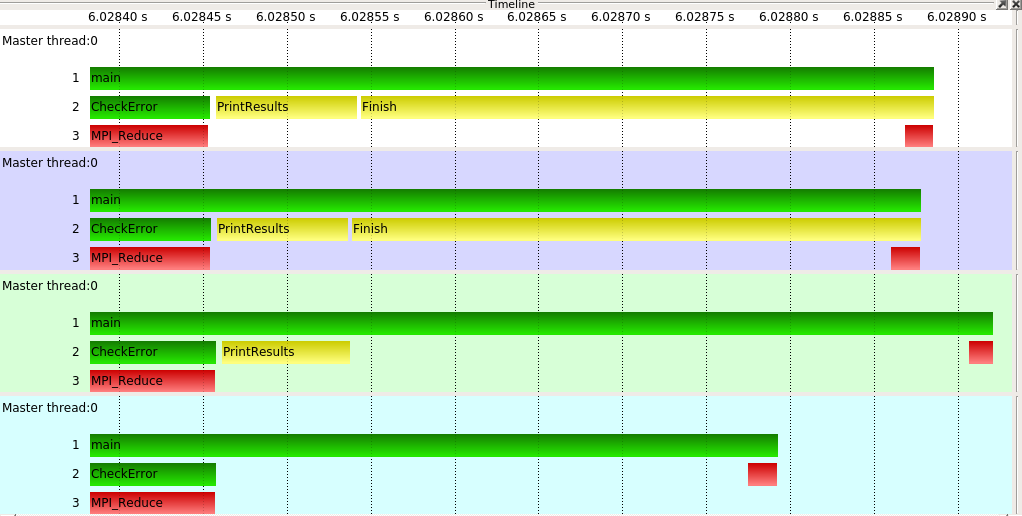
Automatic compiler instrumentation using -finstrument-functions produces the same event sequence lengths for all optimization levels, comprising of function calls in total. The LLVM instrumentation plug-in generates event sequences containing less function calls in higher optimization levels. The interaction between optimizations performed by the compiler and the selected instrumentation method causes this different behavior. For instance, the handling of function inlining and function instrumentation depends on the compiler. The automatic compiler instrumentation of GCC also annotates functions expanded inline in other functions 222https://gcc.gnu.org/onlinedocs/gcc/Instrumentation-Options.html. In contrast, the usage of -finstrument-functions disables function inlining for the Intel C/C++ compiler 333https://software.intel.com/en-us/node/682535. Although it is not clearly documented, we expect that LLVM’s automatic compiler instrumentation annotates inlined functions similar to GCC. Nevertheless, the instrumentation pass of our LLVM plug-in runs after the compiler optimization. If a function is inlined, it does not represent a function call. Consequently, inlined functions are not instrumented by the plug-in and do not trigger an event at runtime. Figure 6 contrasts event streams recorded with different optimization levels. It illustrates the call stack of the master thread of the first MPI process of the Jacobi application. The comparison includes results for the optimization level -O0 (white background), -O1 (blue background), -O2 (green background), and -O3 (azure background). Yellow bars highlight functions that are inlined in higher optimization levels.
Comparison of runtime overheads
In the second experiment we investigate instrumentation inflicted runtime overheads using the application miniFE 444http://www.nersc.gov/users/computational-systems/cori/nersc-8-procurement/trinity-nersc-8-rfp/nersc-8-trinity-benchmarks/minife/. miniFE is an application of the Trinity benchmark suite and consists of a couple of compute kernels representing implicit finite-element applications. The code consists of an OpenMP and a MPI+OpenMP version. In our experiments we use the OpenMP version of miniFE. Although Score-P can record the parallelization paradigm (see the Jacobi example above), we will focus on source code instrumentation in the following. Table 2 shows the minimum runtime of three respective experiment runs.
| Experiment | Runtime in seconds |
|---|---|
| uninstrumented | 6 |
| automatic compiler instrumentation | |
| automatic compiler instrumentation, runtime filter | |
| instrumentation via plug-in | |
| instrumentation via plug-in, compile-time filter |
Uninstrumented baseline:
We start with a baseline measurement of the uninstrumented binary. The miniFE binary expects input parameters which specify the dimensionality of the problem. If not stated otherwise we run the experiments with a problem size of for each of the dimensions. The uninstrumented application runs about seconds using threads.
Automatic compiler instrumentation via -finstrument-functions:
In the next experiment we instrument miniFE with the -finstrument-functions option of the Clang compiler. Automatic compiler instrumentation increases the runtime by more than a factor of . A profile of the recorded events contains about billion function calls. Most of these functions— billion or —are C++ STL functions. The C++ STL functions are executed very frequently whilst showing a short runtime per call. The instrumentation of this kind of functions induces a high runtime overhead and thereby severely disturbs the application behavior, rendering the recorded event data—especially the timing information—useless.
Automatic compiler instrumentation via -finstrument-functions with runtime filtering:
In this experiment setup we want to reduce the overhead by applying a filter at runtime. This filter prevents the recording of C++ STL events and some miniFE functions handling internal data structures. However, each instrumented event still calls into the monitoring infrastructure. With the applied filter the runtime decreases to seconds, i.e., in comparison to the uninstrumented application the runtime increases by a factor of . These results show that runtime filtering is not sufficient in order to reduce the overhead to an acceptable amount. Consequently, we must already avoid the instrumentation of high frequency functions.
Instrumentation via LLVM plug-in:
In the next experiment we instrument miniFE using our LLVM plug-in. The instrumentation pass of our plug-in runs after the optimization step. As a result, the plug-in does not instrument inlined functions, which prevents the annotation of C++ STL functions and thereby dramatically reduces the number of calls into the monitoring infrastructure at runtime. This setup reduces the runtime to seconds. That corresponds to a runtime increase by a factor of compared to the uninstrumented version.
Instrumentation via LLVM plug-in with compile-time filtering:
In addition to the previous experiment, we also apply a filter file containing a list of miniFE functions that are called with a high frequency and show a runtime less than s per visit. The LLVM instrumentation plug-in uses these filter rules to exclude the specified functions from instrumentation. With this compile-time filtering we are able to reduce the application runtime to seconds, which is close to the initial baseline.
Summary:
In our experiments automatic compiler instrumentation exhibits severe runtime overhead, limiting its usability, especially for C++ applications. We run additional tests with an increased problem size of to evaluate the trend for extended application runs. In this setup the uninstrumented binary completes the computation in about seconds. However, with automatic compiler instrumentation enabled the miniFE application does not finish within hours. Using the LLVM instrumentation plug-in we are able to run the application in seconds. These measurements support the results presented above and confirm the need for methods that can prevent instrumentation of specific functions. Additional tests (not shown) with GCC’s automatic compiler instrumentation and the GCC instrumentation plug-in in Score-P show similar behavior.
5. Related Work
All authors of this paper work in the area of high performance computing (HPC). Although our approach is not limited to HPC, we focus on related work in the area of HPC.
Data Acquisition
Typical HPC machines provide installations of at least one of the commercial Intel (Corporation, 2016), PGI (Corporation, 2017), Cray (Inc., 2016), IBM (IBM Corporation, 2017), and Fujitsu (Limited, 2014) compilers. However, the Open Source compilers GCC (Gough and Stallman, 2004) and LLVM (Lattner and Adve, 2004) are also often used. All of them provide compiler options to enable automatic function instrumentation. For example, GCC, Intel, and LLVM provide the -finstrument-functions option. On the one hand, the automatic function instrumentation might result in less aggressive code optimization, e.g., inlining will be disabled. On the other hand, selective function instrumentation is hard to realize with this option. For example, GCC provides additional options to specify filter rules to exclude specific functions or complete source code from instrumentation. However, these filter rules work on substring matching. The filter rule EXCLUDE foo does not only prevent instrumentation of function foo but also matches with the functions foobar, myfoo, and another_foo_func. LLVM and GCC provide a plug-in interface to implement extension for the compiler. These plug-in interfaces are used in this work to enhance function instrumentation capabilities. Since version 4.0 LLVM/Clang provides an additional instrumentation option—the XRay function call tracing system (Berris et al., 2016). It implements a MachineFunctionPass. In contrast to our approach XRay uses binary instrumentation and thereby works closer to the machine level. It supports filtering of functions at compile-time based on their number of instructions. Future releases may contain features for advanced filtering options. Exceptions are not handled gracefully by the XRay instrumentation.
An alternative method to record information about the application runtime behavior is sampling. Sampling periodically interrupts an application and records its status, e.g., the current call stack. In contrast to instrumentation—where each instrumented event is triggered at runtime—sampling gives a statistical overview on the application depending on the sampling frequency.
Data Analysis
Performance and debugging tools are the prime users of information about applications’ runtime behavior. TAU (Shende and Malony, 2006) can instrument Fortran, C, and C++ applications. It supports source-level (manipulating the source code), binary-rewriting as well as compiler instrumentation. Fine-grained selective instrumentation is only available for source-level and binary-rewriting instrumentation. In addition, TAU provides a feature that avoids recording functions based on the number of their calls and their runtime per call. This feature can be used to reduce the overhead induced by excessive recording of short-running functions. However, the feature just skips the data recording but does not avoid the function instrumentation itself. Score-P (Dieter An Mey et al., 2012) is a common monitoring infrastructure for several analysis tools such as Vampir (Knüpfer et al., 2008), Scalasca (Geimer et al., 2010), Periscope (Gerndt and Ott, 2010), and TAU (Shende and Malony, 2006). It supports automatic compiler instrumentation in combination with various compilers. In addition, Score-P is able to instrument functions via the plug-in interface of the GCC compiler since version 1.4. Due to the standardized data formats a wide range of tools is available to analyze performance data recorded by Score-P. Many tools, e.g., Allinea DDT/MAP (Allinea MAP, 2017), Intel VTune (VTune, 2017), Cray PAT (Kaufmann and Homer, 2003), HPCToolkit (Adhianto et al., 2010), and Extrae (Extrae, 2017), combine instrumentation and sampling. For example, calls to the MPI library are instrumented whereas user functions are captured via sampling. GProf (Graham et al., 1982) instruments in order to get an exact call count for each function, and samples the application to get statistical timing information. However, these tools store their performance data in individual formats. As a result, the interoperability of these tools is limited.
6. Conclusion
Common instrumentation approaches employ runtime filtering methods of selected functions in order to control performance data size. Our plug-in additionally allows for selective instrumentation of specific functions. This completely avoids the measurement overhead of filtered functions. Especially for C++ codes, selective instrumentation enables measurement runs with acceptable overhead, making highly-detailed measurements for such applications possible.
The LLVM compiler infrastructure’s clean separation into the Front-End and Optimizer assists our work on the plug-in implementation. We concentrate on efficient code instrumentation mechanism without having to take care of specific characteristics of the processed programming language. However, this separation has shortcomings when it comes to transferring additional information from the Front-End to the Optimizer. First, the Front-End must be instructed to emit necessary information for proper source code location annotation of the instrumented functions (e.g, source file name and line number). For the Clang Front-End, that means users have to compile their source code with debug information (-g), even if the final object file does not need debug symbols at all. In our previous work on the GCC instrumentation plug-in we were able to directly obtain such information from GCC. Second, the IR representation only provides the mangled symbol name for functions, which are hard to read by users. However, creating the demangled name requires the use of external tools. A last shortcoming is the missing annotation of artificially created functions, e.g., .omp_outlined. functions created by the compiler for OpenMP parallel regions or tasks. In order to identify such functions, we match the name of the currently processed function with a list of known artificial functions. However, these names might be subject to change due to internal refactoring within the LLVM infrastructure. Some of these shortcomings could be circumvented by implementing an additional Clang Front-End plug-in. Though, a Front-End plug-in goes hand in hand with dependencies to specific programming languages and thereby would limit the versatility of our instrumentation plug-in. Therefore, it is desirable if LLVM provides options to query the mentioned kind of information conveniently.
7. Future Work
In contrast to Clang—the LLVM C/C++ Front-End—there is currently no native Fortran Front-End available for LLVM. Nevertheless, Fortran is still an important programming language in scientific and high performance computing. One option for compiling Fortran code with the LLVM infrastructure is DragonEgg (Team et al., 2013) 555http://dragonegg.llvm.org/. It acts as a GCC plug-in. Thus, DragonEgg allows the use of GCC’s Front-Ends with LLVM’s Optimizers and code generators. The Flang project 666https://github.com/flang-compiler/flang works on the implementation of a native Fortran Front-End for LLVM. When the Flang Front-End becomes available, we will repeat our experiments. As our instrumentation plug-in works on the LLVM IR and therefore is independent of a specific Front-End, we do not expect the need for major adjustments in the plug-in code with respect to the instrumentation mechanism. However, we expect to modify aspects of the meta data handling. For example, Fortran compilers use custom mangling schemes for Fortran modules which implies adaption to the creation of pretty function names in our plug-in.
Acknowledgements.
This research used resources of the Oak Ridge Leadership Computing Facility at Oak Ridge National Laboratory, which is supported by the Office of Science of the Department of Energy under Contract DE-AC05-00OR22725.References
- (1)
- Adhianto et al. (2010) Laksono Adhianto, S. Banerjee, Michael W. Fagan, Mark Krentel, Gabriel Marin, John M. Mellor-Crummey, and Nathan R. Tallent. 2010. HPCTOOLKIT: tools for performance analysis of optimized parallel programs. Concurrency and Computation: Practice and Experience 22, 6 (2010), 685–701. https://doi.org/10.1002/cpe.1553
- Allinea MAP (2017) Allinea MAP 2017. C/C++ profiler and Fortran profiler for high performance Linux code. (2017). Retrieved August, 2017 from http://allinea.com/products/map
- Berris et al. (2016) Dean M. Berris, Alistair Veitch, Nevin Heintze, Eric Anderson, and Ning Wang. 2016. XRay: A Function Call Tracing System. Technical Report. A white paper on XRay, a function call tracing system developed at Google.
- Board (2015) OpenMP Architecture Review Board. 2015. OpenMP Application Programming Interface Version 4.5. Technical Report. http://www.openmp.org/wp-content/uploads/openmp-4.5.pdf
- Corporation (2016) Intel Corporation. 2016. Intel C++ Compiler 17.0 Developer Guide and Reference. (2016). https://software.intel.com/en-us/intel-cplusplus-compiler-17.0-user-and-reference-guide-pdf
- Corporation (2017) NVIDIA Corporation. 2017. PGI Compiler Users Guide. (2017). http://www.pgroup.com/resources/docs/17.7/x86/pgi-user-guide/index.htm
- Dieter An Mey et al. (2012) Dieter An Mey et al. 2012. Score-P: A Unified Performance Measurement System for Petascale Applications. In Competence in High Performance Computing 2010, Christian Bischof, Heinz-Gerd Hegering, Wolfgang E. Nagel, and Gabriel Wittum (Eds.). Springer Berlin Heidelberg.
- Extrae (2017) Extrae 2017. Extrae instrumentation package. (2017). Retrieved September 8, 2017 from https://tools.bsc.es/paraver
- Forum (2015) Message Passing Interface Forum. 2015. MPI: A Message-Passing Interface Standard Version 3.1. Technical Report. http://mpi-forum.org/docs/mpi-3.1/mpi31-report.pdf
- Geimer et al. (2010) Markus Geimer, Felix Wolf, Brian J. N. Wylie, Erika Ábrahám, Daniel Becker, and Bernd Mohr. 2010. The Scalasca Performance Toolset Architecture. Concurr. Comput. : Pract. Exper. 22, 6 (April 2010), 702–719. https://doi.org/10.1002/cpe.v22:6
- Gerndt and Ott (2010) Michael Gerndt and Michael Ott. 2010. Automatic performance analysis with periscope. Concurrency and Computation: Practice and Experience 22, 6 (2010), 736–748.
- Gough and Stallman (2004) Brian Gough and Richard Stallman. 2004. An introduction to GCC. Network Theory, Ltd (2004).
- Graham et al. (1982) Susan L. Graham, Peter B. Kessler, and Marshall K. Mckusick. 1982. Gprof: A Call Graph Execution Profiler. In ACM Sigplan Notices, Vol. 17. ACM, 120–126.
- IBM Corporation (2017) IBM Corporation 2017. IBM Software - C and C++ Compilers family. (2017). Retrieved September, 2017 from http://www-03.ibm.com/software/products/en/ccompfami
- Inc. (2016) Cray Inc. 2016. Cray C and C++ Reference Manual. (2016). http://docs.cray.com/PDF/Cray_C_and_Cplusplus_Reference_Manual_85.pdf
- Kaufmann and Homer (2003) Steve Kaufmann and Bill Homer. 2003. Craypat-cray x1 performance analysis tool. Cray User Group (May 2003) (2003).
- Knüpfer et al. (2008) Andreas Knüpfer et al. 2008. The Vampir Performance Analysis Tool-Set. In ”Tools for High Performance Computing”, Proceedings of the 2nd International Workshop on Parallel Tools for High Performance Computing. Springer-Verlag, Stuttgart, Germany.
- Lattner and Adve (2004) Chris Lattner and Vikram Adve. 2004. LLVM: A Compilation Framework for Lifelong Program Analysis & Transformation. In Proceedings of the 2004 International Symposium on Code Generation and Optimization (CGO’04). Palo Alto, California.
- Limited (2014) Fujitsu Limited. 2014. Advanced Software for the FUJITSU Supercomputer PRIMEHPC FX100. (2014). http://www.fujitsu.com/global/Images/primehpc-fx100-soft-en.pdf
- Shende and Malony (2006) Sameer S. Shende and Allen D. Malony. 2006. The Tau Parallel Performance System. The International Journal of High Performance Computing Applications 20, 2 (2006), 287–311. https://doi.org/10.1177/1094342006064482 arXiv:http://dx.doi.org/10.1177/1094342006064482
- Sierra (2017) Sierra 2017. HPC system at Lawrence Livermore National Laboratory (LLNL). (2017). Retrieved September 8, 2017 from https://asc.llnl.gov/coral-info
- Summit (2017) Summit 2017. HPC system at Oak Ridge National Laboratory (ORNL). (2017). Retrieved September 8, 2017 from https://www.olcf.ornl.gov/summit/
- Team et al. (2013) LLVM Team et al. 2013. Dragonegg-Using LLVM as a GCC Backend. (2013).
- VTune (2017) VTune 2017. Intel® VTune™ Amplifier. (2017). Retrieved September, 2017 from https://software.intel.com/en-us/intel-vtune-amplifier-xe
- Wirth (1996) Niklaus Wirth. 1996. Compiler Construction. Addison-Wesley.
- Ziegenbalg and Wesarg (2012) Johannes Ziegenbalg and Bert Wesarg. 2012. The Benefit of GCC’s open structure on instrumentation in the HPC area. Talk at GNU Tools Cauldron. (July 2012). Retrieved September 6, 2017 from https://gcc.gnu.org/wiki/cauldron2012#The_Benefit_of_GCC.27s_open_structure_on_instrumentation_in_the_HPC_area