CALET Collaboration
Energy Spectrum of Cosmic-ray Electron and Positron from 10 GeV to 3 TeV Observed with the Calorimetric Electron Telescope on the International Space Station
Abstract
First results of a cosmic-ray electron + positron spectrum, from 10 GeV to 3 TeV, is presented based upon observations with the CALET instrument on the ISS starting in October, 2015. Nearly a half million electron + positron events are included in the analysis. CALET is an all-calorimetric instrument with total vertical thickness of 30 and a fine imaging capability designed to achieve a large proton rejection and excellent energy resolution well into the TeV energy region. The observed energy spectrum over 30 GeV can be fit with a single power law with a spectral index of -3.1520.016 (stat.+ syst.). Possible structure observed above 100 GeV requires further investigation with increased statistics and refined data analysis.
pacs:
96.50.sb,95.35.+d,95.85.Ry,98.70.Sa,29.40.VjI Introduction
The CALorimetric Electron Telescope (CALET) is a Japan-led international mission funded by the Japanese Space Agency (JAXA) in collaboration with the Italian Space Agency (ASI) and NASA Torii et al. (2015). The instrument was launched on August 19, 2015 by a Japanese carrier, H-II Transfer Vehicle (HTV), and robotically installed on the Japanese Experiment Module-Exposed Facility (JEM-EF) on the International Space Station (ISS) for a two-year mission, extendable to five years.
The primary science goal of CALET is to perform high-precision measurements of the cosmic-ray electron + positron spectrum from 1 GeV to 20 TeV. In the high energy, TeV, region, CALET can observe possible signatures of sources of high energy particle acceleration in our local region of the galaxy Nishimura et al. (1980); Kobayashi et al. (2004). In addition, the observed increase of the positron fraction over 10 GeV by PAMELA Adriani et al. (2009) and AMS-02 Accardo et al. (2014) tells us that at high energy an unknown primary component of positrons may be present in addition to the secondary component produced during the galactic propagation process. Candidates for such primary sources range from astrophysical ones (e.g. Pulsar) to exotic (e.g. Dark Matter). Since these primary sources naturally emit positron-electron pairs, it is expected that the electron + positron (hereafter, all-electron) spectrum might exhibit a spectral structure determined by the origin of positrons. This may become visible in the high energy domain of the spectrum in the case, for instance, of an acceleration limit from pulsars or the mass of dark matter particles.
II CALET Instrument
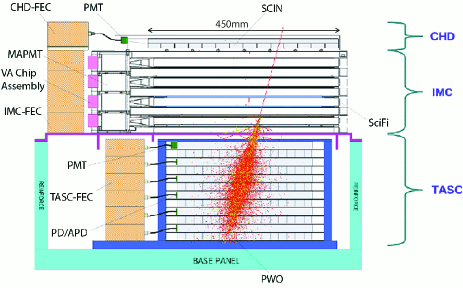
CALET is an all-calorimetric instrument, with a total vertical thickness equivalent to 30 radiation lengths () and 1.3 proton interaction lengths (), preceded by a charge identification system. The energy measurement relies on two independent calorimeters: a fine-grained pre-shower IMaging Calorimeter (IMC), followed by a Total AbSorption Calorimeter (TASC). In order to identify the individual chemical elements, a Charge Detector (CHD) is placed at the top of the instrument.
CALET has several unique and important characteristics SM- . They include an excellent separation among hadrons and electrons (105) and fine energy resolution (2%) to precisely measure the energy of electrons in the TeV region. Particle identification and energy measurements are performed by TASC, the 3 thick IMC ensuring proper development of electromagnetic shower in its initial stage is used for track reconstruction, and charge identification is obtained from CHD.
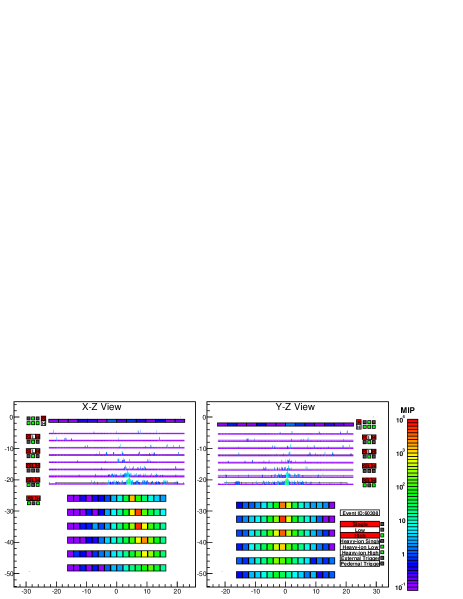
In Fig. 2, a schematic side view of the instrument is shown with a simulated shower profile produced by a 1 TeV electron, while an example of a 1 TeV electron shower candidate in the flight data is shown in Fig. 2. CALET has a field of view of 45∘ from the zenith, and an effective geometrical factor for high-energy ( 10 GeV) electrons of 1040 cm2sr, nearly independent of energy.
III Data Analysis
We have analyzed flight data (FD) collected with a high-energy shower trigger Asaoka et al. (2015) in 627 days from October 13, 2015 to June 30, 2017. The total observational live time is 12686 hours and the live time to total observation time fraction is 84%. On-orbit data collection has been continuous and very stable.
A Monte Carlo (MC) program was developed to simulate physics processes and detector signals based on the simulation package EPICS Kasahara (1995) (EPICS9.20 / Cosmos8.00); it was tuned and tested with accelerator beam test data, and a detailed detector configuration was implemented. The MC event samples are generated in order to derive event selection and event reconstruction efficiencies, energy correction factor, and background contamination. These samples consist of down-going electrons and protons produced isotropically on the surface of a sphere with a radius of 78 cm which totally encloses the instrument.
Energy measurement - Energy calibration is a key issue of CALET as a calorimeter instrument to achieve high precision and accurate measurements. The method of energy calibration and the associated uncertainties have been described elsewhere Asaoka et al. (2017). Detailed calibration achieved a fine energy resolution of 2% or better in the energy region from 20 GeV to 20 TeV (% for 10–20 GeV). The validity of our simulation has been checked with beam test data Akaike et al. (2013); Niita et al. (2015); Tamura et al. . Regarding temporal variations occurring during long-term observations, each detector component is calibrated by modeling variations of the MIP peak obtained from non-interacting particles (protons or helium), recorded with a dedicated trigger mode. The rate of change of the gain, decreasing as a function of time, is less than 0.5% per month after one year since the beginning of operations.
Track reconstruction - As some of the calibrations and most of the selection parameters depend on the trajectory of the incoming particle, track recognition is important. As a track recognition algorithm, we adopt the “electromagnetic shower tracking (EM track)” Akaike et al. (2013), which takes advantage of the electromagnetic shower shape and of the IMC design concept. Thanks to optimzed arrangement of tungsten plates between the SciFi layers, shower cascades are smooth and stable. By using the pre-shower core at the bottom of the IMC layers (at depths of 2 and 3 ) as initial track candidates, a very reliable and highly efficient track recognition becomes possible.
Preselection - In order to minimize and accurately subtract proton contamination in the sample of electron candidates, a preselection of well-reconstructed and well-contained single-charged events is applied. Furthermore, by removing events not included in MC samples, i.e., particles with incident angle from zenith larger than 90∘ and heavier particles, equivalent event samples between FD and MC were obtained. The preselection consists of (1) an offline trigger confirmation, (2) geometrical condition, i.e. the reconstructed track must traverse the instrument from CHD top to TASC bottom layer, (3) a track quality cut to ensure reconstruction accuracy, (4) charge selection using CHD, and (5) longitudinal shower development and (6) lateral shower containment consistent with those expected for electromagnetic cascades. Combined efficiency of preselection for electrons is very high: 90% above 30 GeV to 3 TeV, 85% at 20 GeV at variance with only 60% at 10 GeV due to lower trigger efficiency.
Energy reconstruction - In order to reconstruct the energy of primary electrons, an energy correction function is derived using the electron MC data after preselection. The energy deposit in the detector is obtained as the sum of TASC and IMC, where a simple sum is sufficient for TASC while compensation for energy deposits in tungsten plates is necessary for IMC. The correction function is then derived by calculating the average ratio of the true energy to the energy deposit sum in the detector. Due to near total absorption of the shower, the correction factor is very small, 5%, up to the TeV region.
Electron identification - The last step of event selection is electron identification exploiting the shower shape difference between electromagnetic and hadronic showers Pacini et al. (2017); SM- . We applied two methods: simple two parameter cuts and multivariate analysis (MVA) based on machine learning, to understand systematic effects and the stability of the resultant flux. A simple two-parameter cut is embedded into the -estimator defined as , where is the second moment of the lateral energy-deposit distribution in the TASC first layer computed with respect to the shower axis, and is the fractional energy deposit of the bottom TASC layer with respect to the total energy deposit sum in the TASC. The average of an electromagnetic shower in lead is roughly estimated as 1.6 cm (one Moliere unit) while a proton-induced shower has a wider size because of the spread due to secondary pions in the nuclear interactions, making it a powerful parameter for separation. On the other hand, mainly due to the difference between radiation length and interaction length of PWO together with the large thickness of TASC, is a simple but very powerful parameter for separation. The estimated performance of separation in MC is confirmed with test beam results Akaike et al. (2013); Tamura et al. .
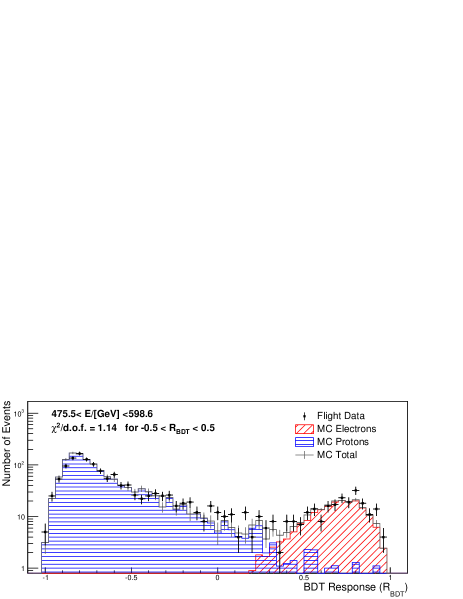
For the MVA analysis, we use the Boosted Decision Tree (BDT) method from the toolkit TMVA Hocker et al. (2007). Multiple parameters with a significant discrimination power between electromagnetic and hadronic showers, and for which very good agreement between FD and MC was confirmed, are combined into a single discrimination function, taking into account the correlations among the parameters. Using MC information, the BDT algorithm is trained to maximize the separation power based on the input parameters, separately for different ranges of deposited energy SM- . In order to maximize the rejection power against the abundant protons, MVA has been adopted above 500 GeV, while the -estimator cut was used below 500 GeV. An example of BDT response distributions is shown in Fig. 3.
Subtraction of proton background events - In order to extract the residual proton contamination in the final electron sample, templates of the -estimator and BDT response were used, where normalization factors for MC electrons and MC protons are included as fitting parameters. The value of the selection is chosen as to correspond to 80% efficiency for electrons using the distribution of MC electrons. The contaminating protons are derived as the ratio between the expected absolute number of events from the distribution of MC protons and the normalization factor, independent of the spectral shape of the electrons. The resultant contamination ratios of protons in the final electron sample is 5% up to 1 TeV, 10%–15% in 1–3 TeV region, while a constant high efficiency of 80% for electrons is kept.
Absolute energy scale calibration - Energy scale calibrated with MIPs is commonly checked in space experiments by analysis of the geomagnetic cut-off energy Ackermann et al. (2012). For this study, data samples obtained by the low energy shower trigger ( GeV) are selected inside an interval of the McIlwain parameter Smart and Shea (2005) of 0.95-1.25. By dividing the interval of into three bins: 0.95-1.00, 1.00-1.14 and 1.14-1.25, different rigidity cut-off regions are selected corresponding to 15 GV, 13 GV and 11 GV, respectively. The cut-off energy is calculated by using the track trajectory tracing code ATMNC3 Honda et al. (2004) and the International Geomagnetic Reference Field, IGRF-12 Thébault et al. (2015). The rigidity cut-off in the electron flux is measured by subtracting carefully the secondary components (reentrant albedo electrons) with checking the azimuthal distribution in corresponding rigidity regions. It is found that the average ratio of the expected to measured cut-off position in the electron flux is 1.0350.009 (stat.). As a result, a correction of the energy scale by 3.5% was implemented in the analysis.
IV Systematic Uncertainties
The main sources of systematic uncertainties include: (i) energy scale, (ii) absolute normalization and (iii) energy dependent uncertainties.
(i) The energy scale determined with a study of the rigidity cut-off is 3.50.9% (stat.) higher than that obtained with MIP calibrations. As the two methods are totally independent, the causes of this difference have to be further investigated to clarify their contribution to the systematic error on the energy scale. However, the uncertainty is not included in the present analysis and this issue will be addressed by further studies. Since the full dynamic range calibration Asaoka et al. (2017) was carried out with a scale free method, its validity holds regardless of the absolute scale uncertainty.
(ii) The systematic uncertainty related to the absolute normalization arises from geometrical acceptance (), live time measurement, and long-term stability of the detector SM- . is a pure geometrical factor for CALET and is independent of energies to a good approximation. The geometry of the CALET detector was accurately measured on the ground and is introduced in the MC model; the systematic errors due to are negligibly small. Other errors are taken into account by studying the stability of the spectrum for each contributing factor.
(iii) The remaining uncertainties, including track reconstruction, various event selections and MC model dependence SM- , are in general energy dependent. In order to estimate tracking-related systematics, for example, the dependence on the number of track hits and the difference between two independent tracking algorithms Brogi et al. (2015); Maestro et al. (2017) were investigated.
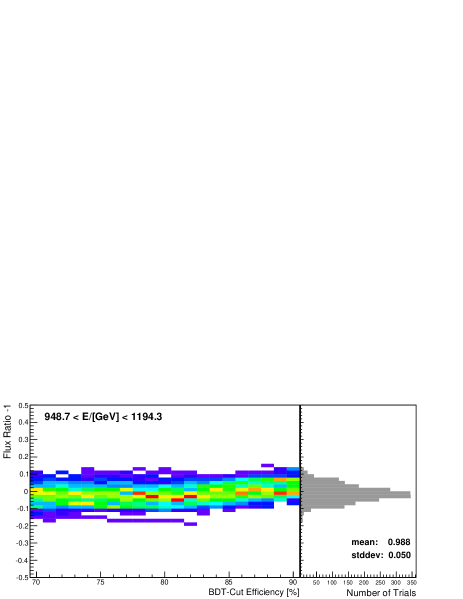
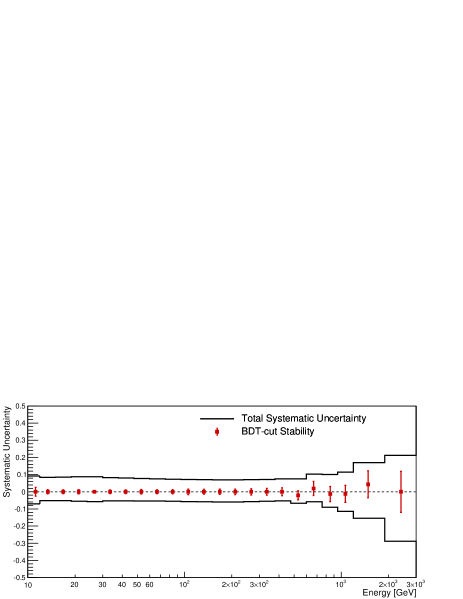
Electron identification is the most important source of systematics. To address the uncertainty in the BDT analysis, in particular, 100 simulated data sets with independent training were created and the stability of the resultant flux was checked in each energy bin by changing the electron efficiency from 70% to 90% in 1% steps for the test sample corresponding to each training set. An example for stability of the BDT analysis is shown in Fig. 5.
By combining all the energy bins, the results are presented in Fig. 5, where the average of all training samples with respect to the standard 80% efficiency case (specific training result) is presented by red squares, while error bars represent the standard deviation corresponding to the systematic uncertainty in the flux from the BDT analysis in each energy bin. We confirmed that our BDT analysis exhibits good stability with respect to training and cut efficiency. The difference between -estimator and BDT results is included in the systematic uncertainty of the electron identification SM- .
Based on the above investigations, the systematic uncertainty bands which consider all of the components (as the relative difference between the flux under study and the standard case flux) except for the energy scale uncertainty are shown as black lines in Fig. 5, with each contribution added quadratically. The various sources of systematic uncertainties have different contributions at various energies. In the present study, we surveyed all of the viable choices in event selection, reconstruction and MC models SM- ; Pacini et al. (2017); Kasahara (1995); Agostinelli et al. (2003), including those that are not optimal, and took account of all differences in the systematic uncertainty. Some important details of our systematic study are described in Ref. SM- . Systematic uncertainties will be significantly reduced as our analysis proceeds further and statistics increase, because most of the systematic uncertainties come from imperfect understanding of data.
V Electron + Positron Spectrum
The differential flux between energy and [GeV] with bin width [GeV] is given by the following formula:
where is expressed in [m-2sr-1sec-1GeV-1], is the number of electron candidates in the corresponding bin, is the number of background events estimated with MC protons, [m2sr] is the geometrical acceptance, is the detection efficiency for electrons defined as the product of trigger, preselection, track reconstruction and electron identification efficiencies, [sec] is the observational live time. While is basically energy independent, at lower energies it is reduced because we only use data taken below 6 GV cut-off rigidity. Based on the MC simulations, the total efficiency is very stable with energy up to 3 TeV: 73%2%.
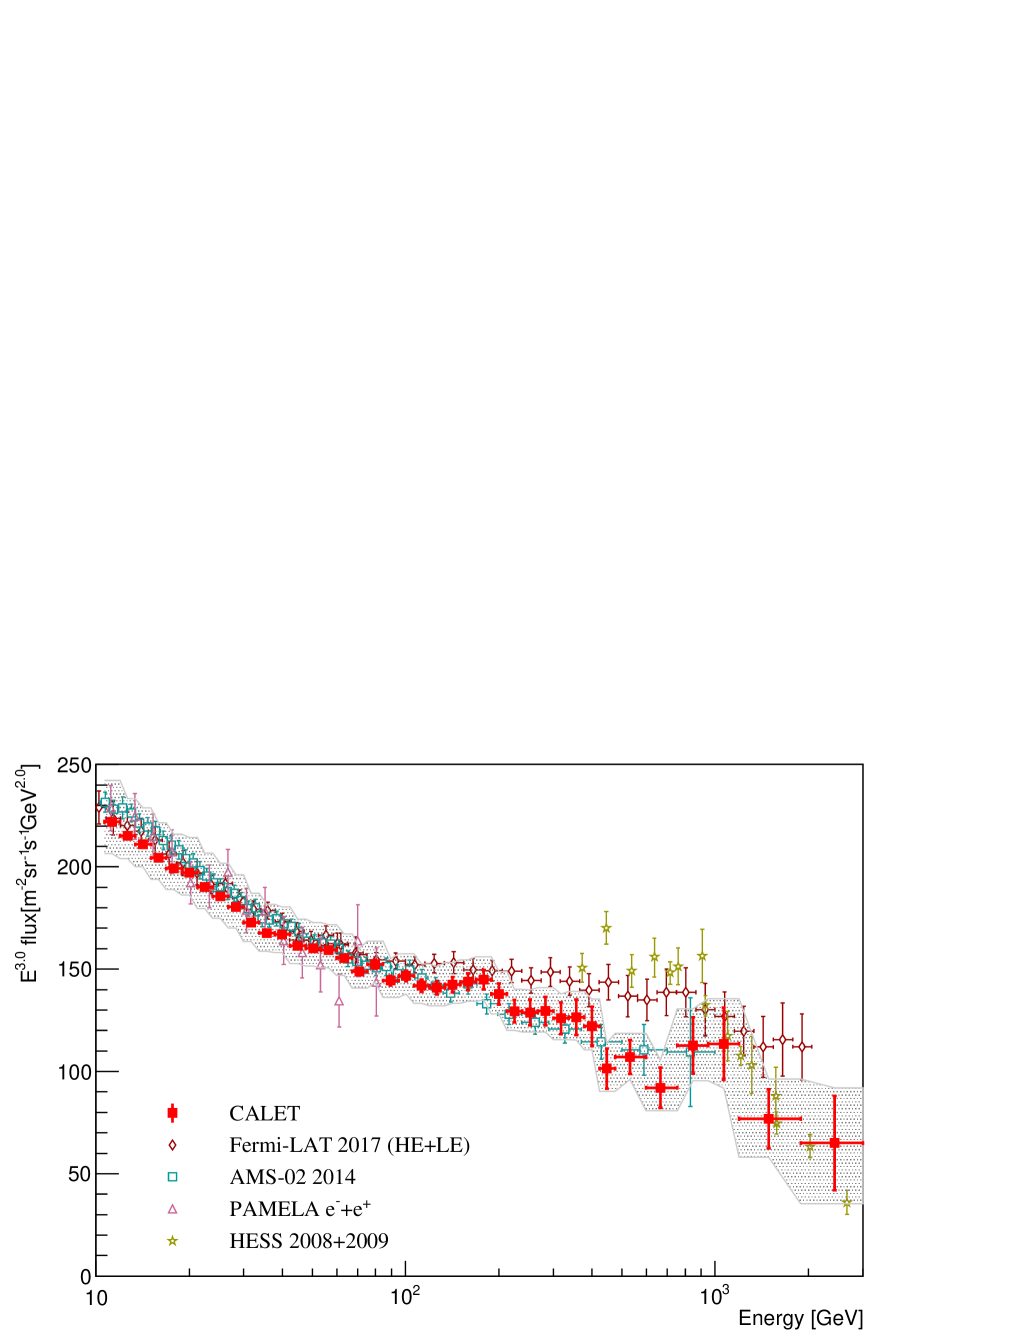
Figure 6 shows the all-electron spectrum measured with CALET in an energy range from 10 GeV to 3 TeV, where current systematic errors are shown as a gray band. The present analysis is limited to fully-contained events, and the acceptance is 570 cm2sr; only 55% of the full acceptance. Our present flux is fairly consistent with AMS-02 Accardo et al. (2014), although it is lower than the recent Fermi/LAT result Abdollahi et al. (2017) above a few hundred GeV. The spectrum could be fitted to a single-power of -3.1520.016 over 30 GeV, including the systematic uncertainties. The structures at the highest energies are within the (stat. + syst.) errors and therefore no conclusion can be drawn at the moment on their significance. Further development of the analysis and more statistics will allow this energy region to be investigated in detail.
VI Acknowledgements
We gratefully acknowledge JAXA’s contributions to the development of CALET and to the operations onboard the ISS. We also wish to express our sincere gratitude to ASI and NASA for their support of the CALET project. This work was supported in part by a JSPS Grant-in-Aid for Scientific Research (S) (no. 26220708) and by the MEXT-Supported Program for the Strategic Research Foundation at Private Universities (2011-2015) (No. S1101021) at Waseda University.
References
- Torii et al. (2015) S. Torii et al., in Proceeding of Science (ICRC2015) 581 (2015).
- Nishimura et al. (1980) J. Nishimura et al., Astrophys. J. 238, 394 (1980).
- Kobayashi et al. (2004) T. Kobayashi, Y. Komori, K. Yoshida, and J. Nishimura, Astrophys. J. 601, 340 (2004).
- Adriani et al. (2009) O. Adriani et al., Nature 458, 607 (2009).
- Accardo et al. (2014) L. Accardo et al., Phys. Rev. Lett. 113, 121101 (2014).
- (6) See Supplemental Material for more detailed information of CALET instrument, electron identification, and systematic uncertainty as well as tabulated all-electron flux, which includes Refs. Yamaoka et al. (2013); Marrocchesi et al. (2011, 2013, 2017); Akaike et al. (2017); Mori et al. (2013); Akaike et al. (2011, 2015); Palma et al. (2015); Femindez-Varea et al. (1993); Longo and Sestili (1975); Aguilar et al. (2015); Yoon et al. (2017) .
- Yamaoka et al. (2013) K. Yamaoka et al., in Proc. 7th Huntsville Gamma-Ray Burst Symposium, GRB 2013 (2013) p. 41.
- Marrocchesi et al. (2011) P. S. Marrocchesi et al., Nucl. Instrum. Methods Phys Res., Sect. A 659, 477 (2011).
- Marrocchesi et al. (2013) P. S. Marrocchesi et al., in Proc. of 33rd international cosmic ray conference (ICRC2013) 362 (2013).
- Marrocchesi et al. (2017) P. S. Marrocchesi et al., in Proceeding of Science (ICRC2017) 156 (2017).
- Akaike et al. (2017) Y. Akaike et al., in Proceedings of Science (ICRC2017) 181 (2017).
- Mori et al. (2013) M. Mori et al., in Proc. of 33rd international cosmic ray conference (ICRC2013) 248 (2013).
- Akaike et al. (2011) Y. Akaike et al., in Proceedings of the 32nd ICRC, Vol. 6 (2011) p. 371.
- Akaike et al. (2015) Y. Akaike et al., in Proceeding of Sciences (ICRC2015) 613 (2015).
- Palma et al. (2015) F. Palma et al., in Proceedings of Science (ICRC2015) 1196 (2015).
- Femindez-Varea et al. (1993) J. Femindez-Varea, R. Mayo, J. Bar, and F. Salvat, Nucl. Instrum. Methods B73, 447:473 (1993).
- Longo and Sestili (1975) E. Longo and I. Sestili, Nucl. Instrum. Methods 128, 283 (1975).
- Aguilar et al. (2015) M. Aguilar et al., Phys. Rev. Lett. 114, 171103 (2015).
- Yoon et al. (2017) Y. Yoon et al., Astrophys. J. 839, 5 (2017).
- Asaoka et al. (2015) Y. Asaoka et al., in Proceedings of Science (ICRC2015) 603 (2015).
- Kasahara (1995) K. Kasahara, in Proc. of 24th international cosmic ray conference (Rome, Italy), Vol. 1 (1995) p. 399.
- Asaoka et al. (2017) Y. Asaoka, Y. Akaike, Y. Komiya, R. Miyata, S. Torii, et al., Astroparticle Physics 91, 1 (2017).
- Akaike et al. (2013) Y. Akaike et al., in Proc. of 33rd international cosmic ray conference (ICRC2013) 726 (2013).
- Niita et al. (2015) T. Niita, S. Torii, Y. Akaike, Y. Asaoka, K. Kasahara, et al., Adv. Space Res. 55, 2500 (2015).
- (25) T. Tamura et al., to be published .
- Pacini et al. (2017) L. Pacini, Y. Akaike, et al., in Procceeding of Science (ICRC2017) 163 (2017).
- Hocker et al. (2007) A. Hocker et al., in Proc. Sci., ACAT2007 (2007) p. 040.
- Ackermann et al. (2012) M. Ackermann et al., Astroparticle Physics 35, 346 (2012).
- Smart and Shea (2005) D. F. Smart and M. A. Shea, Advances in Space Research 36, 2012 (2005).
- Honda et al. (2004) M. Honda, T. Kajita, K. Kasahara, and S. Midorikawa, Physical Review D 70, 043008 (2004).
- Thébault et al. (2015) E. Thébault et al., Earth, Planets and Space 67:79 (2015).
- Brogi et al. (2015) P. Brogi et al., in Proceeding of Science (ICRC2015) (2015) p. 595.
- Maestro et al. (2017) P. Maestro, N. Mori, et al., in Proceedings of Science (ICRC2017) 208 (2017).
- Agostinelli et al. (2003) S. Agostinelli et al., Nucl. Instrum. Methods Phys. Res. A506, 250 (2003).
- Aguilar et al. (2014) M. Aguilar et al., Phys. Rev. Lett. 113, 221102 (2014).
- Abdollahi et al. (2017) S. Abdollahi et al., Phys. Rev. D 95, 082007 (2017).
- Adriani et al. (2017) O. Adriani et al., La Rivista del Nuovo Cimento, to be published (2017).
- Aharonian et al. (2008) F. Aharonian et al., Phys. Rev. Lett. 101, 261104 (2008).
- Aharonian et al. (2009) F. Aharonian et al., Astron Astrophys. 508, 561 (2009).