A Streak Camera for Strong-Field Ionization
Abstract
Ionization of an atom or molecule by a strong laser field produces sub-optical cycle wave packets whose control has given rise to attosecond science. The final states of the wave packets depend on ionization and deflection by the laser field, which are convoluted in conventional experiments. Here, we demonstrate a technique enabling efficient electron deflection, separate from the field driving strong-field ionization. Using a mid-infrared deflection field permits one to distinguish electron wave packets generated at different field maxima of an intense few-cycle visible laser pulse. We utilize this capability to trace the scattering of low-energy electrons driven by the mid-infrared field. Our approach represents a general technique for studying and controlling strong-field ionization dynamics on the attosecond time scale.
In the attosecond streak camera an intense optical field is used to temporally resolve single photon ionization caused by an attosecond extreme ultra-violet pulse Itatani et al. (2002); Kienberger et al. (2004); Cavalieri et al. (2007); Sansone et al. (2010); Förg et al. (2016); Ossiander et al. (2016). The streaking concept has been applied to characterize electron wave packets and light fields primarily in the extreme ultraviolet, where single photon ionization prevails, e.g. Goulielmakis et al. (2004); Frühling et al. (2009); Schütte et al. (2011); Ardana-Lamas et al. (2016). However, an optical field can also time-resolve multiphoton or tunnel ionization. The ”attoclock” technique Eckle et al. (2008a) exploits the deflection of the photoelectron wavepacket in an intense elliptically polarized near-infrared pulse to address questions regarding time delays Eckle et al. (2008b); Pfeiffer et al. (2012) and non-adiabaticity Landsman and Keller (2015) in tunnel ionization. However, using the same optical frequency for ionization and streaking limits the versatility of this approach.
A relatively weak control field is sufficient to significantly manipulate strong-field interactions. For example, tunnel ionization at every or every second half cycle can be enhanced or suppressed using a third Watanabe et al. (1994) or second Schumacher et al. (1994) harmonic field with parallel polarization, respectively. Orthogonally polarized two-color pulses (e.g.,Zhang et al. (2014); Richter et al. (2015)), and elliptically polarized two-color pulses (e.g., Wu et al. (2013); Eckart et al. (2016); Mancuso et al. (2016)) open other avenues to manipulate strong-field interactions.
Here, we demonstrate STIER (Sub-cycle Tracing of Ionization Enabled by infra-Red), a streak camera that temporally resolves strong-field ionization caused by a linearly polarized few-cycle pulse. We employ STIER to demonstrate the imaging of individual ionization bursts, which occur at the field maxima of a few-cycle laser pulse. This provides insight into the sub-cycle dynamics of strong field ionization. We observe the emergence of an asymmetry in the yield of low-energy electrons associated with re-scattering Corkum (1993) in the ionic potential. Such low-energy rescattering has been linked to low-energy features in photoelectron spectra generated by mid-infrared laser fields Blaga et al. (2009); Wu et al. (2012); Wolter et al. (2015), to frustrated tunnel ionization Nubbemeyer et al. (2008), and stabilization of atoms against ionization in intense fields Eberly and Kulander (1993); Morales et al. (2011); Larimian et al. (2016). The latter leads to the production of highly-excited Rydberg atoms by the intense laser field Eichmann et al. (2009). With STIER we can trace and control the underlying processes.
STIER samples the photoelectrons produced by a few-cycle laser pulse in the near-visible spectral range, here 735 nm. The photoelectrons are streaked by a moderately intense, mid-infrared (IR) pulse at 2215 nm with stable carrier-envelope phase (CEP). The pulse duration of the visible pulse is significantly shorter than the period of the IR pulse, and much shorter than in recent streaking experiments on nanotips using Terahertz pulses Wimmer et al. (2014). The intensities of the light fields are chosen such that ionization only occurs in the presence of the visible pulse. Although the IR pulse does not ionize the target gas, it significantly deflects the generated photoelectrons because the quiver energy of a free electron in a laser field scales with the square of the laser wavelength. Our technique permits the usage of arbitrary polarization states for the two light fields. Here, we choose the polarization of both fields as linear and parallel to each other. Besides control over the deflection of photoelectrons, the parallel polarization also enables control over ionization.
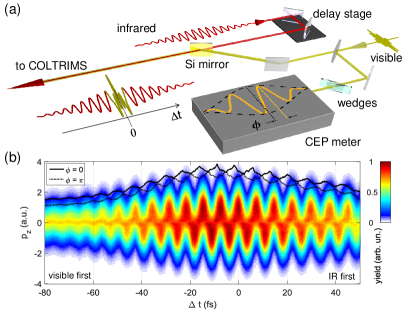
The experimental setup is sketched in Fig. 1. The output from a commercial amplified laser system (Coherent Legend Elite Cryo, 1.6 mJ, 800 nm, 10 kHz), is split in two parts to obtain CEP stable IR pulses from an optical parametric amplifier (Light Conversion TOPAS-Prime), and few-cycle visible pulses from an argon filled hollow-core fiber. The visible pulses are phase tagged using a stereographic above threshold ionization phase meter Paulus et al. (2003); Rathje et al. (2012). This yields the CEP of each laser pulse with an unknown but constant offset.
After recombination, the two-color pulses are sent to a cold target recoil ion momentum spectrometer (COLTRIMS) Ullrich et al. (2003) where they are focused into a neon gas jet. The three-dimensional momentum vectors of ions and electrons are recorded with COLTRIMS and correlated with the delay between IR and visible pulses, and with the CEP of the visible pulses.
The two-color laser field (see Figs. 1(a,b)) can be written as
| (1) |
where
| (2) | ||||
| (3) |
The intensity envelopes , and are characterized by a full width at half maximum of 5 fs for the visible, and 75 fs for the IR pulse. The frequencies correspond to the visible and IR wavelengths of 735 nm and 2215 nm, respectively.
Experimental results are compared to computational results obtained by solving the one-dimensional (1D) time-dependent Schrödinger equation (TDSE) for a 1D soft core Coulomb potential using the Fourier split-operator method. The initial ground state was found by complex time propagation. To limit the computational demand, the IR pulse is approximated as a monochromatic field with a duration of 4.25 cycles and 0 field strength at the beginning of the simulation. The peak intensities are and . Focal volume averaging for the visible pulse, including integration over the Gouy phase, is taken into account. Averaging over the Gouy phase of the IR pulse has the same effect as a jitter of the relative time delay between IR and VIS pulses. Based on the experimental data, we estimate the uncertainty in the time delay as .
Fig. 1(b) shows a STIER spectrogram recorded in Ne. The momentum distribution along the polarization axis exhibits strong delay-dependent oscillations with a period of 7.4 fs, corresponding to the optical period of 2220 nm light. The oscillation amplitude reaches a maximum of at the center of the IR pulse, which relates to an IR intensity of . The width of the momentum distribution in the absence of the IR field indicates an intensity of . The strong oscillations are evidence that ionization is essentially confined to a half-cycle of the IR field. Thus, the IR vector potential is imaged by the delay dependence of the observed momentum distributions.
In order to resolve the discrete ionization events in the few-cycle visible pulse, we now sort the STIER traces by CEP. This fixes the phase of the visible pulse to the phase of the IR field. The black lines in 1(b) show how the IR field modulates the ionization probability for two different CEP values of the visible pulse. Changing the CEP by turns a yield maximum into a yield minimum.
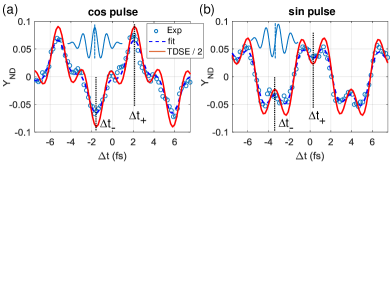
In Fig. 2 the IR-induced modulation of the ionization yield is analyzed in detail for two waveforms, corresponding to cosine (, ) or sine () pulses. We introduce the normalized difference of the ionization yield as
| (4) |
The symmetry operation corresponds to inversion of the visible field direction at every point in time, while the direction of the IR field is unchanged. Hence, through definition, reveals the influence of the IR field on the ionization yield.
The data exhibit clear oscillations with two different frequencies. This demonstrates that the ionization probabilities at different field maxima are modulated by the IR streaking field. For cosine pulses (Fig. 2(a)) a single maximum and minimum per IR period exists. For sine pulses (Fig. 2(b)), maximum and minimum yields are obtained at two different time delays per IR period. This can be readily understood by considering that the field strength reaches its maximum value only once during a cosine pulse but twice during a sine pulse. The fast oscillations are not as pronounced in the experimental data, which we attribute to the timing uncertainty of visible and IR pulses.
The measured values for are fitted with (dashed lines Figs 4(a,b))
| (5) | ||||
| (6) |
The fitted optical periods are and , corresponding to laser wavelengths 735 nm, and 2215 nm, respectively. The absolute CEP of the visible pulse is given by , which yields the unknown constant offset in the CEP measured by the CEP meter. Moreover, the absolute time delay (up to a multiple of the IR period) is given by . The knowledge of CEP and delay enables the accurate comparison of experimental and calculated data.
The IR field controls the ionization probability at the field maxima of the visible pulse, separated by 1.2 fs each. During this time, the IR field and its vector potential significantly vary. Therefore, the wave packets generated at different field maxima are deflected to different final momenta. In the STIER traces for fixed CEP values, shown in Fig. 3, we analyze how the IR field controls both ionization and deflection of the generated photoelectrons.
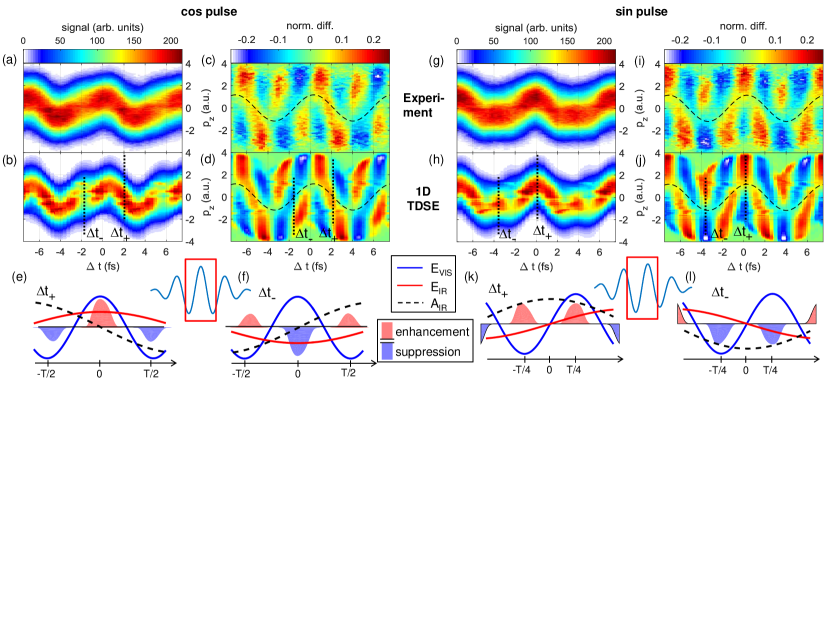
The measured signal for cosine (Fig. 3(a)) and sine (Fig. 3(g)) pulses have distinct shapes. Although some features observed in the calculated signals (Fig. 3(b,h)) are not visible in the experimental data, the characteristics at the yield minima () and yield maxima () can be clearly distinguished. However, the individual ionization bursts throughout the pulse are not visible.
To improve the visibility of the differences in the STIER spectrograms for different CEPs, difference spectrograms are calculated analogously to equation 4 and displayed in Figs 3(c,d,i,j). The normalized difference reveals distinct patterns that depend on the CEP and vary on a sub-femtosecond timescale. The experimentally observed patterns agree qualitatively very well with those in the computational results.
In the following, we show that the difference spectrograms image the IR-induced modulation of the ionization probability at different half-cycles of the visible pulse. As discussed for Fig. 2, the normalized difference reveals the influence of the IR field on the ionization probability. Furthermore, wave packets generated at different field maxima of the few-cycle visible pulse are shifted in momentum by the IR vector potential. In particular, the momentum shift for wave packets created at the center of the visible pulse, i.e., at , is given by the IR vector potential , which is drawn as a dashed line in Figs 3(c,d,i,j).
In Fig. 3(e), the most relevant parts of the visible and IR fields are drawn for a cosine pulse at . In this case, the field maxima of visible and IR coincide and the combined fields lead to an ionization enhancement at (indicated by the red shaded area). Ionization at the field extrema at ( being the visible optical period), on the other hand, is suppressed (indicated by the blue shaded area). This is reflected by the corresponding difference spectrograms Fig. 3(c,d), where a maximum is observed at , and minima are observed for smaller and larger momenta. The situation is reversed at (see Fig. 3(f)), where the ionization at is suppressed, and ionization at is enhanced. This leads to the positive off-center signals around in Figs 3(c,d). Similar analyses can be performed for the sine pulse, as illustrated in Figs 3(k,l). For the fields depicted here, the IR vector potential peaks at , such that the wave packets generated at acquire the same streaking momentum, and cannot be distinguished.
In Fig. 3, we have shown that STIER permits us to separate the electron wave packets generated at different half-cycle maxima of the visible pulse. The best separation occurs when the visible pulse is centered around a field maximum of the IR pulse, i.e. when the signal in the STIER trace is centered around . In this case, the observed momentum distribution directly reflects the ionization dynamics during a single half-cycle. In particular, one half of the momentum spectrum along the laser polarization corresponds to direct electrons that drift in the same direction as they tunnel out of the atom. The other half corresponds to rescattered electrons that turn around after tunneling.
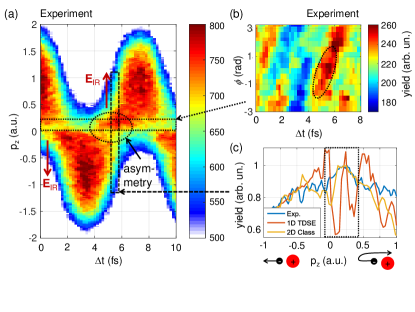
In Fig. 4, we concentrate on the low-energy electrons in the STIER trace, where an asymmetry feature appears for certain delay values. The feature covers positive (negative) momenta for delay values at which the IR field points up (down), see Fig. 4(a). The low-energy yield also depends on the CEP of the visible pulse (Fig. 4(b)). For CEP values at which the strongest half-cycle of the visible field points into the same direction as the IR field, the asymmetry is maximized. Hence, the tunneling direction is opposite to the final momentum of the enhanced low-energy electrons, implying that these electrons are due to a rescattering effect.
As shown in Fig. 4 (c), the 1D TDSE result agrees well with the experimental data for negative momenta, corresponding to direct electron emission. For rescattered electrons, which acquire positive final momenta, however, experiment and 1D TDSE strongly deviate. Most evidently, the pronounced modulations near the maximum measured at are not observed experimentally. However, recollision effects are not correctly captured in one dimension.
A 2D classical trajectory Monte-Carlo simulation yields much better agreement with the experimental data around . Based on this model, we can attribute the asymmetry feature to multiple rescattering in the IR field after ionization at a suitable time. While the IR field is present, electrons oscillate in the vicinity of the ion. After the IR field is turned off, the electrons drift into the direction opposite to the one they tunneled out of the atom. Certain trajectories do not acquire significant kinetic energy at the end of the pulse and remain bound in the ionic potential, leading to the minimum at . Rescattering in the visible field leads to larger momenta.
The present low-energy asymmetry feature and excitation phenomena in strong fields Nubbemeyer et al. (2008); Eichmann et al. (2009) result from the rescattering of low-energy electrons. Only electrons born with zero energy at times , where , can revisit the core. Using STIER, the time delay controls whether or not such electrons are generated and thereby controls low-energy recollisions and the resulting phenomena.
We have shown that STIER enables sub-femtosecond time resolution utilizing strong-field ionization by linearly polarized few-cycle pulses. In particular, one may tag a detected electron by the time of the half-cycle when it was emitted. The possibility to distinguish adjacent half-cycles where the electric field points into opposite direction makes the technique ideal to probe ionization from anisotropic targets such as oriented molecules.
The introduced approach is general as it does not require specific laser wavelengths and permits different polarization geometries. The case of parallel polarization discussed here enables control over both ionization and deflection. In the case of perpendicular polarization of the two pulses, the influence of both fields is separated into perpendicular directions. The electron momentum distribution in the polarization plane will provide access to the temporal momentum distribution of strong-field produced wave packets. Similar to the attoclock technique, the photoelectron momentum distribution can be spread out over a section of a torus when the IR field is (near-)circularly polarized. STIER allows for a new pump-probe scheme when a second visible few-cycle pulse driving ionization is added. This scheme will be useful for the tracing of electronic wave packets as the IR streaking can be exploited to separate the signals from the two few-cycle pulses in momentum space.
STIER can be applied to a variety of strong-field phenomena, such as double ionization and channel-resolved ionization in molecules. Moreover, the asymmetric fields used in STIER can be utilized to coherently controlling photochemical reactions.
Acknowledgements.
We thank D. Crane and B. Avery for technical support. We are grateful to A. Czasch for his help with the data acquisition. This project has received funding from the EU’s Horizon2020 research and innovation programme under the Marie Sklodowska-Curie Grant Agreement No. 657544. Financial support from the National Science and Engineering Research Council Discovery Grant No. 419092-2013-RGPIN is gratefully acknowledged. We acknowledge support by the German Research Foundation through the cluster of excellence ”Munich Center for Advanced Photonics”.References
- Itatani et al. (2002) J. Itatani, F. Quéré, G. L. Yudin, M. Y. Ivanov, F. Krausz, and P. B. Corkum, Phys. Rev. Lett. 88, 173903 (2002).
- Kienberger et al. (2004) R. Kienberger, E. Goulielmakis, M. Uiberacker, A. Baltuška, V. Yakovlev, F. Bammer, A. Scrinzi, T. Westerwalbesloh, U. Kleineberg, U. Heinzmann, M. Drescher, and F. Krausz, Nature 427, 817 (2004).
- Cavalieri et al. (2007) A. L. Cavalieri, N. Müller, T. Uphues, V. S. Yakovlev, A. Baltuska, B. Horvath, B. Schmidt, L. Blümel, R. Holzwarth, S. Hendel, M. Drescher, U. Kleineberg, P. M. Echenique, R. Kienberger, F. Krausz, and U. Heinzmann, Nature 449, 1029 (2007).
- Sansone et al. (2010) G. Sansone, F. Kelkensberg, J. F. Pérez-Torres, F. Morales, M. F. Kling, W. Siu, O. Ghafur, P. Johnsson, M. Swoboda, E. Benedetti, F. Ferrari, F. Lépine, J. L. Sanz-Vicario, S. Zherebtsov, I. Znakovskaya, A. L’huillier, M. Y. Ivanov, M. Nisoli, F. Martín, and M. J. J. Vrakking, Nature 465, 763 (2010).
- Förg et al. (2016) B. Förg, J. Schötz, F. Süßmann, M. Förster, M. Krüger, B. Ahn, W. A. Okell, K. Wintersperger, S. Zherebtsov, A. Guggenmos, V. Pervak, A. Kessel, S. A. Trushin, A. M. Azzeer, M. I. Stockman, D. Kim, F. Krausz, P. Hommelhoff, and M. F. Kling, Nat. Commun. 7, 11717 (2016).
- Ossiander et al. (2016) M. Ossiander, F. Siegrist, V. Shirvanyan, R. Pazourek, A. Sommer, T. Latka, A. Guggenmos, S. Nagele, J. Feist, J. Burgdörfer, R. Kienberger, and M. Schultze, Nature Physics 13, 280 (2016), 0803.0582 .
- Goulielmakis et al. (2004) E. Goulielmakis, M. Uiberacker, R. Kienberger, A. Baltuska, V. Yakovlev, A. Scrinzi, T. Westerwalbesloh, U. Kleineberg, U. Heinzmann, M. Drescher, and F. Krausz, Science 305, 1267 (2004).
- Frühling et al. (2009) U. Frühling, M. Wieland, M. Gensch, T. Gebert, B. Schutte, M. Krikunova, R. Kalms, F. Budzyn, O. Grimm, J. Rossbach, E. Plonjes, and M. Drescher, Nat Phot. 3, 523 (2009).
- Schütte et al. (2011) B. Schütte, U. Frühling, M. Wieland, A. Azima, and M. Drescher, Opt. Express 19, 18833 (2011).
- Ardana-Lamas et al. (2016) F. Ardana-Lamas, C. Erny, A. G. Stepanov, I. Gorgisyan, P. Juranić, R. Abela, and C. P. Hauri, Phys. Rev. A 93, 043838 (2016).
- Eckle et al. (2008a) P. Eckle, M. Smolarski, P. Schlup, J. Biegert, A. Staudte, M. Schöffler, H. G. Muller, R. Dörner, and U. Keller, Nat. Phys. 4, 565 (2008a).
- Eckle et al. (2008b) P. Eckle, A. N. Pfeiffer, C. Cirelli, A. Staudte, R. Dörner, H. G. Muller, M. Büttiker, and U. Keller, Science (New York, N.Y.) 322, 1525 (2008b).
- Pfeiffer et al. (2012) A. N. Pfeiffer, C. Cirelli, A. S. Landsman, M. Smolarski, D. Dimitrovski, L. B. Madsen, and U. Keller, Phys. Rev. Lett. 109, 083002 (2012).
- Landsman and Keller (2015) A. S. Landsman and U. Keller, Physics Reports 547, 1 (2015).
- Watanabe et al. (1994) S. Watanabe, K. Kondo, Y. Nabekawa, A. Sagisaka, and Y. Kobayashi, Phys. Rev. Lett. 73, 2692 (1994).
- Schumacher et al. (1994) D. W. Schumacher, F. Weihe, H. G. Muller, and P. H. Bucksbaum, Phys. Rev. Lett. 73, 1344 (1994).
- Zhang et al. (2014) L. Zhang, X. Xie, S. Roither, Y. Zhou, P. Lu, D. Kartashov, M. Schöffler, D. Shafir, P. B. Corkum, A. Baltuška, A. Staudte, and M. Kitzler, Phys. Rev. Lett. 112, 193002 (2014).
- Richter et al. (2015) M. Richter, M. Kunitski, M. Schöffler, T. Jahnke, L. P. H. Schmidt, M. Li, Y. Liu, and R. Dörner, Phys. Rev. Lett. 114, 143001 (2015).
- Wu et al. (2013) J. Wu, A. Vredenborg, L. P. H. Schmidt, T. Jahnke, A. Czasch, and R. Dörner, Phys. Rev. A 87, 023406 (2013).
- Eckart et al. (2016) S. Eckart, M. Richter, M. Kunitski, A. Hartung, J. Rist, K. Henrichs, N. Schlott, H. Kang, T. Bauer, H. Sann, L. P. H. Schmidt, M. Schöffler, T. Jahnke, and R. Dörner, Phys. Rev. Lett. 117, 133202 (2016).
- Mancuso et al. (2016) C. A. Mancuso, K. M. Dorney, D. D. Hickstein, J. L. Chaloupka, J. L. Ellis, F. J. Dollar, R. Knut, P. Grychtol, D. Zusin, C. Gentry, M. Gopalakrishnan, H. C. Kapteyn, and M. M. Murnane, Phys. Rev. Lett. 117, 133201 (2016).
- Corkum (1993) P. B. Corkum, Phys. Rev. Lett. 71, 1994 (1993).
- Blaga et al. (2009) C. I. Blaga, F. Catoire, P. Colosimo, G. G. Paulus, H. G. Muller, P. Agostini, and L. F. DiMauro, Nat. Phys. 5, 335 (2009).
- Wu et al. (2012) C. Y. Wu, Y. D. Yang, Y. Q. Liu, Q. H. Gong, M. Y. Wu, X. Liu, X. L. Hao, W. D. Li, X. T. He, and J. Chen, Phys. Rev. Lett. 109, 043001 (2012).
- Wolter et al. (2015) B. Wolter, M. G. Pullen, M. Baudisch, M. Sclafani, M. Hemmer, A. Senftleben, C. D. Schröter, J. Ullrich, R. Moshammer, and J. Biegert, Phys. Rev. X 5, 021034 (2015).
- Nubbemeyer et al. (2008) T. Nubbemeyer, K. Gorling, A. Saenz, U. Eichmann, and W. Sandner, Phys. Rev. Lett. 101, 233001 (2008).
- Eberly and Kulander (1993) J. H. Eberly and K. C. Kulander, Science 262, 1229 (1993).
- Morales et al. (2011) F. Morales, M. Richter, S. Patchkovskii, and O. Smirnova, Proc. Natl. Acad. Sci. U.S.A. 108, 16906 (2011).
- Larimian et al. (2016) S. Larimian, S. Erattupuzha, C. Lemell, S. Yoshida, S. Nagele, R. Maurer, A. Baltuška, J. Burgdörfer, M. Kitzler, and X. Xie, Phys. Rev. A 94, 033401 (2016).
- Eichmann et al. (2009) U. Eichmann, T. Nubbemeyer, H. Rottke, and W. Sandner, Nature 461, 1261 (2009).
- Wimmer et al. (2014) L. Wimmer, G. Herink, D. R. Solli, S. V. Yalunin, K. E. Echternkamp, and C. Ropers, Nat Phys 10, 432 (2014).
- Paulus et al. (2003) G. G. Paulus, F. Lindner, H. Walther, A. Baltuška, E. Goulielmakis, M. Lezius, and F. Krausz, Phys. Rev. Lett. 91, 253004 (2003).
- Rathje et al. (2012) T. Rathje, N. G. Johnson, M. Möller, F. Süßmann, D. Adolph, M. Kübel, R. Kienberger, M. F. Kling, G. G. Paulus, and A. M. Sayler, J. Phys. B At. Mol. Opt. Phys. 45, 074003 (2012).
- Ullrich et al. (2003) J. Ullrich, R. Moshammer, A. Dorn, R. Dörner, L. P. H. Schmidt, and H. Schmidt-Böcking, Reports Prog. Phys. 66, 1463 (2003).
- Tong and Lin (2005) X. M. Tong and C. D. Lin, J. Phys. B At. Mol. Opt. Phys. 38, 2593 (2005).