Evershed and counter-Evershed flows in sunspot MHD simulations
Abstract
There have been a few reports in the literature of counter-Evershed flows observed in well developed sunspot penumbrae, i.e. flows directed towards the umbra along penumbral filaments. Here we investigate the driving forces of such counter-Evershed flows in a radiative magnetohydrodynamic simulation of a sunspot and compare them with the forces acting on the normal Evershed flow. The simulation covers a timespan of 100 solar hours and generates an Evershed outflow exceeding km s-1 in the penumbra along radially aligned filaments where the magnetic field is almost horizontal. Additionally, the simulation produces a fast counter-Evershed flow (i.e., an inflow near ) in some regions within the penumbra, reaching peak flow speeds of 12 km s-1. The counter-Evershed flows are transient and typically last a few hours before they turn into outflows again. By using the kinetic energy equation and evaluating its various terms in the simulation box, we found that the Evershed flow occurs due to overturning convection in a strongly inclined magnetic field while the counter-Evershed flows can be well described as siphon flows.
1 Introduction
The origin of large-scale flows in the penumbra of sunspots is of particular interest in observational and theoretical studies of sunspots. The most prominent flow in photospheric penumbrae is the Evershed flow (EF; Evershed, 1909), an almost horizontal and radially outward directed flow of plasma with speeds in the kilometers per second range (typical spatially averaged speeds being km s-1). The nearly horizontal flow is usually subsonic, although supersonic flows have been observed (e.g., Wiehr, 1995; del Toro Iniesta et al., 2001; Bellot Rubio et al., 2004; Borrero et al., 2005). The physical mechanism responsible for driving the EF is closely connected to the fine structure of the penumbra, which is manifested through the penumbral intensity, magnetic field and velocity structure (see, e.g., detailed reviews by Solanki, 2003; Thomas & Weiss, 2004, 2008; Borrero, 2009; Scharmer, 2009; Schlichenmaier, 2009; Tritschler, 2009; Bellot Rubio, 2010; Borrero & Ichimoto, 2011; Rempel & Schlichenmaier, 2011). All these quantities display an almost radial filamentary structure in the penumbra. In particular, the magnetic field configuration comprises two major components, one containing generally stronger and more vertical fields (so-called spines) which is thought to be the result of a protrusion of the umbral field into the penumbra (see, e.g., review by Borrero & Ichimoto, 2011), and the second one being composed by weaker and more inclined fields (intra-spines, hereafter referred to as filaments) where the EF takes place (see, e.g., Tiwari et al., 2013). This configuration has been referred to as uncombed penumbra (Solanki & Montavon, 1993) or interlocking-comb structure (Thomas & Weiss, 1992).
Several models have been proposed to explain the filamentary nature of the penumbra, e.g., Danielson (1961); Meyer & Schmidt (1968); Choudhuri (1986); Solanki & Montavon (1993); Schlichenmaier et al. (1998a, b); Thomas et al. (2002); Spruit & Scharmer (2006); Scharmer & Spruit (2006). However, not all the models contain a self-consistent description of the EF. Some models based on stationary magnetic flux tubes representing the filaments, describe the EF as a siphon flow driven by a gas pressure difference between the footpoints of the flux tube (e.g., Thomas & Montesinos, 1993). On the other hand, the dynamic magnetic flux tube model presented by Schlichenmaier et al. (1998a) produces an EF as a combination of hot plasma rising at the inner footpoint of the tube and a radial acceleration driven by a pressure gradient, consequence of radiative losses at the surface. There is also the model of Scharmer & Spruit (2006) that says that the EF takes place in field-free intrusions. More recently, numerical magnetohydrodynamics (MHD) simulations have succeeded in reproducing the EF as a result of overturning convection in the presence of an inclined magnetic field (e.g., Heinemann et al., 2007; Scharmer et al., 2008; Rempel et al., 2009a, b; Kitiashvili et al., 2009; Rempel, 2011, 2012). The EF is in these cases interpreted as the convective flow component in the direction of the magnetic field. In these models, the penumbral fine structure results from anisotropic magneto-convection.
During the early stages of penumbrae formation, line-of-sight (LOS) velocities of opposite sign with respect to that displayed by the typical EF have been reported by Schlichenmaier et al. (2012) and Romano et al. (2014). This has been interpreted as inflows towards the pore before the formation of the penumbra. On rare occasions, well-developed penumbrae can also harbor counter-EF (inflows) at the photosphere (Kleint & Sainz Dalda, 2013; Louis et al., 2014; Siu-Tapia et al., 2017). In particular, Siu-Tapia et al. (2017) reported the observation of a prominent counter-EF with a lifetime of 2 days in the disk center-side of a well-developed penumbra. The counter-EF showed considerable fine structure, i.e., the counter-EF was confined along "reversed" penumbral filaments, with their heads/sources located at the outer penumbral boundary and their tails/sinks observed at the inner penumbral edge. Siu-Tapia et al. (2017) showed that, as in the normal-EF, the filaments carrying the counter-EF display temperature and magnetic field gradients that are both consistent with the direction of the flow, being compatible with both the magneto-convective driver scenario as well as the siphon flow mechanism.
In this work, we analyze the results of a MHD high-resolution sunspot simulation by Rempel (2015), which produces a penumbra with normal-EF (outflows) as well as a fast counter-EF (inflows) in some parts of the penumbra at photospheric heights, with lifetimes of several hours. We investigate and identify the driving forces acting on both, the normal- and the counter-EF.
2 Simulation
We use the 3D high-resolution sunspot simulation setup described in detail by Rempel (2015) and used therein to study the role of the penumbra and associated flows for sunspot decay. The simulation is based on the MURaM radiative MHD code (Vögler et al., 2005; Rempel et al., 2009b; Rempel, 2014) and covers a timespan of 100 solar hours. An animation covering 25 hr (from to 75 hr after the initialization of the simulation) is provided as part of the online material of Rempel (2015).
As described in Rempel (2015), the sunspot setup used open boundary conditions that do not maintain the initial field structure against decay driven by convective motions. The simulation initial state was a relaxed small scale dynamo, the sunspot simulation was then initialized by inserting an axisymmetric self-similar magnetic field structure into the domain with total initial flux of Mx, a field strength at the bottom of the domain of around 20 kG and at the top of the domain of around 3 kG. The simulated sunspot had an almost constant magnetic flux for the simulated timespan of 100 hours and used a magnetic top boundary condition that imposes a sufficiently horizontal field to maintain a penumbra.
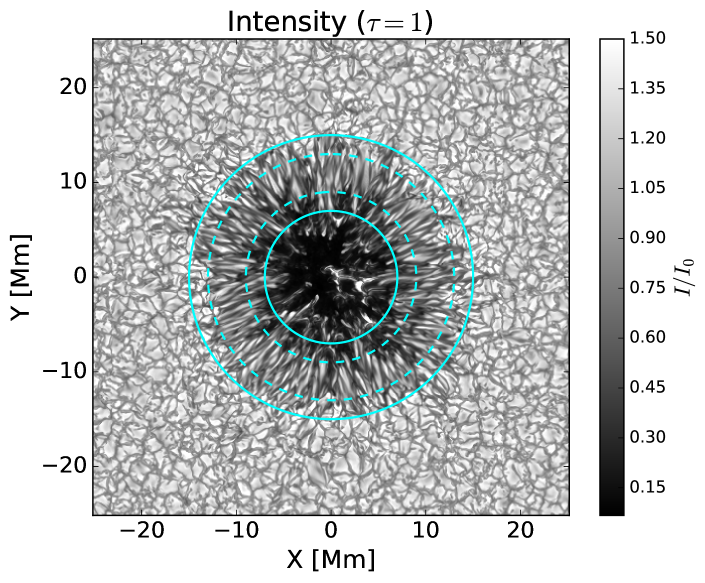
After hours, the simulated sunspot showed well-developed penumbral fine structure (see, e.g., Figure 1 for an intensity image obtained about 67 solar hours after initialization of the simulation), i.e., radially aligned filaments with close to horizontal field (see Figure 2). Along these filaments, there are fast radial outflows reaching peak flow velocities of km s-1. In addition to these outflow regions, there are also some patches in the penumbra that have a counter-EF (inflows in the photosphere). These regions are transient, lasting a few hours before they turn into outflows again.
To investigate the nature of the counter-EF, we analyze the simulation time-steps from 60 to 70 solar hours (The range of time during which the counter-EF are found in the simulations). As described in Rempel (2015), the photosphere is located about 700 km beneath the top boundary, and the simulation domain extends about 18 Mm in depth below the photosphere and 98 Mm horizontally, using a grid spacing of 24 km vertically and 48 km horizontally, which is required to capture penumbral fine structure and the Evershed flow. The simulation ran on a -grid (in the following presentation the -direction is vertical). Full resolution data cubes were written every 4500 seconds, whereas data cubes at half the spatial resolution were written every 900 seconds. A non-gray run was restarted from one of the full resolution cubes and evolved for 5000 time steps, i.e. 1125 seconds. All of the snapshots have improved numerics to address the drift problem described in Rempel (2015), related to numerical diffusion and need for cleaning.
A full-spatial-resolution snapshot obtained with non-gray radiative transfer ( solar hours) is used in this work to study the filamentary structure of the normal- and the counter-EF. The half-resolution data cubes obtained with gray radiative transfer are employed to analyze the driving of the flows in the penumbra and their evolution in time.
3 Results
3.1 Filamentary structure of the penumbra
Figure 1 shows the normalized intensity of the simulated sunspot at for a snapshot at solar hours. Here we are mainly interested in the penumbra, which appears to have a uniform filamentary structure in intensity at .
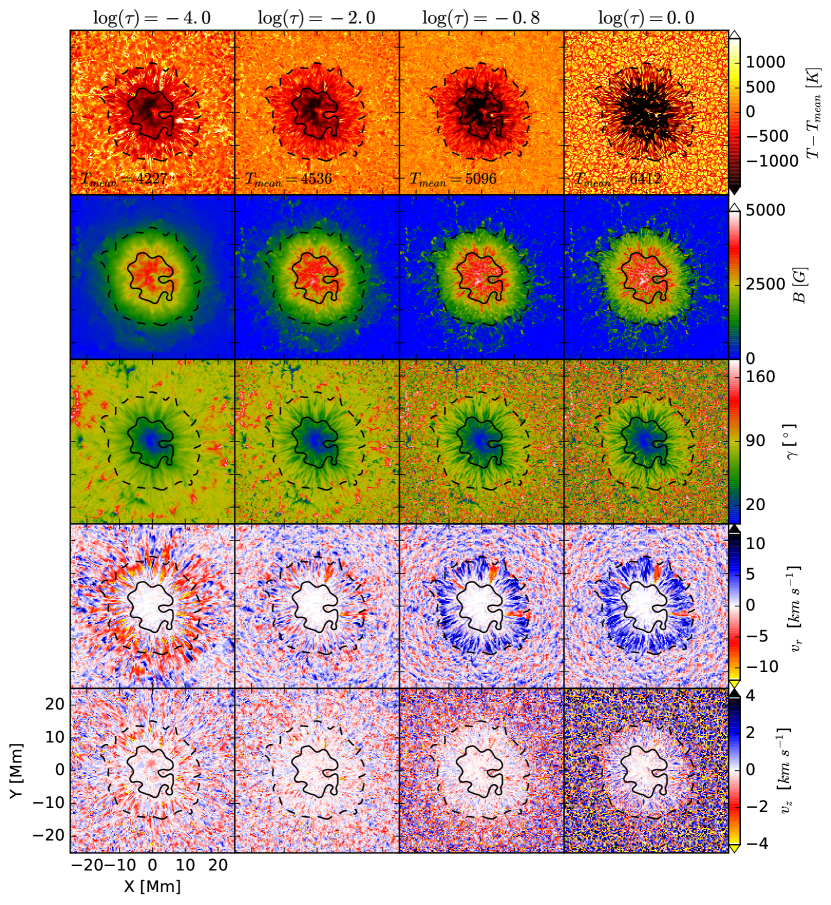
Figure 2 displays the filamentary fine structure of the penumbra as seen in the different physical quantities and at different optical depths: and . The filamentary structure of the penumbra is more evident at , where the penumbral filaments appear as bright (hot) elongated channels with magnetic fields that become more inclined from the inner penumbral edge outwards, and return back to the interior () towards the outer penumbral edge. Also, the velocity vector in the penumbral filaments is mostly radial.
The radial velocity maps in Figure 2 (fourth row) show that the penumbra is dominated by an inflow with respect to the center of the spot (red-to-yellow colors) at , which resembles the chromospheric inverse Evershed flow (IEF) (Dialetis et al., 1985) but occurs at lower heights, and by an outflow below (blue-to-black colors), which represents the photospheric normal-EF. However, there are also some regions within the penumbra at , and where the radial velocity is negative, indicating photospheric counter-EF. These photospheric inflows occur along penumbral filaments. Their associated vertical velocity shows large negative values (downflows) close to the inner penumbral boundary, at the end of these inflow filaments.
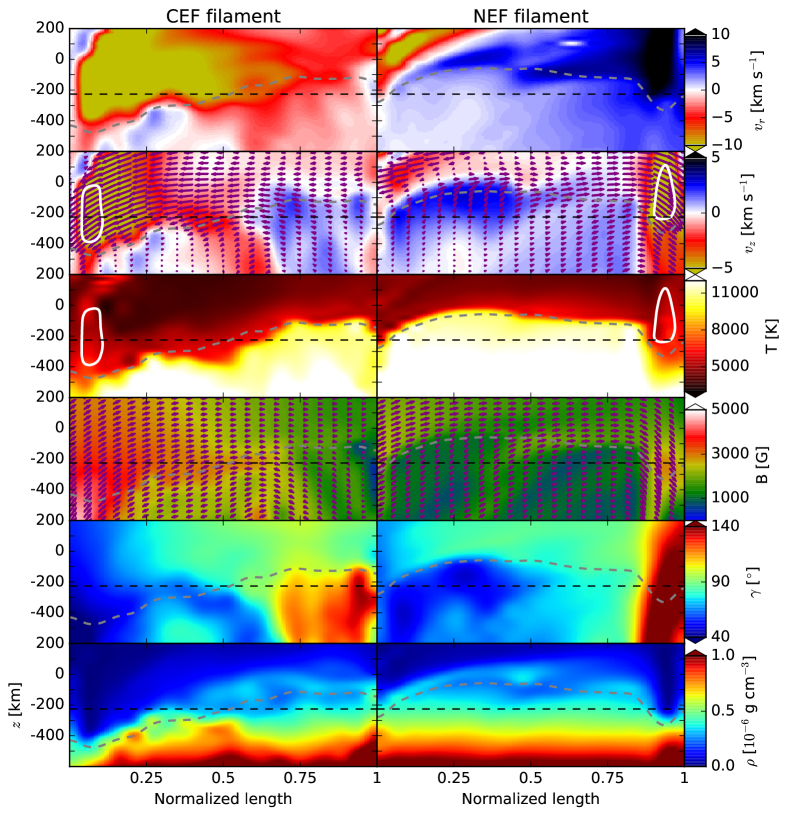
In order to get insight into the physical differences between the regions harboring the counter-EF (CEF) and the regions with the normal-EF (NEF), in Figure 3 we compare the characteristics of the gas and the magnetic field along the central axes of two radial flow channels which carry a CEF and a NEF, respectively. Figure 3 shows a vertical cross section along the normalized central axes of the two selected penumbral filaments, a CEF-carrying filament (left panels) and a NEF-carrying filament (right panels), from km to 200 km above the surface (which is defined as the average height of the level in the quiet Sun). The selected individual filaments are representative of each filament type (CEF-carrying and NEF-carrying, respectively) since most of the qualitative physical characteristics discussed below are true for most of the filaments in this snapshot.
The velocity panels in Figure 3 show the sources of the NEF, i.e. the portion of the filament on the right panels that harbors both upflows () and outflows (), spanning around of the filament’s normalized length, while the sinks (regions where and ) are observed towards the outermost of the filament’s length. In contrast, the sources of the CEF (regions where and on the left panels) are located in the outer endpoint of the filament (i.e., in the endpoint closer to the quiet Sun) from to 1 in the normalized length scale, while their sinks (regions where and ) dominate mainly within the innermost of the filament. Therefore, unlike the CEF-carrying filament, almost the entire NEF-carrying filament behaves as a source of flow.
Nonetheless, there are also some similarities. In both the CEF and NEF flow channels, the upflows harbor hot gas ( K) and are associated with relatively weak magnetic fields. The magnetic field in the upflow cells becomes more inclined with height and is aligned with the direction of the flows (see arrows on and panels in Figure 3). Furthermore, in both the NEF and CEF, the gas flows are supersonic in the sink regions and exhibit lower temperatures than at their sources ( K). The downflowing gas at the sink regions is slightly warmer than in its surroundings, and the downflow speeds are generally supersonic at these locations, dropping rapidly with depth from supersonic to subsonic. These properties suggest that for both the NEF and CEF, the deceleration takes place in the form of shocks.
Compared to the field strength at the source regions ( G) in both, CEF and NEF, the magnetic field presents a strengthening at the sink regions ( G), where it gradually becomes more vertical in the flow direction. Furthermore, in both NEF and CEF, the magnetic field polarity in the sink regions is opposite to that at their corresponding sources. Because in Figure 3 we concentrate on the central axes of the filaments, we see only the ‘end of filament’ sinks. Nonetheless, most of the overturning mass flux goes to the lateral sinks, so the end of filament sinks represent only a part of the picture since a significant fraction () of the returning mass flux is found in regions with still upward pointing field when the lateral sinks are included.
Dashed gray lines in Figure 3 indicate the variation in height of the levels along the two flow channels with respect to the reference penumbral average height km (horizontal black dashed lines) . Such constant optical depth levels are depressed in the downflowing part of the filaments and are elevated in the upflowing part of the filaments. The depression of the constant optical depth surfaces in the sink regions are caused by lower temperatures and densities of the downflowing gas compared to the upflowing gas. This is an important aspect to consider in observational studies of penumbral filaments, in which the dynamics of the flows and the magnetic field structure are only accessible at constant optical depth surfaces, see also discussion in van Noort et al. (2013). In this simulation, the magnetic field strength suffers a large enhancement in the downflowing part of the filaments (sinks) along the level, taking values of up to kG in the CEF filament, and kG in the NEF-carrying filament. For the CEF filaments, such a very large strengthening of the field is partly the result of the strong depression of the level at the sinks and their close vicinity to the umbral field (note that the CEF sinks are mainly located close to the umbral boundary). The strengthening of the field at the sinks of the CEF filaments at constant geometrical height also contributes (as can be seen in the left column of Figure 3). Moreover, the sinks of the NEF filaments also present a field intensification near the level. Such local field strengthening might be produced by the supersonic downdrafts of magnetized flux concentrations at the sink regions as suggested by van Noort et al. (2013) for explaining the observation of field strengths of the order of 7 kG in supersonic downflow regions at the outer penumbra of a sunspot.
3.2 Driving forces of the penumbral flows.
Our following analysis follows very closely the analysis performed by Rempel (2011) aimed to investigate the physical processes that lead to the driving of large-scale outflows around sunspots. Therefore, in order to investigate which forces are responsible for driving the inflows and the outflows in the penumbra, we analyze the various terms in the kinetic energy equation used by MURaM, which is derived from the momentum equation. Since we concentrate on time averages within this section, we use the following energy balance equation, which neglects the temporal derivatives and assumes stationary flows:
| (1) |
In this energy balance equation, a negative acceleration term represents a source of kinetic energy given that, under the assumption of stationarity, the acceleration term is identical to the negative divergence of the kinetic energy flux, .
We compute the individual terms in the energy balance equation as follows:
| (2) |
| (3) |
| (4) |
The viscosity term is not explicitly calculated but instead we use an approximated magnitude which we call residual force:
| (5) |
In the equations 2-5, indicates the Cartesian coordinates and the brackets indicate temporal averages over 10 hours, from hours after initialization of the simulation. We then use the transformation to cylindrical coordinates to separate the directions along and perpendicular to the penumbral filaments, and coordinates, respectively. With denoting positive and negative velocity components respectively ( represents outflows and upflows).
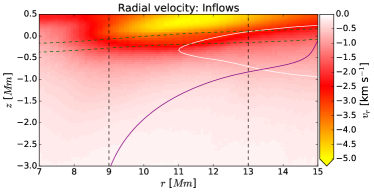
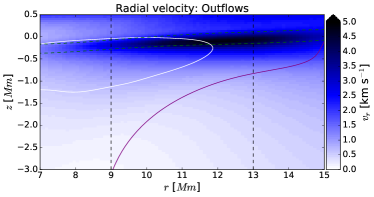
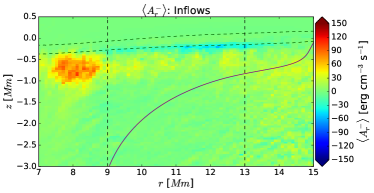
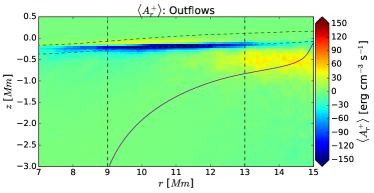
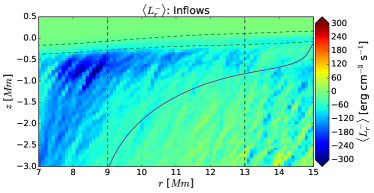
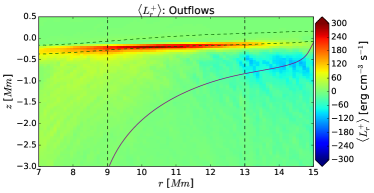
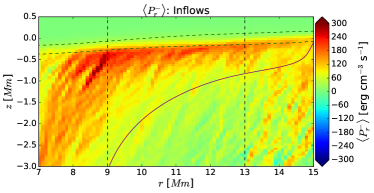
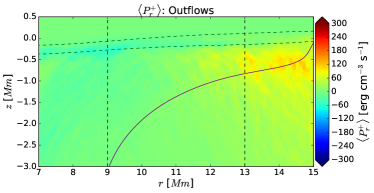
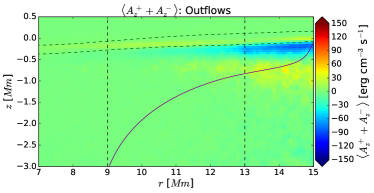
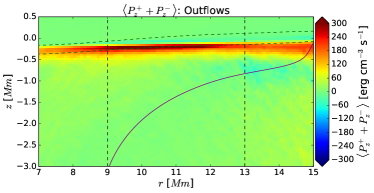
The top panels of Figure 4 show the azimuthally and temporally averaged vertical slices of the radial velocity separately for all the inflows (left) and all the outflows (right) in the penumbra, i.e. using masks that select only the grid points where and respectively, from to Mm (relative to the average height of the level in the quiet Sun). The NEF-related outflow speeds larger than km s-1, and in some places even larger than km s-1 stand out close to the level, being generally restricted to below . Note that in this case the mask excludes any inflow occurring in the penumbra, even those corresponding to the IEF-like feature which dominates the penumbra above (see radial velocity maps in Figure 2). In contrast, the inflow speeds above 2 km s-1, which also stand out close to the level due to the CEFs, produce a continuously increasing inflow profile towards the higher layers due to the inclusion of all those inflows in the IEF-like feature that peak above . It is not in the scope of the present work to analyze such an IEF-like feature. Moreover, given that these inflows occur close to the top boundary of the simulation box, which is numerically closed, they likely are highly influenced by the upper boundary conditions.
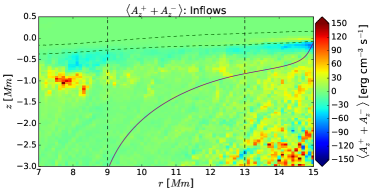
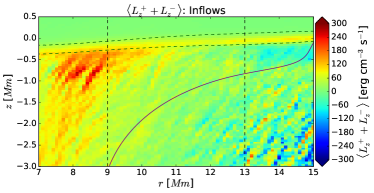
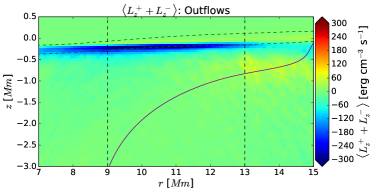
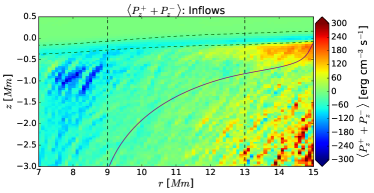
Figure 4 also shows the resultant radial energy conversion terms in the penumbra, separated for all inflows (, and , plots on the left) and for all outflows (, and , plots on the right). Recall that these energy conversion profiles show the 10 hours average of the azimuthally averaged terms in each mask. Negative values of and indicate inward and outward acceleration of the fluid, respectively. Likewise, positive values of and represent a source of kinetic energy for inflows, whilst positive values of and represent an energy source for outflows.
Panels in Figure 5 are in the same format as panels in Figure 4 and show the vertical energy conversion terms (, and ) associated to the inflows (panels on the left) and to the outflows (panels on the right). There, negative values of indicate vertical acceleration of the fluid in inflow and outflow regions, accordingly.
While most of the radial acceleration of the fluid takes place within the inner and middle penumbra for the outflows (negative values of in Figure 4), the inflows are predominantly accelerated within the middle and outer penumbra (negative values of ).
These regions are confined to a narrow layer near the level. There, the Lorentz force is the primary driver of the outflows, while the pressure terms have a weakly negative energetic contribution. In contrast, the inflows are driven mainly by the radial pressure forces, while the radial Lorentz force shows a negative contribution on average. However, plots in Figure 6 reveal that the radial Lorentz term contributes mostly positively close to when the masks only include the regions responsible for driving inflows (i.e. source regions where both and ), and neglect those regions where the inflows sink (i.e. regions where and ).
Plots in Figure 4 also show that in deeper layers the radial pressure terms are almost in balance with the radial Lorentz terms, resulting in only minor acceleration of outflows and inflows in the deep penumbra. Likewise, almost no driving forces exist above . Towards the inner penumbra for the inflows and outer penumbra for the outflows, the layers below the level display a similar forcing pattern, though the energy conversion is on average larger at the inner penumbra for inflows than at the outer penumbra for outflows. In both cases, from down to Mm, the radial Lorentz force is overcompensating the radial pressure driving, producing a radial deceleration of inflows and outflows (positive values of and , respectively). This energy is however transferred into a vertical acceleration of the fluid (negative values of in Figure 5). Such vertical acceleration is mainly downwards at the inner penumbra for inflows and at the outer penumbra for outflows , i.e. negative values of dominate in the average profiles at those places. Finally, the downflowing gas is decelerated again close to Mm. This is seen as the change into positive values of in Figure 5. In the case of the outflows, a transition towards "normal" overturning convection (i.e. more granular-like upflows and downflows where vertical pressure forces lead mostly to vertical acceleration) starts taking place in the region Mm. This also contributes to the strong positive found right below , which also coincides with positive .
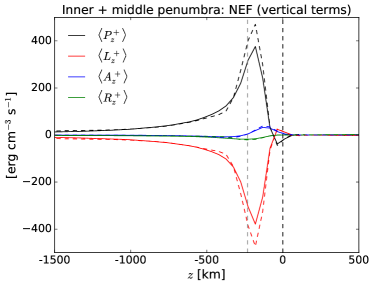
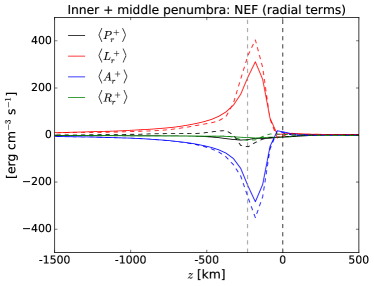
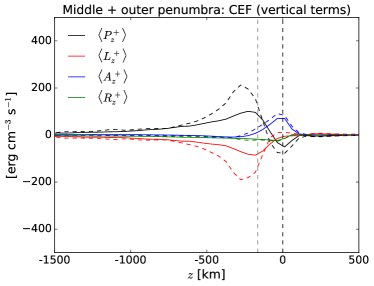
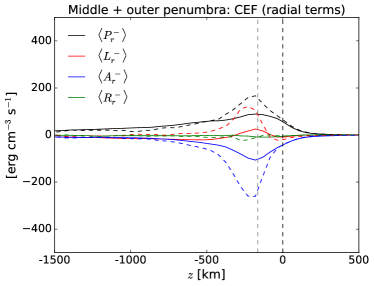
As mentioned above, most of the radial acceleration occurs from the middle to the outer penumbra in inflows, and from the inner to the middle penumbra in outflows. Such penumbral regimes also correspond to the average location of the respective flow source regions (see white contour lines in Figure 4). Therefore, plots in Figure 6 (solid curves) have been created by using a mask that specifically selects the sources of the outflows (regions where and ) within the inner and middle penumbra at each height, and the sources of the inflows (regions where and ) within the middle and outer penumbra at each height. The average depth profile of the energy conversion terms at the sources of each flow are then averaged in time (10 hours). Plots in Figure 6 show that most of the energy conversion takes place between and 0 km, and represents the driving of the NEF and the CEF, correspondingly.
However, the solid curves in Figure 6 stand for the sources of everything that is flowing outwards (upper plots) and the sources of everything that is flowing inwards (lower plots) in the respective penumbral regimes. This includes the filaments of interest carrying the NEF and the CEF respectively, but there are also other and smaller scale flows that do enter the average. The weight or contribution of such flows to the average energy conversion terms seems to be negligible below km (by comparing with the dashed curves in Figure 6) but is larger in the near surface layers (between km and ) where the driving of the NEF and the CEF occurs. However, those additional flows do not modify the average energy balance of the NEF. Only in the radial energy balance of the CEF we see an increased contribution of the radial Lorentz term to the inward acceleration of the fluid when neglecting other inflows. This is because those additional inflows are mainly driven by radial pressure forces in regions where is generally null or slightly negative.
In both, NEF and CEF sources, the upflow components show an approximate balance between and , mainly below and close to . Higher up, the vertical pressure driving, which includes the contribution of gravity, changes sign and the becomes positive just below , implying upflows that decelerate before reaching the photosphere. The steepening of in the near surface layers is caused by the presence of strong magnetic fields. However, the field strength is about a factor 2-3 weaker in the outer penumbra than in the inner penumbra, which explains why the energy conversion is lower at the sources of the CEF than at the sources of the NEF, and might be related to the transient and unstable aspects of the CEFs.
For the NEF, we find that the energy extracted by the Lorentz force in the vertical direction, , is almost completely transferred to the radial outward acceleration of the fluid, , similar to the findings of Rempel (2011). The energy conversion by radial Lorentz force, , is mainly balanced by , and has a slightly negative contribution close to . This can be thought as a deflection of the vertical pressure driving by the Lorentz force (), i.e., the magnetic field forms an almost 90 degree nozzle connecting the pressure driving in the vertical direction with a radial outward acceleration. The Lorentz force does not do any net work. The ultimate energy source is the pressure force due to a large vertical pressure gradient which steepens in the near surface layers.
In normal convection, a loss of buoyancy of the gas near causes a deceleration of the upflows and, as the gas cannot go any higher, it is pushed horizontally to all sides by the rising gas underneath it (i.e. the decelerating gas builds up excess pressure which drives horizontal flows). In the NEF, there is also a loss of buoyancy of the gas near , but in this case the horizontal pressure gradients only play a role in the azimuthal direction (i.e. to drive the horizontal lateral flows) and have slightly negative contribution in the radial direction. For the NEF, it is the inclined magnetic field in the penumbra who plays the most important role. Because in the penumbra there is a magnetic field pointing mainly in one direction, the gas motion loses degrees of freedom and therefore it moves in a preferred direction (the radial one). But the field is not the main accelerating agent of the gas flow in the radial direction, i.e. the density of the gas decreases at the surface where it is deflected radially, and because of mass flux conservation, its speed must be higher. The gas accelerates outwards because more and more gas is coming from below all along the filament, i.e. mass conservation requires the gas to move faster and faster horizontally. While in granulation the horizontally flowing gas can carry mass away on the horizontal plane isotropically, in the penumbra there are less degrees of freedom due to the magnetic structure, and therefore the horizontal flows must be faster in penumbra than in granules to carry away the same amount of mass (assuming equally strong upflows and equal horizontal size of upflowing patches). However, the existence of downflows at the sides of the filaments also removes part of the horizontally flowing mass, therefore limiting the speed of the radial flows.
In contrast, the CEF is predominantly driven by radial pressure forces (and so are all inflows at all heights). There is an additional positive contribution from the radial Lorentz force close to , and the combination of both (magnetic and pressure forces) leads to the inward acceleration of the fluid. The role of the radial Lorentz term for driving inflows in the near surface layers becomes more important when we extract the CEF-carrying filaments only (dashed lines in Figure 6).
Similarly to the situation at the sources of the NEF, at the sources of the CEF the upflowing gas experiences a transition from more vertical into horizontal field due to a bending of the field occurring at the outer and middle penumbra (see e.g. the field inclination along the CEF filament shown in Figure 3). Thus, at the sources of the CEF the upflowing gas is partly deflected inwards by the magnetic field (note that part of the energy extracted by the magnetic field in the vertical direction is transferred into the inward acceleration of the gas). However, unlike the outflows, the inflows are primarily driven by radial pressure forces making the CEF a strong candidate for a siphon flow, which is further supported by our analysis in Section 4.
3.3 Temporal evolution of the CEF
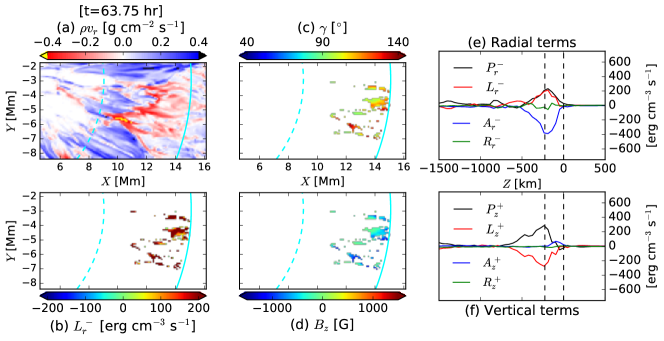
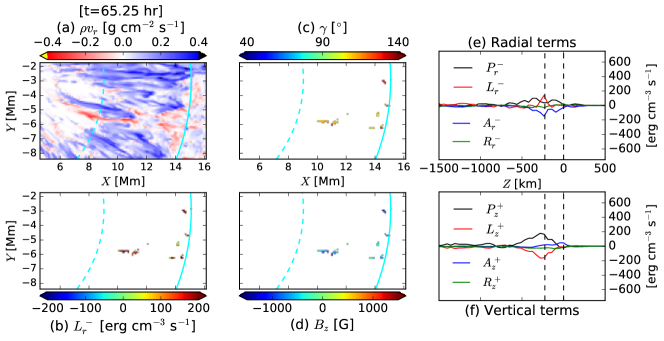
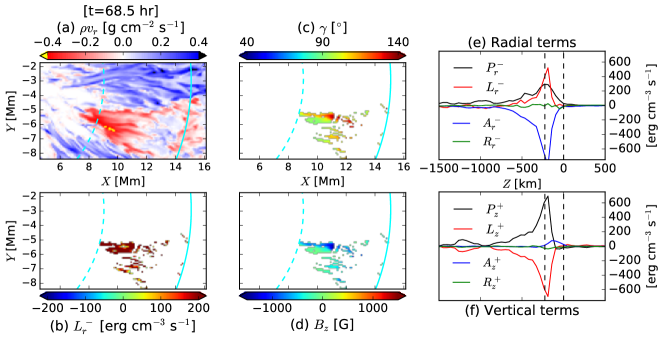
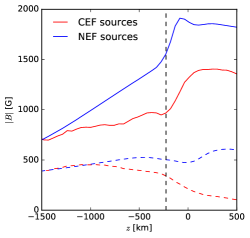
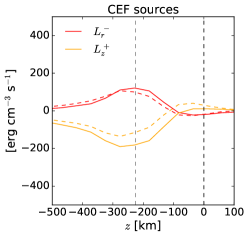
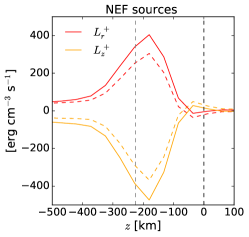
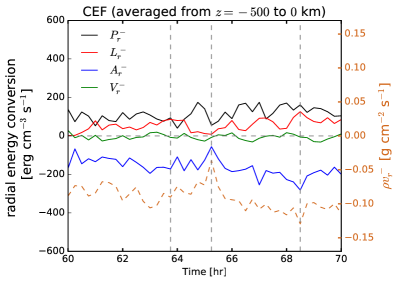
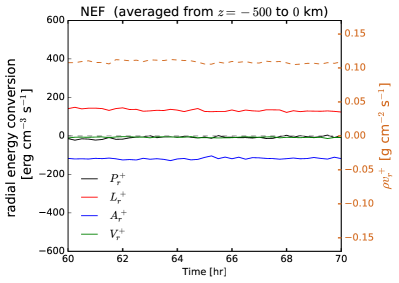
Figure 7 follows the evolution in time of a portion of the penumbra with CEF. We focus on a single CEF patch only, since although the time evolution of the CEF patches in different parts of the penumbra are rather independent of each other, the general results described below are true for all the simulated CEF patches.
The figure shows in panels (a) the radial mass fluxes at three stages of the evolution of the CEF in the selected penumbral sector at km, the negative values indicate mass flowing radially inwards. Panels (b), (c) and (d) in Figure 7 show that the source regions of the CEF at km that have positive values of are all characterized by negative values of , i.e. downward pointing fields () regardless of whether they are located in the middle or in the outer penumbra. In those regions, the field inclination increases radially inwards. Panels (e) show the radial energy conversion associated with the sources of the CEF in the different time-steps. The contribution of both, and to the inward acceleration of the fluid vary over time, being the increase of the overall radial energy conversion associated with an increase of the radial mass flux in the selected CEF patch. At all three stages of the CEF shown in Figure 7, the vertical pressure force shown in panels (f) presents a steepening close to km and it peaks near the average level of the penumbra ( km), keeping a close balance with work done against the Lorentz force.
In order to gain insight into the typical underlying magnetic structure of the regions responsible for driving the CEF, we show in Figure 8 (left panel) the average vertical and radial magnetic field as a function of height in regions that are sources of CEF (red) and in regions that are sources of NEF (blue). For the CEF sources, the vertical field component (dashed red line) remains constant at about 400 G below km and decreases to G in higher layers. The radial field component (solid red line) increases monotonically from about 700 G to G below km. At km, the slope of suffers a large steepening and the radial field component increases to almost 1400 G towards and remains nearly constant at higher layers. The steep increase of near combined with the reduction of results in a strong increase of the radial Lorentz force. As shown in the middle panel of Figure 8, there is a good agreement between the Lorentz terms as defined in equation 3 (solid lines) and the following approximations:
| (6) |
| (7) |
which are indicated by the dashed lines. Similar to what happens at the NEF sources (right panel), at the CEF sources the energy extracted in the vertical direction by the Lorentz force, , is in approximate balance with the radial Lorentz force, . Then, for both, NEF and CEF sources, the following is valid:
| (8) |
which leads to the relation . This relation implies a deflection of the vertical pressure forces in upflows by the Lorentz force to allow for the strong acceleration in the radial direction and it is in agreement with the findings of Rempel (2011) for the driving mechanism of the NEF. Here, we show that this relation is also valid for the CEF, whose vertical flows occur in regions where the vertical field component is negative and its magnitude decreasing with height, while the upflowing gas encounters an increased radial field component when it reaches the surface. This results in a radial driving by the Lorentz force that favors inflows and accelerates the gas inwards with the help of radial pressure forces, which in this case are larger than the Lorentz force.
Similarly, at the source regions of the NEF, the average vertical field component (dashed blue line in left panel of Figure 8) remains around G whilst the radial field component (solid blue line) increases steadily from about 700 G to G just below km. Just as at the CEF sources, the slope of suffers a strong steepening close to km so that increases up to 1900 G towards and drops again in higher layers to about 1800 G. Note that the average increase of near is substantially larger for the NEF sources than for the CEF sources because they occur within different parts of the penumbra. This causes the contribution of the radial Lorentz term to be larger at the sources of the NEF than at the sources of the CEF.
Unlike the NEF, the CEF is driven at all times by the contribution of two different radial forces: and . Figure 9 shows the temporal evolution of the average radial mass flux in the near-surface layers (from to 0 km) at the sources of the CEF in the selected penumbral portion (left plots) and, for comparison, at the sources of the NEF (right plots). The plotted time interval covers the lifetime of the CEF (i.e. the time from 60 to 70 hr). The solid lines in Figure 9 show the average radial energy conversion terms in the near-surface layers at each time-step. The temporal evolution of the CEF shows that the negative radial mass flux (dashed line) is strongly variable compared to the NEF case, and that it is proportional to the radial acceleration, . This means that the sum of the two radial forces, magnetic and pressure forces (note that )), is responsible for modulating the inward mass flux of the CEF in the near surface layers.
Unlike the CEF, the positive radial mass flux of the NEF as well as the radial energy balance have a more steady behavior during the 10 hours of the analyzed interval, exhibiting the quasi-stationarity and robustness of the NEF feature when the penumbra is well-developed. The radial Lorentz terms keep in balance with the radial acceleration forces during the 10 hours here analyzed and are, consistently, the responsible forces driving the NEF in the radial direction.
4 Field-line Connectivity
We have shown in the previous analysis that the CEF and the NEF are both driven within a thin boundary layer close to the level, and that the velocity vector is mostly radial. Moreover, we found that strong radial pressure gradients exist everywhere within the thin boundary layer in which the CEFs are driven. In contrast, while the radial pressure forces have an on average opposed contribution to the driving of the NEF in the source regions, positive radial pressure forces dominate the average in the outer penumbra where the NEF sinks (Figure 4). Although the driving of the flows depends principally on the conditions in their respective upflow cells, identifying the magnetic connectivity of the field lines is an important aspect to describe individual flow channels (penumbral filaments) as flux tubes, and therefore is also necessary to validate whether the flows are or are not driven by a siphon flow mechanism. Nonetheless, such a representation involves some limitations when compared with models based on the thin flux tube approximation (e.g., Meyer & Schmidt, 1968; Thomas & Montesinos, 1993; Montesinos & Thomas, 1997; Schlichenmaier et al., 1998a) which assume well-defined footpoints of the flux tubes on horizontal cuts made at given heights below the surface. In particular, the NEF-carrying filaments in this simulation (and in that by Rempel, 2011) display elongated upflow cells which constrain their representation under the thin flux tube picture.
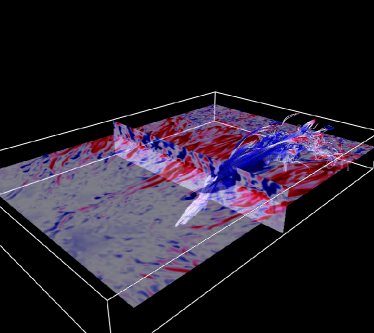
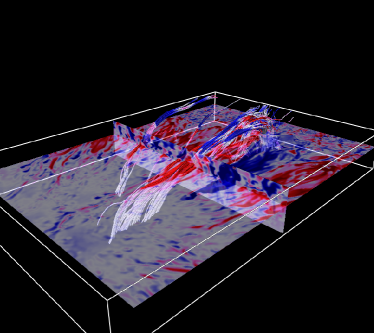
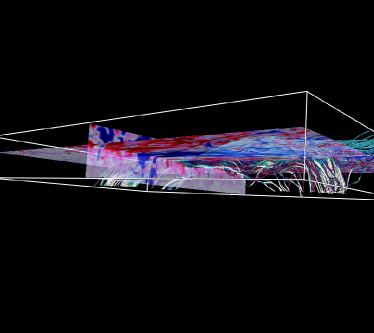
To study the magnetic field-line connectivity as well as the associated field-aligned velocity component and pressure perturbation along the different types of filaments in the penumbra (NEF carrying and CEF carrying filaments), we use the VAPOR software package developed at NCAR (Clyne & Rast, 2005; Clyne et al., 2007, http://www.vapor.ucar.edu).
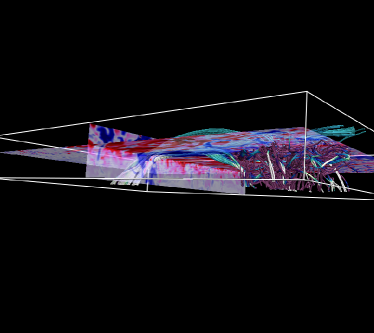
In Figure 10, we have selected field lines in a cross-section perpendicular to filaments based on regions with strong horizontal flows. The selected field lines were colored according to their field-aligned velocity in the upper images and according to the gas pressure perturbation along the field lines in the bottom images (we compute the pressure perturbation after subtracting the hydrostatic mean, since stratification dominates). The images on the left show field lines carrying a CEF from two different view angles and the images on the right show field lines carrying a NEF. In the case of the CEF filaments, most of the field lines span from the outer to the inner penumbra with a consistent inflow along them (top left panel) and they have a very systematic pressure perturbation (bottom left panel) with the gas flowing from high pressure regions (purple) to low pressure regions (white), consistent with a siphon flow.
In the case of the NEF, the velocity along the field lines is less consistent and some field lines have even an inverse flow in their upper portion (top right panel), similarly to the findings of Rempel (2011). In particular, in the inner penumbra, field lines that host the fastest Evershed flows still connect to the top boundary, but forming small dips in-between their extremes. This indicates that the NEF is to a lesser degree a flow along the field and it implies continuous reconnection and change of field line connectivity as the mass moves outward in the penumbra. Moreover, it implies that the physical conditions in the outer footpoint have a minor impact on the driving of the NEF. Looking at the pressure perturbation (bottom right), we find a mix of high and low pressure at both footpoints. There could still be siphon flows along some field lines (mostly in the outer penumbra), but they do not provide a consistent explanation for the Evershed flow in the bulk of the penumbra.
5 Discussion and conclusion
We presented a detailed analysis of the properties of penumbral fine structure associated with the counter Evershed flows (CEF) and the normal Evershed outflows (NEF) near in the penumbra of the recent numerical sunspot simulation by Rempel (2015). Our investigation mainly focuses on the physical driving mechanisms of the NEF and the CEF in the near surface layers of this simulation.
The main difference found between the penumbral filaments carrying the NEF and the ones carrying the CEF is the location within the penumbra and the radial extent of the upflow cells. Both aspects are crucial for the driving of each type of flow given that their driving mechanisms depend primarily on the conditions present in their respective upflow cells.
The energy conversion analysis at the sources of both, outflows and inflows, suggests that the CEF and the NEF are both driven within a thin boundary layer close to the level, and no substantial driving forces exist well above . In both cases, the loss of buoyancy due to radiative cooling is seen as a change of sign of the work by pressure in the vertical direction close to (Figure 6). However, while this provides only a small contribution to the deceleration of the vertical flow in the case of the NEF, i.e. most of the deceleration happens deeper down where the pressure driving is still positive and the dominant offset is given by the vertical Lorentz force, the deceleration of upflows by loss of buoyancy seems to be more prominent for the CEF near . Nonetheless, deceleration of upflows in CEFs near occurs mainly due to an opposed contribution from the vertical Lorentz force, similarly to the NEF case. Therefore, notable differences exist with respect to the underlying driving forces of both, NEF and CEF, compared to field-free convection where deceleration of vertical flows near the surface is mainly due to loss of buoyancy caused by the radiative cooling (see Rempel, 2011, who analyzed in detail the driving of the NEF in a simulated sunspot penumbra and made a comparison between the NEF and the plage region surrounding the sunspot, and found that the vertical pressure/buoyancy breaking has very clear distinct signatures in granulation and in the penumbra).
For the driving of the NEF, we found similar results to those reported by Rempel (2011). There is an almost complete balance between vertical pressure and Lorentz forces in upflows, as well as between the Lorentz force and acceleration in the radial direction. We found no significant kinetic energy in the vertical flow component at the sources of the NEF but a strong acceleration in the radial component in the near-surface layers. This implies that the flow changes direction and gains at the same time significant amounts of kinetic energy in the radial direction. Since the Lorentz force does not do any net work but only changes the direction of the flow, we can say that the flow is deflected by the highly inclined magnetic field in the penumbra and the gas is accelerated in the radial direction as a result of mass flux conservation coupled with the low gas density at the surface. The most important feature driving outflows in the inner and middle penumbra is the increase of the radial field component close to . These results strongly support the magneto-convective driver scenario of the NEF, as proposed in Scharmer et al. (2008), where the NEF is described as the horizontal component of overturning convection in penumbrae.
It has also been proposed in some models that the NEF could be the result of stationary siphon flows driven by a gas pressure difference between the footpoints of the penumbral filaments (e.g. Meyer & Schmidt, 1968). Such models consider processes related to turbulent pumping near the outer penumbral boundary (Montesinos & Thomas, 1997; Brummell et al., 2008) which make the field lines bend downwards, and additionally produce a field strength enhancement in the outer filament endpoint due to strong downdrafts (van Noort et al., 2013). Such a field enhancement would establish a gas pressure gradient between the filament endpoints, producing a siphon-like outflow along the field lines. We do observe a net field strengthening at the outer endpoints of the NEF-carrying filaments (see e.g. Figure 3), at the places where the NEF sinks in the outer penumbra. This enhanced field could explain the increase of the radial pressure gradient towards the outer penumbra seen in the bottom right plot in Figure 4. However, the radial pressure gradients do not play an important role in the inner and in the middle penumbra, where most of the driving of the NEF occurs. This can be attributed to the elongated aspect of the upflow cells, which produces a substantial reduction of the radial pressure gradient. The fact that the largest average outflow speeds in the penumbra ( km s-1) stand out towards the outer penumbra (see radial velocity profile of the outflows in Figure 4) might be in part due to a larger fill factor of outflows in the outer penumbra that dominates the average. According to our results, the overall picture is that of a NEF mainly driven by magneto-convection in the inner and middle penumbra, in agreement with the results of Rempel (2011).
Observational studies of sunspots have shown that the penumbral filaments carrying the NEF in penumbrae have well defined "footpoints" at , see e.g. Tiwari et al. (2013). The filaments footpoints are seen to confine the upflows (sources) and the downflows (sinks) associated to the Evershed flow in the penumbra, separately. This is an important difference given that in these simulations the upflow cell covers a large portion of the NEF filaments, meaning that almost the entire filaments behave as a "footpoint". However, the lack of information on a true geometrical height scale in the current observational analysis techniques makes the comparison of numerical models with the highest-resolution observations very challenging, unless the simulations include the computation of the observational quantities using radiative transfer computations (forward computations).
Overall, our analysis of the NEF essentially reinforces conclusions of Scharmer et al. (2008), Rempel et al. (2009a) and Rempel (2011) stating that the penumbra is dominated by anisotropic magnetoconvection and that the NEF can be understood as the convective flow component in the direction of the magnetic field, i.e., the overall underlying energy source is convective instability.
Unlike the NEF, the driving of the CEF occurs mainly in the middle and outer penumbra and the footpoints (sources and sinks) of the CEF-carrying filaments are generally well separated from each other. Furthermore, the upflow cells in the CEF-carrying filaments are less spread out compared to the NEF, i.e. less elongated in the radial direction, which enhances the role of the radial pressure gradients and allows for the existence of siphon-like inflows along the field lines that are connecting to the inner penumbra.
In addition to the radial pressure gradients, the CEF is also affected by the inclined field of the penumbra, in a similar way as the NEF is, i.e. that the radial Lorentz force plays an important role in the driving of the CEFs. The combination of both radial forces, results in fast inflows ( km s-1 on average) near the level. We found that, irrespective of whether the sources of the CEF are located in the middle or in the outer penumbra, the upflowing gas suffers a reduction of the vertical magnetic field combined with an enhancement of the radial field component. This leads to a positive contribution of the radial Lorentz force for the driving of the CEF.
Nonetheless, the energy conversion associated to the radial Lorentz force is on average smaller in the CEF sources than in the NEF sources given that the magnetic field is on average weaker in the outer penumbra than in the inner penumbra. This would at first sight imply a smaller radial acceleration of the CEF compared to the NEF. However, it is generally the sum of both, the radial pressure force and the radial Lorentz force that determines the radial acceleration of the CEF. Consequently, the inward acceleration of the fluid can eventually become even larger than that of the NEF. This occurs at several stages of the evolution of the CEF in the analyzed simulation. However, during the 10 hours analyzed in these simulations, the CEF shows up as a highly variable and unstable flow, while the NEF appears as a quasi-stationary and more robust feature in the penumbra.
Both, the CEF and the NEF are strongly magnetized and are driven within a thin boundary layer close to . There are also other, smaller scale flows (outflows and inflows) in the penumbra that are unrelated to the filamentary penumbra. In particular, the additional inflows are mostly driven by pressure gradients in regions with an (on average) opposed contribution of the radial Lorentz term, the latter favoring outflows. This could explain why these inflows are of much smaller scales than the CEF.
According to observational studies, CEFs can occur under different physical circumstances. On the one hand, those CEFs that have been observed during the early stages of penumbra formation (e.g., Schlichenmaier et al., 2012; Romano et al., 2014; Murabito et al., 2016) usually appear as elongated patches at the outer edge of the proto-spot, and are unrelated to any filamentary structure since they are observed when the latter is not yet developed. Furthermore, the newly formed penumbral filaments host a NEF soon after their formation. Therefore, those inflows observed around forming sunspots may involve different physical driving mechanisms since they are essentially different to the CEFs studied in this simulation. A possible scenario is that they are driven only by gas pressure gradients which are caused by the increase of the magnetic field strength in the proto-spot.
On the other hand, the CEFs that have been observed (albeit more rarely) in well-developed penumbrae (Kleint & Sainz Dalda, 2013; Louis et al., 2014; Siu-Tapia et al., 2017) share important similarities with the CEFs in the present simulations: they were observed either along singular penumbral filaments or, as in Siu-Tapia et al. (2017), along an array of penumbral filaments covering a sizable part of the penumbra in a mature spot, but with most of the penumbra still displaying the NEF as in our present simulation. This occurs in all the three above-mentioned reported observations of CEFs in well-developed penumbrae. However, due to the lack of knowledge of the true geometrical height scale in the observations and the inability to measure vertical gradients below the photosphere, none of these works could determine the dominant forces driving the flows.
In particular, Siu-Tapia et al. (2017) reported the observation of a prominent CEF with lifetimes of days at photospheric heights. Similar to the simulations analyzed here, the CEF in those observations showed an associated filamentary structure, with the sources of the CEF (hot upflows in vertical field regions) identified in the outer penumbra and the sinks (cooler downflows in strong vertical field regions) at the inner penumbral boundary. Furthermore, we found that the general magnetic, thermal and velocity structure along the central axes of the CEF-carrying filaments at are remarkably similar to those reported in that work. Of particular interest is their finding of an enhanced temperature at the sinks of the CEF with respect to the surrounding environment and a very large field strengthening associated to supersonic downflow speeds. We also see these two aspects at the sinks of the CEF in the simulations. On the one hand, we found that deceleration takes place in the form of shocks at the sinks of both, CEF- and NEF-carrying filaments. This can explain the local temperature rise found at their sinks. On the other hand, we found enhanced field strengths at the sinks of both, CEF and NEF, reaching values up to kG and kG respectively. The very low densities of the downflowing gas produces the depression of the local level at the sinks of both, NEF and CEF. At the CEF sinks, the depression combined with the influence of the umbral field contributes to the observation of such strong fields at those places; while at the NEF sinks, the local enhancement of the field is the result of the depression combined with a net magnetic field intensification that is well-localized in height and might be produced by the supersonic downdrafts of magnetic flux at the outer penumbra, as proposed by van Noort et al. (2013).
The CEF in these simulations persists up to hours, which is much shorter than the lifetimes reported by Siu-Tapia et al. (2017), although the feature studied by Siu-Tapia et al. (2017) was extraordinary compared with other observed CEF events (see e.g. Kleint & Sainz Dalda, 2013; Louis et al., 2014). However, in both cases, the CEF has much shorter lifetimes than the NEF and can be thought of as transitory events relative to the latter. Furthermore, similar to what happens in these simulations, Siu-Tapia et al. (2017) reported that the penumbral sector harboring the CEF displays only a NEF after the CEF disappears. We have not studied the exact mechanism how the CEF is reversed to a NEF. However, a negative contribution of the radial Lorentz term combined with a strong reduction of the radial pressure gradient at the sources of the CEF would strongly favor the driving of outflows instead. A physical mechanism leading to the change of the magnetic field configuration and of the plasma conditions in the penumbra in such a way would likely involve magnetic reconnection.
Our analysis of the driving forces of the CEF in the simulated penumbra clearly shows that the CEF is a siphon flow driven by pressure gradients along the penumbral filaments. The inclined field in the penumbral filaments causes the radial Lorentz force to also play an important role in accelerating the gas inwards. Furthermore, besides the most prominent and persistent groups of CEF-carrying filaments during the analyzed temporal interval (e.g. those shown in Figure 2 and the portion analyzed in Figures 7 and 9), there are also a few other CEF-carrying filaments that live shorter and appear intermittently at different azimuths in the penumbra. We do not discard the possibility that CEFs may actually occur along penumbral filaments more regularly than observed, but their short lifetimes prevents them being easily observed. According to our results, that would occur whenever a significant pressure gradient favoring CEFs is established in a penumbral filament, as in those cases in which the outer footpoint of the filament is not strengthened with respect to the inner footpoint (see, e.g., the CEF-carrying filament shown in Figure 3). Alternatively, CEFs may also appear as a consequence of ongoing magnetic flux emergence in the penumbra. This interpretation was presented by Chen et al. (2017). In their recent MHD simulation more than 60 of the simulated penumbra is dominated by CEFs that result from the mass drain into the umbra-penumbra boundary along the newly emerged field lines that coalesce and contribute to the horizontal field in the penumbra.
Nonetheless, there are very few reported observations of CEFs in sunspot well-developed penumbrae (Kleint & Sainz Dalda, 2013; Louis et al., 2014; Siu-Tapia et al., 2017). This could also be due to a combination of their rare occurrence and their short lifetimes. However, more theoretical studies on this topic as well as high-temporal-cadence spectropolarimetric observations are necessary to investigate the true occurrence frequency and to learn more about the nature of CEFs in well developed sunspot penumbrae as well as their possible influence on the upper atmosphere.
The inverse Evershed flow (IEF) in the uppermost part of the simulation box is a robust feature and the question of an IEF-CEF connection is compelling. However, the IEF shown in the simulation is possibly affected by the proximity of that flow to the top boundary and by Alfvén speed reduction. This will be addressed when improved simulations become available.
References
- Bellot Rubio (2010) Bellot Rubio, L. R. 2010, The Evershed Flow and the Brightness of the Penumbra (Springer-Verlag Berlin Heidelberg: Springer), 193
- Bellot Rubio et al. (2004) Bellot Rubio, L. R., Balthasar, H., & Collados, M. 2004, A&A, 427, 319
- Borrero (2009) Borrero, J. M. 2009, ScChG, 52, 1637
- Borrero & Ichimoto (2011) Borrero, J. M., & Ichimoto, K. 2011, Liv. Rev. Sol. Phys., 8, 4
- Borrero et al. (2005) Borrero, J. M., Lagg, A., Solanki, S. K., & Collados, M. 2005, A&A, 436, 333
- Brummell et al. (2008) Brummell, N. H., Tobias, S. M., Thomas, J. H., & Weiss, N. O. 2008, ApJ, 686, 1454
- Chen et al. (2017) Chen, F., Rempel, M., & Fan, Y. 2017, ApJ, 846, 149
- Choudhuri (1986) Choudhuri, A. R. 1986, ApJ, 302, 809
- Clyne et al. (2007) Clyne, J., Mininni, P., Norton, A., & Rast, M. 2007, New J. Phys., 9, 301
- Clyne & Rast (2005) Clyne, J., & Rast, M. 2005, Proc. SPIE, 5669, 284
- Danielson (1961) Danielson, R. E. 1961, ApJ, 134, 289
- del Toro Iniesta et al. (2001) del Toro Iniesta, J. C., Bellot Rubio, L. R., & Collados, M. 2001, ApJ, 549, L139
- Dialetis et al. (1985) Dialetis, D., Mein, P., & Alissandrakis, C. E. 1985, A&A, 147, 93
- Evershed (1909) Evershed, J. 1909, MNRAS, 69, 454
- Heinemann et al. (2007) Heinemann, T., Nordlund, A., Scharmer, G. B., & Spruit, H. C. 2007, ApJ, 669, 1390
- Kitiashvili et al. (2009) Kitiashvili, I. N., Kosovichev, A. G., Wray, A. A., & Mansour, N. N. 2009, ApJL, 700, L178
- Kleint & Sainz Dalda (2013) Kleint, L., & Sainz Dalda, A. 2013, ApJ, 770, 74
- Louis et al. (2014) Louis, R. E., Beck, C., Mathew, S. K., & Venkatakrishnan, P. 2014, A&A, 570, A92
- Meyer & Schmidt (1968) Meyer, F., & Schmidt, H. U. 1968, Angew. Math. Mech., 48, 218
- Montesinos & Thomas (1997) Montesinos, B., & Thomas, J. H. 1997, Nature, 390, 485
- Murabito et al. (2016) Murabito, M., Romano, P., Guglielmino, S. L., Zuccarello, F., & Solanki, S. K. 2016, ApJ, 825, 75
- Rempel (2011) Rempel, M. 2011, ApJ, 729, 5
- Rempel (2012) —. 2012, ApJ, 750, 62
- Rempel (2014) —. 2014, ApJ, 789, 132
- Rempel (2015) —. 2015, ApJ, 814, 125
- Rempel & Schlichenmaier (2011) Rempel, M., & Schlichenmaier, R. 2011, Liv. Rev. Sol. Phys., 8, 3
- Rempel et al. (2009a) Rempel, M., Schüssler, M., Cameron, R. H., & Knölker, M. 2009a, Sci, 325, 171
- Rempel et al. (2009b) Rempel, M., Schüssler, M., & Knölker, M. 2009b, ApJ, 691, 640
- Romano et al. (2014) Romano, P., Guglielmino, S. L., Cristaldi, A., et al. 2014, ApJ, 784, 10
- Scharmer (2009) Scharmer, G. B. 2009, Space Sci Rev., 144, 229
- Scharmer et al. (2008) Scharmer, G. B., Nordlund, A., & Heinemann, T. 2008, ApJL, 677, L149
- Scharmer & Spruit (2006) Scharmer, G. B., & Spruit, H. C. 2006, A&A, 460, 605
- Schlichenmaier (2009) Schlichenmaier, R. 2009, A&A, 144, 213
- Schlichenmaier et al. (1998a) Schlichenmaier, R., Jahn, K., & Schmidt, H. U. 1998a, ApJ, 493, L121
- Schlichenmaier et al. (1998b) —. 1998b, A&A, 337, 897
- Schlichenmaier et al. (2012) Schlichenmaier, R., Rezaei, R., & González, N. 2012, in 4th Hinode Science Meeting: Unsolved Problems and Recent Insights, ASP Conference series, Vol. 455, San Francisco, CA, 61
- Siu-Tapia et al. (2017) Siu-Tapia, A. L., Solanki, S. K., Lagg, A., van Noort, M., & Jǔrcák. 2017, A&A, 607, A36
- Solanki (2003) Solanki, S. K. 2003, A&AR, 11, 153
- Solanki & Montavon (1993) Solanki, S. K., & Montavon, C. A. P. 1993, A&A, 275, 283
- Spruit & Scharmer (2006) Spruit, H. C., & Scharmer, G. B. 2006, A&A, 447, 343
- Thomas & Montesinos (1993) Thomas, J. H., & Montesinos, B. 1993, ApJ, 407, 398
- Thomas & Weiss (1992) Thomas, J. H., & Weiss, N. O., eds. 1992, Sunspots: Theory and observations; Proceedings of the NATO Advanced Research Workshop on the Theory of Sunspots, ed. J. H. Thomas & N. O. Weiss (Cambridge: Kluwer Academic Publishers), 438
- Thomas & Weiss (2004) Thomas, J. H., & Weiss, N. O. 2004, ARA&A, 42, 517
- Thomas & Weiss (2008) —. 2008, Sunspots and Starspots (Cambridge: Cambridge University Press)
- Thomas et al. (2002) Thomas, J. H., Weiss, N. O., Tobias, S. M., & Brummell, N. H. 2002, Nature, 420, 390
- Tiwari et al. (2013) Tiwari, S. K., van Noort, M., Lagg, A., & Solanki, S. K. 2013, A&A, 557, A25
- Tritschler (2009) Tritschler, A. 2009, in The Second Hinode Science Meeting: Beyond Discovery-Toward Understanding, ASP Conference Series, ed. B. Lites, M. Cheung, T. Magara, J. Mariska, & K. Reeves, Vol. 415, 339
- van Noort et al. (2013) van Noort, M., Lagg, A., Tiwari, S. K., & Solanki, S. K. 2013, A&A, 557, A24
- Vögler et al. (2005) Vögler, A., Shelyag, S., Schüssler, M., & et al. 2005, A&A, 429, 335
- Wiehr (1995) Wiehr, E. 1995, A&A, 298, L17