Quantitative evaluation of the piezoelectric response of unpoled ferroelectric ceramics from elastic and dielectric measurements: tetragonal BaTiO3
Abstract
A method for evaluating the piezoelectric response of unpoled ferroelectric ceramics from elastic and dielectric measurements is proposed and tested on BaTiO3. The method is based on the observation that the softening in a ferroelectric phase with respect to the paraelectric phase is of piezoelectric origin. The angular averages of the piezoelectric softening in unpoled ceramics are calculated for ferroelectric phases of different symmetries. The expression of the orientational average with the piezoelectric and dielectric constants of single crystal tetragonal BaTiO3 from the literature reproduces well the softening of the Young’s modulus of unpoled ceramic BaTiO3, after a correction for the porosity. The agreement is good in the temperature region sufficiently far from the Curie temperature and from the transition to the orthorhombic phase, where the effect of fluctuations should be negligible, but deviations are found outside this region, and the reason for this is discussed. This validates the determination of the piezoelectric response by means of purely elastic measurements on unpoled samples. The method is indirect and, for quantitative assessments, requires the knowledge of the dielectric tensor. On the other hand, it does not require poling of the sample, and therefore is insensitive to inaccuracies from incomplete poling, and can even be used with materials that cannot be poled, for example due to excessive electrical conductivity. While the proposed example of the Young’s modulus of a ceramic provides an orientational average of all the single crystal piezoelectric constants, a Resonant Ultrasound Spectroscopy measurement of a single unpoled ceramic sample through the ferroelectric transition can in principle measure all the piezoelectric constants, together with the elastic ones.
pacs:
77.65.Bn, 62.40.+i, 77.80.B-, 77.84.C, 77.22.ChI Introduction
The determination of the piezoelectric constants of ferroelectric materials can be made by piezoelectrically exciting the resonances of samples with appropriate shapes or by directly quasistatically measuring the charge of a stressed sample or its strain after application of an electric field.Jaffe et al. (1971); Fialka and Beneš (2013) In all cases the samples must be poled, and the measured coefficients depend, among other things, on the degree of polarization, which may be far from complete (see e.g. Refs. 16-22 of Ref. Tutuncu et al. (2014)). As a consequence, the sets of materials constants obtained from sets of samples with different geometries are often unreliable and not self-consistent, especially at high temperature, where the problem of depoling is more acute.Tang and Cao (2015) In extreme situations poling may be impossible, for example when searching for new multiferroic materials by modifying ferroelectric materials with magnetic ions, and further optimization would be required in order to lower an excessive electrical conductivity.
In what follows it will be shown that purely elastic measurements through the ferroelectric transition on unpoled samples may provide information on the intrinsic piezoelectric coupling, particularly useful in cases where poling is difficult or impossible. It can be shown that, within the Landau theory of phase transitions, the softening in the ferroelectric (FE) phase with respect to the paraelectric (PE) phase is of piezoelectric origin, and can be written in tensorial form asCordero et al. (2016a)
| (1) |
where is the compliance, the reciprocal dielectric permittivity and the charge piezoelectric coefficient linking stress and polarization as (for the notation see Sect. IV.1). According to this relation, knowing the dielectric tensor, it is possible to evaluate the piezoelectric response by means of purely elastic measurements, also on unpoled samples, by subtracting the extrapolation of the compliance of the PE phase. The elimination of the poling process, would be particularly beneficial with materials with high coercive fields or leakage currents, and eliminates the uncertainty on the degree of polarization. The method can be easily applied to pure FE transitions, while, in the presence of concurrent causes of elastic anomalies, such as octahedral tilting in perovskites, it would be necessary to separate the ferroelectric/piezoelectric contribution from the rest. Examples of purely FE transitions are found in PZT and BaTiO3, while in materials based on Na1/2Bi1/2TiO3 the transitions are of mixed polar and antiferrodistortive nature,Jones and Thomas (2002) so that the softening is both piezoelectric and from the tilt instability.Cordero et al. (2010)
Here it will be discussed what kind of information may be obtained on the piezoelectric coefficients from measurements of the elastic compliance(s) through the ferroelectric transition on unpoled ceramics. In the usual case of the Young’s modulus (flexural resonance or Dynamic Mechanical Analyzer), one measures an orientational average of Eq. (1) in terms of the single crystal and constants, but with a single Resonant Ultrasound Spectroscopy experimentTang and Cao (2015); Zhang et al. (2017) it is in principle possible to deduce all the elastic and piezoelectric coefficients. Yet, there are several factors that influence both the elastic and piezoelectric responses,not necessarily in exactly the same manner; for example, porosity, texture, grain size and shape, fluctuations of the order parameter, so that the correspondence between the effective elastic softening and the piezoelectric response may be not so straightforward.
In order to make a quantitative check with the intrinsic (single crystal) materials constants, it is necessary to test a material, whose piezoelectric properties in the ceramic state are expected to be very close to those of the single crystal, and for which reliable single crystal material constants are available. The material of choice is certainly BaTiO3, which can be obtained as ceramic with high purity and large grains, but has the complication of additional ferroelectric transitions and important fluctuation effects. It will be verified that the magnitude of the piezoelectric softening measured in ceramic BaTiO3, when passing from the PE to the FE phase, can be accounted for by the above expression of with the single crystal material constants, after orientational averaging and a correction for the general softening caused by porosity. The agreement is good, at least in a restricted temperature region where the influence of fluctuations from the neighboring transitions is minimal.
II Experimental
The measurements of the dynamic Young’s modulus on ceramic BaTiO3 have already been presented in Ref. Cordero et al. (2016b), and will be compared with similar measurements on denser samples from Ref. Cheng et al. (1996a). The same labelling BT1 and BT2 as in Ref. Cordero et al. (2016b) is maintained for the two samples, which were prepared by conventional mixed-oxide powder methods in different laboratories; here only the relevant details of the preparation are mentioned. Sample BT1 was prepared with 1 mol% excess TiO2 in the starting composition, calcined at 1100 ∘C for 2 h and sintered in air at 1400 for 1 h, obtaining a mean grain size of about 50 . BT1 was cut as a bar of dimensions mm3. Sample BT2 was prepared from stoichiometric amounts of BaCO3 and TiO2 powders, calcined in air for 4 h at 1100 ∘C, compacted in bars by means of isostatic cold pressing and sintered for 2 h at 1450 ∘C. BT2 was cut as a bar of mm3. In both cases no trace of impurity phases was revealed by powder X-ray diffraction. The densities of BT1 and BT2, measured with Archimedes’ method, were 90% and 88% respectively of the theoretical value of 6.02 g/cm3, but the types of porosity were rather different, judging from the much longer time required by BT2 for stabilizing the weight when immersed in water with surfactant.
The dynamic Young’s modulus or the compliance was measured by exciting the free flexural resonances of the bars suspended on two thin thermocouple wires in correspondence with the nodal lines of the first flexural mode (at from the ends of the bar with length ). Firm fixing to the wires and shorting of the thermocouple were achieved by applying silver paint to a sample’s edge. The vibration at frequency is electrostatically excited by the application of an alternate voltage with frequency to the electrode. The same electrode is part of a resonating circuit whose high frequency ( MHz) is modulated by the sample vibration, which can be detected with a frequency modulation technique.Cordero et al. (2009)
For samples whose length , width and thickness satisfy , the frequency of the first flexural mode isNowick and Berry (1972)
| (2) |
An irregular or non ideal shape or inhomogeneities of the sample may introduce an error when deducing from the above formula. A check of the consistency of the formula can be done by exciting the 3 and 5 flexural modes with frequencies and and comparing the measured ratios with the ideal values 5.404 and 13.34.Nowick and Berry (1972) For BT2, whose long and thin shape is closer to ideal, the 3 and 5 modes have frequencies within 3% and 0.3% of the expected values. The higher deviation of the 3 mode may be in part due to the fact that the suspension wires were fixed at the nodes of the 1 mode, which practically coincide with those of the 5, but are far from those of the 3 mode. The shorter and thicker BT1 could not be excited on the 5 mode, and was 5.11, with a deviation of nearly 6%. From this check it can be concluded that the error on the evaluation of the effective (uncorrected for porosity) of BT2, due to imperfections in the sample shape and inhomogeneities is within 3%, smaller than the uncertainty from the determination of its size. Sample BT1 will not be used for quantitative purposes.
III Results
Figure 1 shows the Young’s moduli of the three samples BT0, BT1 and BT2, measured on the first free flexural mode as a function of temperature. BT0 is the coarse grain sample of Ref. Cheng et al. (1996a), and is used as a reference for the absolute value of the Young’s modulus in the PE phase, because of its highest density. The maximum resonance frequencies near 500 K in the PE phase are 3, 0.9 and 6 kHz respectively and the moduli are deduced from Eq. (2), without corrections for the porosity.
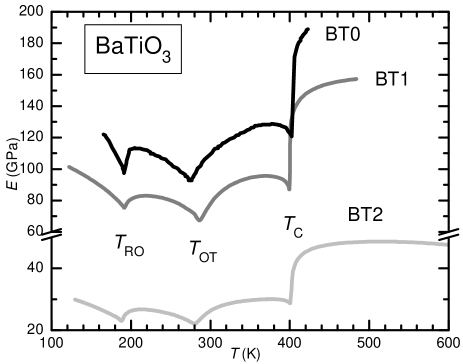
In spite of the widely different values of the Young’s moduli, the shapes of the curves versus temperature are very similar. This is demonstrated in Fig. 2, reporting the compliances normalized to , where is the maximum value in the PE phase; is directly taken from the highest value of the curve for BT2 and extrapolated for BT0 and BT1 in order to let the three curves coincide in the PE phase.
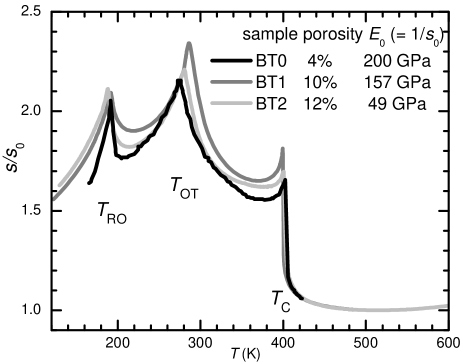
The transition temperature between PE and T-FE phases, taken at half of the step, is K ( K less at the maximum of ) for BT1 and BT2 and 403 K for BT0, and the difference is mainly due to the thermal hysteresis, because BT1 and BT2 were measured during cooling while BT0 during heating. These values of are characteristic of stoichiometric and defect free BaTiO3,Lee et al. (2007) and indicate that the differences in the magnitudes of the elastic moduli are extrinsic, due to differences in the amount and type of the porosity. As usual, and as explained in terms of the Landau theory,Cordero et al. (2016b) the elastic anomalies in the Young’s modulus of BaTiO3 consist essentially of a step at , between the cubic PE and tetragonal (T) FE phases, and of a peak at the next transition to the orthorhombic (O) FE phase at , having the transverse polarization as new order parameter. There is no simple approximated description for the final transition to the rhombohedral FE phase at , where the components of the order parameter have large values both in the high and low temperature sides. The marked difference between the curve BT0 and the curves BT1 and BT2 around 200 K is due to the hysteresis between heating and cooling (see Fig. 1 in Ref. Cordero et al. (2016b)).
IV Discussion
The description of the PE/FE transition as a step in the reciprocal Young’s modulus is an oversimplification, since there is a precursor softening extending for about 200 K above , and a sharp upturn of on approaching from below. In general, precursor softening is due to the fluctuations of the order parameter, which are not included in the Landau theory,Strukov and Levanyuk (1998); Carpenter and Salje (1998) and compromise its validity also below the transition, to some extent Strukov and Levanyuk (1998); BaTiO3 in particular has quite extended and peculiar fluctuations phenomena in the PE phase, as briefly discussed in Sect. IV.3. The upturn below may be partly explainable within the Landau theory, by including the additional terms in the free energy expansion necessary to describe the other transitions at lower temperature (see e.g. Fig. 2(a) in Ref. Ishibashi and Iwata (1999)), and, in addition, by the contribution of the domain walls relaxation. The latter should also exhibit a dispersion in frequency, which is evident at low frequencies,Cheng et al. (1996b) but hardly observed in the present measurements at kHz.Cordero et al. (2016b) It is possible that, analogously to the precursor softening above , there is a precursor softening also above , where the transverse polarization, acting as order parameter, has mean value zero and may well fluctuate.
In what follows the steps and approximations necessary for a quantitative analysis of elastic measurements as those in Figs. 1 and 2 in terms of single crystal piezoelectric and dielectric constants are discussed. The aim is to validate the idea of evaluating the piezoelectric response from the analysis of the elastic softening through the FE transition, and also to point out the limitations and caveats of the method.
IV.1 Piezoelectric softening
We remind that the origin of the piezoelectric softening is the electrostrictive term in the free energyLines and Glass (1977)
| (3) |
where is the electrostrictive coupling tensor, with components , the stress tensor with components , is a dyad with components , and the colon denotes the double dot product over a pair of indexes.Sirotin and Shaskolskaya (1982) The electrostrictive term causes a strain , where, in the FE phase with spontaneous polarization , it is , and is the spontaneous strain. On the application of a small stress , such that , the part of exceeding contributes to the softening with , where . The electrostrictive constant can be eliminated by using , where is the dielectric permittivity, so that the additional softening can be rewrittenCordero et al. (2016a) as Eq. (1), repeated here
Neglecting fluctuations, this term is null in the paraelectric phase, where at equilibrium , but is directly related to the piezoelectric constants in the ferroelectric phase. In the simplest case of a second order FE transition with , and independent of , is constant in the FE phase, producing a steplike softening, and . In such an ideal case, there is a direct relationship between the amplitude of the softening below and some combination of the and components, depending on the type of the measured elastic modulus and crystal symmetry.
IV.2 Orientational average of for uniaxial stress
We wish to evaluate the piezoelectric softening, Eq. (1), to the reciprocal Young’s modulus in an unpoled ceramic material. We start from the compliance in a single crystal in the direction , which is the elongation in that direction due to a unitary uniaxial stress , with components and is given bySirotin and Shaskolskaya (1982); Nye (1985) . Analogously, the contribution of to this compliance is
| (4) |
and it must be averaged over the ceramic sample. Since we are dealing with untextured unpoled ceramics, we can assume random orientations of the grains and polarization . This average is simpler than for a poled ceramic, where the reorientation of the polarization must be assumed along the permissible crystallographic direction closer to the direction of the poling field Baerwald (1957); Lu et al. (1999); Li and Rajapakse (2007); in addition, the reorientation may be far from complete, especially when the switching is also ferroelastic, as in switching in the T phase (see e.g. Ref. Tutuncu et al. (2014) and Refs. 16-22 therein). Yet, taking the angular average of Eq. (1) is an oversimplification also in the unpoled state, since it is equivalent to the Reuss average, which assumes uniform stress across the sample, while the other limit is the assumption of uniform strain, leading to the Voigt average of the elastic moduli instead of the compliances. Completely analogous averages can be made with the electrostrictive constants.Haun et al. (1989) Sometimes, the average of the two methods, known as Hill polycrystalline average, is used, but more refined and complicated methods have been developed, that take into account in a self-consistent manner the reciprocal action of the domains or grains on their neighbors (e.g. Ref. Berryman (2005)). Also the shape of the domains and grains has a role, which can be simulated in the more sophisticated treatments. Since the major source of extrinsic softening in our samples is porosity, it would be excessive to adopt such methods, based on largely undetermined parameters like the distribution of domain/grain sizes and shapes. Therefore, we will simply perform the angular average of Eq. (1). This choice has already been found to provide good results for BaTiO3.Berlincourt and Jaffe (1958)
It is convenient to adopt the Voigt or matrix notation:Nye (1985) , , , , with the additional rule that the components of , and have to be multiplied by 2 for each index . In this manner, for the tetragonal symmetry the and matrices are written asSirotin and Shaskolskaya (1982); Nye (1985)
and the piezoelectric softening Eq. (1) becomes
| (5) |
The magnitude of along the generic crystallographic direction , where is the angle between the direction of the uniaxial stress and the tetragonal axis, is
with
and we obtain
where and have been used. The angular averages are and , so that finally
| (6) |
In the same manner it is possible to find the expressions valid for the orthorhombic (O) and rhombohedral (R) symmetriesAbrahams (2009) of the other FE phases of BaTiO3:
| (7) |
| (8) |
IV.3 Influence of fluctuations
The expression (1) of is valid for free energy expansions containing as many powers of as necessary for describing sequences of phase transitions, as done for example in Refs. Li et al. (2005); Wang et al. (2007), unless there are other types of coupling between stress and strain besides the electrostrictive one, Eq. (3). Therefore, within the Landau theory, it should be possible to reproduce also the upturn of below and the cusps at and , as done in the simulations of Ishibashi and Iwata,Ishibashi and Iwata (1999) and Eq. (1) would automatically connect the elastic, dielectric and piezoelectric responses. In particular, it has been shownCordero et al. (2016b) that the linearization of the shear electrostrictive term with respect to the small transverse component of causes a cusp of at ; that is exactly piezoelectric softening. However, the Landau theory, and hence also Eq. (1), do not take into account the fluctuations of the polarization, which certainly play an important role in the PE phase and, presumably, also above the next transition at .
The fluctuations may renormalize the coefficients of the free energy expansion. transforming a second order transition into first order,Strukov and Levanyuk (1998) and this should not affect the validity of Eq. (1), but they may also produce different contributions to the dielectric susceptibility and to the compliance, so that the above expressions of are not expected to be valid in some temperature range near the transition temperatures. Determining a criterion for the temperature range of validity of the Landau theory in the presence of fluctuations, or including the effect of fluctuations in the expression (1) is outside the scope of the present paper. General criteria for estimating the range of validity of the Landau theory are discussed for example in Ref. Rabe et al. (2007). Here we only remind that the longitudinal fluctuations of the polarization should be partially suppressed by the accompanying depolarizing fields, which are absent in the transverse fluctuations.Strukov and Levanyuk (1998); Rabe et al. (2007) Therefore, it is expected that different transitions are differently affected by fluctuations: the FE/PE transition at should be accompanied by prevailing longitudinal fluctuations, while that at , consisting in a rotation of the polarization, should be accompanied by prevalent transverse fluctuations. The transition at should not be much affected by fluctuations, since both the longitudinal and transverse components of the polarization are finite. In spite of these considerations (expected quenching of the longitudinal fluctuations above by the depolarizing fields), important precursor softenings have been measured in PE BaTiO3 with various techniques, such as ultrasound velocity,Kashida et al. (1973) Resonant Ultrasound SpectroscopyAktas et al. (2013) and Brillouin scattering,Ko et al. (2011) and Fig. 3(a) confirms that the precursor softening starts already at K. Other precursor phenomena have been observed in the Raman spectrum,Fontana and Lambert (1972) refraction index,Burns and Dacol (1982) Second Harmonic Generation,Pugachev et al. (2012) and all these phenomena are usually discussed in terms of polar nanoregions.Ko et al. (2011); Burns and Dacol (1982); Pugachev et al. (2012) The piezoelectric coupling is no exception, since the mechanical resonances can be piezoelectrically excited up to 600 K.Aktas et al. (2013)
Without a precise knowledge of the nature of the fluctuations in BaTiO3 and of their effect on Eq. (1), it seems safe to apply this formula in a region far from both and ; the best choice seems the plateau of with shallow minimum at 373 K. The verification of Eq. (1) will be first made at that temperature.
IV.4 Correction for the porosity
In order to compare the magnitude of the softening below with Eq. (1), where the single crystal materials constants are insterted, the overall softening effect of porosity must be taken into account. The softening from porosity depends on both the volume fraction of the pores (or from the relative sample density) and on their shape. The effect of shape may be very large: passing from spherical to flat lenticular or ”penny shaped” pores, keeping their volume fraction constant, may soften the sample by several times.Wu (1966); Dunn (1995) Therefore, the evaluation of the softening from the relative density and the visual characterization of the pore shapes is rather aleatory. Figures 1 and 2 clearly demonstrate this point, since the relationship between the porosity, as volume fraction, and the Young’s modulus in the PE phase cannot be expressed with a linear or smooth function. The fact that BT2 with 12% porosity is more than three times softer than BT1 with 10% porosity is certainly due to a morphology of its porosity similar to cracks and fissures. This is confirmed by the fact that, when measuring the densities with the Archimedes method, the time for stabilizing the weight in water was much longer for BT2. The penetration of water in the connected porosity also fictitiously enhances the relative density, compared to non connected porosity, so that the pores volume fraction of BT2 might be larger than 12%.
It has already been shown in Fig. 2 that, after rescaling, the curves of the compliance of BaTiO3 versus temperature of samples with different porosities coincide to a reasonable degree of accuracy. This is true even for BT2, four times softer than BT0. The denser sample BT0 measured by Fantozzi has an extrapolated maximum Young’s modulus 200 GPa, which we assume to be close to the intrinsic value that would be measured in a completely dense sample. For the following comparison with single crystal data, we choose our denser sample BT1, whose maximum extrapolated modulus is 157 GPa, and use a rescaling factor
| (9) |
which makes BT1 to overlap with BT0.
The value of 200 GPa for the intrinsic Young’s modulus of PE BaTiO3 deduced here is in line with the highest values available in the literature: 197 GPa from ultrasound experiments Ledbetter et al. (1990). It is also close to the value calculated on the basis of the single crystal compliances at 150 ∘C: Berlincourt and Jaffe (1958) Pa-1, Pa-1, Pa-1. The orientational average of the reciprocal Young’s modulus for a cubic polycrystal is calculated in a manner analogous to that used for obtaining Eq. (6), and yieldsNowick and Berry (1972); Sirotin and Shaskolskaya (1982) ; inserting the single crystal values,Berlincourt and Jaffe (1958) one obtains GPa.
It results that porosity is a major source of uncertainty in determining the intrinsic elastic constants, but the same is true for the direct measurements of the piezoelectric coefficients, though they are not affected by porosity exactly in the same manner as the elastic constants.Dunn (1995) The different effects of porosity on the effective and imply that, for large porosities, the effective deduced from Eq. (1) may be different from the effective measured on the same material by direct methods (without considering possible issues related to incomplete poling). Moreover, it cannot be excluded that in samples whose porosities are particularly high or with peculiar morphologies, also the elastic compliance and piezoelectric softening are differently affected, so that a rescaling factor is not sufficient to account for the effect of porosity.
Summing up, the compliances in the PE phase of the three samples in Fig. 2 differ by up to four times, due to porosity, but exhibit a satisfactory reproducibility, after rescaling. This encourages in correcting for porosity both compliance and piezoelectric softening with a common rescaling factor; yet, it cannot be excluded that large porosities with particular morphologies impair the validity of this simple type of correction.
IV.5 Subtraction of the background elastic constant
In order to extract the piezoelectric softening, the other contributions to the compliance must be subtracted. This task should be easy for a purely ferroelectric transition, but not in the presence of concomitant instabilities of other nature. For example, in Na1/2Bi1/2TiO3 the polar transitions are accompanied by changes in the octahedral tilt patterns, and, in order to use Eq. (1), one should somehow identify and subtract the softening connected with these antiferrodistortive modes. This may be be a major difficulty in general, but it is possible for the antiferroelectric/ferroelectric transitions in PZT, thanks to the fact that the polar and antiferrodistortive modes have different kinetics and can be observed separately in the elastic measurements (Ref. Cordero et al. (2014) and see note 12 of Ref. Cordero et al. (2016c); note that in those cases one observes the loss of piezoelectric softening, namely a stiffening, during cooling from the FE to the AFE phase). In the absence of additional instabilities, one can reasonably assume that the softening at the FE transition is totally due to Eq. (1), besides fluctuations. Therefore, in the absence of the FE transition, the background compliance would vary approximately linearly with , due to the phonon anharmonicity (see e.g. the temperature coefficient of the inverse compressibility in terms of the Grüneisen constant, Eq. (4.58) in Ref. Born and Huang (1954), and Ref. J. B. Wachtman et al. (1961)).
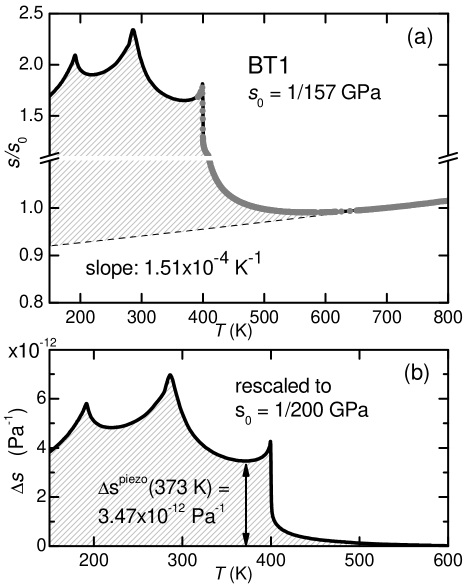
Figure 3 shows two measurements of BT1: the black line up to 480 K is the compliance from which we will deduce the piezoelectric softening, while the gray symbols above 390 K are another measurement extended to 800 K. Between 390 and 480 K the two curves overlap perfectly, and the one at higher temperature can be extrapolated from the linear region down to below . It is necessary to extrapolate the linear anharmonic behavior of the elastic moduli at such high temperatures, because the precursor softening extends at least up to 650 K. The resulting dashed line, with a slope of K-1, is subtracted from in order to obtain . The resulting compliance, exceeding the compliance of the PE phase with the anharmonic corrections, is rescaled by the factor (9), to account for porosity, and should represent the piezoelectric softening plus contributions from fluctuations, which are different in , and As discussed previously, the temperature region where the effect of fluctuations should be minimal is the minimum of the plateau around 373 K, and therefore we choose this temperature for determining the magnitude of the piezoelectric softening, which results to be
| (10) |
IV.6 Comparison with single crystal material constants
In spite of the extensive literature on the piezoelectric and elastic properties of BaTiO3, it is not easy to find a complete set of material constants, especially as a function of temperature. Schaefer and coworkersSchaefer et al. (1986) measured the temperature dependencies of the , and constants within the T phase from a set of single crystals. Their results should be more reliable than the old ones,Berlincourt and Jaffe (1958) in view of the higher and presumed reduced twinning, but some inaccuracies may arise from incomplete poling of some of the samples.Schaefer et al. (1986) The temperature dependencies of the , and constants have also been calculated Damjanovic et al. (2002); Budimir et al. (2003) from a Landau free energy expansion,Bell (2001) which reproduces the phase diagram and piezoelectric properties of BaTiO3. By inserting the values of those coefficients at 373 K in Eq. (1) one obtains:
| (Ref. Schaefer et al. (1986)) | ||||
| (Refs. Damjanovic et al. (2002); Budimir et al. (2003)). |
The value deduced from BT1, Eq. (10), is only 6% lower than that calculated using the Landau free energyDamjanovic et al. (2002); Budimir et al. (2003) and 39% smaller than using the single crystal data Schaefer et al. (1986); this can be considered as a good agreement, in view of the uncertainty from the porosity and sample shape, and the fact that the reference data differ of 33% between themselves. This validates the use of Eqs. (6-8) for expressing the magnitude of the softening from the PE to FE phase in terms of the piezoelectric and dielectric coefficients for the T, R and O symmetries.
Encouraged by this result, we can test the validity of the method outside the safe temperature range, around 373 K for BaTiO3. The result is shown in Fig. 4.
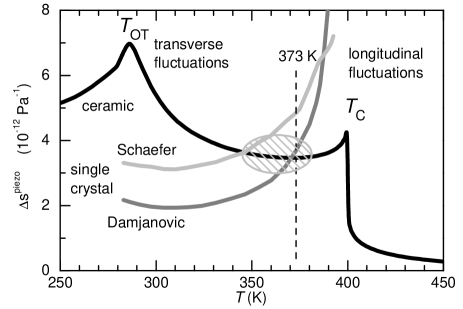
The black curve is the same curve from ceramic BT1 as in Fig. 3(b), and is compared with those calculated from Eq. (6) with the and constants from Damjanovic et al.Damjanovic et al. (2002); Budimir et al. (2003) and Schaefer et al.Schaefer et al. (1986). Even though both the reference curves cross in the region of its plateau, hatched in Fig. 4, the agreement is rather poor, because the reference data, especially those from the Landau expansion, exhibit too large a rise on approaching and too small on approaching . It seems unlikely that such large differences can be totally attributed to the inadequacy of Eq. (1) in dealing with fluctuations, and there can be some weakness also in the reference data.
For example, the and obtained from the Landau potential Bell (2001) do not fully reproduce the experimental ones, especially close to .Wang et al. (2007) Those works were more concerned with the anisotropy of the piezoelectric properties, rather than on their temperature dependence, and were based on the Landau free energy expansion of BellBell (2001) up to the sixth power of . Wang et al.Wang et al. (2007) have later shown that a more accurate representation of the dielectric and ferroelectric properties of BaTiO3 requires an expansion up to the 8th order, with additional dependencies on temperature of some coefficients. In particular, in this manner the temperature dependence of becomes steeper below (Fig. 6 of Ref. Wang et al. (2007)), mitigating the discrepancy between the calculated and . Another factor that worsens the comparison between these curves below is the fact that the theoretical curves for were calculated with K,Damjanovic et al. (2002); Budimir et al. (2003) while our sample has K.
Conclusions
The aim of this work was to verify that the softening of an unpoled ceramic in the ferroelectric state with respect to the compliance of the paraelectric state provides a measure of the piezoelectric coefficients, based on the orientational average of Eq. (1) expressed in Eqs. (6-8). In order to obtain a quantitative estimate, the other sources of softening, intrinsic and extrinsic, must be considered, which are: i) the association of the ferroelectric mode with other modes, such as octahedral tilting in perovskites; ii) porosity; iii) fluctuations; iv) the anharmonic stiffening of the elastic constants, linear in .
If the ferroelectric transition is accompanied by another source of spontaneous strain, it is probably impossible to disentangle the additional softening from the piezoelectric one; the FE/AFE transition in PZT with concomitant octahedral tilting is cited as a case where the two softenings may be distinguished thanks to the different kinetics of the two modes. Porosity appears as a major source of error; in the BaTiO3 ceramic samples considered here, the softening introduced by porosity can be satisfactorily accounted for by rescaling the whole compliance curve by a constant factor, but this simple correction may be inadequate for high porosities with particular morphologies.
Barium titanate has been chosen for the experimental test, because its intrinsic elastic and dielectric coefficients are available in the literature, and because it undergoes a pure ferroelectric transition, without the intervention of additional degrees of freedom; on the other hand, BaTiO3 exhibits important fluctuation effects and other FE transitions, which complicate the analysis.
In the temperature region not too close to and , where fluctuations are expected to be negligible, there is good agreement between the piezoelectric softening measured on ceramic samples and the orientational average of the single crystal data, validating the effectiveness of the elastic method for determining the piezoelectric response, but the agreement worsens away from this region. Possible reasons for the discrepancies in whole temperature range are discussed.
If the caveats discussed above are observed, the evaluation of the piezoelectric response from purely elastic measurements on unpoled ceramic samples presents the great advantage of avoiding the procedure of poling, and therefore of being insensitive to the uncertainties from partial poling or thermal depoling, especially at high temperature. The method is particularly promising in conjunction with the Resonant Ultrasound Spectroscopy technique,Tang and Cao (2015); Zhang et al. (2017) since it allows all the elastic and piezoelectric constants to be extracted with a single measurement through the ferroelectric transition.
References
- Jaffe et al. (1971) B. Jaffe, W. R. Cook, and H. Jaffe, Piezoelectric Ceramics (Academic Press, London, 1971).
- Fialka and Beneš (2013) J. Fialka and P. Beneš, “Comparison of Methods for the Measurement of Piezoelectric Coefficients,” IEEE Trans. Instr. Meas. 62, 1047 (2013).
- Tutuncu et al. (2014) G. Tutuncu, L. Fan, J. Chen, X. Xing, and J. L. Jones, “Extensive domain wall motion and deaging resistance in morphotropic 0.55Bi(Ni1/2Ti1/2)O3-0.45PbTiO3 polycrystalline ferroelectrics,” Appl. Phys. Lett. 104, 132907 (2014).
- Tang and Cao (2015) L. Tang and W. Cao, “Temperature dependence of self-consistent full matrix material constants of lead zirconate titanate ceramics,” Appl. Phys. Lett. 106, 052902 (2015).
- Cordero et al. (2016a) F. Cordero, F. Craciun, F. Trequattrini, and C. Galassi, “Piezoelectric softening in ferroelectrics: ferroelectric versus antiferroelectric PbZr1-xTixO3,” Phys. Rev. B 93, 174111 (2016a).
- Jones and Thomas (2002) G. O. Jones and P. A. Thomas, “Investigation of the structure and phase transitions in the novel A-site substituted distorted perovskite compound Na0.5Bi0.5TiO3,” Acta Cryst. B 58, 168–178 (2002).
- Cordero et al. (2010) F. Cordero, F. Craciun, F. Trequattrini, E. Mercadelli, and C. Galassi, “Phase transitions and phase diagram of the ferroelectric perovskite (Na0.5Bi0.5)1-xBaxTiO3 by anelastic and dielectric measurements,” Phys. Rev. B 81, 144124 (2010).
- Zhang et al. (2017) Y. Zhang, L. Tang, H. Tian, J. Wang, W. Cao, and Z. Zhang, “Determination of temperature dependence of full matrix material constants of PZT-8 piezoceramics using only one sample,” J. Alloys Compd. 714, 20 (2017).
- Cordero et al. (2016b) F. Cordero, H. T. Langhammer, T. Müller, V. Buscaglia, and P. Nanni, “Rotational instability of the electric polarization and divergence of the shear elastic compliance,” Phys. Rev. B 93, 064111 (2016b).
- Cheng et al. (1996a) B. L. Cheng, M. Gabbay, Jr. W. Duffy, and G. Fantozzi, “Mechanical loss and Young’s modulus associated with phase transitions in barium titanate based ceramics,” J. Mater. Sci. 31, 4951 (1996a).
- Cordero et al. (2009) F. Cordero, L. Dalla Bella, F. Corvasce, P. M. Latino, and A. Morbidini, “An insert for anelastic spectroscopy measurements from 80 k to 1100 k,” Meas. Sci. Technol. 20, 015702 (2009).
- Nowick and Berry (1972) A. S. Nowick and B. S. Berry, Anelastic Relaxation in Crystalline Solids (Academic Press, New York, 1972).
- Lee et al. (2007) S. Lee, Z. K. Liu, and M. H. Kim, “Influence of nonstoichiometry on ferroelectric phase transition in BaTiO3,” J. Appl. Phys. 101, 054119 (2007).
- Strukov and Levanyuk (1998) B. A. Strukov and A. P. Levanyuk, Ferroelectric Phenomena in Crystals (Springer, Heidelberg, 1998).
- Carpenter and Salje (1998) M. A. Carpenter and E. H. K. Salje, “Elastic anomalies in minerals due to structural phase transitions,” Eur. J. Mineral. 10, 693–812 (1998).
- Ishibashi and Iwata (1999) Y. Ishibashi and M. Iwata, “Theory of morphotropic phase boundary in solid-solution systems of perovskite-type oxide ferroelectrics: Elastic properties,” Jpn. J. Appl. Phys. 38, 1454–1458 (1999).
- Cheng et al. (1996b) B. L. Cheng, M. Gabbay, and G. Fantozzi, “Anelastic relaxation associated with the motion of domain walls in barium titanate ceramics,” J. Mater. Sci. 31, 4141–4147 (1996b).
- Lines and Glass (1977) M. E. Lines and A. M. Glass, Principles and Applications of Ferroelectrics and Related Materials (Oxford University Press, Oxford, 1977).
- Sirotin and Shaskolskaya (1982) Yu. I. Sirotin and M. P. Shaskolskaya, Fundamentals of crystal physics (Mir Publishers, Moscow, 1982).
- Nye (1985) J. F. Nye, Physical Properties of Crystals; their Representation by Tensors and Matrices (Oxford University Press, Oxford, UK, 1985).
- Baerwald (1957) H. G. Baerwald, “Thermodynamic Theory of Ferroelectric Ceramics,” Phys. Rev. 105, 480 (1957).
- Lu et al. (1999) W. Lu, D. N. Fang, C. Q. Li, and K. C. Hwang, “Nonlinear electric-mechanical behavior and micromechanics modelling of ferroelectric domain evolution,” Acta Mater. 47, 2913 (1999).
- Li and Rajapakse (2007) F. X. Li and R. K. N. D. Rajapakse, “Analytical saturated domain orientation textures and electromechanical properties of ferroelectric ceramics due to electric/mechanical poling,” J. Appl. Phys. 101, 054110 (2007).
- Haun et al. (1989) M. J. Haun, E. Furman, S. J. Jang, and L. E. Cross, “Modeling of the Electrostrictive, Dielectric, and Piezoelectric Properties of Ceramic PbTi03,” IEEE Trans. Ultrason. Ferroelectr. Freq. Control 36, 393 (1989).
- Berryman (2005) J. G. Berryman, “Bounds and self-consistent estimates for elastic constants of random polycrystals with hexagonal, trigonal, and tetragonal symmetries,” J. Mech. Phys. Solids 53, 2141 (2005).
- Berlincourt and Jaffe (1958) D. Berlincourt and H. Jaffe, “Elastic and piezoelectric coefficients of single-crystal barium titanate,” Phys. Rev. 111, 143 (1958).
- Abrahams (2009) S. C. Abrahams, “Atomic displacements at and order of all phase transitions in multiferroic YMnO3 and BaTiO3,” Acta Cryst. B 65, 450 (2009).
- Li et al. (2005) Y. L. Li, L. E. Cross, and L. Q. Chen, “A phenomenological thermodynamic potential for BaTiO3 single crystals,” J. Appl. Phys. 98, 064101 (2005).
- Wang et al. (2007) Y. L. Wang, A. K. Tagantsev, D. Damjanovic, N. Setter, V. K. Yarmarkin, A. I. Sokolov, and I. A. Lukyanchuk, “Landau thermodynamic potential for BaTiO3,” J. Appl. Phys. 101, 104115 (2007).
- Rabe et al. (2007) K. M. Rabe, A. H. Ahn, and J. M. Triscone, Physics of Ferroelectrics. A Modern Perspective, Topics in Applied Physics (Springer, 2007).
- Kashida et al. (1973) S. Kashida, I. Hatta, A. Ikushima, and Y. Yamada, “Ultrasonic Velocities in BaTiO3,” J. Phys. Soc. Jpn. 34, 997 (1973).
- Aktas et al. (2013) O. Aktas, M. A. Carpenter, and E. H. Salje, “Polar precursor ordering in BaTiO3 detected by resonant piezoelectric spectroscopy,” Appl. Phys. Lett. 103, 142902 (2013).
- Ko et al. (2011) J. H. Ko, T. H. Kim, K. Roleder, D. Rytz, and S. Kojima, “Precursor dynamics in the ferroelectric phase transition of barium titanate single crystals studied by brillouin light scattering,” Phys. Rev. B 84, 094123 (2011).
- Fontana and Lambert (1972) M. P. Fontana and M. Lambert, “Linear disorder and temperature dependence of Raman scattering in BaTiO3,” Solid State Commun. 10, 1 (1972).
- Burns and Dacol (1982) G. Burns and F. H. Dacol, “Polarization in the cubic phase of BaTiO3,” Solid State Commun. 42, 9 (1982).
- Pugachev et al. (2012) A. M. Pugachev, V. I. Kovalevskii, N. V. Surovtsev, S. Kojima, S. A. Prosandeev, I. P. Raevski, and S. I. Raevskaya, “Broken Local Symmetry in Paraelectric BaTiO3 Proved by Second Harmonic Generation,” Phys. Rev. Lett. 108, 247601 (2012).
- Wu (1966) T. T. Wu, “The effect of inclusion shape on the elastic moduli of a two-phase material,” Int. J. Solids Structures 2, 1 (1966).
- Dunn (1995) M. L. Dunn, “Effects of grain shape anisotropy, porosity, and microcracks on the elastic and dielectric constants of polycrystalline piezoelectric ceramics,” J. Appl. Phys. 78, 1533 (1995).
- Ledbetter et al. (1990) H. Ledbetter, M. Lei, and S. Kim, “Elastic constants, Debye temperatures, and electron-phonon parameters of superconducting cuprates and related oxides,” Phase Transit. 23, 61 (1990).
- Cordero et al. (2014) F. Cordero, F. Trequattrini, F. Craciun, and C. Galassi, “Effects of aging and annealing on the polar and antiferrodistortive components of the antiferroelectric transition in PbZr1-xTixO3,” Phys. Rev. B 89, 214102 (2014).
- Cordero et al. (2016c) F. Cordero, F. Craciun, F. Trequattrini, P. Galizia, and C. Galassi, “Elastic aging from coexistence and transformations of ferroelectric and antiferroelectric states in PZT,” J. Appl. Phys. 120, 064104 (2016c).
- Born and Huang (1954) M. Born and K. Huang, Dynamical theory of crystal lattices (Oxford University Press, Glasgow, 1954).
- J. B. Wachtman et al. (1961) Jr. J. B. Wachtman, W. E. Tefft, Jr. D. G. Lam, and C. S. Apstein, “Exponential temperature dependence of young’s modulus for several oxides,” Phys. Rev. 122, 1754 (1961).
- Schaefer et al. (1986) A. Schaefer, H. Schmitt, and A. Dörr, “Elastic and piezoelectric coefficients of TSSG barium titanate single crystals,” Ferroelectrics 69, 253 (1986).
- Damjanovic et al. (2002) D. Damjanovic, F. Brem, and N. Setter, “Crystal orientation dependence of the piezoelectric d33 coefficient in tetragonal BaTiO3 as a function of temperature,” Appl. Phys. Lett. 80, 652 (2002).
- Budimir et al. (2003) M. Budimir, D. Damjanovic, and N. Setter, “Piezoelectric anisotropy-phase transition relations in perovskite single crystals,” J. Appl. Phys. 94, 6753 (2003).
- Bell (2001) A. J. Bell, “Phenomenologically derived electric field-temperature phase diagrams and piezoelectric coefficients for single crystal barium titanate under fields along different axes,” J. Appl. Phys. 89, 3907–3914 (2001).