Fermi Large Area Telescope detection of gamma-ray emission from the direction of supernova iPTF14hls
Abstract
The remnant of supernova explosion is widely believed to be the acceleration site of high-energy cosmic ray particles. The acceleration timescale is, however, typically very long. Here we report the detection of a variable -ray source with the Fermi Large Area Telescope, which is positionally and temporally consistent with a peculiar supernova, iPTF14hls. A quasi-stellar object SDSS J092054.04+504251.5, which is probably a blazar candidate according to the infrared data, is found in the error circle of the -ray source. More data about the -ray source and SDSS J092054.04+504251.5 are needed to confirm their association. On the other hand, if the association between the -ray source and the supernova is confirmed, this would be the first time to detect high-energy -ray emission from a supernova, suggesting very fast particle acceleration by supernova explosions.
1 Introduction
Observations of -ray emission from supernova remnants (SNRs) prove that they are high-energy cosmic ray accelerators (Aharonian et al., 2004; Ackermann et al., 2013). Particle acceleration typically occurs in a very long timescale, e.g., hundreds to thousands of years, after the supernova explosion. This picture was consistent with the non-detection of -ray emission from the most nearby supernova, 1987A (Sood et al., 1988; Yoshii et al., 1996; Enomoto et al., 2003). It has been expected that fast particle acceleration might occur soon after supernova explosion if there were interactions between the ejecta and pre-existing dense material (Murase et al., 2011) or there was a young, powerful pulsar wind nebula (Murase et al., 2015). However, previous searches for -ray emission from supernovae located in dense circumstellar medium (Ackermann et al., 2015a) or from super-luminous supernovae (Renault-Tinacci et al., 2017) with the Fermi Large Area Telescope (Fermi-LAT; Atwood et al., 2009) have not led to a positive detection.
A very peculiar supernova, iPTF14hls, was discovered by the Intermediate Palomar Transient Factory on 2014 September 22.53 UT (Arcavi et al., 2017). This event has the identical spectra compared with a typical hydrogen-rich core-collapse supernova, but shows a very different light curve. The optical emission from iPTF14hls remains bright up to 600 days after the first detection, and experiences at least five rebrightenings in two years. What is even more surprising is that there was possibly an eruption years ago in 1954 at the same position of iPTF14hls. This event challenges the traditional understanding of the explosions of massive stars at the end of their lives (Woosley, 2017).
Multi-wavelength observations are particularly important for understanding the nature of such a peculiar event. The observation in the X-ray band by Swift/XRT on 2015 May 23.05, which was about 244 days after the discovery, showed no detection of the source and gave an upper limit of luminosity of erg s-1 in the keV band assuming a photon index of and a neutral hydrogen column density of cm-2 (Arcavi et al., 2017). In 2015 May and 2016 June, the source was observed by the Arcminute Microkelvin Imager Large Array and the Very Large Array in the radio bands, resulting in no detection in all those observations (Arcavi et al., 2017). These observations show evidence against interaction between the supernova ejecta and pre-existing material. However, a late time observation after years of the explosion revealed strong interaction between the shock and the circumstellar material (Andrews & Smith, 2017).
Here we report the search for potential emission from iPTF14hls in the -ray band, using the data of the Fermi-LAT. We find a variable -ray source which is potentially coincident with iPTF14hls. This could be the first time to detect high-energy -ray emission from a supernova, if the association is true. However, the interpretation of the -ray emission seems to be difficult under the traditional scenario of supernova explosion, given the constraints from the X-ray and radio observations. On the other hand, we find a quasar within the error circle of the Fermi-LAT source, which is potentially a blazar candidate according to the infrared color diagram. No radio counterpart is found for this quasar, making its association with the -ray source still uncertain. More observations are necessary to firmly address the association of the -ray source with either the supernova or the blazar candidate (e.g., follow-up multi-wavelength monitorings of the candidate blazar and continuous Fermi-LAT observations of the -ray source).
2 Fermi-LAT observations
We use Fermi-LAT data recorded from 2008 August 4 to 2017 November 16, restricted to the Pass 8 Source class (evclass & evtype ). We select the data in a box region centered at the target source iPTF14hls with energies between 200 MeV111The 200 MeV lower threshold enables us to have a better angular resolution of selected events. Furthermore, as can be seen below, the -ray spectrum of this source is relatively hard, and there is not much emission at low energies. We have tested that choosing a 100 MeV threshold gives similar results. and 500 GeV. The events with zenith angles are excluded to reduce the contamination from the Earth Limb. We use the Fermi-LAT Science Tools v10r0p5222http://fermi.gsfc.nasa.gov/ssc/data/analysis/software/ and the standard binned likelihood analysis method gtlike to analyze the data. The sources in the third Fermi-LAT catalog (3FGL; Acero et al., 2015), together with the diffuse Galactic and isotropic backgrounds333http://fermi.gsfc.nasa.gov/ssc/data/access/lat/BackgroundModels.html gll_iem_v06.fits and iso_P8R2_SOURCE_V6_v06.txt, are included in the model. An additional field source at position has also been added, according to the residual map of the fitting.
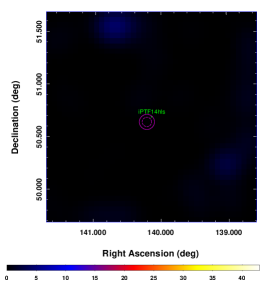
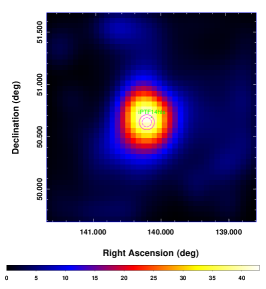
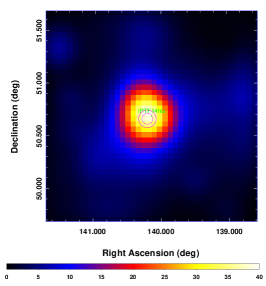
We divide the data into two parts, before and after the explosion date of iPTF14hls, and perform the likelihood analysis, respectively. For the years of data before 2014 September 22, we find no significant emission at the position of iPTF14hls. The Test Statistic (TS) map for a region centered at iPTF14hls is shown in the left panel of Fig. 1. For the data after the supernova explosion, a clear -ray source appears in the data, as can be seen in the middle panel of Fig. 1 for the TS map assuming the same model as that used in the left one. Assuming a power-law point source right at the location of iPTF14hls, we find a TS value of , and a spectral index of . The best-fit position of the source using gtfindsrc turns out to be , with a 68% (95%) error circle of (). The distance between iPTF14hls and the best-fit position of the -ray source is about . Therefore iPTF14hls is positionally consistent with the Fermi-LAT variable source at the 95% confidence level. We also perform an analysis of the data from 2015 August 4 to 2017 November 16, i.e., about one year after the explosion date (see below for the light curve analysis), which results in a best-fit position of , and a 68% error circle radius of . The separation between iPTF14hls and the best-fit position is , within the error circle (see the right panel of Fig. 1). In the following analysis, we will present the results based on the past three years of data (from 2014 September 22 to 2017 November 16), unless stated explicitly.
The -ray flux of the source is about cm-2 s-1 between 0.2 and 500 GeV. For a distance of 156 Mpc (Arcavi et al., 2017), it corresponds to a -ray luminosity of erg s-1. This value is comparable with the peak bolometric luminosity of iPTF14hls (Arcavi et al., 2017). Assuming a 3 year emission time, the total energy released in -rays is estimated to be about erg.
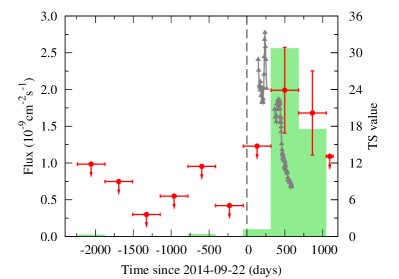
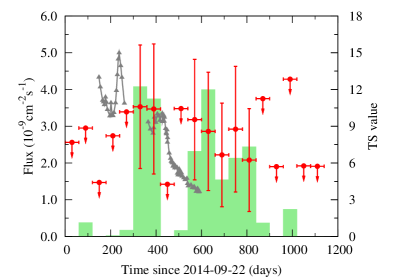
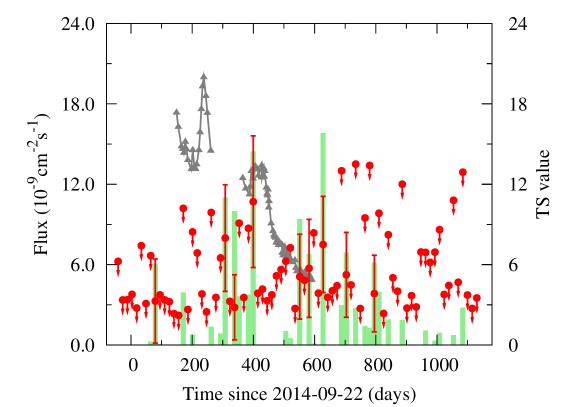
To further address the variabilities of the -ray emission of the source, we derive the light curves of the -ray fluxes between 0.2 and 500 GeV, for 1-year and 2-month bins, which are shown in Fig. 2. For the time bins in which the TS values are smaller than 4, the 95% flux upper limits are given. We find that the source starts to emit -rays about 300 days after the explosion time of iPTF14hls, and the emission lasts for about 850 days. Weak emission may last for even longer time, but the significance becomes too low. We estimate the TS value of variabilities via , where and are the likelihoods in the th time bin for constant and variable flux assumptions (Nolan et al., 2012). The TS value of the variability during the period of 300 and 850 days after the supernova explosion is about 11.4 for the 2-month binning light curve, which roughly corresponds to a significance for 8 more degrees of freedom of the variable hypothesis. The emission is probably variable at even shorter timescales (see Fig. 3 for the light curve for 2-week bins). However, for most bins the TS values are too small to draw a clear conclusion.
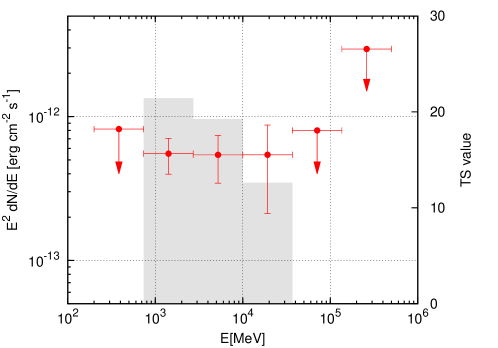
The spectral energy distribution (SED) of the -ray emission for the data after the supernova explosion is presented in Fig. 4. The SED gives a flat spectrum which is consistent with that obtained in the global fit.
3 Discussion
3.1 SDSS J092054.04+504251.5
A quasi-stellar object, SDSS J092054.04+504251.5, is found to be close to the -ray source, with an angular separation of from the best-fit position. The optical spectroscopy of SDSS J092054.04+504251.5 shows strong broad emission lines, suggesting that it is a quasar. This source is found to lie in the the so-called “WISE blazar stripe” in the color - color diagram of the WISE infrared data, and is thus a candidate blazar which is likely to be a -ray emitter (Massaro et al., 2012). If the -ray source found in this work is coincident with this quasar, its luminosity is estimated to be erg s-1 adopting a redshift of . The -ray luminosity and spectral index are consistent with, although lie in the edge of, that of Fermi-LAT flat-spectrum radio quasars (Ackermann et al., 2015b). However, blazars are typically radio loud. We have searched for possible radio emission from FIRST and NVSS, and do not find any counterpart of SDSS J092054.04+504251.5. This may be due to that this quasar is too distant and the radio surveys are not deep enough to reveal it. We also search for a possible radio counterpart of the -ray source, and do not find any source within its 95% error circle. The optical monitorings of SDSS J092054.04+504251.5 by the Intermediate Palomar Transient Factory gives an average -band magnitude of 20.44 and a standard deviation of 0.15 between March 2009 and Januray 2015, which shows no significant variability. The data after 2015 are unavailable yet, which makes the comparison between optical and -ray variabilities impossible. In any case, we need more observations of SDSS J092054.04+504251.5 and/or the -ray source to establish their possible connection. Currently it is unclear whether they are associated with each other, and the association of the new -ray variable source with iPTF14hls is possible.
3.2 Chance coincidence with a background -ray source
We assume that the surface density distribution of Fermi-LAT sources is uniform, and the probability of observing a source in a particular position has a Poisson distribution. Then the probability to have an unrelated source “associated” with iPTF14hls is expected to be
| (1) |
where is the surface density of Fermi-LAT sources with fluxes higher than , is an effective radius which takes into account the position uncertainties of the presumed Fermi-LAT counterpart () and the target source iPTF14hls (), as well as the angular distance between them, (Bloom et al., 2002). For our case, iPTF14hls is well located in the optical band, and thus can be neglected. The effective radius is then .
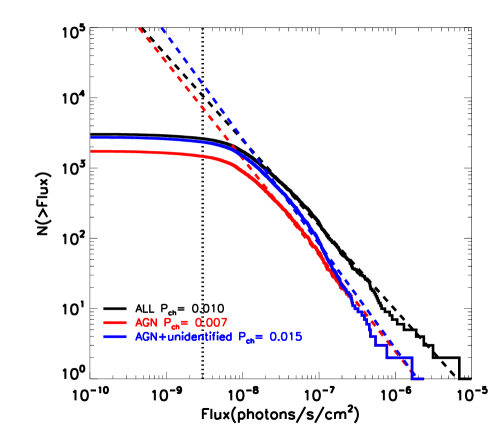
The cumulative numbers of the 3FGL sources as functions of fluxes are presented in Fig. 5. In order to avoid the detection limits, we extrapolate the behaviors for fluxes between and photon cm-2 s-1 to the average flux of the putative iPTF14hls counterpart converted to the energy range of GeV, photon cm-2 s-1. The estimated number of -ray AGNs is 7164, corresponding to a number density of 0.17 degree-2. For and , the chance coincidence probability is estimated to be 0.007. We also consider the distributions for AGNs plus unidentified sources and all the 3FGL sources, and get chance coincidence probabilities 0.015 and 0.010, respectively. Note that the temporal coincidence of the Fermi-LAT variable source with a background source may further decrease the chance coincidence probability by a factor of several (it is roughly the ratio of the whole Fermi-LAT observational time to the time period after the supernova explosion).
3.3 Physical implications of the association with iPTF14hls
Assuming that the Fermi-LAT source is associated with the supernova, we discuss possible physical implications of the -ray emission. The ejected mass by the supernova iPTF14hls was estimated to be several tens of solar masses, which corresponds to a total kinetic energy of
| (2) |
where is the ejected mass, and is the velocity of the ejecta (Arcavi et al., 2017). The corresponding gas density of the ejecta is estimated as , where is the proton mass, cm is the radius and is the width of the ejecta. Since , we have cm-3. The optical emission of iPTF14hls can be fitted with a diluted blackbody with a temperature of K, with a dilution factor varying from at days and at days (inferred from Fig. 4 of Arcavi et al. 2017).
The GeV emission has a total energy of erg. We first assume that this emission is from the inverse Compton scattering (ICS)444The bremsstrahlung emission could be less dominated. The cooling rate due to ICS is about GeV cm-3 with being the energy density of photon field, and that due to bremsstrahlung radiation in neutral gas is about GeV cm-3 . For yr, the energy density of the photon field is about eV cm-3, and the gas density is about cm-3. For a few GeV, ICS cooling is dominant. off the optical photons by energetic electrons accelerated in a certain site. To boost the optical photons to GeV energies, the Lorentz factors of electrons are required to be . The energy spectrum of electrons to produce a -ray spectrum is in the slow cooling regime, whose total power is dominated by low energy particles. Therefore the energy fraction of high-energy electrons giving rise to the GeV emission should be very low (e.g., for GeV compared with that for MeV). In case that there is a break of the energy spectrum of accelerated electrons below a few GeV like it is the case in the Milky Way (Strong et al., 2011), this fraction could be higher. Furthermore, we need a high enough acceleration efficiency to convert the kinetic energy to relativistic electrons. For typical supernovae observed in the Milky Way, the efficiency of electron acceleration is very low (; Yang et al. 2014). The efficiency for the case of -ray bursts could be higher. However, we should keep in mind that there was no significant decrease of the expansion velocity of iPTF14hls (Arcavi et al., 2017), which limits the conversion fraction from the kinetic energy to the accelerated particles. Note that here we do not involve jets. If the -ray emission is collimated in a solid angle, the inferred total energy of -rays could be smaller and the required acceleration efficiency could be less extreme.
Another scenario to produce -rays is the decay of neutral pions produced by the hadronic collision. To produce the -ray spectrum, the proton spectrum needs to be . The energy conversion efficiency of protons to -rays depends on the density of target material. The interaction timescale of protons in the hydrogen gas can be written as
| (3) |
Here mb is the total interaction cross section of collision for center-of-mass energy of tens of GeV (Patrignani & et al., 2016). For a gas density higher than cm-3 as estimated above, the protons can effectively convert their energy to -rays, with an efficiency of , the fraction of the neutral pion component. In such a case, the total energy of protons needs to be erg in order to give the observed GeV -ray energy (considering also that the energy band of the actual -ray emission may be wider than the Fermi-LAT coverage). In this case we may need a very high conversion efficiency of the supernova kinetic energy to the accelerated particle energy. Note that the energy conversion efficiencies obtained from observations of supernova remnants in the Milky Way are estimated to be about (Acero et al., 2010; Xin et al., 2017). The late time spectroscopic observations by Andrews & Smith (2017) did find evidence of interactions between the supernova shock and the circumstellar medium, which supports the scenario of -ray production in collisions. However, the lack of X-ray and radio emission as well as significant deceleration of the ejecta at early time constrain the possible strong interactions (Arcavi et al., 2017). Furthermore, even if there were interactions between the supernova ejecta and the pre-existing dense material, the offset between the -ray light curve and the optical one is still a challenge. We leave detailed modeling of this interaction scenario to future works.
In both cases discussed above, it could be very difficult for particles to get accelerated in such a high-density environment without thermalization. This could be a challenge of the modeling of the -ray emission from the supernova. In addition, for such a dense environment, the pair production optical depth of -ray photons with gas is
| (4) |
where mb is the pair production cross section for GeV photons (Wang et al., 2010). The GeV emission, if generated inside the ejected shell, may be subject to pair production absorbsion by the material, in particular at early time. This may explain why the -ray emission appears days after the explosion. Here we ignore the Thomson scattering, because the shell is expected to be optically thin and the radiation field is not sufficient to ionize the gas (Arcavi et al., 2017).
4 Conclusion
In this work we report the detection of a variable -ray source which is potentially coincident with the supernova iPTF14hls, using the Fermi-LAT data. The -ray source appears days after the explosion of iPTF14hls, and is still observable up to days. The search for -ray emission from 2008 August 4 to 2015 September 22 result in no detectable emission from this direction. The spectrum of the source is between 0.2 and 500 GeV, and the luminosity is erg s-1. The isotropic energy of the -ray emission is about erg.
There is a quasar, SDSS J092054.04+504251.5, in the error circle of the Fermi-LAT source, which is a blazar candidate according to the infrared color diagram of WISE. However, no radio counterpart is found from radio surveys FIRST and NVSS. The lack of multi-wavelength observations of SDSS J092054.04+504251.5 makes it difficult to conclusively address its connection with the -ray variable source. We also estimate the probability of chance coincidence of the -ray source with a background source based on the 3FGL catalog, and results in a low probability of .
If the association between the -ray source and iPTF14hls is real, there are difficulties to model its -ray emission in the framework of particle acceleration in supernova ejecta produced shocks. The acceleration efficiency and the energy conversion efficiency of the accelerated particles to GeV -ray emission need to be high. Furthermore, the acceleration of particles in the dense environment of the ejecta is also a big challenge. Anisotropic emission from e.g., a jet, may be necessary to explain the data (Soker & Gilkis, 2017).
References
- Acero et al. (2010) Acero, F., Aharonian, F., Akhperjanian, A. G., et al. 2010, A&A, 516, A62
- Acero et al. (2015) Acero, F., Ackermann, M., Ajello, M., et al. 2015, ApJS, 218, 23
- Ackermann et al. (2013) Ackermann, M., Ajello, M., Allafort, A., et al. 2013, Science, 339, 807
- Ackermann et al. (2015a) Ackermann, M., Arcavi, I., Baldini, L., et al. 2015a, ApJ, 807, 169
- Ackermann et al. (2015b) Ackermann, M., Ajello, M., Atwood, W. B., et al. 2015b, ApJ, 810, 14
- Aharonian et al. (2004) Aharonian, F. A., Akhperjanian, A. G., Aye, K., et al. 2004, Nature, 432, 75
- Andrews & Smith (2017) Andrews, J. E., & Smith, N. 2017, ArXiv e-prints, arXiv:1712.00514
- Arcavi et al. (2017) Arcavi, I., Howell, D. A., Kasen, D., et al. 2017, Nature, 551, 210
- Atwood et al. (2009) Atwood, W. B., Abdo, A. A., Ackermann, M., et al. 2009, ApJ, 697, 1071
- Bloom et al. (2002) Bloom, J. S., Kulkarni, S. R., & Djorgovski, S. G. 2002, AJ, 123, 1111
- Enomoto et al. (2003) Enomoto, R., Ksenofontov, L. T., Katagiri, H., et al. 2003, ApJ, 591, L25
- Massaro et al. (2012) Massaro, F., D’Abrusco, R., Tosti, G., et al. 2012, ApJ, 752, 61
- Murase et al. (2015) Murase, K., Kashiyama, K., Kiuchi, K., & Bartos, I. 2015, ApJ, 805, 82
- Murase et al. (2011) Murase, K., Thompson, T. A., Lacki, B. C., & Beacom, J. F. 2011, Phys. Rev. D, 84, 043003
- Nolan et al. (2012) Nolan, P. L., Abdo, A. A., Ackermann, M., et al. 2012, ApJS, 199, 31
- Patrignani & et al. (2016) Patrignani, C., & et al. 2016, Chinese Physics C, 40, 100001
- Renault-Tinacci et al. (2017) Renault-Tinacci, N., Kotera, K., Neronov, A., & Ando, S. 2017, ArXiv e-prints, arXiv:1708.08971
- Soker & Gilkis (2017) Soker, N., & Gilkis, A. 2017, ArXiv e-prints, arXiv:1711.05180
- Sood et al. (1988) Sood, R. K., Thomas, J. A., Waldron, L., et al. 1988, MNRAS, 234, 73P
- Strong et al. (2011) Strong, A. W., Orlando, E., & Jaffe, T. R. 2011, A&A, 534, A54
- Wang et al. (2010) Wang, B., Yuan, Q., Fan, C., et al. 2010, Science China Physics, Mechanics, and Astronomy, 53, 842
- Woosley (2017) Woosley, S. 2017, Nature, 551, 173
- Xin et al. (2017) Xin, Y.-L., Guo, X.-L., Liao, N.-H., et al. 2017, ApJ, 843, 90
- Yang et al. (2014) Yang, R.-z., Zhang, X., Yuan, Q., & Liu, S. 2014, A&A, 567, A23
- Yoshii et al. (1996) Yoshii, H., Baba, T., Kaneko, T., et al. 1996, ApJ, 472, 800