Representation and Reinforcement Learning for Personalized Glycemic Control in Septic Patients
Abstract
Glycemic control is essential for critical care. However, it is a challenging task because there has been no study on personalized optimal strategies for glycemic control. This work aims to learn personalized optimal glycemic trajectories for severely ill septic patients by learning data-driven policies to identify optimal targeted blood glucose levels as a reference for clinicians. We encoded patient states using a sparse autoencoder and adopted a reinforcement learning paradigm using policy iteration to learn the optimal policy from data. We also estimated the expected return following the policy learned from the recorded glycemic trajectories, which yielded a function indicating the relationship between real blood glucose values and 90-day mortality rates. This suggests that the learned optimal policy could reduce the patients’ estimated 90-day mortality rate by 6.3%, from 31% to 24.7%. The result demonstrates that reinforcement learning with appropriate patient state encoding can potentially provide optimal glycemic trajectories and allow clinicians to design a personalized strategy for glycemic control in septic patients.
1 Introduction
Many critically ill patients have poor glycemic control, such as dysglycemia and high glycemic variability. Several studies have investigated the correlation between the management of blood glucose levels and outcomes in critical care patients (Inzucchi, 2006; Chase et al., 2008; Van den Berghe et al., 2001; The NICE-SUGAR Study Investigators, 2009). Current clinical practice follows the guidelines suggested by the NICE-SUGAR trial for patients in critical care, which targets a blood glucose level of 100-180 mg/dl (The NICE-SUGAR Study Investigators, 2009). However, there are significant variations in clinical conditions and physiological states among patients under critical care, including disease severity, comorbidity, and other factors that may limit clinicians’ ability to perform appropriate glycemic control. In addition, clinicians sometimes may not focus on the issue of glycemic control during patients’ intensive care unit (ICU) stays. To help clinicians better address the challenge of managing patients’ glucose levels, we need a personalized glycemic control strategy that can take into account variations in patients’ physiological and pathological states, such as their degree of insulin dependence and tolerance.
Our goal of decision support for glycemic control is to target specific ranges of serum glucose that optimize outcomes for patients. These target ranges vary based on patients’ specific circumstances, and we hypothesize that the patient states, glycemic values, and patient outcomes can be modeled by a Markov decision process (MDP) whose parameters and optimal policies can be learned from data gathered from previous cases. In our approach, we do not try to recommend specific interventions such as insulin oral hypoglycemic agent administration to achieve the target goals, but focus on finding the optimal targets. Thus the “action” in our formulation is interpreted as choosing the best glycemic target under the circumstances, leaving the choice of agents and doses to achieve that target to the clinicians. This simplification avoids the need to model the variability of patients’ glycemic responses to actual insulin doses and avoids data problems with incorrectly recorded dose timing.
In this study, we proposed and explored the reinforcement learning (RL) paradigm to learn the policy for choosing personalized optimal glycemic trajectories using retrospective data. We then compared the prognosis of the trajectories simulated by following the optimal policy to the real trajectories.
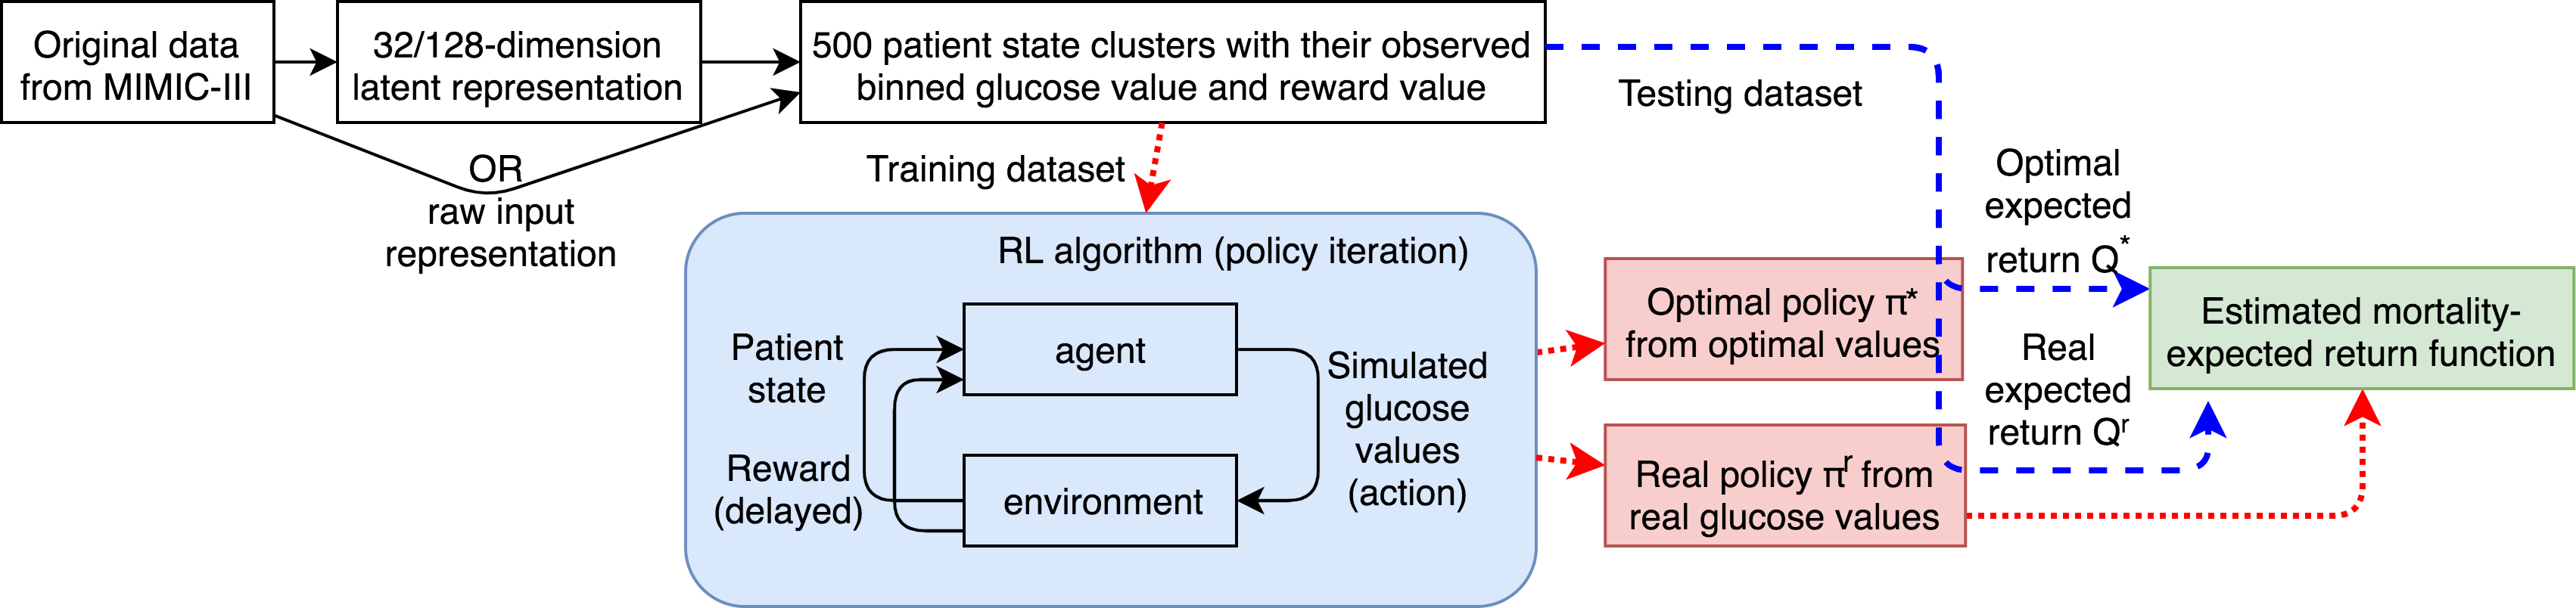
The study overview is shown in Figure 1. We used both direct raw features and features encoded by a sparse autoencoder to represent patient states, followed by state clustering (Ng, 2011). Policy iteration was adopted to learn the optimal policy for optimal glycemic trajectories (Howard, 1960). We also estimated the policy from the real trajectories and obtained the estimated mortality–expected return function. We then computed the optimal expected return using optimal policy , and used the function to calculate and compare the estimated mortality rate between the simulated optimal glycemic trajectories and the trajectories in the real data (Komorowski et al., 2016).
The key contributions of this work include: (a) we explored the effectiveness and validity of using RL and appropriate representations for learning the policy for optimal glycemic trajectories in different clinical and physiological states, (b) we applied the method to glycemic control for critical septic patients, and compared the RL policy-simulated results with real data. Our proposed approach may enable wider applications in personalized clinical decision making.
2 Related work
RL is a potential approach for sequential decision making with delayed reward or outcome (Nemati et al., 2016). RL also has the ability to generate optimal strategies based on non-optimized training data (Raghu et al., 2017). Shortreed et al. (2010) investigated the performance of the RL-learned optimal policy for treatment of schizophrenia. In Nemati et al. (2016), RL is applied to the heparin dosing problem in critical care using partially observed Markov decision process (POMDP). They used a discriminative hidden Markov model (DHMM) to estimate the patient states. Prasad et al. (2017) experimented on using off-policy learning to find the policy for mechanical ventilation administration and weaning. Komorowski et al. (2016) and Raghu et al. (2017) demonstrated that optimal strategy of sepsis treatment can be learned by RL algorithms. Komorowski et al. (2016) applied on-policy learning and evaluated the performance difference between RL agent’s actions and physicians’ decisions using Q-values. Raghu et al. (2017) worked on the same clinical problem but introduced a continuous state representation and a deep learning approach with doubly robust off-policy evaluation (Jiang and Li, 2015). Related to glycemic control, some studies utilize RL to design clinical trials and adjust clinical treatments (Asoh et al., 2013; Bothe et al., 2014).
These previous studies focused on giving direct suggestions for clinical intervention and treatment. To our knowledge, no studies have yet utilized the RL approach to learn better target laboratory values as references for clinical decision making, such as learning a policy to find personalized optimal glycemic targets for different patient states.
3 Method
Patient State Representation and Clustering
Learning a good patient state representation is important to enable RL algorithms to learn appropriate policies. We experimented with two types of feature representations: raw interpretable clinical features and the feature representation generated by a sparse autoencoder (Ng, 2011). We designed the neural network model with one encoder and decoder, and extracted the latent representation as 32-dimensional states. The weights of the sparse autoencoder were computed by backpropagation to minimize the following loss function: , where is the reconstruction loss of the autoencoder, is the sparsity distance, is the latent representation, is the dimension of the latent representation, and is a hyperparameter for sparsity. After we generated the state representation, we used the k-means clustering algorithm to categorize millions of patient states into 500 clusters such that similar clinical states can collapse into the same cluster.
Reinforcement Learning and Evaluation
The policy iteration algorithm uses dynamic programming and follows the Bellman expectation equation to find the optimal policy through two steps (Howard, 1960; Bellman, 1957), iterative policy evaluation and greedy policy improvement. Given a current policy , reward function , transition function , the current state and the next state after taking action , the threshold for iteration and the discount factor , we iteratively updated state-value functions of all states: . Then we returned once . Next we used the value function to obtain a better policy by greedy policy improvement using the Bellman expectation equation as follows: , and . We used the new policy to update new value functions until converges to the optimal policy . The optimal expected return . The algorithm was adopted to learn the optimal policy , and the real policy from real trajectories, where we limited the action space of each state to only the one with the highest probability in instead of exploring all possible actions. and real mortality rate were used to obtain the estimated mortality–expected return function, which reveals the relationship between expected return and the estimated 90-day mortality rate. We used the function to compute and compare the estimated mortality rate of real and optimal glycemic trajectories obtain by and .
4 Experiments
Dataset and Patient Cohort
We used a large, publicly available ICU database, Medical Information Mart for Intensive Care III (MIMIC-III) version 1.4 (Johnson et al., 2016) for the study. MIMIC-III includes all patients admitted to an ICU at the tertiary medical center, Beth Israel Deaconess Medical Center (BIDMC) in Boston, MA from 2001 to 2012. It contains all ICU administrative data such as service and diagnosis codes, clinical data such as lab and bedside measurements, as well as the death time (in case of mortality) from the social security database.
Sepsis-3 criteria were adopted to identify patients with sepsis (Singer et al., 2016). All patients aged less than 18 years or whose Sequential Organ Failure Assessment (SOFA) score was less than two were excluded from the study cohort. For the subjects with multiple ICU admissions, only the first ICU admission was selected in order to ensure the independence of observations. We specifically separated the patients by correct diabetic status because it is critical to understanding the blood glucose trajectory. We categorized the patients into diabetic and non-diabetic groups according to their (1) ICD-9 coding for diabetes (249.* and 250.*), (2) pre-admission glycated hemoglobin (HbA1c) level with the threshold of 7.0%, (3) admission medications, and (4) the diagnosis of diabetes in the free text medical history. We removed patients with more than 10% missing values of covariates, and the final cohort comprised 5,565 patients. Only arterial and venous glucose measurements were considered due to the issues of accuracy of other measurements (Critchell et al., 2007).
Settings of Reinforcement Learning
To decrease the potential for confounding, we considered the following groups of confounders and encoded them as covariates into the patient states. Patient level variables: age, gender, admitted ICU unit, SOFA and Elixhauser comorbidity index on admission, utilization of mechanical ventilator, endotracheal intubation or vasopressor. Blood glucose related variables: glycated hemoglobin (HbA1c) higher or less than 7 before admission, hyperglycemia and hypoglycemia events occurred, the first glucose level after admission, and the diabetic status of the patient. Periodic vital signs, such as systolic and diastolic blood pressure, respiratory rate, temperature, heart rate, and SpO2 and Glasgow coma scale (eyes, verbal, motor), as well as laboratory values, such as arterial blood gas (PO2, PCO2, pH value, total CO2, anion gap), albumin, bicarbonate, calcium, sodium, potassium, chloride, lactate, creatinine, blood urea nitrogen (BUN), partial thromboplastin time (PTT), international normalized ratio (INR), CO2, total bilirubin, hemoglobin, hematocrit and white blood cell count. Data were collected at one hour intervals. We imputed missing values by linear interpolation of the existing values, and used piecewise constant interpolation if the first or last observation is missing. All variables were normalized into a zero to one scale for the state encoding.
We used the outcome of interest, 90-day mortality status, as the reward since patients’ survival is clinicians’ major goal for critical care. A numeric value of +100 was assigned to the end state for patients who survived 90 days after their admission, and -100 as a penalty for those who were deceased before 90 days after their admission. The actions were defined by the discretized blood glucose levels, which were calculated from categorizing continuous glucose levels into 11 bins.
Results
In Figure 2, the expected return, which is the rescaled learned by the optimal policy , is negatively correlated with mortality rate with high correlation. This indicates that the learned expected return reflects the real patient status well. We computed the empirically estimated mortality rate of the real glycemic trajectory using the mortality–expected return function acquired from raw and encoded patient state representations. The average expected 90-day mortality rate of the testing dataset is 31.00% using the raw feature representation, and 31.08% using the sparse autoencoder latent representation. Both are close to the mortality rate calculated from the real data (31.17%).
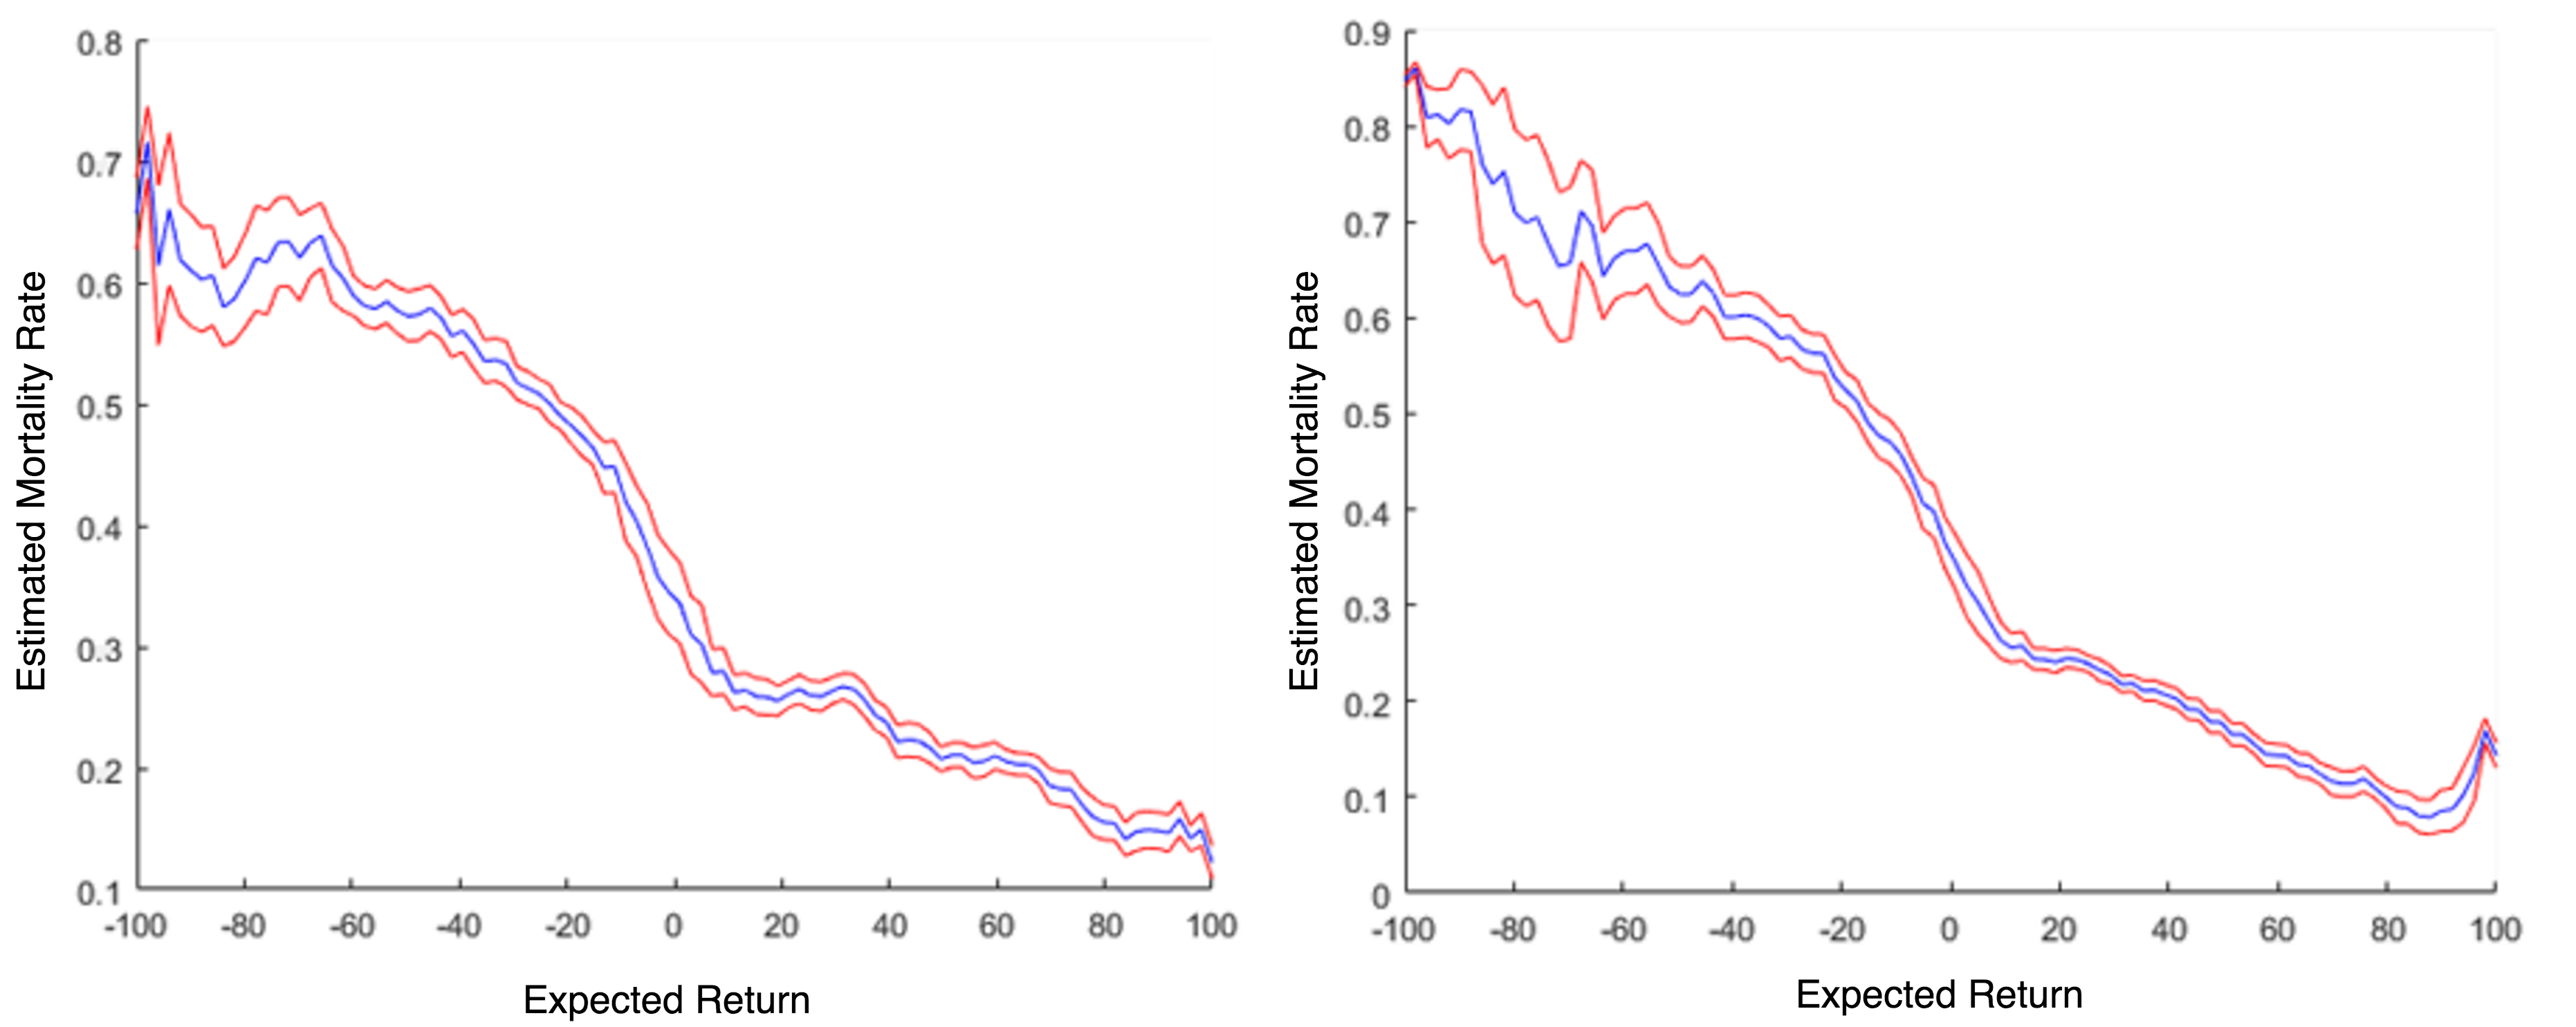
Using the raw features to learn policy from the real glycemic trajectory, the mean expected return was 10.04, which was consistent with an estimated mortality rate of 31.00%. The optimal policy-simulated glycemic trajectories had a mean expected return of 36.42, which corresponded to an estimated mortality rate of 27.29%. Using the latent representations learned by the sparse autoencoder further reduced the estimated mortality rate to 24.75%. The best optimal policy can potentially reduce the estimated mortality rate by 6.3% if we choose the appropriate representations (Table 1).
| Real policy | Optimal policy | |||
|---|---|---|---|---|
| Representation | Expected return | Estimated mortality | Expected return | Estimated mortality |
| Raw features | 10.04 | 31.00% | 36.42 | 27.29% |
| Sparse autoencoder | 8.75 | 31.08% | 32.49 | 24.75% |
5 Conclusions and Future Works
We utilized the RL algorithm with representation learning to learn the personalized optimal policy for better predicting glycemic targets from retrospective data. As decision support, this may reduce the mortality rate of septic patients if clinician-chosen dosages can actually achieve the target glucose levels chosen by the policy, and thus potentially assist clinicians to optimize the real-time treatment strategy by providing more accurate treatment goals. Future works include applying a continuous state space approach, different evaluation methods such as doubly robust evaluation, as well as applying the method to different clinical decision making problems.
References
- Asoh et al. (2013) H. Asoh, M. Shiro, S. Akaho, T. Kamishima, K. Hasida, E. Aramaki, and T. Kohro. An application of inverse reinforcement learning to medical records of diabetes treatment. ECMLPKDD2013 Workshop on Reinforcement Learning with Generalized Feedback, 2013.
- Bellman (1957) R. Bellman. Dynamic Programming. Princeton University Press, Princeton, NJ, 1957.
- Bothe et al. (2014) M. K. Bothe, L. Dickens, K. Reichel, A. Tellmann, B. Ellger, M. Westphal, and A. A. Faisal. The use of reinforcement learning algorithms to meet the challenges of an artificial pancreas. Expert Review of Medical Devices, 10(5):661–673, 2014.
- Chase et al. (2008) J. G. Chase, G. Shaw, A. Le Compte, T. Lonergan, M. Willacy, X.-W. Wong, J. Lin, T. Lotz, D. Lee, and C. Hann. Implementation and evaluation of the SPRINT protocol for tight glycaemic control in critically ill patients: a clinical practice change. Critical Care, 12(2):R49, 2008.
- Critchell et al. (2007) C. D. Critchell, V. Savarese, A. Callahan, C. Aboud, S. Jabbour, and P. Marik. Accuracy of bedside capillary blood glucose measurements in critically ill patients. Intensive care medicine, 33(12):2079–2084, 2007.
- Howard (1960) R. A. Howard. Dynamic Programming and Markov Processes. MIT Press, Cambridge, MA, 1960.
- Inzucchi (2006) S. E. Inzucchi. Management of hyperglycemia in the hospital setting. New England Journal of Medicine, 355(18):1903–1911, 2006.
- Jiang and Li (2015) N. Jiang and L. Li. Doubly robust off-policy evaluation for reinforcement learning. arXiv preprint arXiv:1511.03722, 2015.
- Johnson et al. (2016) A. E. Johnson, T. J. Pollard, L. Shen, L.-w. H. Lehman, M. Feng, M. Ghassemi, B. Moody, P. Szolovits, L. A. Celi, and R. G. Mark. MIMIC-III, a freely accessible critical care database. Scientific Data, 3:160035, 2016.
- Komorowski et al. (2016) M. Komorowski, A. Gordon, L. A. Celi, and A. Faisal. A markov decision process to suggest optimal treatment of severe infections in intensive care. Neural Information Processing Systems Workshop on Machine Learning for Health, 2016.
- Nemati et al. (2016) S. Nemati, M. M. Ghassemi, and G. D. Clifford. Optimal medication dosing from suboptimal clinical examples: A deep reinforcement learning approach. Conference proceedings: Annual International Conference of the IEEE Engineering in Medicine and Biology Society. IEEE Engineering in Medicine and Biology Society. Annual Conference, pages 2978–2981, 2016.
- Ng (2011) A. Y. Ng. Sparse autoencoder. 2011. URL {https://web.stanford.edu/class/archive/cs/cs294a/cs294a.1104/sparseAutoencoder.pdf}.
- Prasad et al. (2017) N. Prasad, L.-F. Cheng, C. Chivers, M. Draugelis, and B. E. Engelhardt. A reinforcement learning approach to weaning of mechanical ventilation in intensive care units. arXiv preprint arXiv:1704.06300v1, 2017.
- Raghu et al. (2017) A. Raghu, M. Komorowski, L. A. Celi, P. Szolovits, and M. Ghassemi. Continuous state-space models for optimal sepsis treatment - a deep reinforcement learning approach. arXiv preprint arXiv:1705.08422, 2017.
- Shortreed et al. (2010) S. M. Shortreed, E. Laber, D. J. Lizotte, T. S. Stroup, J. Pineau, and S. A. Murphy. Informing sequential clinical decision-making through reinforcement learning: an empirical study. Machine Learning, 84(1-2):109–136, 2010.
- Singer et al. (2016) M. Singer, C. S. Deutschman, C. W. Seymour, M. Shankar-Hari, D. Annane, M. Bauer, and et al. The third international consensus definitions for sepsis and septic shock (sepsis-3). JAMA, 315(8):801–810, 2016.
- The NICE-SUGAR Study Investigators (2009) The NICE-SUGAR Study Investigators. Intensive versus conventional glucose control in critically ill patients. New England Journal of Medicine, 360(13):1283–1297, 2009.
- Van den Berghe et al. (2001) G. Van den Berghe, P. Wouters, F. Weekers, C. Verwaest, F. Bruyninckx, M. Schetz, D. Vlasselaers, P. Ferdinande, P. Lauwers, and R. Bouillon. Intensive insulin therapy in critically ill patients. New England Journal of Medicine, 345(19):1359–1367, 2001.